Article

Determining the Location of Co2+ in Zeolites by UV-Vis Diffuse Reflection Spectroscopy: A Critical View

by
Andrea Bellmann
1,2,
Christine Rautenberg
1,
Ursula Bentrup
1,* and
Angelika Brückner
1,*
1
Leibniz-Institut für Katalyse e.V. (LIKAT) Albert-Einstein-Str. 29a, 18059 Rostock, Germany
2
Trinseo Deutschland GmbH, Street E17, 06258 Schkopau, Germany
*
Authors to whom correspondence should be addressed.
Catalysts 2020, 10(1), 123; https://doi.org/10.3390/catal10010123
Submission received: 10 December 2019 / Revised: 8 January 2020 / Accepted: 10 January 2020 / Published: 15 January 2020

Abstract

:
UV–Vis spectroscopy as well as in situ FTIR spectroscopy of pyridine and CO adsorption were applied to determine the nature of Co species in microporous, mesoporous, and mixed oxide materials like Co–ZSM-5, Co/Na–ZSM-5, Co/Al–SBA-15, and Co/Al2O3–SiO2. Because all sample types show comparable UV–Vis spectra with a characteristic band triplet, the former described UV–Vis band deconvolution method for determination and quantification of individual cationic sites in the zeolite appears doubtful. This is also confirmed by results of pyridine and CO adsorption revealing that all Co–zeolite samples contain two types of Co2+ species located at exchange positions as well as in oxide-like clusters independent of the Co content, while in Co/Al–SBA-15 and Co/Al2O3–SiO2 only Co2+ species in oxide-like clusters occur. Consequently, the measured UV–Vis spectra represent not exclusively isolated Co2+ species, and the characteristic triplet band is not only related to γ-, β-, and α-type Co2+ sites in the zeolite but also to those dispersed on the surface of different oxide supports. The study demonstrates that for proper characterization of the formed Co species, the use of complementary methods is required.

1. Introduction

Cobalt zeolites are important catalysts for the selective catalytic reduction (SCR) of nitrogen oxides by hydrocarbons, especially by methane [1,2,3,4,5,6,7,8,9,10,11,12,13,14]. It is widely accepted that depending on the used zeolite, its Si/Al ratio, Co content, and preparation method, different Co species are formed comprising: (i) Co2+ cations located in the zeolite channels, (ii) CoOx microaggregates, and (iii) CoO, Co3O4, as well as Co silicate mainly in the case of over-exchanged zeolites. The specific role of these species in the SCR reaction is contrarily discussed.
As Co ions are most stable in the form of Co2+, two [AlO4] sites are needed to stabilize the charge. Thus, only Al–O–(Si–O)2–Al units occurring in close proximity in the zeolite rings are able to charge balance divalent cations, while single Al atoms can only balance monovalent ions [15]. Therefore, the concentration and location of incorporated Co species are controlled by the distribution of Al atoms in the zeolite framework. Reversely, the zeolite exchange capacity for Co2+ can be used to probe the Al distribution in the zeolite framework [16]. Assuming a fully exchanged zeolite, the quantification of the rings containing two Al atoms in the same channel is possible. The preparation conditions to guarantee a complete exchange were described in this reference. Thus, in the group of Wichterlová [17,18,19,20], a procedure was developed enabling the discrimination between those sites using UV–Vis diffuse reflection spectroscopy (UV–Vis–DRS). It was assumed that the d–d transition bands of bare Co2+ ions in the visible region of the respective dehydrated zeolites were characteristic for the individual cationic sites. Thus, the observed bands around 21,000 cm−1 (475 nm), 17,250 cm−1 (580 nm), and 16,000 cm−1 (625 nm) were assigned to the γ-, β-, and α-type sites, respectively. By analyzing the deconvoluted UV–Vis–DR spectra, the percentages of the respective sites occupied by Co2+ were determined. This approach was applied for Co–mordenite [17], Co–ferrierite [18], Co–ZSM-5 [19], and Co–beta [20]. The fundamental requirement for using this method is that all Co, represented by these UV–Vis bands, is present in form of isolated Co2+ and that these sites are created by wet ion exchange at a pH of 5.5 according a selected procedure [15,16].
The work of the Wichterlová group is highly recognized in the scientific community, and the developed approach to probe the Al distribution in the zeolite framework was also applied by other groups [21,22]. However, there are some doubts related to the nature of the Co sites created by ionic exchange and the assignment of the observed band triplet in the UV–Vis–DR spectra. Thus, Campa et al. [10] and Gil et al. [23,24] demonstrated that the formation of Co oxidic clusters is possible even if the formal Co/Al ratio is smaller than 0.5. This is due to the hydrolysis of the [Co(H2O)6]2+ and [Co(OH)]+ complexes, which proceeds easily. Hence, intermediates like [Co–OH–Co]3+ (by olation) and [Co–O–Co]2+ (by oxolation) can be formed which are subsequently converted into oxidic clusters during the calcination process.
On the other hand, in papers of the Busca group, [11,25,26] besides comprehensive spectroscopic characterization of Co-exchanged zeolites, UV–Vis–DR spectra of Co/SiO2–Al2O3 samples, having an open pore structure, are also reported for comparison. These spectra were found to be very similar to those measured on Co–MFI and Co–Fer zeolites showing a triplet of band in the region 22,000–14,000 cm−1 too. Furthermore, as deduced from additional infrared spectroscopic studies, the presence of Co species located at the external surface of the zeolite has to be considered besides those located at exchange positions within the zeolite framework. As a consequence, both internal as well as external Co2+ species contribute to the UV–Vis spectrum and cannot be distinguished from each other. Therefore, it was stated that the assignment of the observed bands, being very similar for Co-exchanged MOR, FER, and MFI zeolites, to three different types of sites (α, β, γ) located in the internal cavities only is quite unreliable [26].
Inspired by these controversial statements concerning the use of UV–Vis–DRS for determining nature and distribution of Co2+ species in Co-exchanged zeolites and based on results of own investigations of Co–ZSM-5 catalysts used in the CH4–SCR of NOx, we present here a comprehensive characterization study enabling a deeper insight concerning the nature of Co species created by wet exchange procedure. Therefore, different samples were selected comprising Co–ZSM-5, Co/Na–ZSM-5, and Co/Al–SBA-15 prepared by ion exchange, as well as Co/Al2O3, SiO2 prepared by incipient wetness impregnation. All samples were characterized by UV–Vis–DRS and FTIR (CO and pyridine adsorption). The aim was to demonstrate the requirement of applying complementary methods for proper characterization the formed Co species. The exchange degree reflected by the availability of acid sites was examined by pyridine adsorption, while the nature of the formed Co species (isolated and/or agglomerated) was characterized by CO adsorption at low temperature and UV–Vis–DR spectroscopy.

2. Results and Discussion

2.1. Catalysts

The catalysts together with their metal contents and the preparation methods applied in this work are listed in Table 1. Except for the 1.96 Co sample, which was prepared according to the procedure described by Dědeček et al. [19], all zeolite-based catalysts were prepared by an own method adapting the procedure from Beznis et al. [27] in which the used Co salts, the applied Co concentrations in the solutions, and temperatures for ion exchange were varied, while NH4–ZSM-5 and Na–ZSM-5 were used as starting materials for ion exchange. Because the Si/Al ratio in the starting zeolite material was constant, the exchange degree is mainly influenced by the applied Co salt concentration. When using Na–ZSM-5 as starting material, the Na ions were not completely exchanged. For comparison, two catalysts were also prepared utilizing materials that have no microporous zeolite structure. On the one hand a mesoporous Al–SBA-15 was used for ion exchange, and on the other hand a mixed oxide SiO2/Al2O3 with open pore structure was loaded with Co by incipient wetness impregnation.

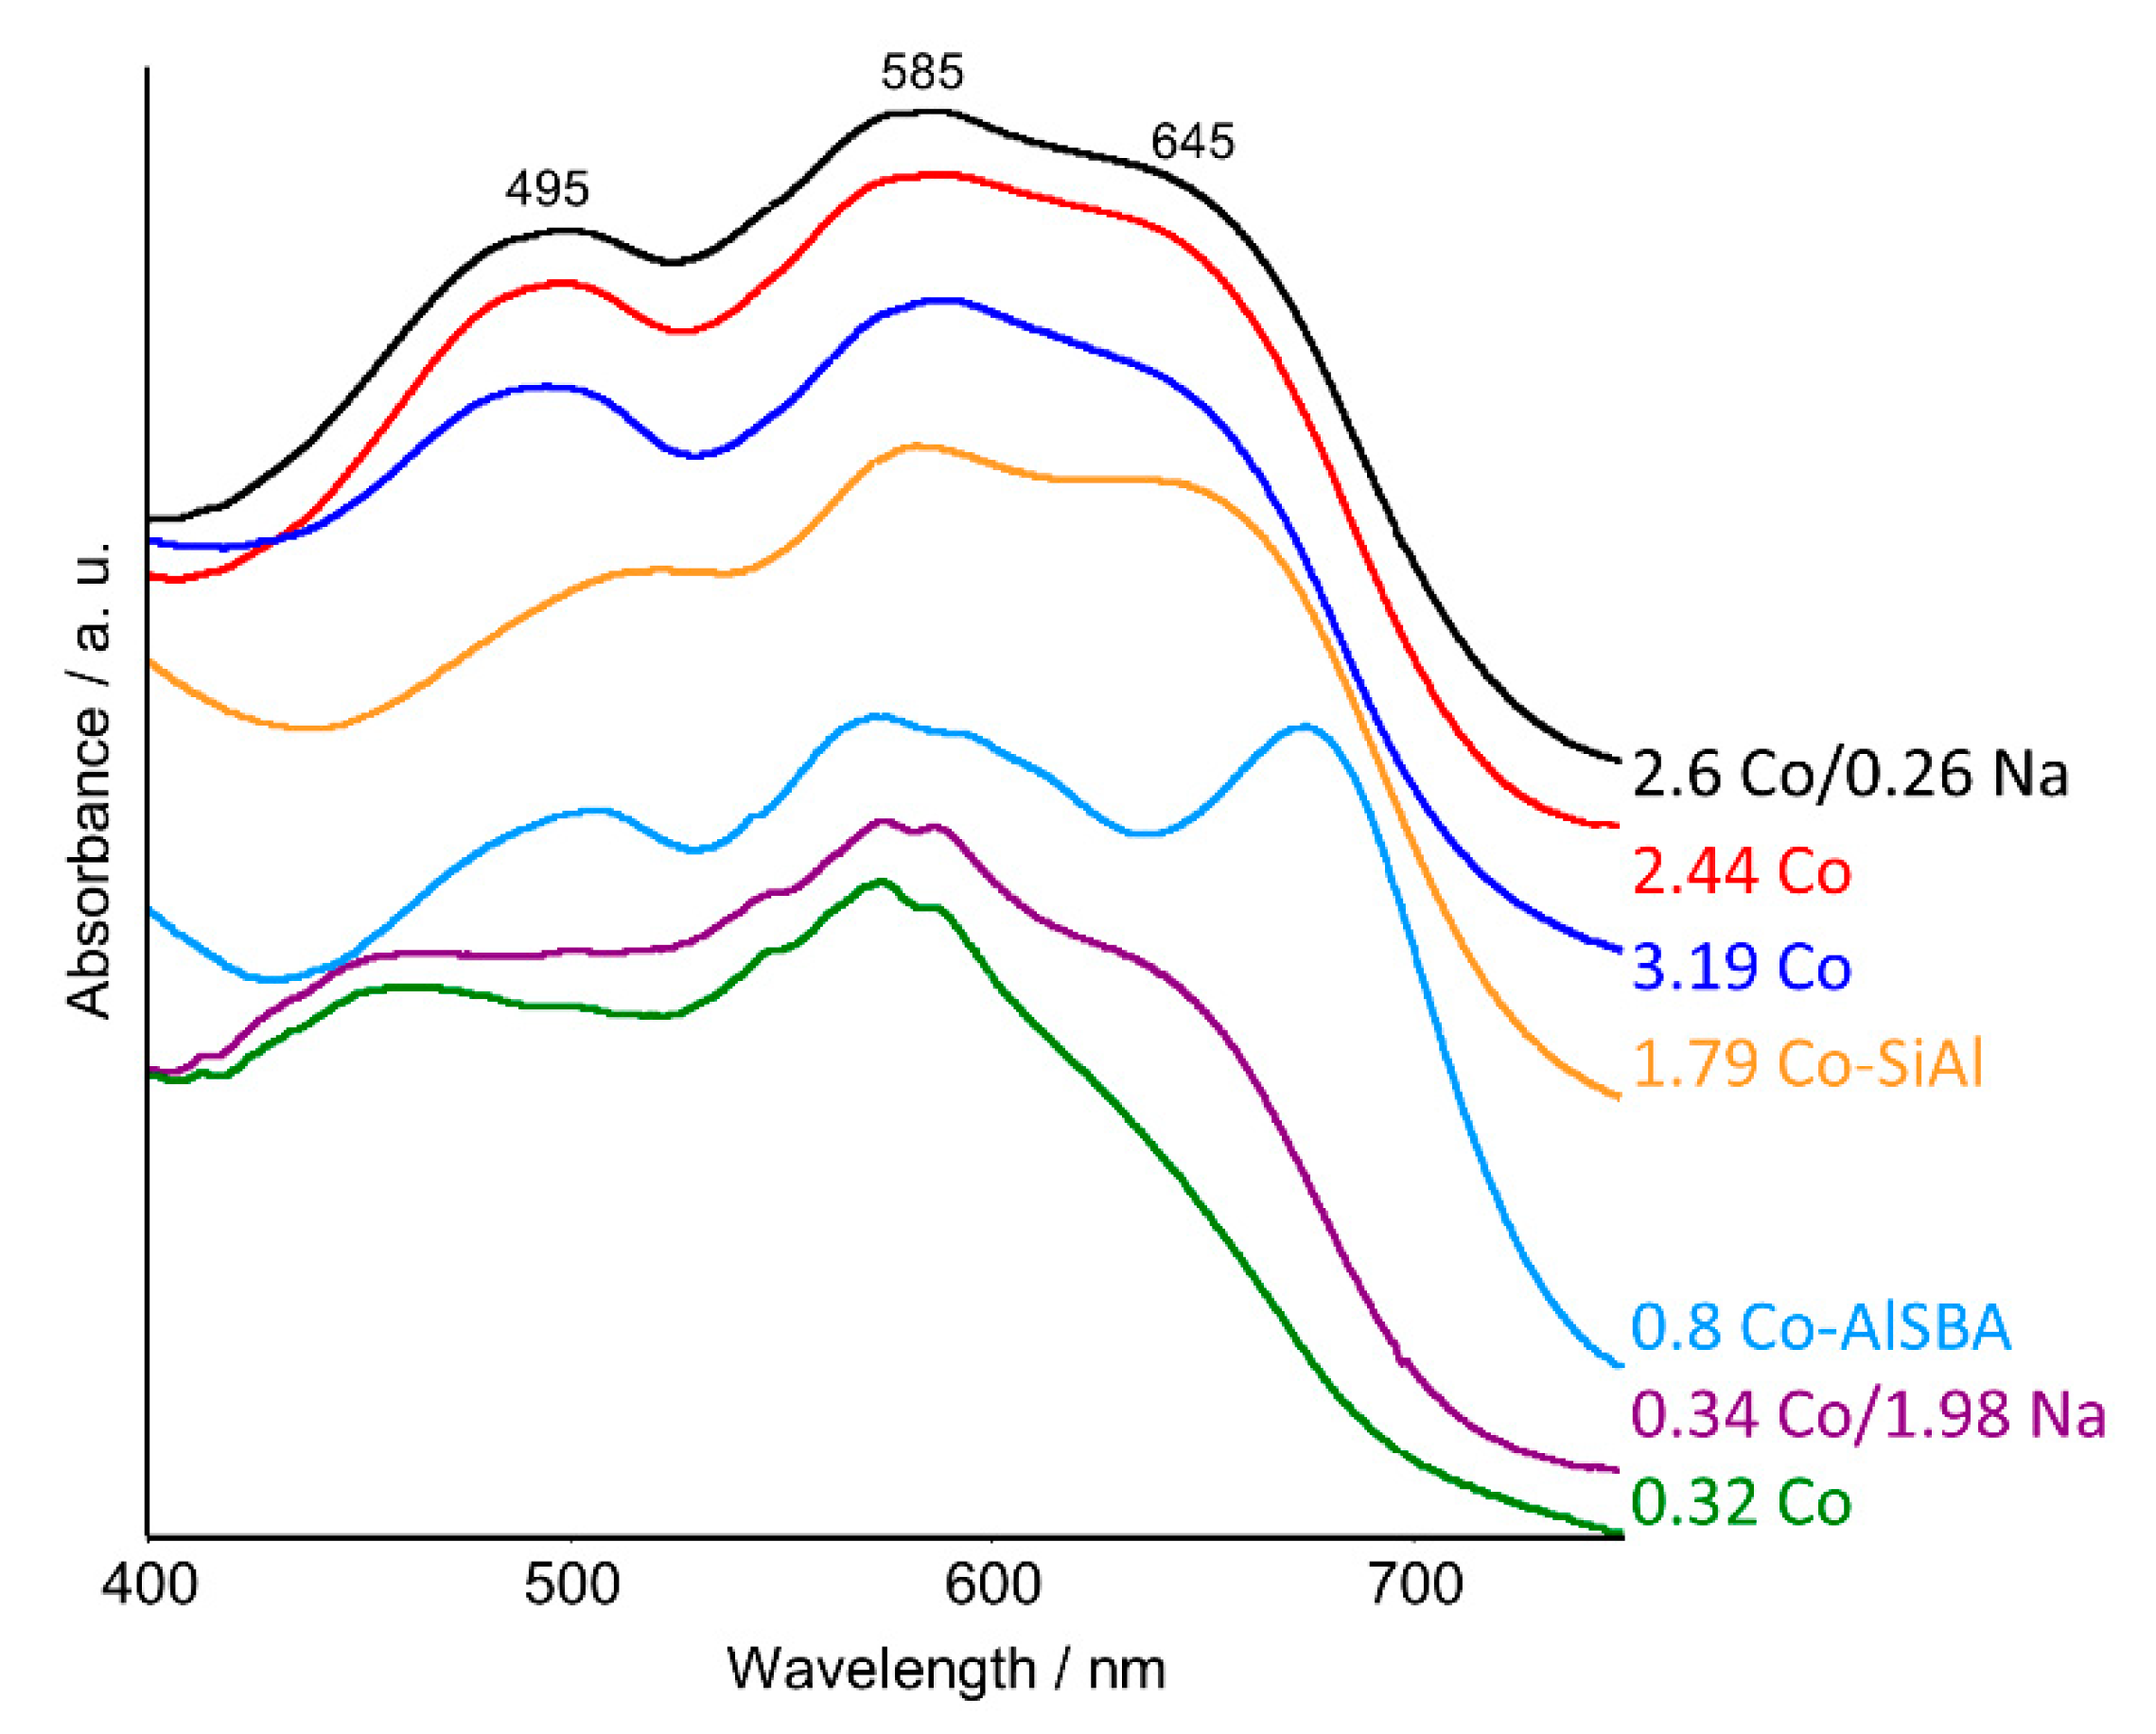
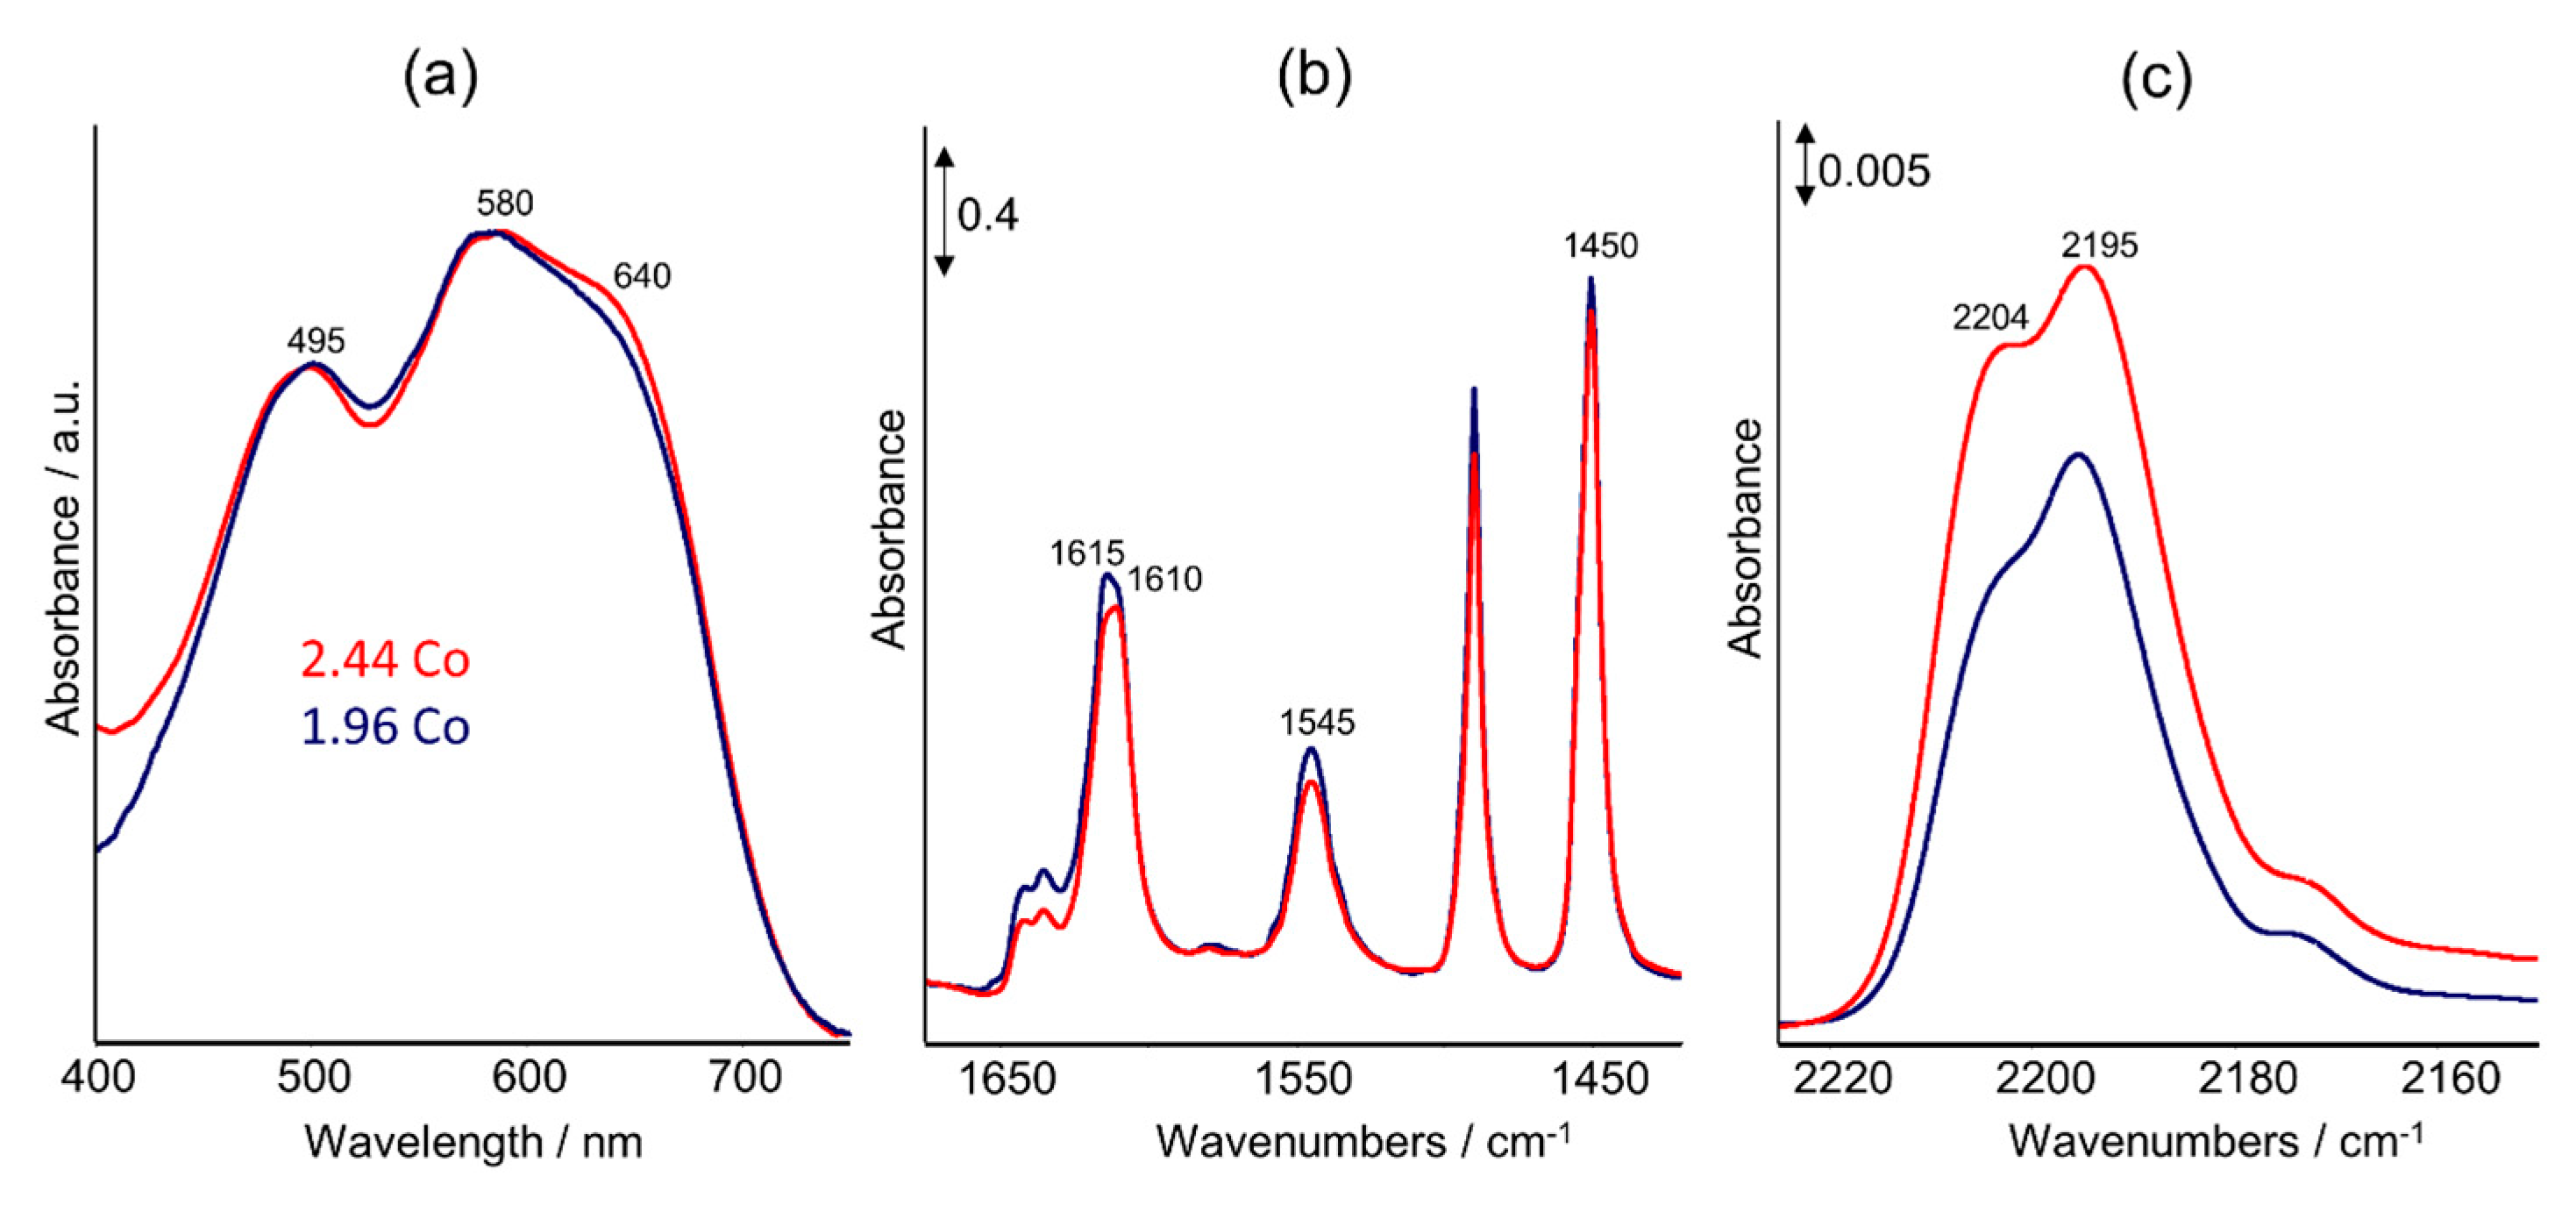
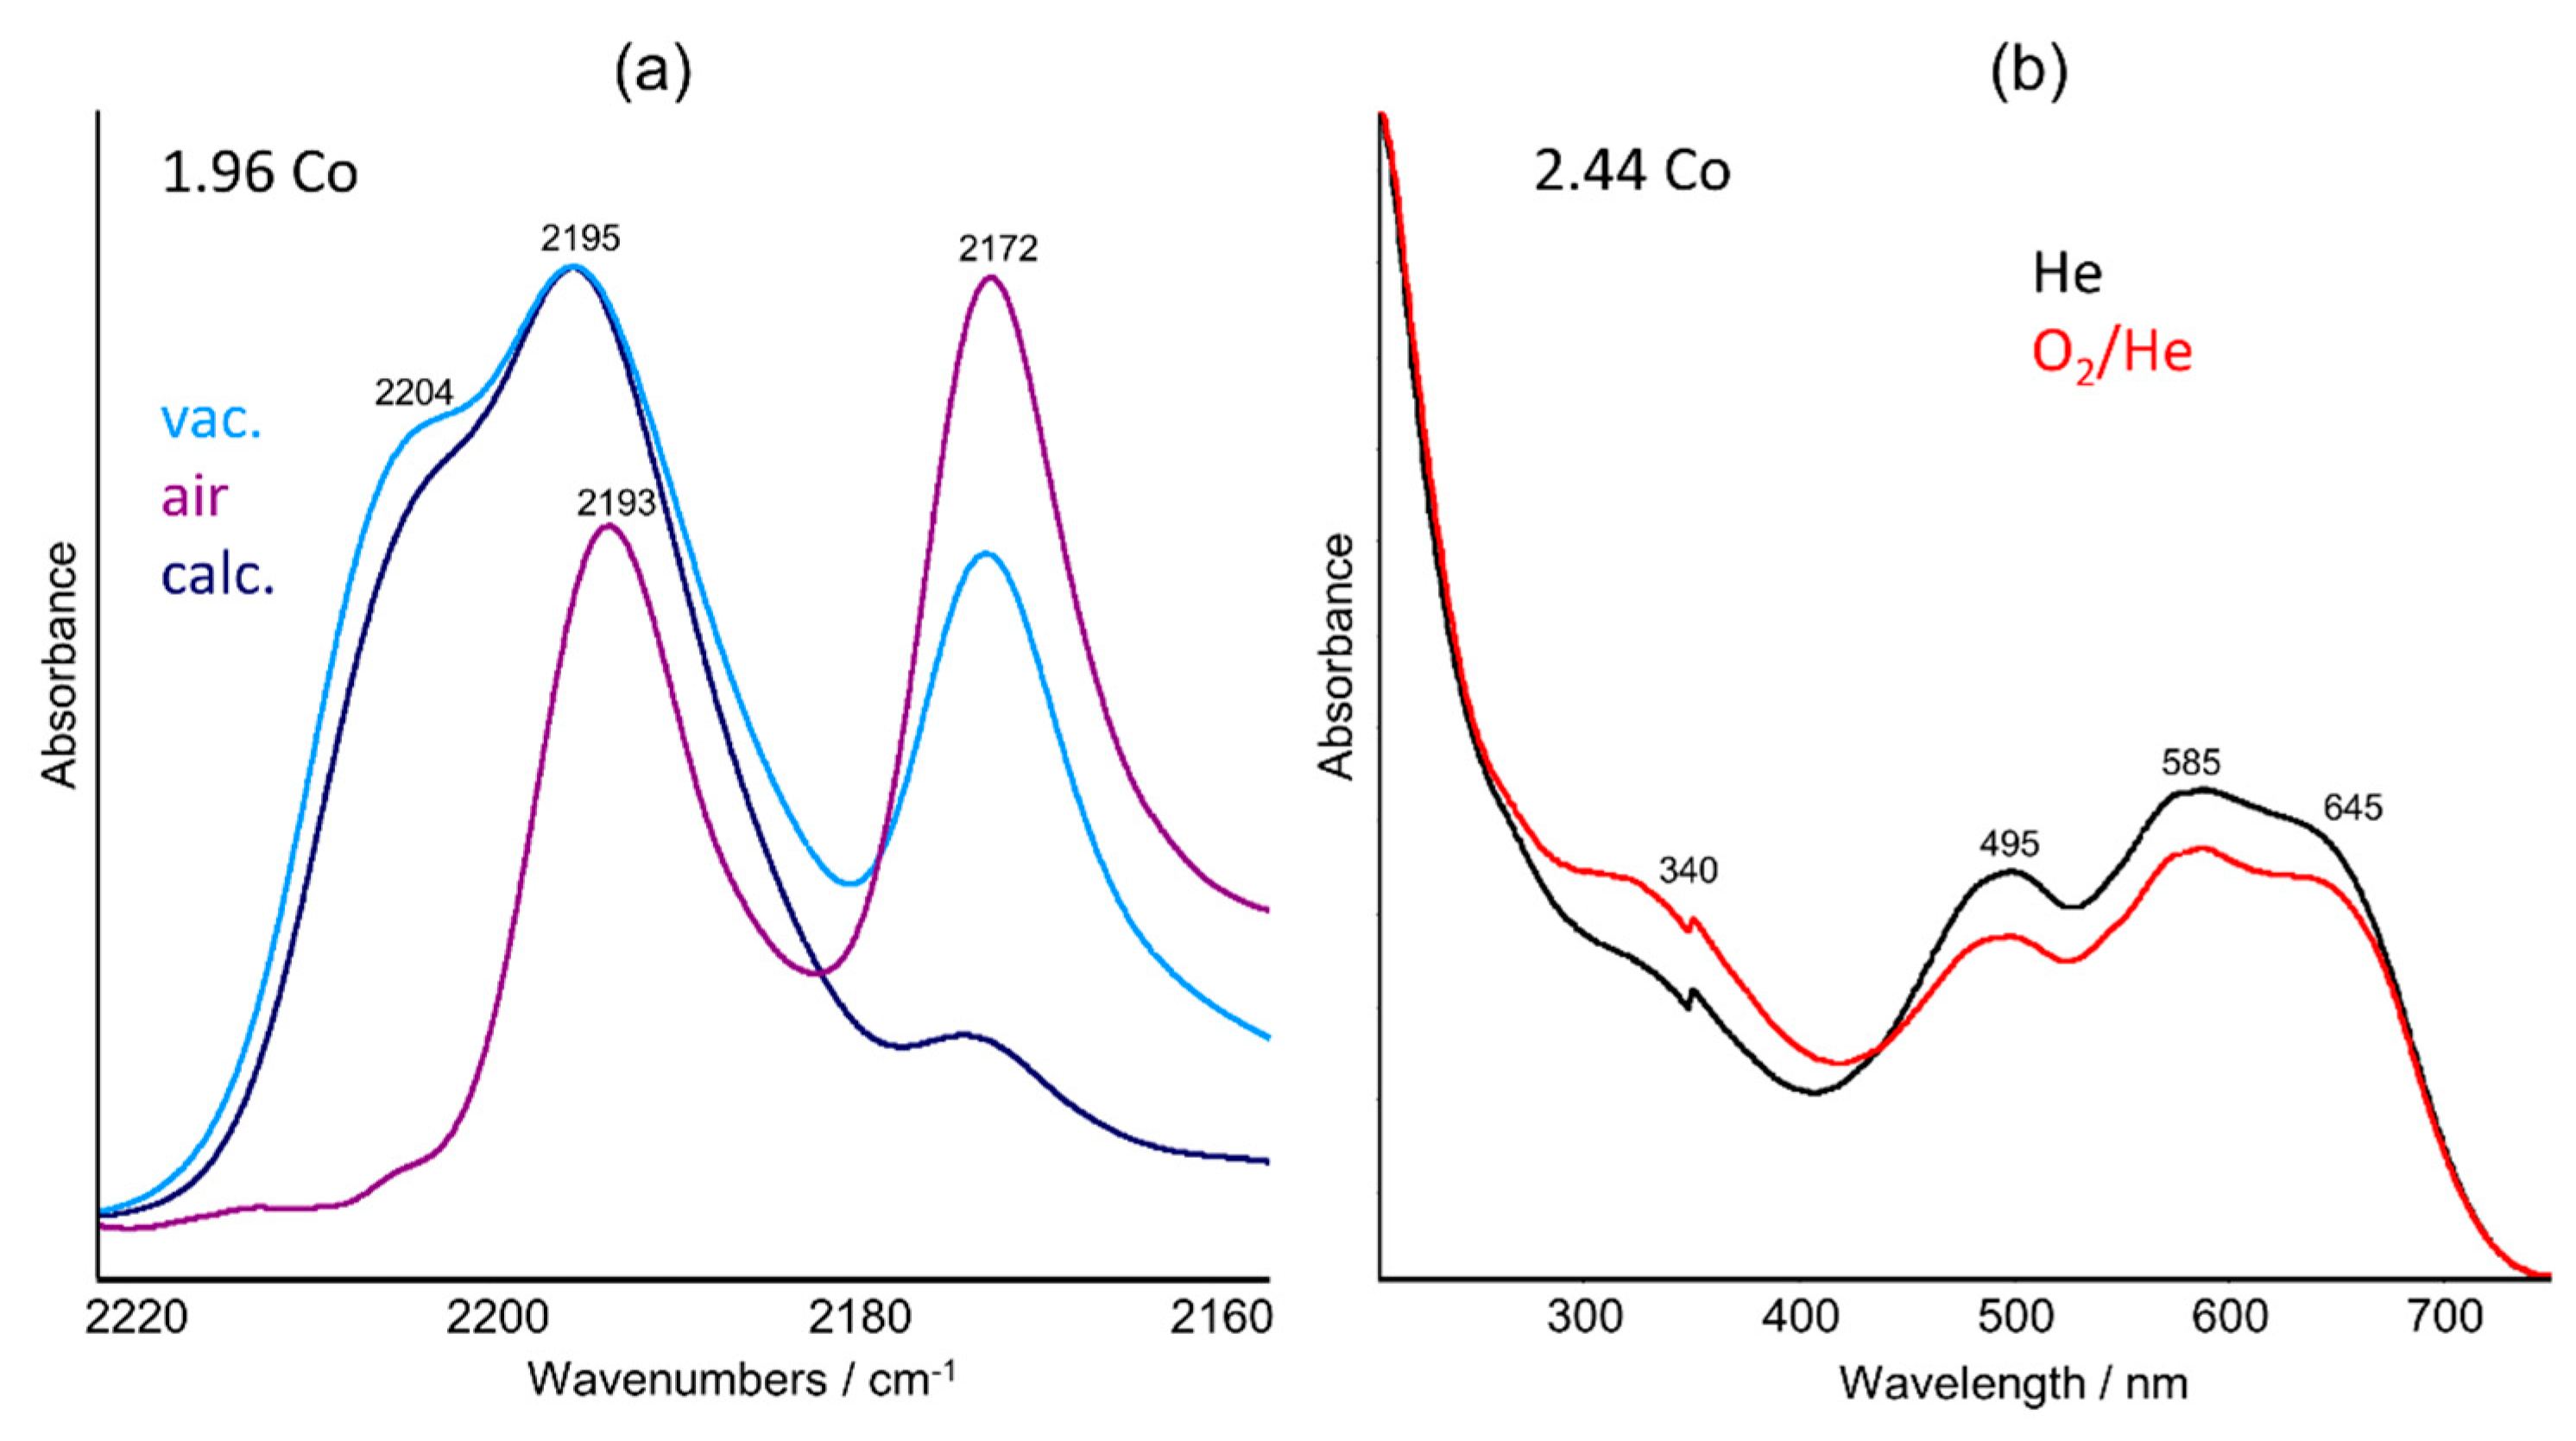
2.2. UV–Vis DRS Studies

The UV–Vis–DR spectra of the catalysts measured at room temperature after dehydration in Heat 400 °C are depicted in Figure 1. For all samples, similar spectra were obtained showing a characteristic triplet of bands with maxima around 495 nm, 585 nm, and 645 nm as earlier described in literature for Co–ZSM-5 samples [19]. The intensity ratios of these band maxima vary, as can be seen in detail by inspecting the deconvoluted spectra (Figure S1), but a clear trend in terms of Co concentration and/or used materials is not visible. Interestingly, comparable spectra with a characteristic band triplet were also obtained from the samples 1.79 Co–SiAl and 0.8 Co–AlSBA, which have no zeolite structures. This suggests, in agreement with conclusion made by the Busca group, [11,26] that the assignment of the observed band triplet to three different types of sites (α, β, γ) located in the internal cavities of pentasil-containing zeolites [17,18,19] might not be correct, particularly since such a characteristic band triplet is not restricted to zeolite materials and was also described, e.g., for cobalt-based blue pigments, [28] cobalt spinels, [29,30] cobalt oxide-apatite materials, [31] Co/Al2O3, [32], and Co-doped ZnO [33].
Octahedral and tetrahedral Co2+ (d7) complexes, particularly in zeolite materials, have been widely studied by optical spectroscopy in the past [34,35,36,37,38,39]. It is known that Co2+ changes from high-spin octahedral state in hydrated samples to tetrahedral coordination in the respective dehydrated ones, visible by the color change from pink to blue. Tetrahedral Co2+ (d7) exhibits three symmetry and spin allowed transitions from the ground state: ν1 = 4A2(F) → 4T2(F), ν2 = 4A2(F) → 4T1(F), ν3 = 4A2(F) → 4T1(P) [36,39]. While ν1 is observed in the infrared region between 2500 and 6000 cm−1, the ν2 and ν3 transitions are observable in the near infrared and visible region. For the ν2 and ν3 transitions, a band splitting is observed, which may be due to (i) a low symmetry perturbation, which lifts the degeneracy of the two 4T1 excited levels and which induces an asymmetrical band splitting; (ii) a dynamic Jahn–Teller effect, which splits the two bands into three symmetrically spaced peaks; (iii) spin-orbit coupling [38,39]. Taking these facts into account, it is not surprising that the spectra of all dehydrated Co2+-containing samples, not only those of zeolites, exhibit a band triplet in the visible region between 400–750 nm.
The observed different shapes of the band triplets might by related to the specific coordination geometry of Co2+ influenced by the individual surrounding of the Co2+ ions in the respective solids. Thus, it can be expected that the splitting pattern in the case of Co-containing zeolites changes depending on the occupied positions (γ-, β-, or α-type sites), e.g., in pentasil-containing zeolites [17,18,19,20]. Therefore, one can consider that the splitting pattern provides information concerning the successive occupation of respective sites with increasing Co content as described by Dědeček et al. [19], e.g., for Co–ZSM-5 samples. Indications for that can also be seen by comparing the spectra of 0.32 Co and 2.44 Co in Figure 1. However, when Co2+ ions are evenly distributed on γ-, β-, and α-type sites, then each type of Co species gives rise to an own triplet band, consequently leading to three superimposed triplet bands, which contribute to the observed spectrum. Therefore, it is practically impossible to discriminate between Co species at different sites and to quantify the percentage of occupied sites by deconvolution of the observed spectra. Nevertheless, based on spectral deconvolution, Dědeček et al. [19] described different components which were ascribed to three types of Co ions located at specific cationic sites in Co–ZSM-5: A single band at 15,000 cm−1 for α-sites; four bands at 16,000, 17,150, 18,600, 21,200 cm−1 for β-sites; and a doublet at 20,100, 22,000 cm−1 for γ-sites. This might be mathematically correct, but not from the physical point of view. Moreover, as we have shown, the triplet bands can also be properly deconvoluted on the basis of only three components (cf. Figure S1).
It has to be mentioned here that for determining the location of the Co2+ ions, it was presupposed [15,19] that all Co2+ ions are isolated due to the exchange of protons (Brønsted sites), which are created by the incorporation of Al in the zeolite matrix. Hence, only the Co/Al ratio was taken into account. We demonstrate in the next paragraph that this supposition cannot be made without inclusion of additional characterization methods.

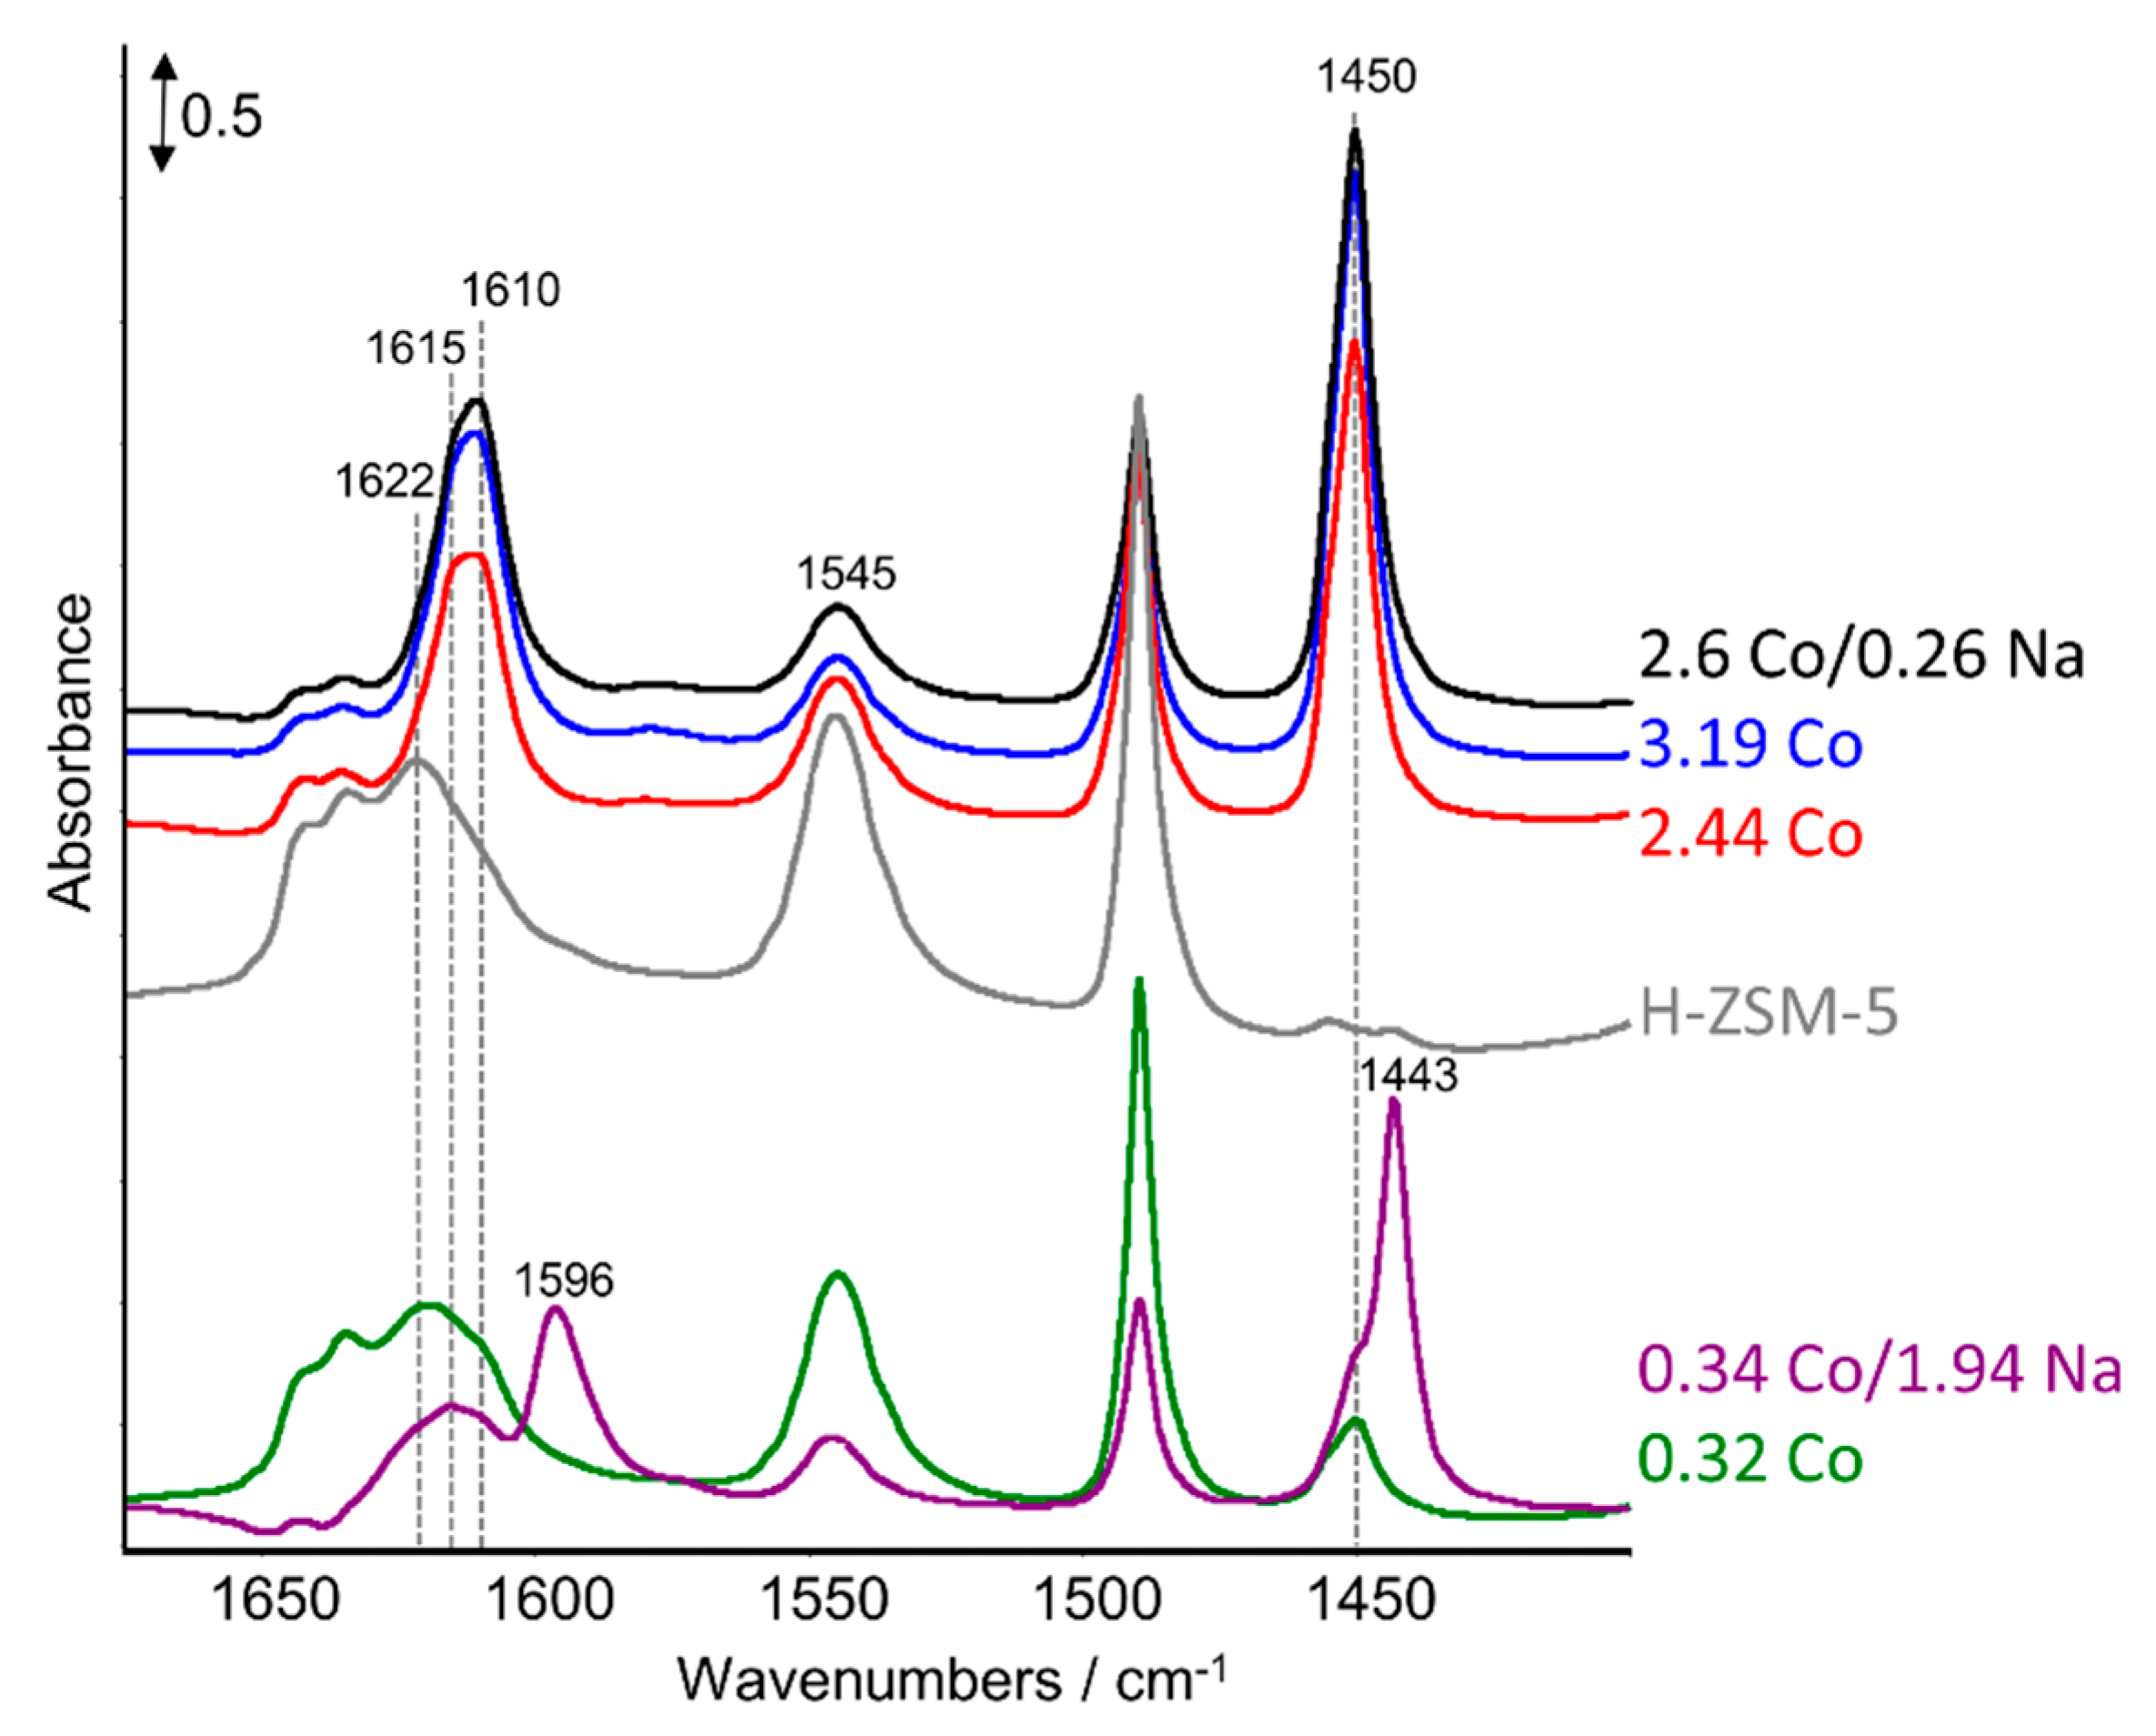
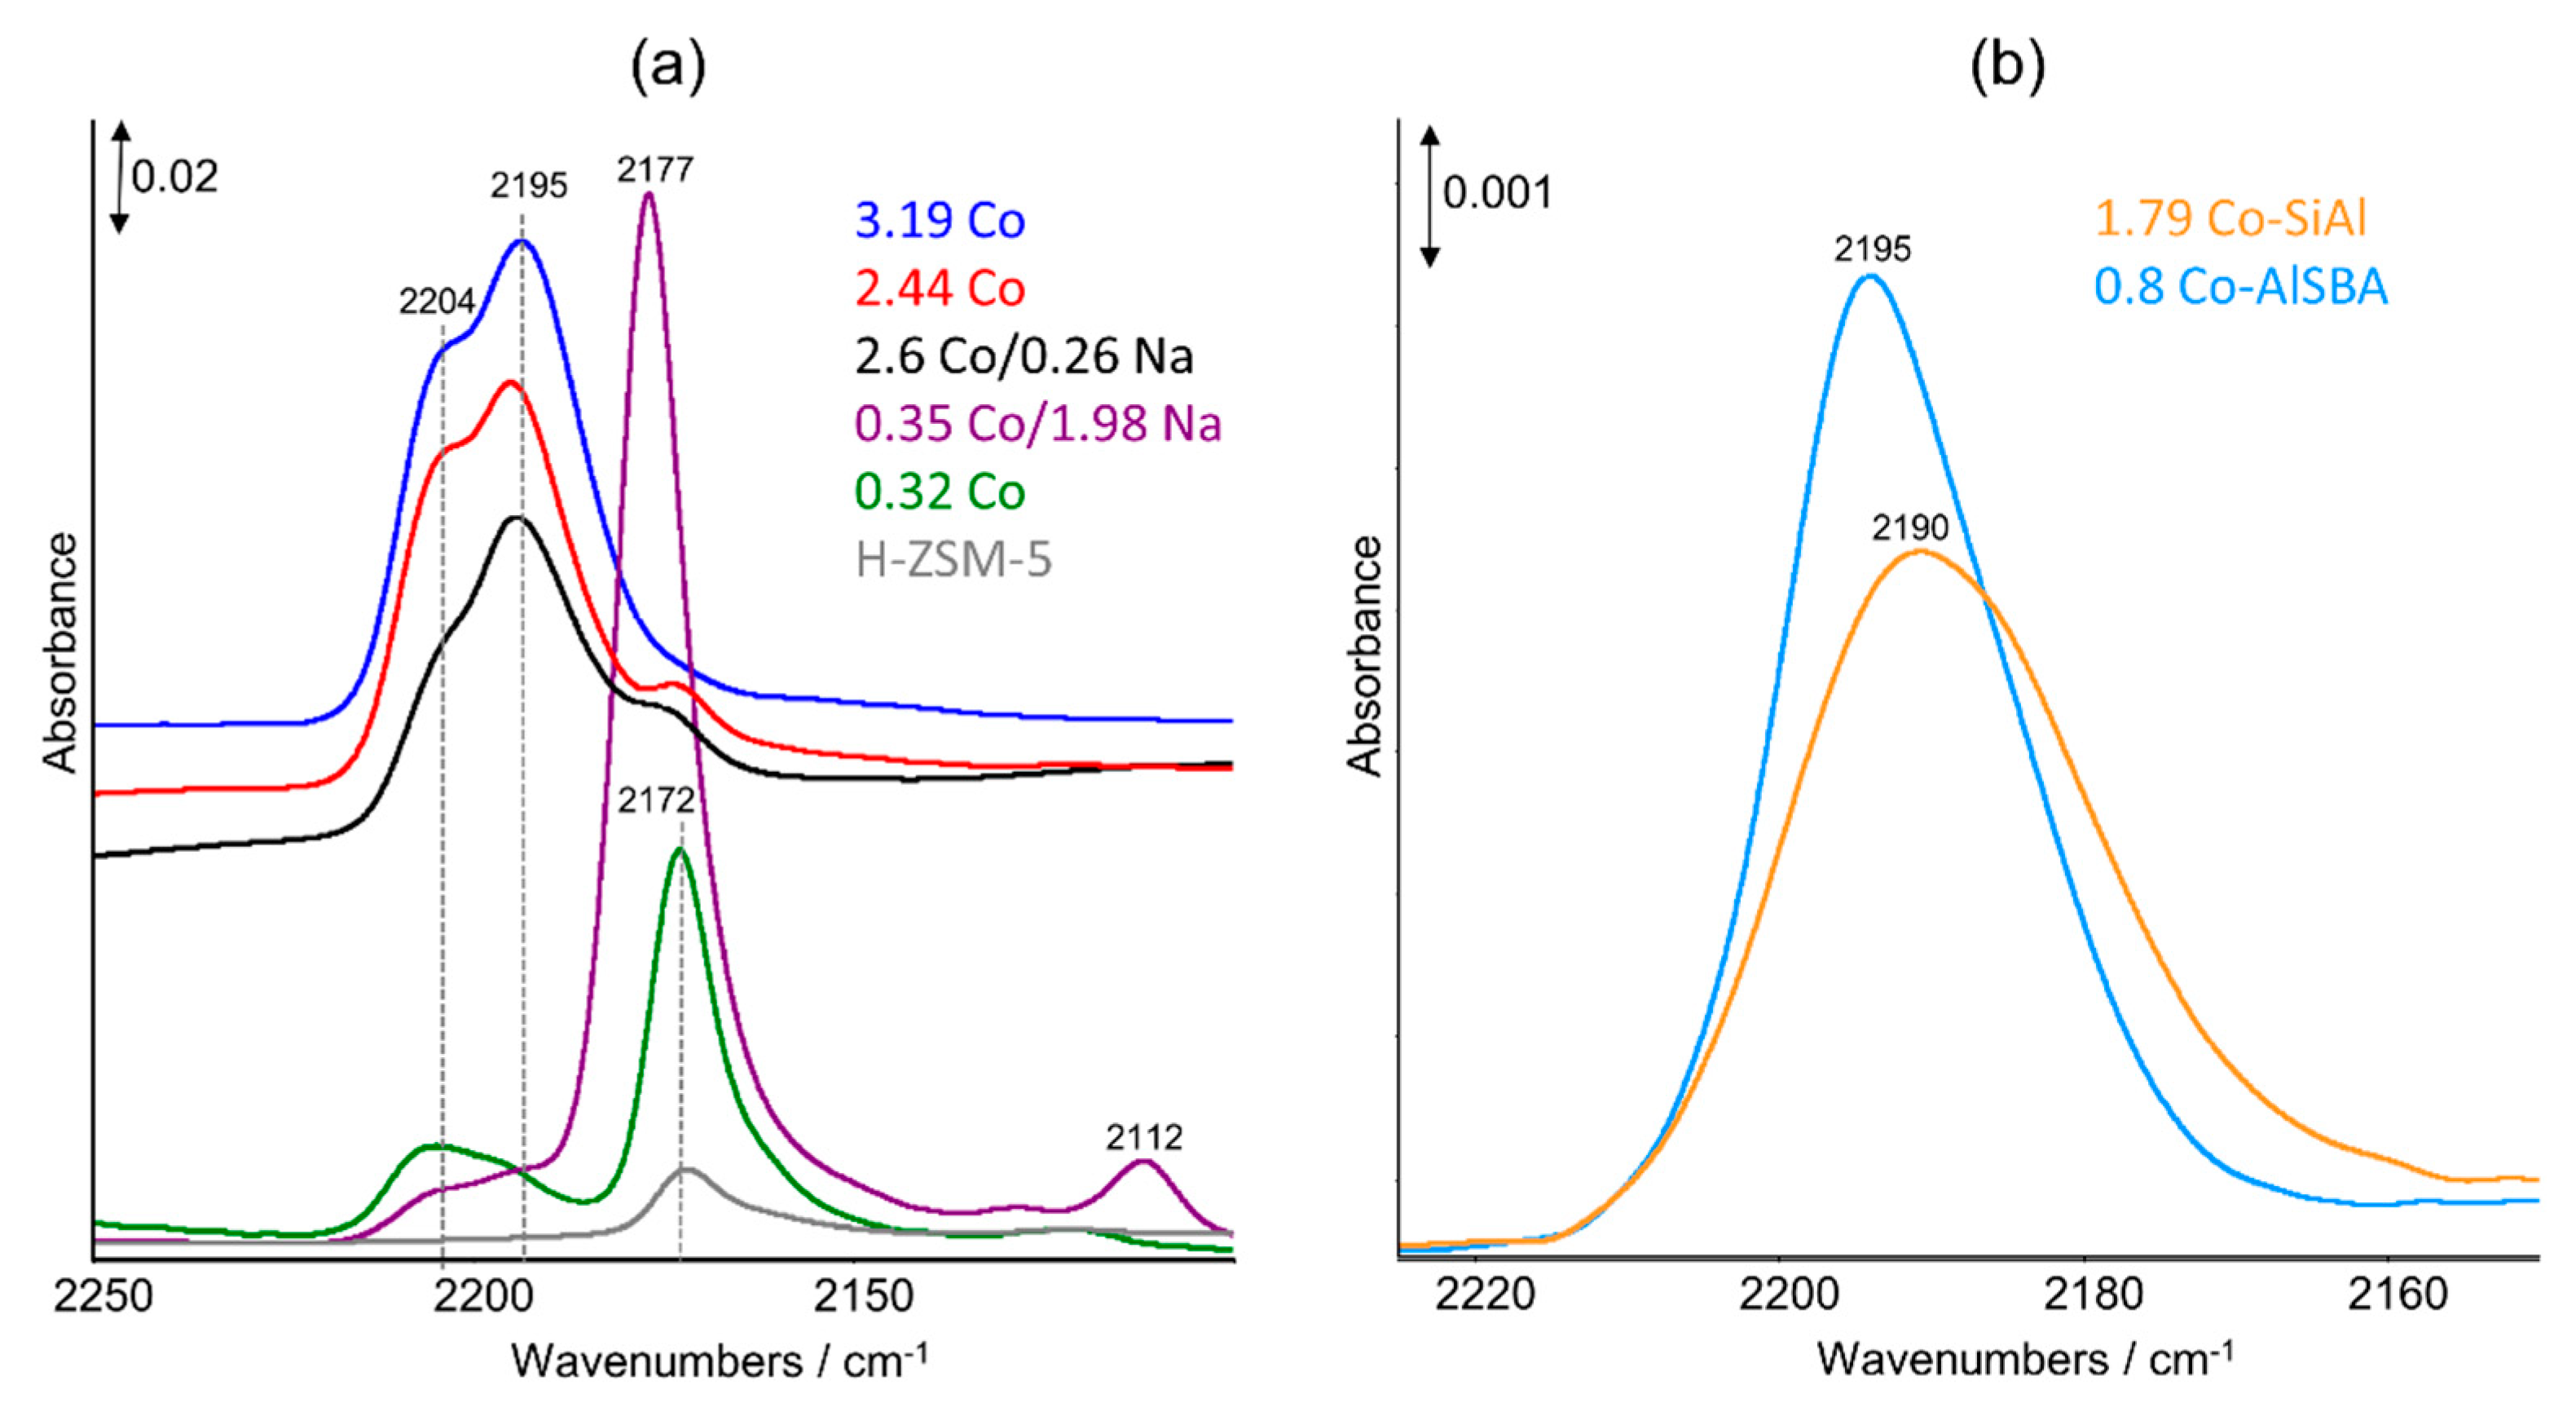
2.3. FTIR Studies: Pyridine and CO Adsorption

Brønsted and Lewis acidic sites can be well characterized by FTIR spectroscopic investigation of pyridine adsorption [40,41]. The typical bands resulting from pyridine adsorbed on Brønsted acid sites (PyH+) are observed around 1540 cm−1, while the bands from pyridine interacting with Lewis acid sites (L–Py) are detected at around 1450 cm−1 and in the region of 1625–1595 cm−1. From the band positions in the latter region, the strength of Lewis acid sites can be evaluated [41]. The pyridine adsorbate spectra of the studied catalysts measured at 150 °C are depicted in Figure 2. As expected, the Co-free H–ZSM-5 sample shows an intense PyH+ band at 1545 cm−1, the intensity of which decreases with Co loading. Upon comparing the band intensities of the PyH+ band, it is obvious that even the highly loaded sample 3.19 Co possesses a quite high number of Brønsted acid sites, although the Co/Al ratio is very close to 0.5. This means that a part of the Co2+ ions is obviously not located on exchange positions, which points to an exchange process with a more complex stoichiometry as also observed by other authors [10].
By comparing the intensities of the L–Py band of H–ZSM-5 with that of the Co-containing samples, it is seen that additional Lewis acid sites are created with increasing Co content as indicated by the bands at 1450/1610 cm−1 (Co2+) and 1443/1596 cm−1 (Na+). Furthermore, a splitting of the L-Py band in the region above 1600 cm−1 into two components at 1610 and 1616 cm−1 is observable, revealing two Co2+ Lewis sites of different strength, possibly located at different sites in the zeolite lattice.
A suitable method for characterizing the nature of Co species is adsorption of CO at low temperatures [12,13,42,43,44]. Thus, one can distinguish Co2+ located at exchange positions from Co2+ being part of oxide-like clusters because the respective νCo2+−CO bands appear at different positions, namely at 2204 cm−1 for Co2+ in exchange positions and at 2194 cm−1 for Co2+ in oxide-like clusters. The CO adsorbate spectra of the studied samples are compared in Figure 3. Here, the spectra measured at −60 °C are shown because the band stemming from the interaction of CO with OH groups at 2174 cm−1 [45] has negligible intensity at this temperature. This band is intense at the adsorption temperature of −120 °C but vanishes at higher temperatures because the interaction of CO with hydroxyl groups is not as strong as the interaction with Co2+ ions [14]. It is obvious that all Co–zeolite samples (Figure 3a) contain Co2+ species at exchange positions (2204 cm−1) as well as in oxide-like clusters (2195 cm−1) independent from the Co content. This is in accordance with the results of pyridine adsorption, where two Co2+ Lewis sites of different strength have been identified. The bands at 2177 and 2112 cm−1 in the 0.35 Co/1.98 Na sample are related to νNa+−CO and νNa+−OC vibrations, respectively [46].
In the CO adsorbate spectra of 1.79 Co–SiAl and 0.8 Co–AlSBA (Figure 3b), only Co2+ in oxide-like clusters is observed as reflected by the band position. With respect to the UV–Vis spectra, which are similar for both types of samples (cf. Figure 1), the results of CO adsorption lead to the conclusion that the triplet bands observed in the spectra are related to tetrahedral Co2+ sitting at exchange positions as well as in oxide-like clusters, which can be located inside as well as outside the zeolite channels, depending on the cluster size. The latter conclusion is based on CO adsorption experiments in which o-toluonitrile was preadsorbed on Co–H–MFI [12,13]. In this way, the discrimination between cationic sites inside and outside the channels was possible because the bulky molecule is not able to penetrate the channels of zeolites like ZSM-5 or MOR and therefore block respective sites. Thus, it could be demonstrated for Co–H–MFI that Co2+ ions are distributed at both the external and internal surfaces. This has to be assumed too for the Co–ZSM-5 catalysts studied in this work.
To be sure that the findings of pyridine and CO adsorption are not influenced by the used preparation methods, being different from that described by Dědeček et al. [19] we have also prepared a sample according to this protocol. As a result, the sample 1.96 Co was obtained (cf. Table 1), the characterization results of which in comparison with those of 2.44 Co are shown in Figure 4.
It is seen that the UV–Vis–DR as well as the pyridine and CO adsorbate spectra are very similar. While the UV–Vis spectra are nearly identical (Figure 4a), the Brønsted acidity of the 1.96 Co sample is slightly higher compared to that of 2.44 Co (Figure 4b), which might be due to the lower Co content and therefore lower exchange level. This is also true for the intensities of the observed CO adsorbate bands, whereas the intensity ratio of the bands at 2204/2195 cm−1 is nearly the same. In summary, it can be stated that in both catalysts, independent of the applied exchange procedure, Co2+ species are located both at exchange positions and in oxide-like clusters. Hence, as already mentioned above, the respective UV–Vis spectra reflect not only Co2+ ions located at α, β, γ sites in the internal cavities of the zeolite but also those in oxide-like clusters inside and/or outside the zeolite channels.
The existence of oxide-like clusters implies the possible presence of Co3+ besides Co2+ ions. Considering the fact that the samples were calcined in synthetic air at 500 °C, the presence of Co3+ has to be taken into account, which was also proven by NO adsorption in a former study [14]. For investigating the possible influence of calcination conditions on the nature of formed Co species, we analyzed sample 1.96 Co sample by respective FTIR experiments with CO and exemplarily the 2.44 Co catalyst by UV–Vis–DRS.
In Figure 5a, the normalized CO adsorbate spectra of 1.96 Co are shown measured at −60 °C after pretreatment of the fresh, non-calcined sample in situ in the FTIR reaction cell by heating in vacuum for 1 h at 500 °C (vac.) and heating in synthetic air at 500 °C for 45 min (air). For comparison, the spectrum of the calcined (calc.) sample is also shown. The spectrum of the latter is similar to that of the vacuum-treated sample exhibiting the typical bands of CO adsorbed on Co2+ at exchange positions as well as Co2+ in oxide-like clusters (vide supra). In the spectrum of the air-treated sample, only Co2+ in oxide-like clusters is detectable. The high intensity of the νOH−CO band around 2172 cm−1 in this sample in relation to the respective ν Co2+−CO bands suggests an agglomeration of the Co2+ species that recreates Brønsted sites, i.e., not exchanged protons.
Figure 5b shows the UV–Vis spectra of the sample 2.44 Co measured at room temperature after heating at 400 °C for 60 min followed by heating in 2 vol% O2/He at 400 °C for 45 min. After oxidation a new band around 340 nm appears, which is attributed to a ligand to metal charge transfer transition from framework oxide ions to Co3+ ions [37,39,47]. In parallel, the intensity of the triplet band of Co2+ decreases accordingly. This means that a part of Co2+ species, most probably those occurring in oxide-like clusters, has been oxidized to Co3+.
These experiments reveal that the calcination/dehydration conditions influence the nature and location of formed Co species, but even treatment in vacuum at high temperature does not inevitably lead to Co2+ located only at exchange positions. The fact that part of the Co2+ species can be easily oxidized leads to the conclusion that these Co2+ ions occur mainly in oxide-like agglomerates located inside and/or outside the zeolite channels. This means in terms of the UV–Vis spectra of such samples that the observed spectra represent not exclusively isolated Co2+ species but also those located in agglomerated, oxide-like species inside and/or outside the zeolite channels. The same conclusion was drawn from the results of pyridine and CO adsorption as described above.
These findings are in accordance with those from former studies [12,25,26] revealing that the distribution of Co species is by far more complex, as deduced from previous papers in which UV–Vis, EXAFS, and XRD data have been discussed [17,18,19,48]. Insofar, a detailed analysis and quantification of Co positions in the zeolite matrix on the basis of deconvoluted UV–Vis spectra is practically not possible because the spectrum reflects Co species occupying positions inside the zeolite channels as well as positions on internal and external surfaces. This conclusion is also supported by the fact that for Co sites in zeolite cavities as well as for those dispersed on the surface of different oxide supports, similar UV–Vis spectra with the characteristic band triplet are obtained. The characteristic band splitting is due to symmetry perturbation, dynamic Jahn–Teller effect, and spin-orbit coupling [38,39] and is observed in general for Co2+ ions independently from the surrounding matrix. For determining nature and distribution of Co2+ species in Co-exchanged zeolites, the use of only UV–Vis–DRS cannot reflect the real situation. For this purpose, the combination of several, complementary methods have to be applied.
From the presented results the following conclusions can be derived. The observed triplet bands in the UV–Vis spectra of Co2+-containing samples reflect the sum of spectra of all existing Co2+ species (isolated and oxide-like) located at different positions inside the zeolite channels as well as on internal and external surfaces. The characteristic band splitting is due to symmetry perturbation, dynamic Jahn–Teller effect, and spin-orbit coupling and is generally observed for Co2+ ions in zeolite as well as oxide materials. Because comparable UV–Vis spectra with a characteristic band triplet is observed for Co2+ ions independently from the surrounding matrix, the former described UV–Vis band deconvolution method for determination and quantification of individual cationic sites in zeolites is not applicable.

3. Materials and Methods

The Co–ZSM-5 catalysts were prepared starting from NH4–ZSM-5 (Zeolyst, CBV 2314, SiO2/Al2O3 = 23). Co was introduced by wet ion-exchange (IE) using solutions of Co(NO3)2–6H2O (Sigma-Aldrich, St. Louis, MO, USA) or Co(CH3COO)2–4H2O (Sigma-Aldrich, St. Louis, MO, USA), adapting the method described by Beznis et al. [27]. The used conditions are summarized in Table 1. The zeolite was suspended in the respective Co salt aqueous solution and preheated to 60 °C. The pH was adjusted to 6.9, and the solution was stirred for 24 h. After filtration, the material was washed with 400 mL desalinated water/g solid. After drying over night at 90 °C, the solids were calcined in synthetic air at 500 °C for 6 h. For the preparation of the Na–ZSM-5, a solution of NaNO3 (Sigma-Aldrich, St. Louis, MO, USA) was used. The exchange procedure and subsequent washing was repeated two times. Finally, the solid was dried at 100 °C for 24 h and calcined in synthetic air at 500 °C for 6 h. For comparison, the respective H–ZSM-5 catalyst was prepared applying the same IE method but using only water. The sample 1.96 Co was prepared by the method described by Dědeček et al. [19] with adjusted pH of 5.5.
The Co–SiAl sample was prepared by incipient wetness impregnation (IWI) of a Siralox sample from Sasol (49.2% SiO2, 50.8% Al2O3), which was dried overnight at 120 °C. After dropwise adding of a respective volume of a solution of Co(CH3COO)2⋅4H2O (Carl Roth, Karlsruhe, Germany) under stirring and further stirring for 2 h, the suspension was dried overnight and calcined at 500 °C for 6 h in synthetic air.
For the preparation of Co–AlSBA, the starting Al–SBA-15 material was prepared according the method described by Wu et al. [49]. The obtained solid was dried for 12 h at 70 °C and then calcined in synthetic air at 650 °C for 16 h. This Al–SBA-15 (Si/Al = 20) was used for the IE procedure described for Co–ZSM-5 above.
The Si/Al ratio of H–ZSM-5 and the contents of Co, Al, Na were determined by ICP-OES analysis.
The UV–Vis–DR spectra were recorded in diffuse reflection mode between 200 and 800 nm on a Cary 5000 spectrophotometer (Agilent, Santa Clara, CA, USA) equipped with a diffuse reflection accessory (Praying mantis) and a Harrick reaction cell. After treatment, the samples were heated at 400 °C for 30 min, and the spectra were measured at room temperature.
In situ FTIR measurements were carried out in transmission mode on a Bruker Tensor 27 spectrometer or Nicolet iS10 spectrometer (Thermo Fisher Scientific, Waltham, MA, USA) equipped with custom-made reaction cells with CaF2 windows for adsorption studies of pyridine and CO, respectively. The sample powders were pressed into self-supporting wafers with a diameter of 20 mm and a weight of 50 mg. For each experiment, the sample was pretreated in synthetic air at 400 °C for 1 h. After cooling down to the respective adsorption temperature and evacuation of the cell a background, spectrum of the sample was recorded. Pyridine was adsorbed at 150 °C temperature until saturation. Then, the reaction cell was evacuated to remove physisorbed pyridine, and an adsorbate spectrum was recorded. For CO adsorption, a 5% CO/He mixture was used, dosed in pulses at −120 °C until saturation. To remove the physisorbed CO, the cell was evacuated, and the CO adsorbate spectrum was recorded. Subsequently, the CO desorption under vacuum was followed by continuously heating the sample and measuring a spectrum every 10 °C. Generally, the spectrum of the catalyst measured after pretreatment at adsorption temperature was subtracted from the respective adsorbate spectra of pyridine and CO.

Supplementary Materials

The following are available online at https://www.mdpi.com/2073-4344/10/1/123/s1, Figure S1: Deconvoluted UV–Vis–DR spectra of selected samples measured at room temperature after heating the samples at 400 °C in He for 30 min.

Author Contributions

Conceptualization, U.B. and A.B.; investigation, A.B. and C.R.; data curation, A.B. and C.R.; writing—original draft preparation, U.B.; writing—review and editing, A.B.; supervision, A.B.; funding acquisition, U.B. All authors have read and agreed to the published version of the manuscript.

Funding

This research was funded by the Leibniz-Gemeinschaft, grant number SAW-2013-LIKAT-2.

Acknowledgments

The authors thank Anja Simmula for the ICP-OES analysis and Dominik Seeburg for the preparation of Al–SBA-15.

Conflicts of Interest

The authors declare no conflict of interest.

References

  1. Armor, J.N. Catalytic reduction of nitrogen-oxides with methane in the presence of excess oxygen–A review. Catal. Today 1995, 26, 147–158. [Google Scholar] [CrossRef]
  2. Lonyi, F.; Solt, H.E.; Paszti, Z.; Valyon, J. Mechanism of NO-SCR by methane over Co,H–ZSM-5 and Co,H-mordenite catalysts. Appl. Catal. B Environ. 2014, 150, 218–229. [Google Scholar] [CrossRef] [Green Version]
  3. Wang, X.; Chen, H.Y.; Sachtler, W.M.H. Catalytic reduction of NOx by hydrocarbons over Co/ZSM-5 catalysts prepared with different methods. Appl. Catal. B Environ. 2000, 26, L227–L239. [Google Scholar] [CrossRef]
  4. Wang, X.; Chen, H.-Y.; Sachtler, W.M.H. Mechanism of the selective reduction of NOx over Co/MFI: Comparison with Fe/MFI. J. Catal. 2001, 197, 281–291. [Google Scholar] [CrossRef]
  5. Chupin, C.; Vanveen, A.; Konduru, M.; Despres, J.; Mirodatos, C. Identity and location of active species for NO reduction by CH4 over Co-ZSM-5. J. Catal. 2006, 241, 103–114. [Google Scholar] [CrossRef]
  6. Sadovskaya, E.M.; Suknev, A.P.; Pinaeva, L.G.; Goncharov, V.B.; Bal’zhinimaev, B.S.; Chupin, C.; Pérez-Ramírez, J.; Mirodatos, C. Mechanism and kinetics of the selective NO reduction over Co-ZSM-5 studied by the SSITKA technique: 2. Reactivity of NOx-adsorbed species with methane. J. Catal. 2004, 225, 179–189. [Google Scholar] [CrossRef]
  7. Sun, T.; Fokema, M.D.; Ying, J.Y. Mechanistic study of NO reduction with methane over Co2+ modified ZSM-5 catalysts. Catal. Today 1997, 33, 251–261. [Google Scholar] [CrossRef]
  8. Campa, M.C.; DeRossi, S.; Ferraris, G.; Indovina, V. Catalytic activity of Co-ZSM-5 for the abatement of NOx with methane in the presence of oxygen. Appl. Catal. B Environ. 1996, 8, 315–331. [Google Scholar] [CrossRef]
  9. Campa, M.C.; Indovina, V. Cobalt-exchanged mordenites: Preparation, characterization and catalytic activity for the abatement of NO with CH4 in the presence of excess O-2. J. Porous Mater. 2007, 14, 251–261. [Google Scholar] [CrossRef]
  10. Campa, M.C.; Luisetto, I.; Pietrogiacomi, D.; Indovina, V. The catalytic activity of cobalt-exchanged mordenites for the abatement of NO with CH4 in the presence of excess O-2. Appl. Catal. B Environ. 2003, 46, 511–522. [Google Scholar] [CrossRef]
  11. Resini, C.; Montanari, T.; Nappi, L.; Bagnasco, G.; Turco, M.; Busca, G.; Bregani, F.; Notaro, M.; Rocchini, G. Selective catalytic reduction of NOx by methane over Co-H-MFI and Co-H-FER zeolite catalysts: Characterisation and catalytic activity. J. Catal. 2003, 214, 179–190. [Google Scholar] [CrossRef]
  12. Montanari, T.; Marie, O.; Daturi, M.; Busca, G. Searching for the active sites of Co-H-MFI catalyst for the selective catalytic reduction of NO by methane: A FT-IR in situ and operando study. Appl. Catal. B Environ. 2007, 71, 216–222. [Google Scholar] [CrossRef]
  13. Montanari, T.; Marie, O.; Daturi, M.; Busca, G. Cobalt on and in zeolites and silica–alumina: Spectroscopic characterization and reactivity. Catal. Today 2005, 110, 339–344. [Google Scholar] [CrossRef]
  14. Bellmann, A.; Atia, H.; Bentrup, U.; Brückner, A. Mechanism of the selective reduction of NOx by methane over Co-ZSM-5. Appl. Catal. B Environ. 2018, 230, 184–193. [Google Scholar] [CrossRef]
  15. Dedecek, J.; Sobalik, Z.; Wichterlova, B. Siting and distribution of framework aluminium atoms in silicon-rich zeolites and impact on catalysis. Catal. Rev. 2012, 54, 135–223. [Google Scholar] [CrossRef]
  16. Dědeček, J.; Kaucký, D.; Wichterlová, B.; Gonsiorová, O. Co2+ ions as probes of Al distribution in the framework of zeolites. ZSM-5 study. Phys. Chem. Chem. Phys. 2002, 4, 5406–5413. [Google Scholar]
  17. Dědeček, J.; Wichterlová, B. Co2+Ion siting in pentasil-containing zeolites. I. Co2+Ion sites and their occupation in mordenite. A Vis−NIR diffuse reflectance spectroscopy study. J. Phys. Chem. B 1999, 103, 1462–1476. [Google Scholar]
  18. Kaucký, D.; Dědeček, J.; Wichterlová, B. Co2+ ion siting in pentasil-containing zeolites. Microporous Mesoporous Mater. 1999, 31, 75–87. [Google Scholar] [CrossRef]
  19. Dedecek, J.; Kaucky, D.; Wichterlova, B. Co2+ ion siting in pentasil-containing zeolites, part 3. Co2+ ion sites and their occupation in ZSM-5: A VIS diffuse reflectance spectroscopy study. Microporous Mesoporous Mater. 2000, 35–36, 483–494. [Google Scholar] [CrossRef]
  20. Dědeček, J.; Čapek, L.; Kaucký, D.; Sobalík, Z.; Wichterlová, B. Siting and distribution of the Co Ions in beta zeolite: A UV–Vis–NIR and FTIR study. J. Catal. 2002, 211, 198–207. [Google Scholar] [CrossRef]
  21. Kim, J.; Jentys, A.; Maier, S.M.; Lercher, J.A. Characterization of Fe-exchanged BEA zeolite under NH3 selective catalytic reduction conditions. J. Phys. Chem. C 2013, 117, 986–993. [Google Scholar] [CrossRef]
  22. Kim, S.; Park, G.; Woo, M.H.; Kwak, G.; Kim, S.K. Control of hierarchical structure and framework-Al distribution of ZSM-5 via adjusting crystallization temperature and their effects on methanol conversion. ACS Catal. 2019, 9, 2880–2892. [Google Scholar] [CrossRef]
  23. Gil, B.; Janas, J.; Włoch, E.; Olejniczak, Z.; Datka, J.; Sulikowski, B. The influence of the initial acidity of HFER on the status of Co species and catalytic performance of CoFER and InCoFER in CH4-SCR-NO. Catal. Today 2008, 137, 174–178. [Google Scholar] [CrossRef]
  24. Gil, B.; Pietrzyk, P.; Datka, J.; Kozyra, P.; Sojka, Z. Speciation of cobalt in CoZSM-5 upon thermal treatment. In Studies in Surface Science and Catalysis; Čejka, J., Žilková, N., Nachtigall, P., Eds.; Elsevier: Amsterdam, The Netherlands, 2005; Volume 158, pp. 893–900. [Google Scholar]
  25. Bagnasco, G.; Turco, M.; Resini, C.; Montanari, T.; Bevilacqua, M.; Busca, G. On the role of external Co sites in NO oxidation and reduction by methane over Co?H-MFI catalysts. J. Catal. 2004, 225, 536–540. [Google Scholar] [CrossRef]
  26. Montanari, T.; Bevilacqua, M.; Resini, C.; Busca, G. UV–Vis and FT-IR study of the nature and location of the active sites of partially exchanged Co−H zeolites. J. Phys. Chem. B 2004, 108, 2120–2127. [Google Scholar] [CrossRef]
  27. Beznis, N.V.; Weckhuysen, B.M.; Bitter, J.H. Partial oxidation of methane over Co-ZSM-5: Tuning the oxygenate selectivity by altering the preparation route. Catal. Lett. 2010, 136, 52–56. [Google Scholar] [CrossRef] [Green Version]
  28. Llusar, M.; Forés, A.; Badenes, J.A.; Calbo, J.; Tena, M.A.; Monrós, G. Colour analysis of some cobalt-based blue pigments. J. Eur. Ceram. Soc. 2001, 21, 1121–1130. [Google Scholar] [CrossRef]
  29. Lee, K.; Ruddy, D.A.; Dukovic, G.; Neale, N.R. Synthesis, optical, and photocatalytic properties of cobalt mixed-metal spinel oxides Co(Al1−xGax)2O4. J. Mater. Chem. A 2015, 3, 8115–8122. [Google Scholar] [CrossRef]
  30. Rangappa, D.; Ohara, S.; Naka, T.; Kondo, A.; Ishii, M.; Adschiri, T. Synthesis and organic modification of CoAl2O4 nanocrystals under supercritical water conditions. J. Mater. Chem. 2007, 17, 4426–4429. [Google Scholar] [CrossRef]
  31. El Kabouss, K.; Kacimi, M.; Ziyad, M.; Ammar, S.; Ensuque, A.; Piquemal, J.-Y.; Bozon-Verduraz, F. Cobalt speciation in cobalt oxide-apatite materials: Structure–properties relationship in catalytic oxidative dehydrogenation of ethane and butan-2-ol conversion. J. Mater. Chem. 2006, 16, 2453–2463. [Google Scholar] [CrossRef]
  32. Liotta, L.F.; Pantaleo, G.; Macaluso, A.; Di Carlo, G.; Deganello, G. CoOx catalysts supported on alumina and alumina-baria: Influence of the support on the cobalt species and their activity in NO reduction by C3H6 in lean conditions. Appl. Catal. A Gen. 2003, 245, 167–177. [Google Scholar] [CrossRef]
  33. Radovanovic, P.V.; Norberg, N.S.; McNally, K.E.; Gamelin, D.R. Colloidal transition-metal-doped ZnO quantum dots. J. Am. Chem. Soc. 2002, 124, 15192–15193. [Google Scholar] [CrossRef] [PubMed] [Green Version]
  34. Cotton, F.A.; Goodgame, D.M.L.; Goodgame, M. The electronic structures of tetrahedral cobalt(II) complexes. J. Am. Chem. Soc. 1961, 83, 4690–4699. [Google Scholar] [CrossRef]
  35. Klier, K.; Kellerman, R.; Hutta, P.J. Spectra of synthetic zeolites containing transition metal ions. V.* Π complexes of olefins and acetylene with Co(II)A molecular sieve. J. Chem. Phys. 1974, 61, 4224–4234. [Google Scholar] [CrossRef]
  36. Klier, K. Transition-metal ions in zeolites: The perfect surface sites. Langmuir 1988, 4, 13–25. [Google Scholar] [CrossRef]
  37. Verberckmoes, A.A.; Uytterhoeven, M.G.; Schoonheydt, R.A. Framework and extra-framework Co2+ in CoAPO-5 by diffuse reflectance spectroscopy. Zeolites 1997, 19, 180–189. [Google Scholar] [CrossRef]
  38. Praliaud, H.; Coudurier, G. Optical spectroscopy of hydrated, dehydrated and ammoniated cobalt(II) exchanged zeolites X and Y. J. Chem. Soc. Faraday Trans. 1 Phys. Chem. Condens. Phases 1979, 75, 2601–2616. [Google Scholar] [CrossRef]
  39. Verberckmoes, A.A.; Weckhuysen, B.M.; Schoonheydt, R.A. Spectroscopy and coordination chemistry of cobalt in molecular sieves. Microporous Mesoporous Mater. 1998, 22, 165–178. [Google Scholar] [CrossRef] [Green Version]
  40. Buzzoni, R.; Bordiga, S.; Ricchiardi, G.; Lamberti, C.; Zecchina, A.; Bellussi, G. Interaction of pyridine with acidic (H–ZSM5, H-β, H-MORD Zeolites) and superacidic (H-Nafion Membrane) systems:  An IR investigation. Langmuir 1996, 12, 930–940. [Google Scholar] [CrossRef]
  41. Busca, G. The surface acidity of solid oxides and its characterization by IR spectroscopic methods. An attempt at systematization. Phys. Chem. Chem. Phys. 1999, 1, 723–736. [Google Scholar] [CrossRef]
  42. Gora-Marek, K.; Gil, B.; Sliwa, M.; Datka, J. An IR spectroscopy study of Co sites in zeolites CoZSM-5. Appl. Catal. A Gen. 2007, 330, 33–42. [Google Scholar] [CrossRef]
  43. Góra-Marek, K.; Gil, B.; Datka, J. Quantitative IR studies of the concentration of Co2+ and Co3+ sites in zeolites CoZSM-5 and CoFER. Appl. Catal. A Gen. 2009, 353, 117–122. [Google Scholar] [CrossRef]
  44. Gora-Marek, K. The reduction and oxidation of Co species in CoZSM-5 zeolites studied by IR spectroscopy. Top. Catal. 2009, 52, 1023–1029. [Google Scholar] [CrossRef]
  45. Kustov, L.M.; Kazanskii, V.B.; Beran, S.; Kubelkova, L.; Jiru, P. Adsorption of carbon monoxide on ZSM-5 zeolites: Infrared spectroscopic study and quantum-chemical calculations. J. Phys. Chem. 1987, 91, 5247–5251. [Google Scholar] [CrossRef]
  46. Zecchina, A.; Bordiga, S.; Lamberti, C.; Spoto, G.; Carnelli, L.; Otero Arean, C. Low-temperature fourier transform infrared study of the interaction of CO with cations in alkali-metal exchanged ZSM-5 zeolites. J. Phys. Chem. 1994, 98, 9577–9582. [Google Scholar] [CrossRef]
  47. Kraushaar-Czarnetzki, B.; Hoogervorst, W.G.M.; Andréa, R.R.; Emeis, C.A.; Stork, W.H.J. Characterisation of CoIIand CoIIIin CoAPO molecular sieves. J. Chem. Soc. Faraday Trans. 1991, 87, 891–895. [Google Scholar] [CrossRef]
  48. Drozdová, L.; Prins, R.; Dědeček, J.; Sobalík, Z.; Wichterlová, B. Bonding of Co ions in ZSM-5, ferrierite, and mordenite: An X-ray Absorption, UV–Vis, and IR study. J. Phys. Chem. B 2002, 106, 2240–2248. [Google Scholar] [CrossRef]
  49. Wu, S.; Han, Y.; Zou, Y.-C.; Song, J.-W.; Zhao, L.; Di, Y.; Liu, S.-Z.; Xiao, F.-S. Synthesis of heteroatom substituted SBA-15 by the “pH-Adjusting” method. Chem. Mater. 2004, 16, 486–492. [Google Scholar] [CrossRef]
Figure 1. UV–Vis spectra measured in diffuse reflection mode at room temperature after heating the samples at 400 °C in He for 30 min.
Catalysts 10 00123 g001
Figure 2. Pyridine adsorbate spectra measured at 150 °C.
Catalysts 10 00123 g002
Figure 3. CO adsorbate spectra of Co-ZSM-5 samples (a) and 1.79 Co-SiAl as well as 0.8 Co-AlSBA (b) measured at −60 °C.
Catalysts 10 00123 g003
Figure 4. Comparison of UV–Vis–DR spectra measured at room temperature after heating the samples at 400 °C in He for 30 min (a), pyridine adsorbate spectra measured at 150 °C (b), and CO adsorbate spectra measured at −50 °C (c) of the samples 1.96 Co and 2.44 Co.
Catalysts 10 00123 g004
Figure 5. CO adsorbate normalized spectra measured at −60 °C (a) of the samples 1.96 Co and (b) 2.44 Co.
Catalysts 10 00123 g005
Table 1. Overview of catalysts studied, applied preparation methods, and metal contents.
CatalystSupportPreparation MethodContent
(wt%)
Co/Al
H–ZSM-5NH4–ZSM-5IE: water
100 mL/1 g zeolite, 60 °C, 24 h
Si: 34.90
Al: 3.25
0.00
Na–ZSM-5NH4–ZSM-5IE: 0.1 M Na––nitrate
100 mL/1 g zeolite, 25 °C, 24 h
Na: 2.370.00
0.32 CoNH4–ZSM-5IE: 0.0005 M Co–nitrate
100 mL/1 g zeolite, 60 °C, 24 h
Co: 0.320.04
3.19 CoNH4–ZSM-5IE: 0.05 M Co–nitrate
100 mL/1 g zeolite, 25 °C, 24 h
Co: 3.190.46
2.44 CoNH4–ZSM-5IE: 0.005 M Co–nitrate
100 mL/1 g zeolite, 60 °C, 24 h
Co: 2.440.30
1.96 Co 1NH4–ZSM-5IE: 0.05 M Co–acetate
16 mL/1 g zeolite, 70 °C, 12 h
Co: 1.960.28
0.34 Co/1.94 NaNa–ZSM-5IE: 0.0005 M Co–nitrate
100 mL/1 g zeolite, 60 °C, 24 h
Co: 0.34
Na: 1.94
0.05
0.35 Co/1.98 NaNa–ZSM-5IE: 0.0005 M Co–acetate
100 mL/1 g zeolite, 60 °C, 24 h
Co: 0.35
Na: 1.98
0.05
2.6 Co/0.26 NaNa–ZSM-5IE: 0.05 M Co–nitrate
100 mL/1 g zeolite, 60 °C, 24 h
Co: 2.60
Na: 0.26
0.40
1.79 Co–SiAlSiraloxIWI: 423 mg Co–acetate in 12.5 mL water, 5 g SiraloxCo: 1.790.06
0.8 Co–AlSBAAl–SBA-15IE: 0.02 M, Co–acetate
100 mL/1 g AlSBA, 60 °C, 24 h
Co: 0.80
Al: 2.92
0.13
1 Preparation method according Dědeček et al. [19].

