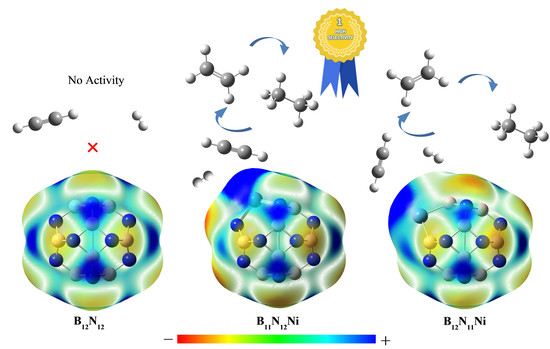
Selective Hydrogenation of Acetylene Catalysed by a B12N12 Cluster Doped with a Single Nickel Atom: A DFT Study

Abstract
1. Introduction
2. Results and Discussion
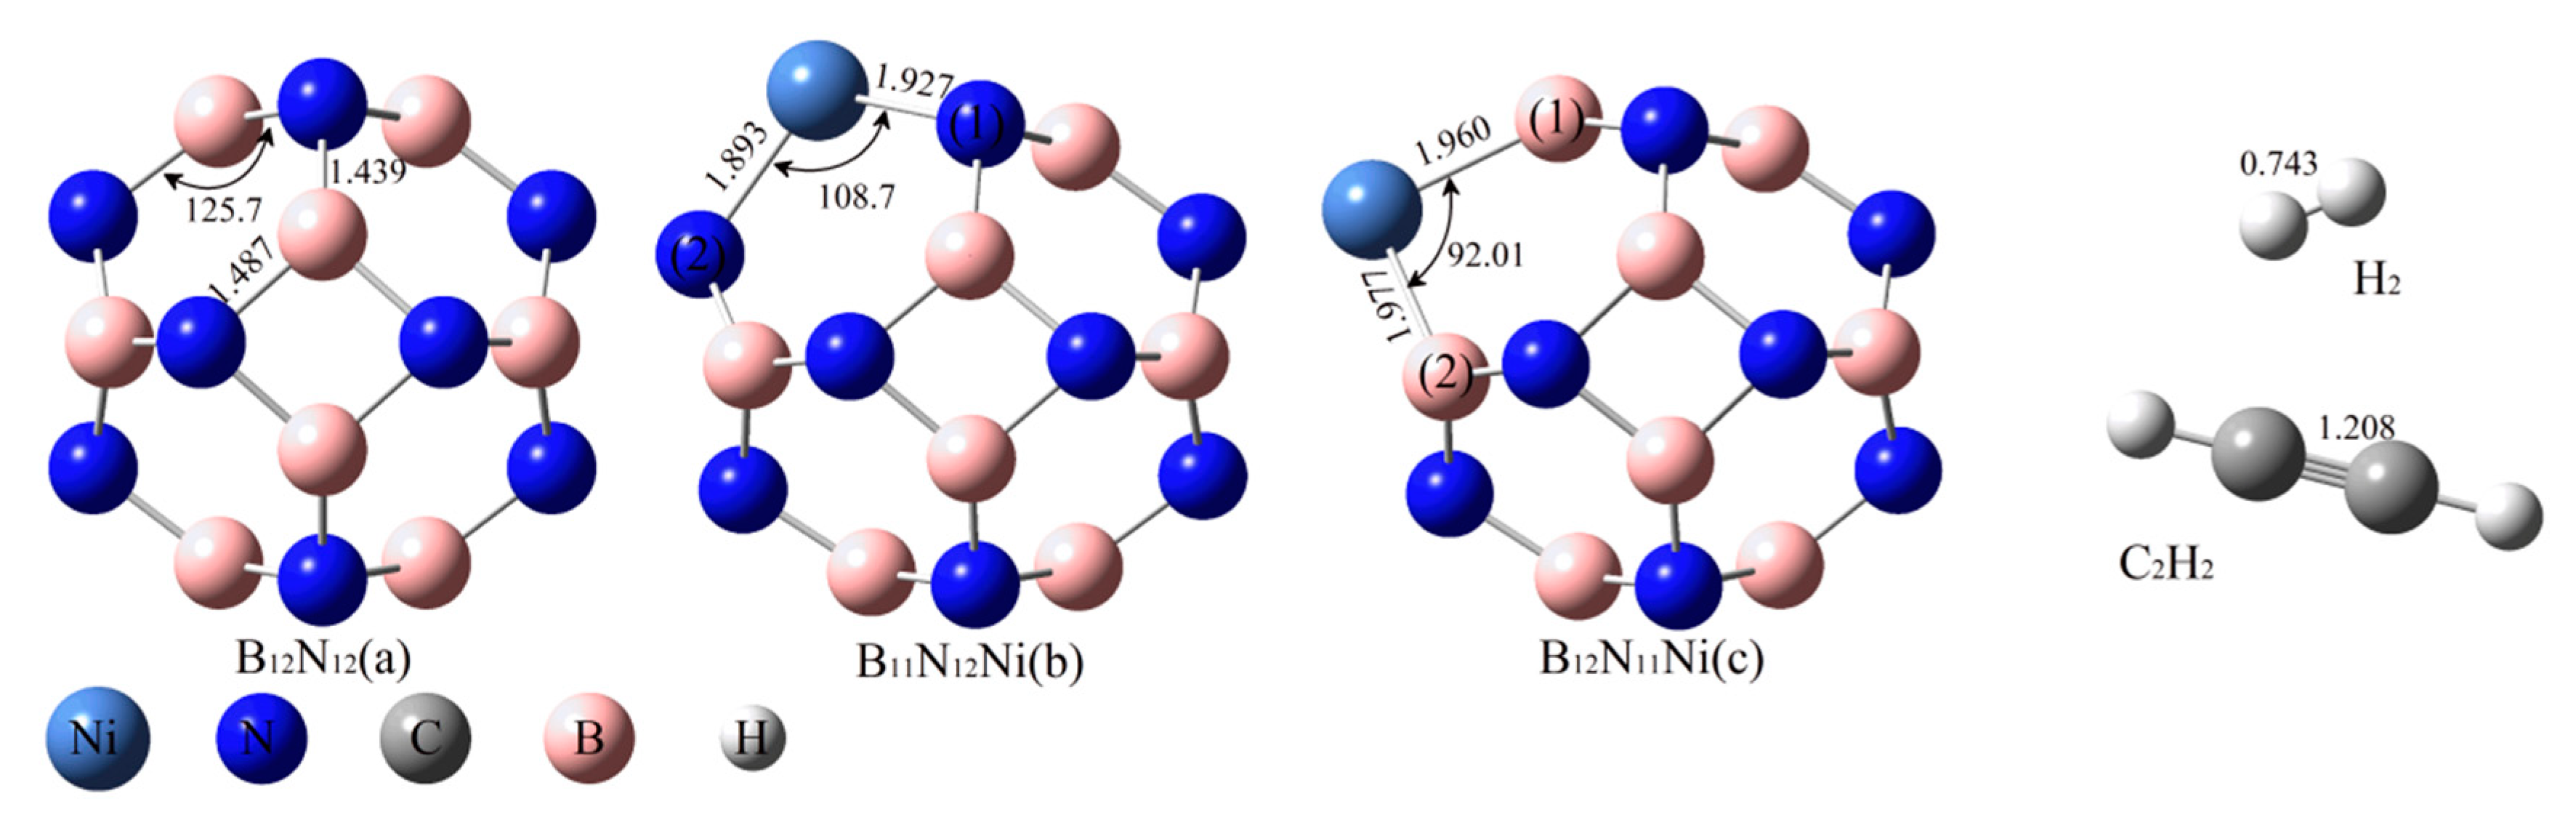
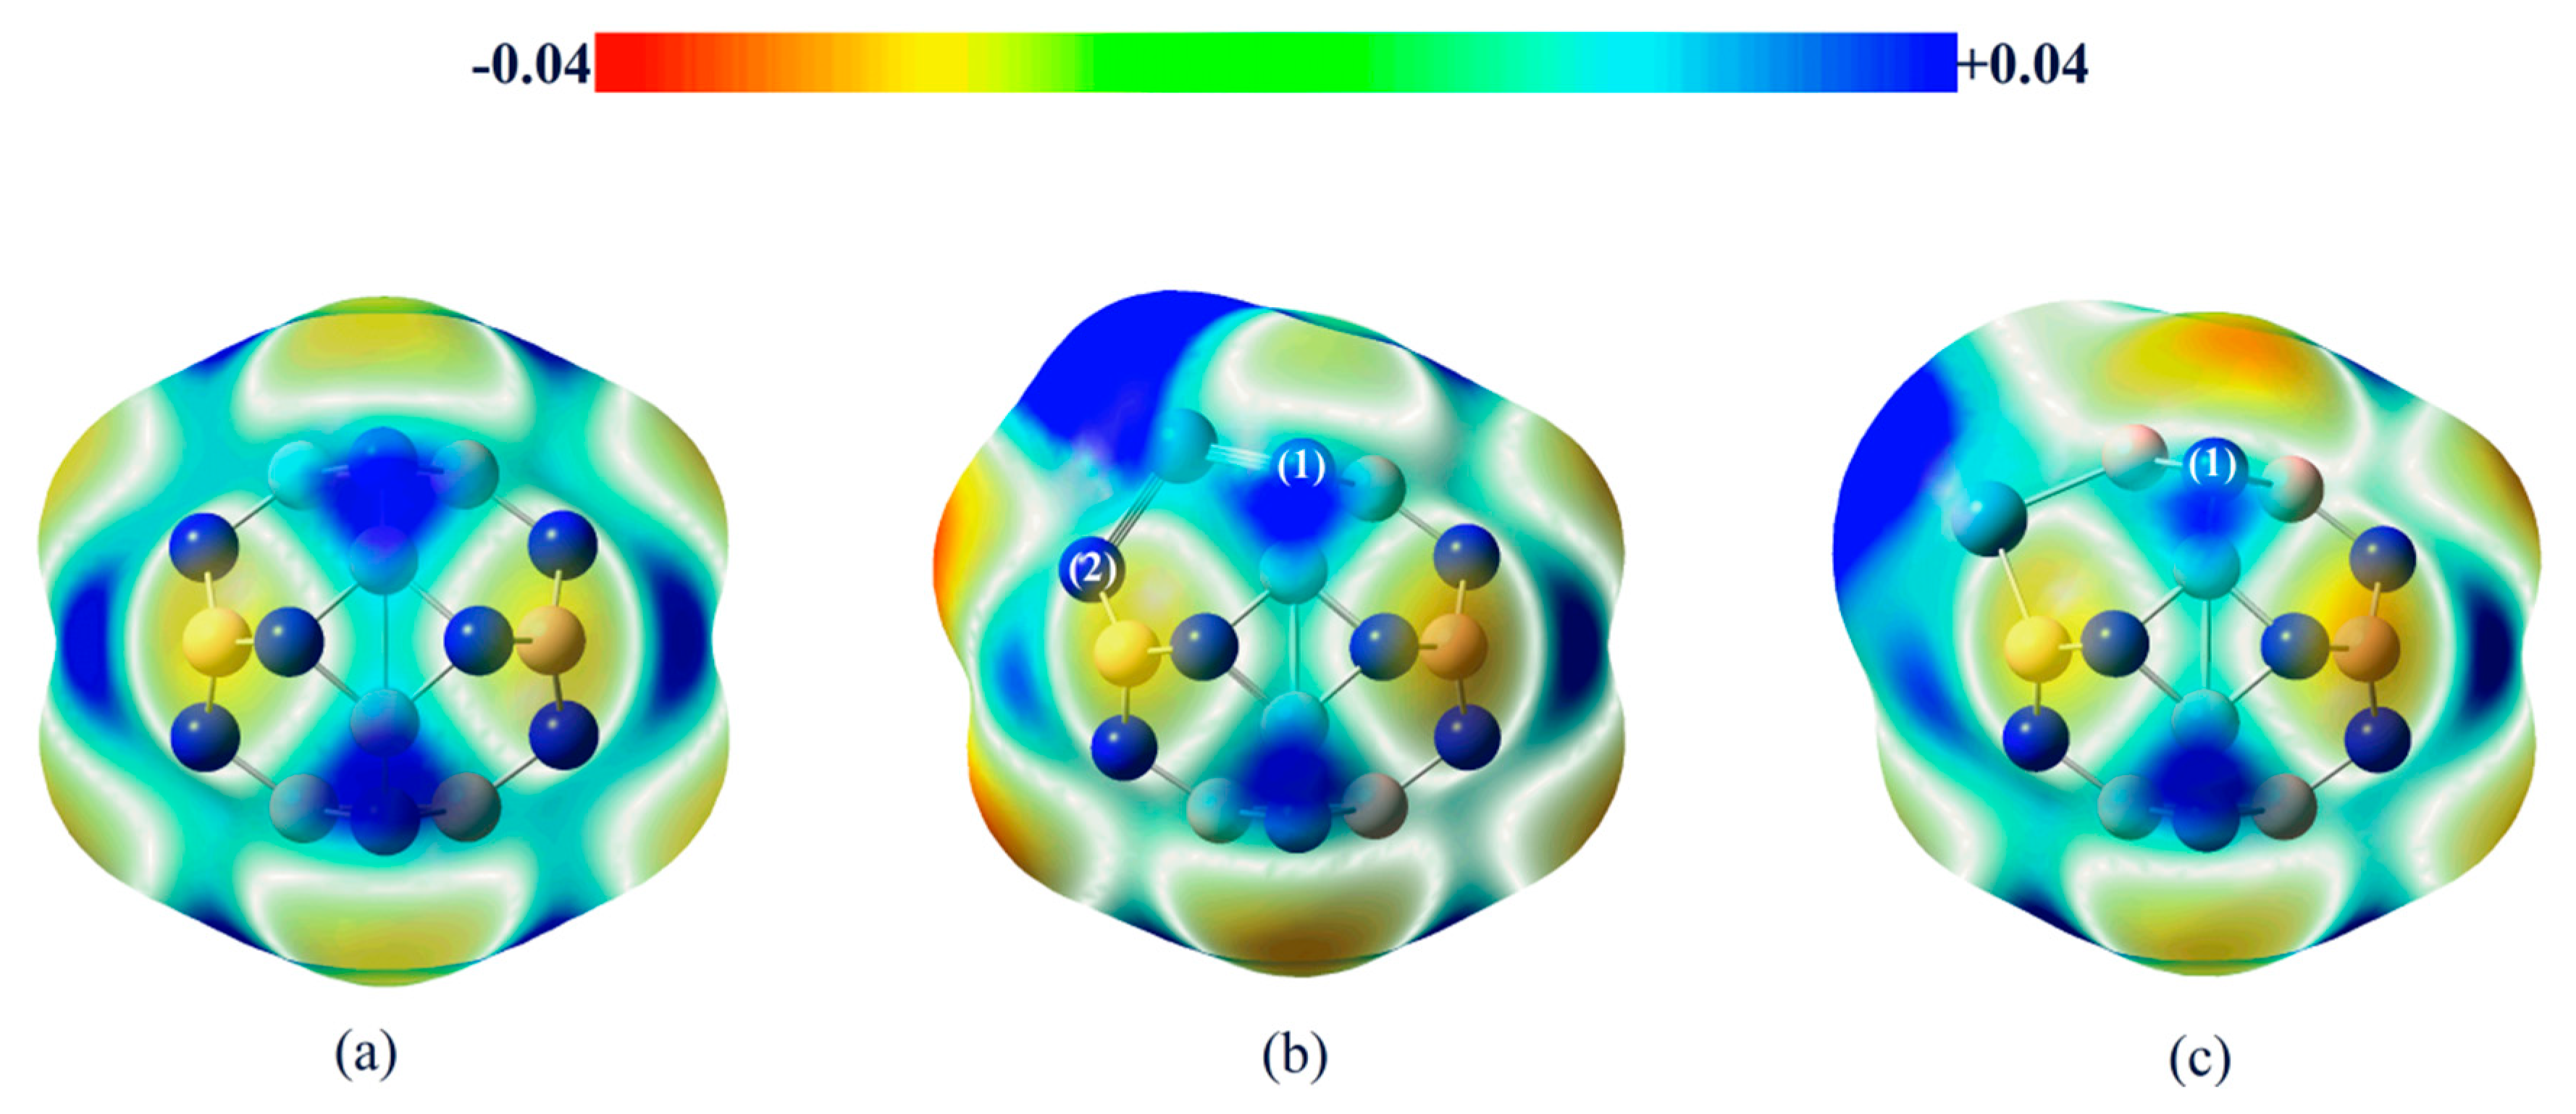
2.1. Structure Optimisation of the Reactants
2.2. Adsorption of C2H2 and H2 onto BN Fullerene or the BN-Ni Cluster
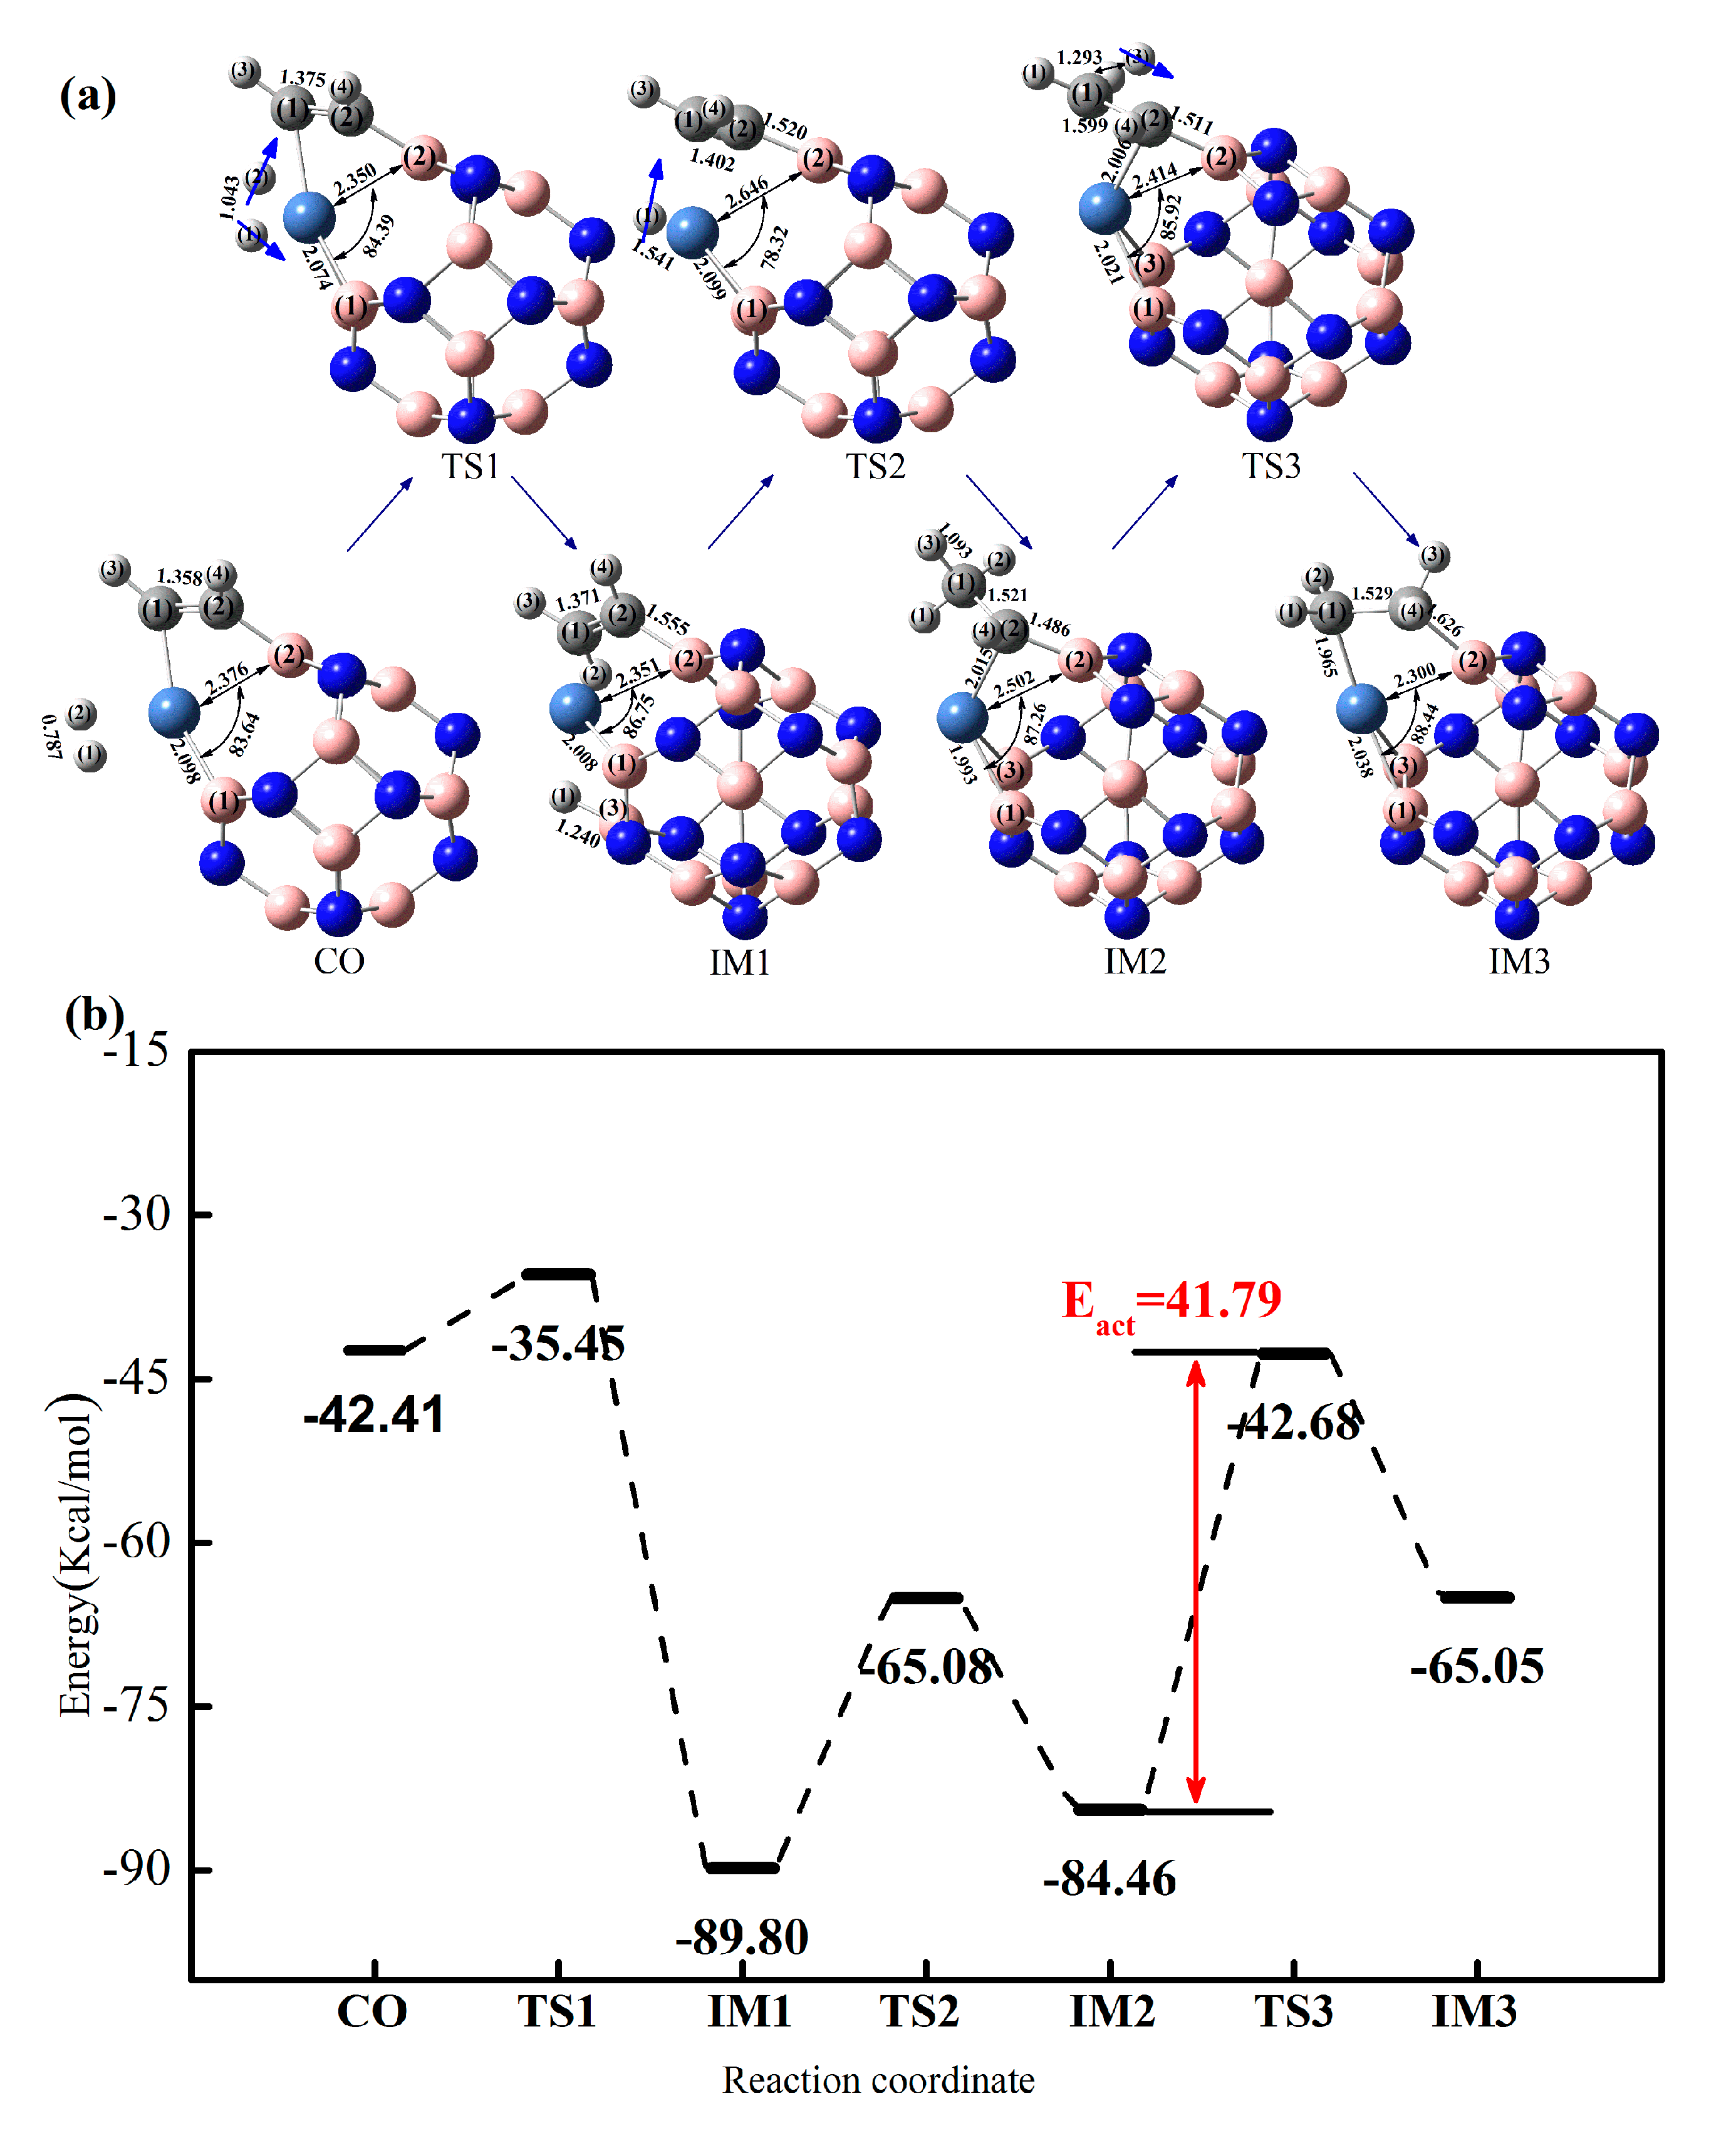
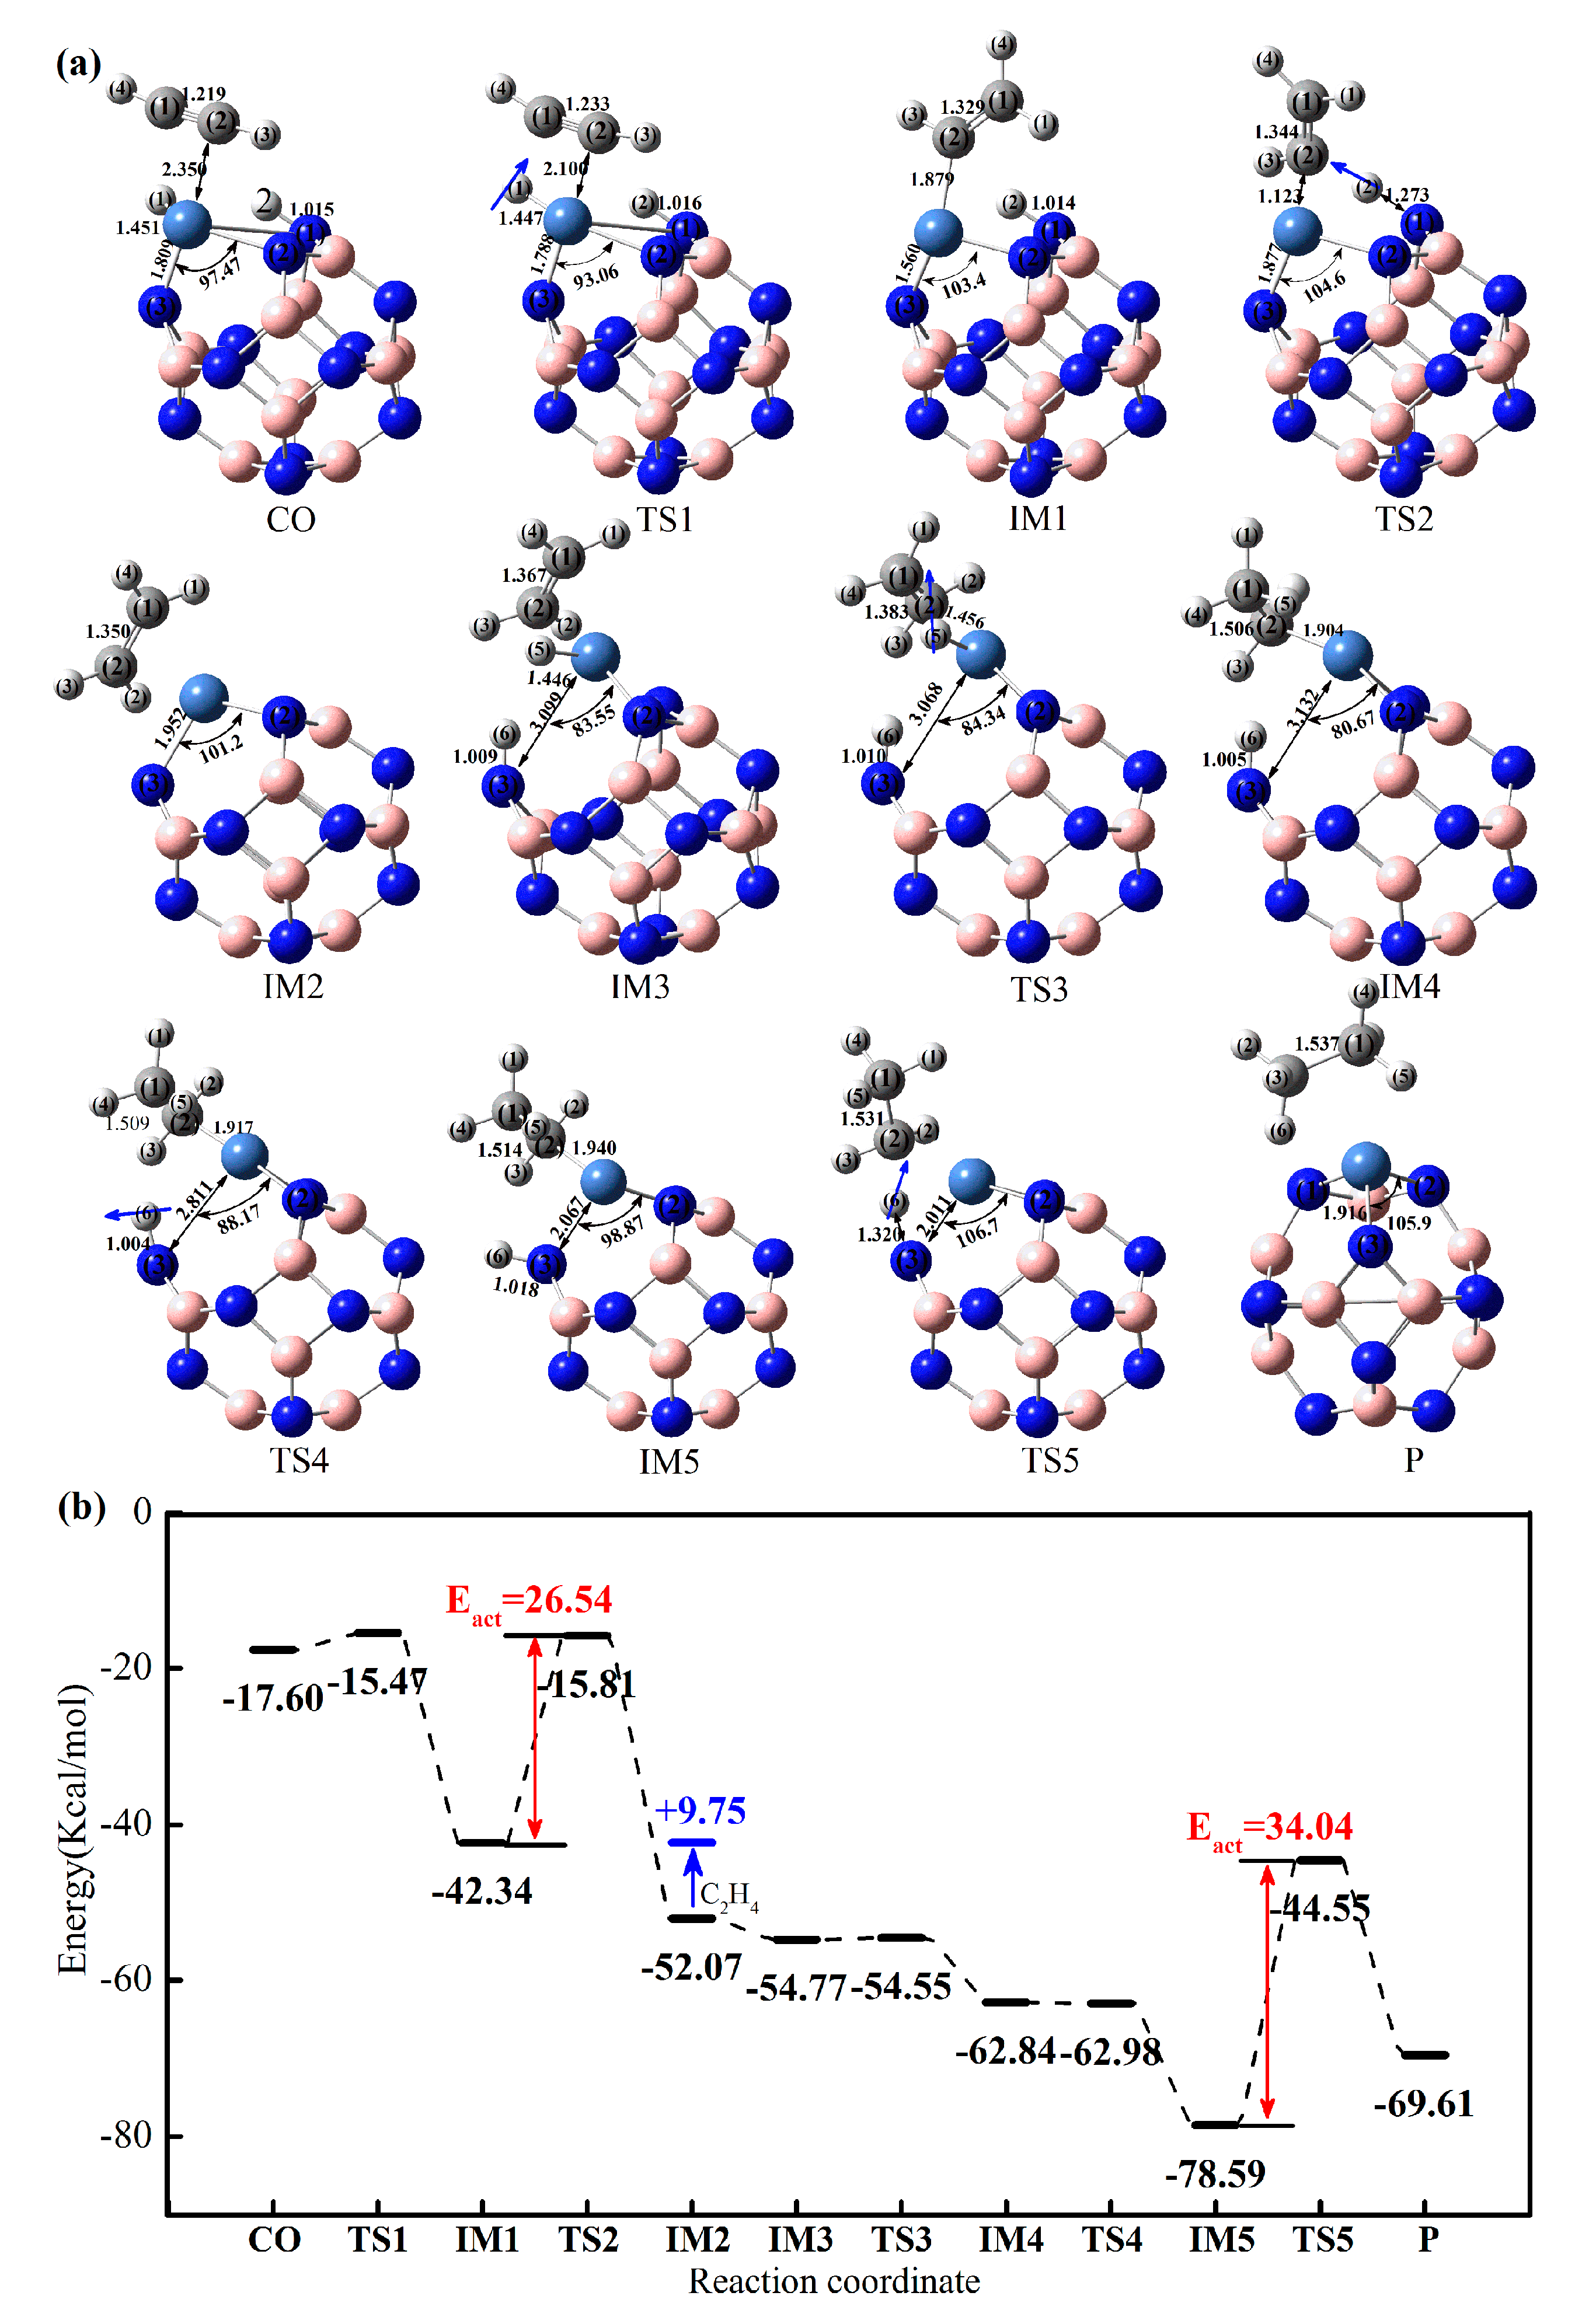
2.3. Acetylene Selective Hydrogenation Reaction Mechanism
2.3.1. Effect of Co-Adsorption Structure on Hydrogenation of Acetylene to Ethylene
2.3.2. Effect of Different Ni-Doped Catalysts on the Acetylene Hydrogenation Activity
2.3.3. Selectivity of Acetylene Hydrogenation to Ethylene
3. Computational Methods
4. Conclusions
Supplementary Materials
Author Contributions
Funding
Conflicts of Interest
References
- Lindlar, V.H. Lindlar Ein neuer Katalysator für selektive Hydrierungen. Helv. Chim. Acta 1952, 35, 446–450. [Google Scholar] [CrossRef]
- Borodziński, A.; Geoffrey, C.B. Selective hydrogenation of ethyne in ethene-rich streams on palladium catalysts. Part 1. Effect of changes to the catalyst during reaction. Catal. Rev. 2006, 48, 91–144. [Google Scholar] [CrossRef]
- Zhao, Y.; Zhu, M.; Kang, L. The DFT study of Si-doped Pd6Si clusters for selective acetylene hydrogenation reaction. J. Mol. Graph. Model. 2018, 83, 129–137. [Google Scholar] [CrossRef] [PubMed]
- Zhao, Y.; Zhao, F.; Kang, L. Catalysis of the acetylene hydrochlorination reaction by Si-doped Au clusters: A DFT study. J. Mol. Model. 2018, 24, 61. [Google Scholar] [CrossRef] [PubMed]
- Zhou, H.; Yang, X.; Li, L.; Liu, X.; Huang, Y.; Pan, X.; Wang, A.; Li, J.; Zhang, T. PdZn intermetallic nanostructure with Pd–Zn–Pd ensembles for highly active and chemoselective semi-hydrogenation of acetylene. ACS Catal. 2016, 6, 1054–1061. [Google Scholar] [CrossRef]
- Zhang, Q.; Li, J.; Liu, X.; Zhu, Q. Synergetic effect of Pd and Ag dispersed on Al2O3 in the selective hydrogenation of acetylene. Appl. Catal. A Gen. 2000, 197, 221–228. [Google Scholar] [CrossRef]
- Studt, F.; Frank, A.P.; Thomas, B.; Rasmus, Z.S.; Claus, H.C.; Jens, K.N. On the role of surface modifications of palladium catalysts in the selective hydrogenation of acetylene. Angew. Chem. Int. Ed. 2008, 47, 9299–9302. [Google Scholar] [CrossRef]
- Shin, E.W.; Chang, H.C.; Ki, S.C.; Yoon, H.N.; Sang, H.M. Properties of Si-modified Pd catalyst for selective hydrogenation of acetylene. Catal. Today 1998, 44, 137–143. [Google Scholar] [CrossRef]
- McCue, A.J.; James, A.A. Recent advances in selective acetylene hydrogenation using palladium containing catalysts. Front. Chem. Sci. Eng. 2015, 9, 142–153. [Google Scholar] [CrossRef]
- Hageluken, C. Markets for the catalyst metals platinum, palladium and rhodium. Metall 2006, 60, 31. [Google Scholar]
- Janet, K.; Christine, M.; Detlef, K.; Mangelsdorf, I. Palladium—A review of exposure and effects to human health. Int. J. Hyg. Environ. Health 2002, 205, 417–432. [Google Scholar] [CrossRef]
- Qiao, B.; Wang, A.; Yang, X.; Allard, L.F.; Jiang, Z.; Cui, Y.; Liu, J.; Li, J.; Zhang, T. Single-atom catalysis of CO oxidation using Pt 1/FeO x. Nat. Chem. 2011, 3, 634. [Google Scholar] [CrossRef] [PubMed]
- Wang, A.; Li, J.; Zhang, T. Heterogeneous single-atom catalysis. Nat. Rev. Chem. 2018, 2, 65–81. [Google Scholar] [CrossRef]
- Huang, X.; Xia, Y.; Cao, Y.; Zheng, X.; Pan, H.; Zhu, J.; Ma, C.; Wang, H.; Li, J.; You, R.; et al. Enhancing both selectivity and coking-resistance of a single-atom Pd1/C3N4 catalyst for acetylene hydrogenation. Nano Res. 2017, 10, 1302–1312. [Google Scholar] [CrossRef]
- Yu, Z.; Mingyuan, Z.; Lihua, K. The DFT Study of Single-Atom Pd 1/gC 3 N 4 Catalyst for Selective Acetylene Hydrogenation Reaction. Catal. Lett. 2018, 148, 2992–3002. [Google Scholar] [CrossRef]
- Zhou, S.; Shang, L.; Zhao, Y.; Shi, R.; Waterhouse, G.I.; Huang, Y.C.; Zheng, L.; Zhang, T. Pd Single-Atom Catalysts on Nitrogen-Doped Graphene for the Highly Selective Photothermal Hydrogenation of Acetylene to Ethylene. Adv. Mater. 2019, 31, 1900509. [Google Scholar] [CrossRef]
- Gong, W.; Kang, L. BNPd single-atom catalysts for selective hydrogenation of acetylene to ethylene: A density functional theory study. R. Soc. Open Sci. 2018, 5, 171598. [Google Scholar] [CrossRef]
- Ronnie, V.T.; Karoliina, H.; Søren, D.; Ebbe, K.V.; Joachim, S.; Erik, L.; Bjerne, S.C.; Jens, K.N.; Flemming, B. Controlling the catalytic bond-breaking selectivity of Ni surfaces by step blocking. Nat. Mater. 2005, 4, 160. [Google Scholar] [CrossRef]
- Ronnie, V.T.; Karoliina, H.; Søren, D.; Ebbe, K.V.; Joachim, S.; Erik, L.; Bjerne, S.C.; Jens, K.N.; Flemming, B. Ethylene dissociation on flat and stepped Ni (1 1 1): A combined STM and DFT study. Surf. Sci. 2006, 600, 66–77. [Google Scholar] [CrossRef]
- Mueller, J.E.; Adri, C.V.D.; William, A.G. Structures, energetics, and reaction barriers for CH x bound to the nickel (111) surface. J. Phys. Chem. C 2009, 113, 20290–20306. [Google Scholar] [CrossRef]
- Ledoux, M.J.; Pham-Huu, C. Carbon nanostructures with macroscopic shaping for catalytic applications. Catal. Today 2005, 102, 2–14. [Google Scholar] [CrossRef]
- Stephan, O.; Bando, Y.; Loiseau, A.; Willaime, F.; Shramchenko, N.; Tamiya, T.; Sato, T. Formation of small single-layer and nested BN cages under electron irradiation of nanotubes and bulk material. Appl. Phys. A Mater. 1998, 67. [Google Scholar] [CrossRef]
- Strout, D.L. Structure and stability of boron nitrides: Isomers of B12N12. J. Phys. Chem. A 2000, 104, 3364–3366. [Google Scholar] [CrossRef]
- Koi, N.; Takeo, O. Hydrogen storage in boron nitride and carbon clusters studied by molecular orbital calculations. Solid State Commun. 2004, 131, 121–124. [Google Scholar] [CrossRef]
- Takeo, O.; Atsushi, N.; Ichihito, N. Formation and atomic structure of B12N12 nanocage clusters studied by mass spectrometry and cluster calculation. Sci. Technol. Adv. Mater. 2004, 5, 635. [Google Scholar] [CrossRef]
- Takeo, O.; Ichihito, N.; Atsushi, N. Synthesis, atomic structures, and electronic states of boron nitride nanocage clusters and nanotubes. Mater. Manuf. Process. 2004, 19, 1215–1239. [Google Scholar] [CrossRef]
- Hongyu, W.; Xiaofeng, F.; Jer-Lai, K. Metal free hydrogenation reaction on carbon doped boron nitride fullerene: A DFT study on the kinetic issue. Int. J. Hydrogen Energy 2012, 37, 14336–14342. [Google Scholar] [CrossRef]
- Rad, A.S.; Khurshid, A. Enhancement in hydrogen molecule adsorption on B12N12 nano-cluster by decoration of nickel. Int. J. Hydrogen Energy 2016, 41, 22182–22191. [Google Scholar] [CrossRef]
- Zhao, F.; Wang, Y.; Zhu, M.; Kang, L. C-doped boron nitride fullerene as a novel catalyst for acetylene hydrochlorination: A DFT study. RSC Adv. 2015, 5, 56348–56355. [Google Scholar] [CrossRef]
- Frisch, M.J.; Trucks, G.W.; Schlegel, H.B.; Scuseria, G.E.; Robb, M.A.; Cheeseman, J.R.; Scalmani, G.; Barone, V.; Mennucci, B.; Petersson, G.A.; et al. Gaussian 09; Revision, A.1; Gaussian, Inc.: Wallingford, CT, USA, 2009. [Google Scholar]
- Becke, A.D. Density-functional exchange-energy approximation with correct asymptotic behavior. Phys. Rev. A 1988, 38, 3098. [Google Scholar] [CrossRef]
- Chengteh, L.; Weitao, Y.; Robert, G.P. Development of the Colle-Salvetti correlation-energy formula into a functional of the electron density. Phys. Rev. B 1988, 37, 785. [Google Scholar] [CrossRef]
- Becke, A.D. Density-functional thermochemistry. III. The role of exact exchange. J. Chem. Phys. 1993, 98, 5648. [Google Scholar] [CrossRef]
- Stephens, P.J.; Devlin, F.J.; Chabalowski, C.F.N.; Frisch, M.J. Ab initio calculation of vibrational absorption and circular dichroism spectra using density functional force fields. J. Phys. Chem. 1994, 98, 11623–11627. [Google Scholar] [CrossRef]
- Vosko, S.H.; Leslie, W.; Marwan, N. Accurate spin-dependent electron liquid correlation energies for local spin density calculations: A critical analysis. Can. J. Phys. 1980, 58, 1200–1211. [Google Scholar] [CrossRef]
- Timothy, C.; Jayaraman, C.; Günther, W.S. Paul Von Ragué Schleyer Efficient diffuse function-augmented basis-sets for anion calculations. 3. The 3-21+G basis set for 1st-row elements, Li-F. J. Comp. Chem. 1983, 4, 294–301. [Google Scholar] [CrossRef]
- Petersson, A.; Bennett, A.; Tensfeldt, T.G.; Al-Laham, M.A.; Shirley, W.A.; Mantzaris, J. A complete basis set model chemistry. I. The total energies of closed-shell atoms and hydrides of the first-row elements. J. Chem. Phys. 1988, 89, 2193–2218. [Google Scholar] [CrossRef]
- Hay, P.J.; Willard, R.W. Ab initio effective core potentials for molecular calculations. Potentials for the transition metal atoms Sc to Hg. J. Chem. Phys. 1985, 82, 270–283. [Google Scholar] [CrossRef]
- Willard, R.W.; Hay, P.J. Ab initio effective core potentials for molecular calculations. Potentials for main group elements Na to Bi. J. Chem. Phys. 1985, 82, 284–298. [Google Scholar] [CrossRef]
- Hay, P.J.; Willard, R.W. Ab initio effective core potentials for molecular calculations. Potentials for K to Au including the outermost core orbitals. J. Chem. Phys. 1985, 82, 299–310. [Google Scholar] [CrossRef]
- van Duijneveldt, F.B.; van Duijneveldt-van de Rijdt, J.G.; van Lenthe, J.H. State of the art in counterpoise theory. Chem. Rev. 1994, 94, 1873–1885. [Google Scholar] [CrossRef]
- Stefan, G.; Antony, J.; Ehrlich, S.; Krieg, H. A consistent and accurate ab initio parametrization of density functional dispersion correction (DFT-D) for the 94 elements H-Pu. J. Chem. Phys. 2010, 132, 154104. [Google Scholar] [CrossRef]
- Carlos, G.; Bernhard, H.S. An improved algorithm for reaction path following. J. Chem. Phys. 1989, 90, 2154–2161. [Google Scholar] [CrossRef]
- Carlos, G.; Bernhard, H.S. Reaction path following in mass-weighted internal coordinates. J. Phys. Chem. 1990, 94, 5523–5527. [Google Scholar] [CrossRef]
- Lu, T.; Chen, F. Multiwfn: A multifunctional wavefunction analyzer. J. Comput. Chem. 2012, 33, 580–592. [Google Scholar] [CrossRef]
- Lu, T.; Chen, F. Calculation of Molecular Orbital Composition. Acta Chim. Sin. 2011, 69, 2393–2406. [Google Scholar]
- Iurô, H.; Polanyi, M. Exchange reactions of hydrogen on metallic catalysts. Trans. Faraday Soc. 1934, 30, 1164–1172. [Google Scholar] [CrossRef]
- Rao, D.M.; Sun, T.; Yang, Y.S.; Yin, P.; Pu, M.; Yan, H.; Wei, M. Theoretical study on the reaction mechanism and selectivity of acetylene semi-hydrogenation on Ni–Sn intermetallic catalysts. Phys. Chem. Chem. Phys. 2019, 21, 1384–1392. [Google Scholar] [CrossRef]
- Rao, D.M.; Zhang, S.T.; Li, C.M.; Chen, Y.D.; Pu, M.; Yan, H.; Wei, M. The reaction mechanism and selectivity of acetylene hydrogenation over Ni–Ga intermetallic compound catalysts: A density functional theory study. Dalton Trans. 2018, 47, 4198–4208. [Google Scholar] [CrossRef]
- Abdollahi, T.; Davood, F. Activity and selectivity of Ni nanoclusters in the selective hydrogenation of acetylene: A computational investigation. C. R. Chim. 2018, 21, 484–493. [Google Scholar] [CrossRef]


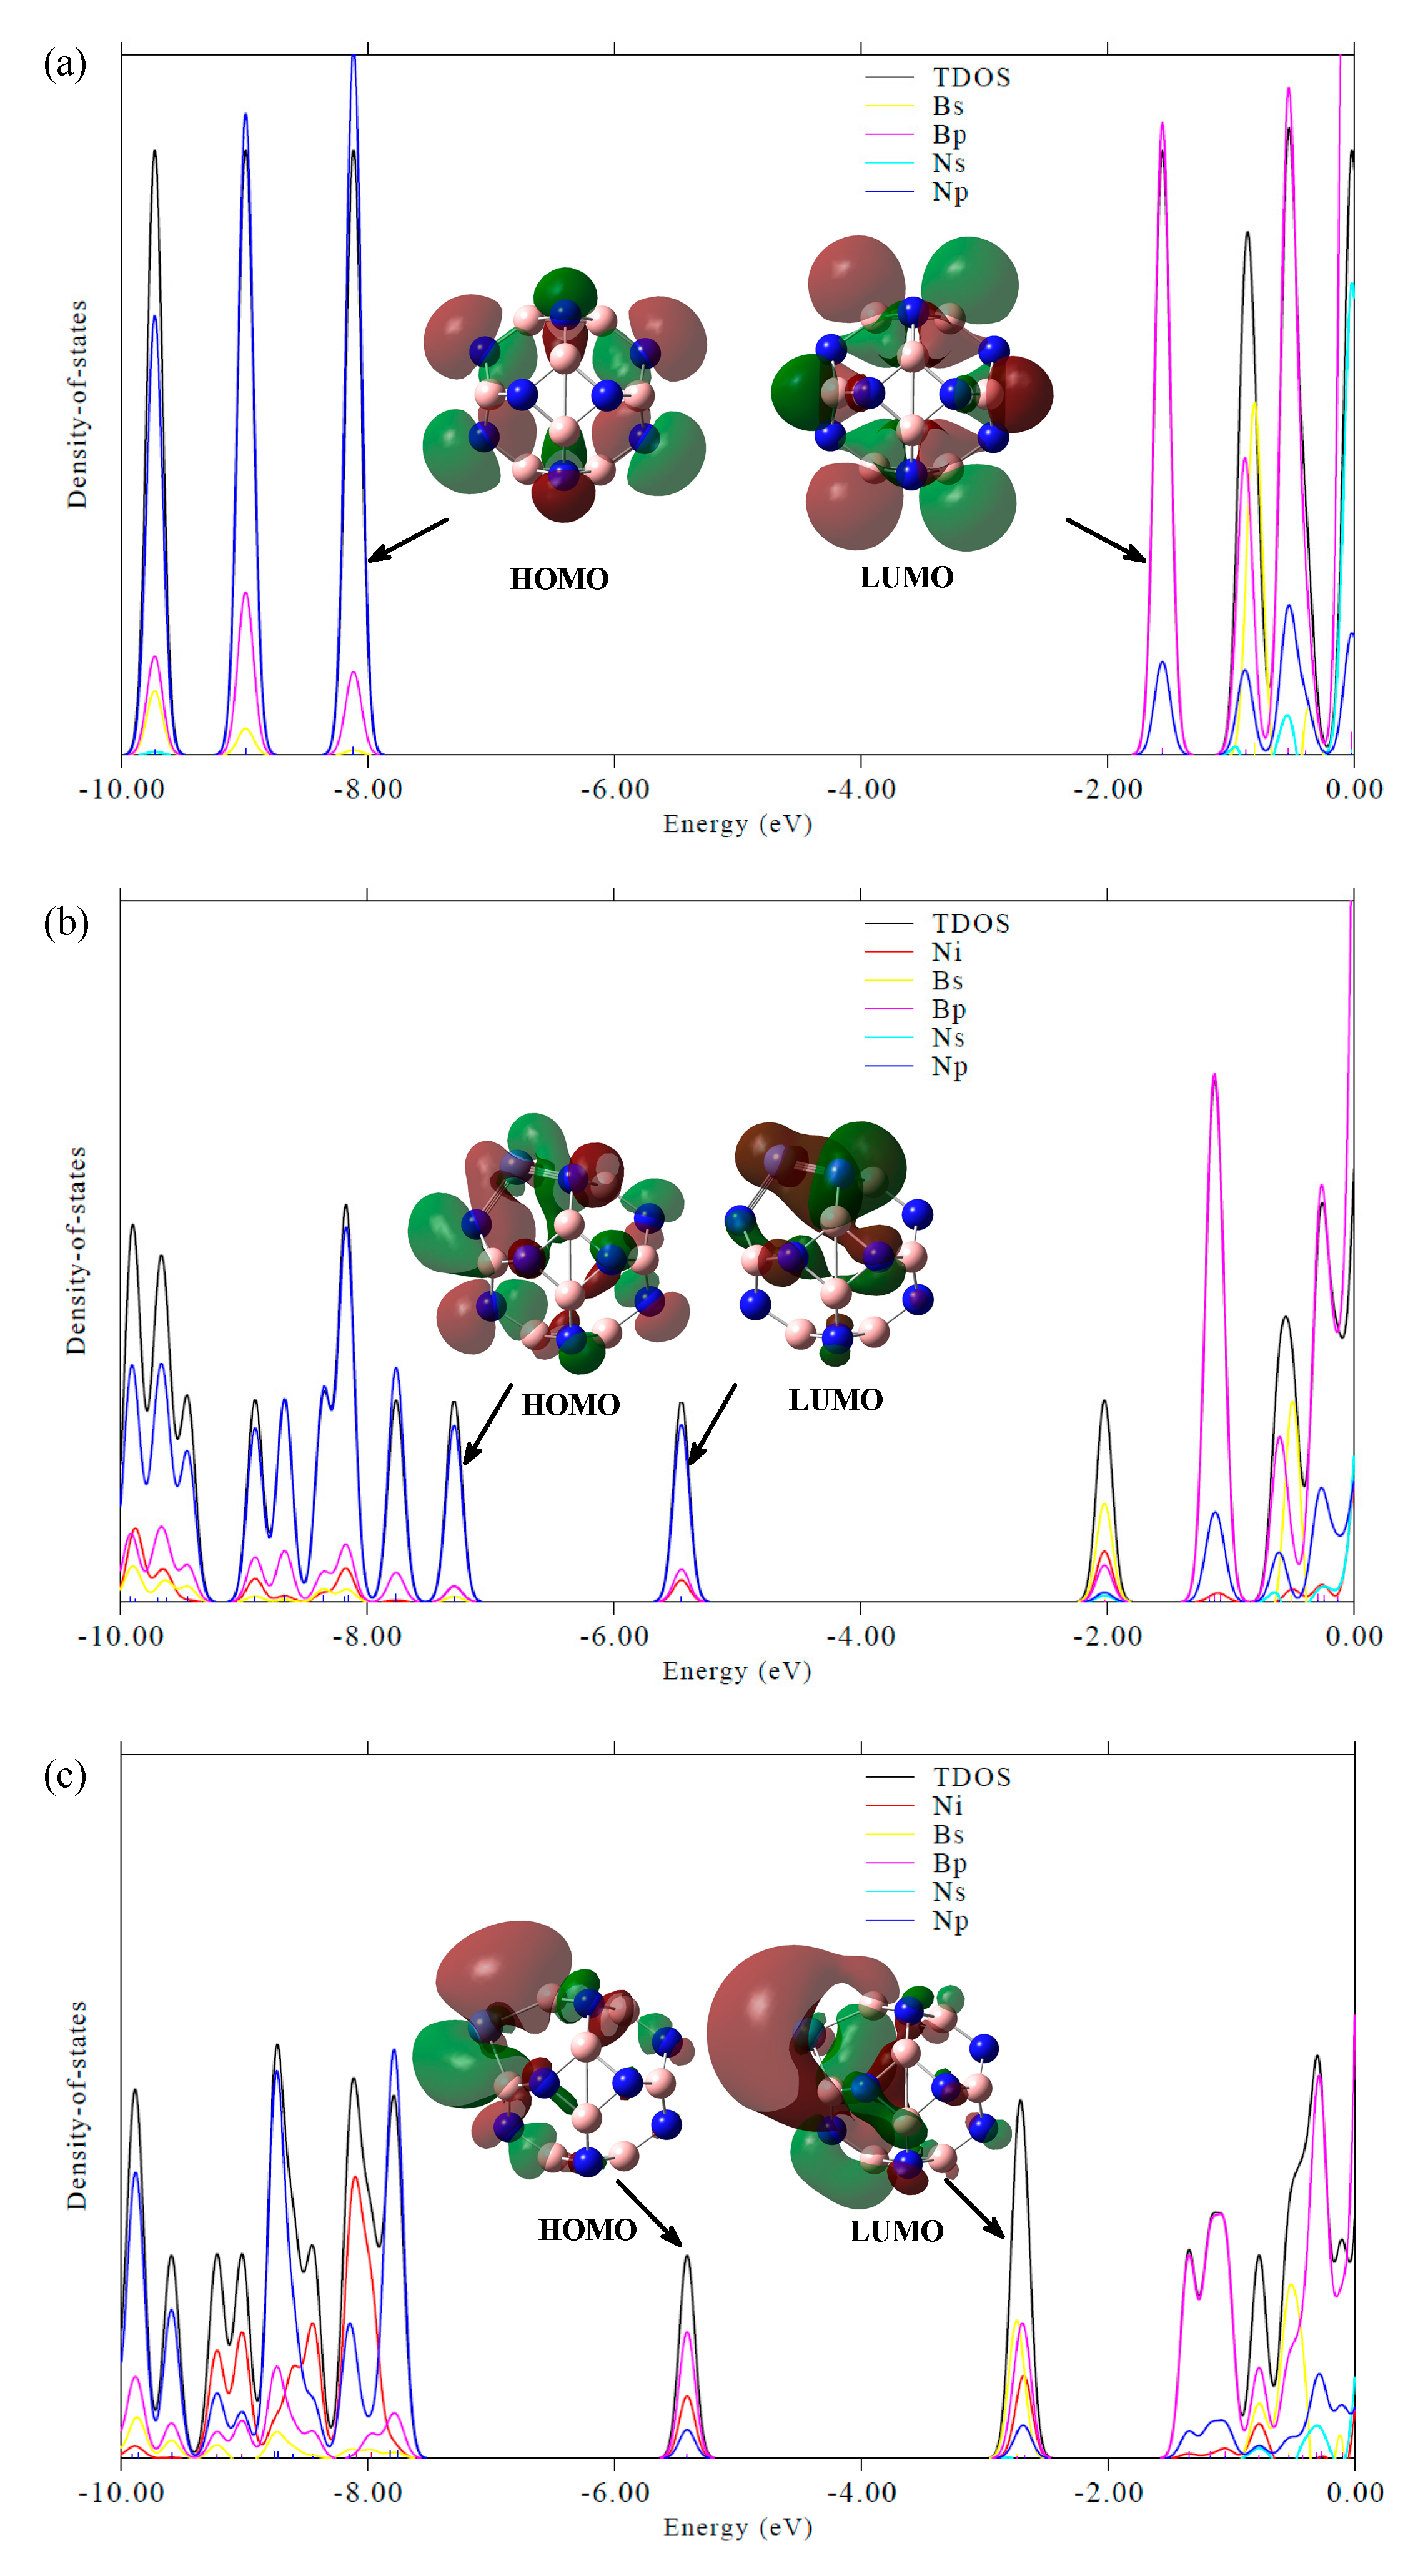
| HOMO | LUMO | ΔEg | |
|---|---|---|---|
| B12N12 | −7.95 | −1.24 | 6.72 |
| B11N12Ni | −7.08 | −5.11 | 1.97 |
| B12N11Ni | −5.18 | −2.52 | 2.66 |
| B12N12 | B11N12Ni | B12N11Ni | |
|---|---|---|---|
| C2H2 | −2.83 | −11.92 | −40.40 |
| H2 | −0.05 | −1.90 | −4.28 |
| Catalyst | Eethylene barrier | Selectivity | B12N11Ni |
|---|---|---|---|
| B11N12Ni | 26.54 | 24.29 | This work |
| B12N11Ni | 28.17 | 17.49 | This work |
| Ni3Sn | 42.43 | 12.91 | [29] |
| Ni3Sn3 | 12.22 | 3.23 | [29] |
| NiGa(111) | 24.44 | 14.53 | [30] |
| Ni6 | 22.60 | 15.35 | [31] |
| B11N12Pd | 26.55 | 12.80 | [12] |
© 2020 by the authors. Licensee MDPI, Basel, Switzerland. This article is an open access article distributed under the terms and conditions of the Creative Commons Attribution (CC BY) license (http://creativecommons.org/licenses/by/4.0/).
Share and Cite
Wang, Y.; Kang, L. Selective Hydrogenation of Acetylene Catalysed by a B12N12 Cluster Doped with a Single Nickel Atom: A DFT Study. Catalysts 2020, 10, 115. https://doi.org/10.3390/catal10010115
Wang Y, Kang L. Selective Hydrogenation of Acetylene Catalysed by a B12N12 Cluster Doped with a Single Nickel Atom: A DFT Study. Catalysts. 2020; 10(1):115. https://doi.org/10.3390/catal10010115
Chicago/Turabian StyleWang, Yun, and Lihua Kang. 2020. "Selective Hydrogenation of Acetylene Catalysed by a B12N12 Cluster Doped with a Single Nickel Atom: A DFT Study" Catalysts 10, no. 1: 115. https://doi.org/10.3390/catal10010115
APA StyleWang, Y., & Kang, L. (2020). Selective Hydrogenation of Acetylene Catalysed by a B12N12 Cluster Doped with a Single Nickel Atom: A DFT Study. Catalysts, 10(1), 115. https://doi.org/10.3390/catal10010115