Article

When Is Green Too Rosy? Evidence from a Laboratory Market Experiment on Green Goods and Externalities

by
Maria Eduarda Fernandes
1 and
Marieta Valente
2,*
1
School of Technology and Management, and CARME, Polytechnic Institute of Leiria, R. Gen. Norton de Matos, 2411-901 Leiria, Portugal
2
NIPE and EEG, Universidade do Minho, R. Bairro do Sol 4, 4710-057 Braga, Portugal
*
Author to whom correspondence should be addressed.
Games 2018, 9(3), 70; https://doi.org/10.3390/g9030070
Submission received: 25 May 2018 / Revised: 6 September 2018 / Accepted: 11 September 2018 / Published: 14 September 2018
(This article belongs to the Special Issue Public Good Games)

Abstract

:
In a context where sustainable consumption and production need to be encouraged, economic experiments can provide significant insights into how individuals consider environmental externalities in their choices and how public policy can foster the environmental public good. Experimental studies aiming to evaluate market mitigation of externalities through the provision of green goods usually choose to adopt neutral language in terms of framing. Our study implements an incentivized economics experiment to explore how supply and demand consider negative externalities. Furthermore, the study addresses the impact of using non-abstract wording when describing negative externalities. Two types of goods can be produced and bought, namely goods generating negative externalities on other consumers (either labelled as B or brown) and goods that cause no harm to others (either labelled A or green). We conclude that the provision of green goods increases from 18.1% in the abstract frame to 70% in the environmental frame. Framing is, therefore, a relevant variable for the outcome of this experimental market. This has important implications for economic experiments aiming to evaluate pro-environmental behaviours and provide policy orientations for the provision of green goods.

1. Introduction

Sustainable consumption and production are challenges to be tackled within the broad debate about promoting more sustainable choices in markets. Standard economic theory identifies externalities in production as a market failure that can be corrected by regulators through the price mechanism [1,2]. Alternatively, if consumers care about the negative impacts on the environment caused by their choices, they may also make more pro-environmental choices of consumption and, thus, lead to the voluntary internalization of externalities. One mechanism for this is to choose green goods, which produce lower environmental damage. Economic experiments can contribute to exploring the potential of green goods to minimize environmental externalities and can provide significant insights into how individuals consider environmental externalities in their choices and how public policy can foster the environmental public good.
Green goods, within the framework of Lancaster’s theory of value [3], combine attributes from private goods, but also public good attributes corresponding to lower externalities [4,5]. To promote sustainability, public policy can, thus, aim to make choices by consumers greener in general and foster green consumption through green goods and eco-labels [6,7]. There are nowadays several examples of green goods or services, which generate less environmental damage at some stage of the production process or throughout the life-cycle of goods. For example in France and in the U.K., several energy providers offer the option of electricity produced from 100% renewable energy sources [8,9]. Organic farming uses less polluting production methods and is growing steadily on the demand and supply side in terms of different food items [10]. Some services also offer greener options such as carbon-neutral flights which offset carbon emissions from flying [11].
For green goods to be a solution to externalities, consumers need to care for the wellbeing of others who are potentially impacted by their less environmentally friendly consumption choices. There is empirical evidence concerning the demand for green goods and ethical goods in general, and, in particular, in surveys, respondents express support for environmentally friendly alternatives. For example, the European-wide survey of public opinion reports that 89% of respondents agree that “buying environmentally-friendly products can make a difference to the environment” [12]. However, when looking at actual behavior, there is what has been called an attitude–behaviour gap or green gap (e.g., [13,14,15]). Actual purchases make green goods still part of a niche market. In Europe, only one fifth to one quarter of respondents indicated that they actually bought green goods in the previous month [12,16].
Economic experiments have been widely designed and implemented to study different aspects of prosocial behaviour and can, thus, provide a controlled framework to explore actual behaviours when it comes to choices with negative impacts on others. Incentivized choices made in economic experiments mean that participants face a monetary cost to engage in prosocial behaviour. Therefore, the exploration of prosocial and pro-environmental consumption choices can greatly benefit from the randomized control afforded by economic experiments, as well as the monetarily incentivized nature of the choices made. This paper reports on an experiment where consumers and firms interact in a market where goods can cause negative externalities on consumers, or not, depending on consumption and production choices. This is a market where green goods are possible. Within this setup we explore to what extent market participants care about negative externalities due to their choices and if green goods can be a solution to the externality market failure.
While some economic experiments have been designed to study the potential of green goods and ethical goods markets and institutional arrangements to reduce the externality market failure [17,18,19,20,21], the setup for these experiments is devoid of environmental context. Considering the potential interest and relevance of experimental results for green goods markets for policy design, using neutral language for the instructions may then raise questions about external validity, as context-free experimental markets are quite different from what participants would find in real context markets for green goods. Alekseev, Charness, and Gneezy [22] argued that when the social aspect of decisions is relevant, opting for an abstract frame does not allow subjects to take into account in their decisions’ social considerations that they would otherwise.
In the present paper, we design two treatments which differ in terms of framing. If we want to argue that economic experiments can help assess the potential of market participants on both sides to internalize externalities and contribute to the environmental public good, we need to test how framing impacts experimental results. Only then, can researchers use experimental setups to test policy designs. The current paper presents a laboratory experiment for a market where both green (non-polluting) and brown (polluting) goods may be traded, depending on consumers’ and producers’ preferences, and compare results when a neutral or an environmental frame are used. In theory, if economic agents care about the negative externalities of their choices, then the framing should not matter for experimental market outcomes and how experimental subjects make choices. However, if framing is itself consequential, then it should be acknowledged as a variable.
A brief discussion of framing in economic experiments is presented in Section 2. This contributes to identifying the value added by the paper in terms of the literature on framing within economic experiments. The experimental framework and procedures of our study are presented in Section 3 and the results obtained are described in Section 4. The last section of the paper discusses the implications of our experimental results and conclusions.

2. Framing within Economic Experiments

Smith’s [23] recommendation for avoiding introducing realism in laboratory experimental instructions to guarantee experimenter control has been truly incorporated in the majority of economic experiments since then. Framing itself did not represent a variable of interest under traditional neoclassical models, only the incentives provided by the institutions under study mattered. As a consequence, the use of neutral language and context-free designs continue to be a gold standard for laboratory experiments in economics.
However, several studies have explored framing as a treatment variable and questioned where it is in fact innocuous. Tversky and Kahneman [24,25], for instance, highlighted the fact that, although a rational decision should not change because of its framing, the truth is that if the same problem is set in a different perspective, it might influence subjects’ decision. These authors presented a variety of preference reversals examples from their experiments, depending on the framing of acts, contingencies, or outcomes.
Vernon Smith himself has questioned his own premise about the context irrelevance assumption for economic experiments. Smith [26] inferred that subjects participating in neutral language experiments necessarily create their own context for the structure being presented, which is different from individual to individual and based on their own personal past experience. Context variation in ultimatum and dictator games as cited by Smith [26] may vary the experimental results significantly. This goes in line with one of the arguments used by Levitt and List [27] to criticize laboratory experiments in economics and advocate the use of field experiments, at least to complement results obtained in the laboratory. These authors considered that the particular context and process by which a decision is embedded is as important for human decisions as their monetary payoff, and not totally controlled by the experimenter. Harrison and List [28] had already used similar arguments in favor of field instead of laboratory experiments, considering that introducing participants to neutral context experiments could result in less rather than more control of the experiment. Results from Engel and Rand [29] for Prisoner’s Dilemma laboratory experiments corroborated this argument. The authors concluded that subjects construct their own mental model, even when neutral language is used during the experimental sessions to make participants focus their attention on the payoff structure.
Other experimental studies tested the impact of using different instructions framing, for various settings and purposes. Alekseev et al. ([22], p. 49) conducted a selective analysis of experimental economics papers where contextual instructions are manipulated, noting however they “did not attempt to cover every existing paper that systematically varies context in economics studies” but rather “provide a summary that illustrates the main usages of context and its effect on participants’ behaviour over a wide range of scenarios”. They concluded that there is no “one case fits all”, as some experimental studies see their results affected by the use of a different language whereas others not. Alekseev et al. [22] concluded that the appropriateness of using neutral language depends on the goal of each study but highlight that the impact of instructions’ framing should be recognized.
However, Alekseev et al. [22] also mentioned that for cases where the social aspect is important, not using a language close to reality may jeopardize laboratory experiments’ validity and interest, because neutral language does not allow subjects to take into account in their decisions social considerations that they would otherwise. This conclusion is corroborated by laboratory experiments that had an environmental problem as a motivation (as is the case of those run by Cason and Raymond [30], Cookson [31], Pevnitskaya and Ryvkin [32], and Raymond and Cason [33]). These authors considered the framing of instructions as a research variable and found it to be statistically significant, leading to individuals’ shifts in preferences. Under a theory of framing, subjects’ preferences related to the methods used to measure or observe them.
Previous experimental studies aiming to study the efficiency of the market for goods generating externalities or not (brown and green goods, respectively) used mainly neutral language and a setup devoid of an environmental context. This type of option aims to reduce influences in decisions due to complex or emotionally charged terminology, rather than the incentives associated with the payoff structure, outlined by Holt [34]. Bartling et al. [18], for instance, used the term “unfair” and “fair” to refer to the goods causing or not an externality, respectively, which may not be considered neutral language. However, as framing was not their research variable these authors did not test if the results would differ using a more neutral language in the instructions. Furthermore, other economic experiments, as is the case of Etilé and Teyssier [35], Rode, Hogarth and Le Menestrel [36], and Valente [37], explored the potential role of ethical goods in markets to promote prosocial behaviour but did not test the impact of framing on the results.
Considering the potential interest and relevance of experimental results for green goods markets for policy indications, using neutral language for the instructions may then raise questions about their external validity. Our paper, thus, fills a gap in the experimental economics literature on pro-environmental behaviour in that it explicitly tests the effects of framing and wording and how this conditions the conclusions that can be used for policy design purposes. The current paper presents a laboratory experiment for a market where both green (non-polluting) and brown (polluting) goods may be traded, depending on preferences of market participants, and compares the results when a neutral or an environmental frame is used, such as classifying goods as “A” or “B” versus “green” or “brown” respectively. This means we are not considering the framing cases Cartwright [38] commented on but simply turning the usual aseptic environment of the laboratory experiments into a more realistic one.
The current paper intends to contribute to this discussion about the influence of framing on laboratory experiments results. Our experimental design allows us to evaluate whether individuals’ prosocial preferences in relation to externalities vary when using neutral versus non-neutral language in the instructions. This goes in line with Harrison and List [28] recommendation for using abstract and less abstract instructions in laboratory experiments to evaluate if context could make a difference for the market outcome. By exclusively varying the wording of the instructions (Complete version of the instructions for both treatments in Appendix A and Appendix B), i.e., the labelling of the goods being traded in the market, and maintaining all the economic variables and payoff structure, our research variable is precisely the context of the experiment presented to participants. Having one experimental treatment with a more abstract setting concerning externalities and another employing a context-rich language, we contribute with additional evidence and arguments for the theory of framing. Additionally, given the focus on the selling and purchase of goods that can generate externalities or not, we enrich the debate about the potential limitations and contributions for policy design from abstract and context-free vs. framed experiments about green goods.

3. Experimental Framework and Procedures

A laboratory market was implemented where two types of goods were available, one that causes negative externalities (on other players) and another that does not. Our experimental setting represented a posted-offer market where the type of good proposed by firms was truthfully revealed, so actual externalities imposed were also known with certainty at the end of each period (round) in the market. Two experimental treatments were run, to evaluate participants’ social preferences and if these vary under different framing: the NEUTRAL FRAME and the ENVIRONMENTAL FRAME treatments. All else being equal, the two experimental settings differed in the labelling of goods being traded, and in the manner the externality was presented to participants in the instructions, as illustrated on the excerpt of Table 1. Goods were referred to as A and B for the NEUTRAL FRAME or green and brown for the ENVIRONMENTAL FRAME treatment. Furthermore, in the ENVIRONMENTAL FRAME treatment, the environment was explicitly mentioned and the negative externality presented as a negative impact on other players and akin to a negative impact on the environment. In the NEUTRAL FRAME, the negative externality was only presented as causing a negative impact on others. In both cases, the difference between the two goods was presented in terms of different production costs and the imposition (or not) of external costs on others.
Parameters used in the market with six participants (three buyers and three sellers) are summarized in Table 2. Buyers buy at most one unit per period and receive the same payoff (100) for either a green (A) or brown (B) good bought. Thus, we opted for homegrown rather than induced preferences, as the same value was given to green (A) and brown (B) goods. A different valuation for these goods depended on the utility from causing no externality on others. This procedure has been adopted in several experimental treatments to evaluate the existence of social preferences in buyer and seller markets [18,35,36,37].
Additionally, buyers could choose from which producer to purchase their good and were aware that whenever a unit of a brown (B) good was purchased a negative externality of 20 was caused, implying a 10 points loss on each of the other two buyers in the market, in both treatments.
Sellers could end up supplying all the units being demanded in the market, although they can only produce one type of good in each period, either green (A) or brown (B). A competitive market was implemented, where sellers were free to propose goods that differ in their type and price and were able to offer all units being demanded in the market. Therefore, buyers were not forced to accept a less attractive offer due to supply restrictions (and were free not to buy at all).
When a seller sold a unit, it incurred a production cost of 50 (experimental points) for a green (A) good or 40 if the good is brown, and no costs were incurred if he did not sell. At the beginning of the experiment, firms were given 400 experimental points, whereas buyers were given 20 experimental points in each round. While this was equivalent in terms of payoffs, buyers were assured an income in each round even if they chose not to make a purchase. Parameters are summarized in Table 2.
Both treatments represented a market with twenty rounds including three sequential stages in each round. In stage 1, firms chose to produce A or B and set the price. In stage 2, buyers saw the proposals from the three firms and decided from whom to purchase one unit or whether not to make a purchase. In stage 3, participants were informed about the choices and all transactions made in the market. At the end of the twenty rounds actual payoffs, including externalities, were calculated and a summary display revealed to all participants. Experimental points were then converted at a conversion rate of 100 experimental points = £1.75 and earnings were privately announced.
Experimental sessions for the treatment NEUTRAL FRAME and ENVIRONMENTAL FRAME were run in February and June 2015, at the Experimental Economics Laboratory of Royal Holloway, University of London (U.K.) using Z-tree [39]. Eighty-four subjects took part (Table 3) in the study, and each subject participated in one treatment only in a fixed group (three sellers and three buyers) and fixed role.
The usual protocol and procedures for laboratory experiments were respected [40]. Each experimental session started with a private reading of the instructions by all participants for both roles, an oral summary of the instructions and some practice questions to verify if all instructions were understood. Only after the actual experiment began, were participants informed of the role (randomly determined) they would play for twenty rounds.
A short questionnaire was also filled in by each participant at the end of the twenty-round market experiment, concerning the participant socioeconomic background and questions about environmental and ethical consumption choices (including a question based on the Eurobarometer [16] about engagement in environmentally motivated actions).
Sessions lasted approximately one hour and thirty minutes and subjects earned on average £14.66, which were paid immediately at the end of the session.

4. Results

In this section we present the experimental results obtained in the two treatments and explore how the framing of the experiment impacts market outcomes. We then focus on the supply and demand sides of the market. These results help us understand whether in a market where green goods coexist with brown goods, the voluntary internalization of negative (environmental) externalities is possible and how widespread it is.

4.1. Market Outcomes

We started by presenting the share of green and brown goods traded in the market (Table 4), for pooled market/period observations and then disaggregated this data and analyzed sellers’ announcements per period and per market (Figure 1, Figure 2 and Figure 3). Prices paid for goods being traded in the market were also analyzed for both treatments, as well as profits of sellers and buyers.
In the NEUTRAL FRAME treatment, 31.9% of the 480 producer proposals were for green goods while the remainder was for brown goods. As for the ENVIRONMENTAL FRAME treatment, only 31.1% of the producer proposals were for brown goods, whereas 68.9% of the announcements were for green goods in this treatment. It is clear, therefore, the existence of a statistically significant difference between the announcements of green goods in each market per period in NEUTRAL FRAME and ENVIRONMENTAL FRAME treatments, confirmed by the non-parametric rank–sum test (Wilcoxon–Mann–Whitney test z = −8.534, p = 0.0000; please note that all WMW tests are for pooled market/period observations).
As Figure 1 illustrates, the number of sellers announcing green goods is always higher in the ENVIRONMENTAL FRAME treatment than in the NEUTRAL FRAME treatment. This difference is even more salient if we recall that the number of groups participating in the ENVIRONMENTAL FRAME treatment (six) was smaller than in the NEUTRAL FRAME treatment (eight) and, consequently, the maximum green announcements in the former was less than in the latter (eighteen versus twenty-four). Figure 1b illustrates that difference in relative terms. On the other hand, there are clear differences in Period 1 already.
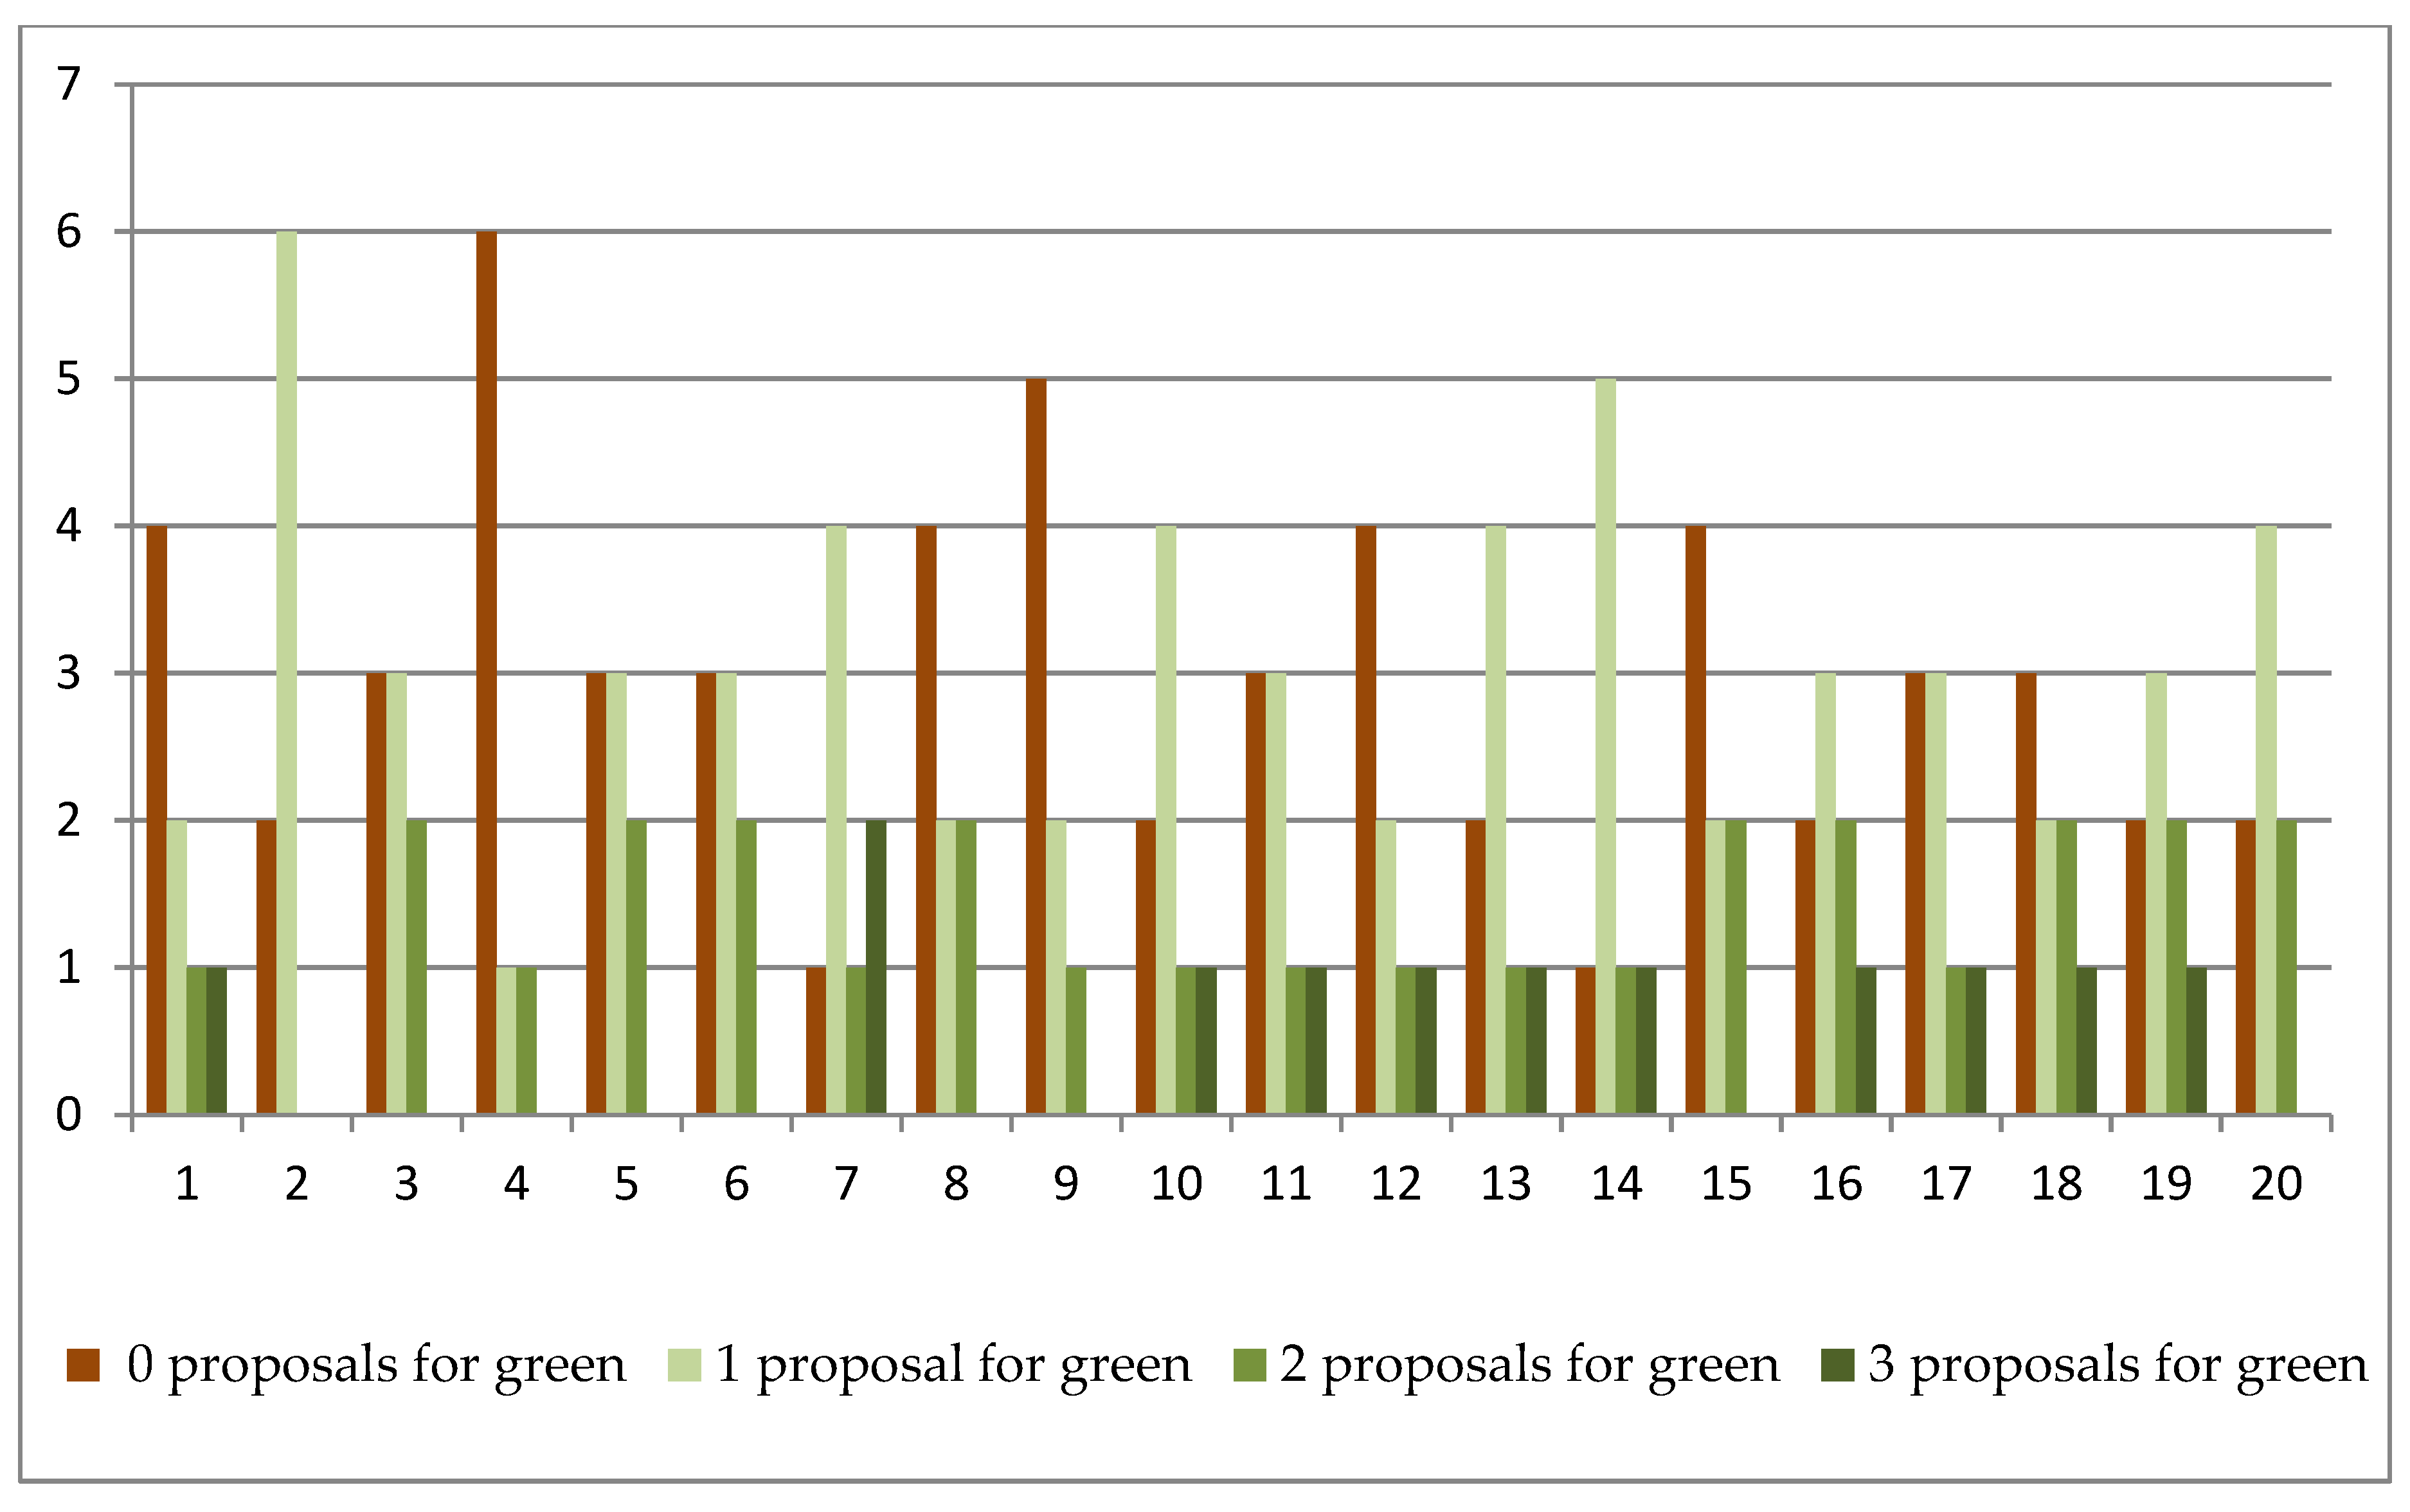
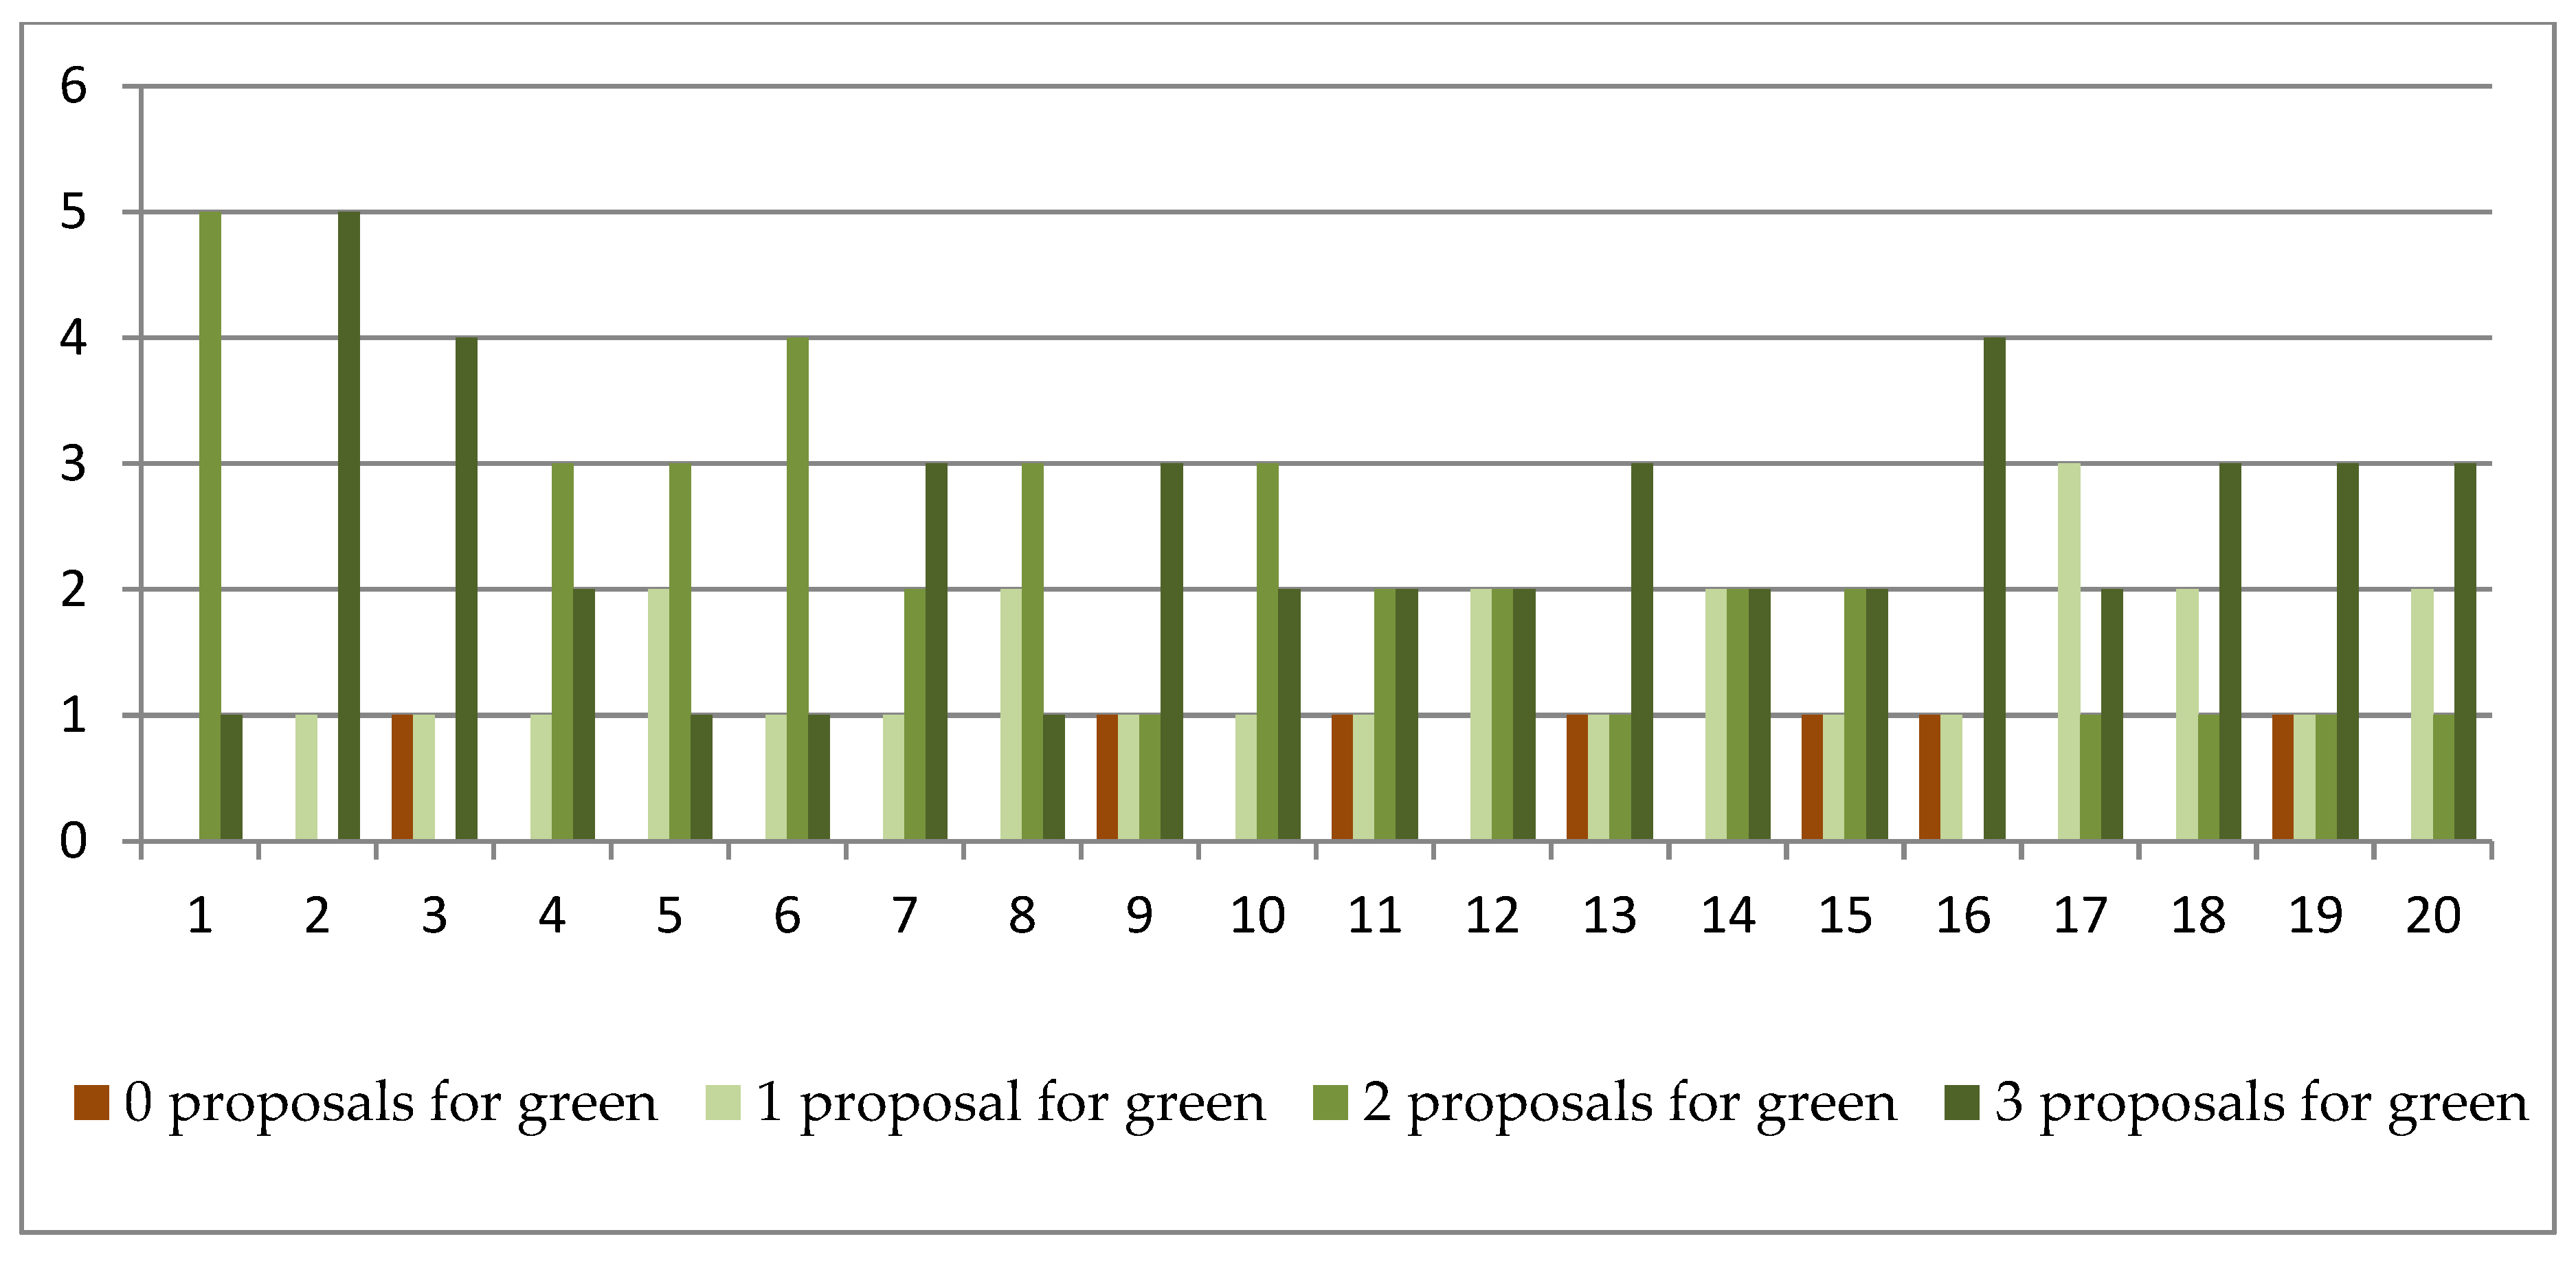
Looking at the disaggregated data on sellers’ announcements per group (market) and per period (Figure 2 and Figure 3) it is clear again the difference between the two treatments. In the ENVIRONMENTAL FRAME treatment there were several periods with the three sellers in the group announcing green (on period 2, for instance, five out of the six groups announce only green), whereas in the NEUTRAL FRAME treatment the opposite situation occurs, with no green goods being offered in several groups (on period 4, six out of the eight groups announce only brown). This means that in those periods/groups buyers would either buy nothing or they were forced to buy green in the ENVIRONMENTAL FRAME treatment and brown in the NEUTRAL FRAME treatment, as those were the unique type of goods being offered.
Turning now to the number of green units effectively sold, the difference between treatments, was even higher, with only 18.1% of market share for green goods in the NEUTRAL FRAME treatment against 70% in the ENVIRONMENTAL FRAME treatment (Table 4), which is a clear and statistically significant difference (Wilcoxon–Mann–Whitney test z = −9.907, p < 0.01).
In terms of mean prices paid for green and brown goods in both treatments, these were similar for brown goods, but in the ENVIRONMENTAL FRAME treatment, mean price paid for green goods was higher than in the NEUTRAL FRAME treatment (Table 5). The latter is a statistically significant difference confirmed by the non-parametric rank–sum test (Wilcoxon–Mann–Whitney test z = −3.906, p < 0.01), while using the same statistical test we confirm that there are no statistically significant differences between the prices paid for brown goods in the two treatments (Wilcoxon–Mann–Whitney test z = −1.318, p = 0.1874).
Although both green and brown goods have the same private value for consumers, buyers were paying a price premium for green goods in both treatments, as there is a statistically significant difference between the price paid for green and brown goods (Wilcoxon–Mann–Whitney test z = 12.614 and z = 14.013, p < 0.01 for NEUTRAL FRAME treatment and ENVIRONMENTAL FRAME, respectively). However, this price premium does not translate to higher profit for sellers who sell green goods neither in the NEUTRAL FRAME nor in the ENVIRONMENTAL FRAME treatment. When comparing firms’ profits for green and brown goods we conclude there is no statistical significant difference in the ENVIRONMENTAL FRAME treatment (Wilcoxon–Mann–Whitney test z = 0.618, p = 0.5368) and for the NEUTRAL FRAME treatment the difference is statistically significant but with the opposite signal, which means sellers earn less when selling greens than when selling browns (Wilcoxon–Mann–Whitney test z = −4.760, p = 0.0000). This is because the price premium buyers are paying to buy green, in the NEUTRAL FRAME treatment, is not enough to cover the higher costs of producing green (+10 experimental points) instead of brown (price premium= mean price of green goods–mean price of brown goods = 53.3 − 44.2 = 9.1).
Sellers’ and buyers’ earnings are statistically significantly different in the two treatments. Sellers’ earnings are higher in the ENVIRONMENTAL FRAME treatment (Wilcoxon–Mann–Whitney test z = 2.325, p < 0.05) but for buyers the opposite occurs, with earnings higher in the NEUTRAL FRAME than in the ENVIRONMENTAL FRAME, as confirmed by the two-sample Wilcoxon–Mann–Whitney rank–sum test (z = 13.018, p = 0000). However, also in both treatments, buyers’ profits are different for the two types of goods, with earnings from the purchase of brown goods higher than those with the purchase of green goods (Wilcoxon–Mann–Whitney test z = 21.786, p = 0000). Results are confirmed, and the conclusion remains if running this test separately for each treatment (z = 12.413 and z = 13.564, p = 0000 for the NEUTRAL FRAME and the ENVIRONMENTAL FRAME treatments, respectively).
Considering the differences just mentioned in the two experimental treatments on the market share, price paid, or buyers’ profits for the green goods, we will now look to the behaviour of both sides of the market separately, to try to identify potential reasons for the different prosocial preferences either for firms or consumers.

4.2. Supply Side Behaviour

Starting with the supply side of the market, we now compare the probability of a firm selling any good in both treatments. We consider the impact of the sellers’ own proposed price, how the proposed price compares relative to the lowest price in the market (lowest competitors’ price), whether the proposed good is green (green good proposed) and the reputation effect. As it was possible for buyers to follow the behaviour of each of the sellers throughout the 20 periods of the session (because they were paired into fixed groups, as mentioned before), we consider the possibility of reputation effects to emerge. For that, we computed how the sum of the times a seller proposed a green good in the market up to a certain period (own reputation) related to the reputation of the greenest competitor in terms of proposals (variable relative green reputation). A positive relative green reputation means the seller announced green goods more often than competitors, whereas a negative value implies that at least one other seller in the market has a greener reputation. Table 6 presents the results from a panel data Logit model that regresses the probability of selling in a particular period on this relative reputation measure. We included in the regression also sellers’ own proposed price, how the proposed price compares relative to the lowest price in the market (variable lowest competitors’ price) and whether the proposed good is green (variable green good proposed). A dummy variable was also created for all those components, to evaluate the treatment effect on the probability of selling at least one unit.
According to Table 6, the probability of selling in a given period depends, as expected, negatively on the price proposed and positively on the competitors’ price, for both experimental treatments. Additionally, proposing a green good and having proposed more green goods than competitors up to a particular period (relative green reputation) increases the probability of selling in that period. When considering the treatment effect, however, we conclude that in the ENVIRONMENTAL FRAME treatment buyers are not as sensitive to price as in the NEUTRAL FRAME treatment. On the other hand, proposing a green good in the market and having a positive relative green reputation increases the probability of selling in both treatments, although for the ENVIRONMENTAL FRAME treatment the former is more relevant than the later. Finally, as we can see from the ENVIRONMENTAL FRAME dummy variable, the probability of selling at least one unit is greater for the firms in treatment ENVIRONMENTAL FRAME than in the NEUTRAL FRAME treatment.
Considering the fact that offering green goods in the market increased firms’ probability of selling and that for the ENVIRONMENTAL FRAME treatment greens proposals are much higher than in the NEUTRAL FRAME treatment (as illustrated in Figure 1, Figure 2 and Figure 3), we tested for the probability of different green announcements to depend differently of the environmental consciousness of sellers in both treatments. For that, we created an indicator variable (variable Environmental Consciousness) from three questions that were part of the questionnaire at the end of the experiment. These questions were based on the Eurobarometer [16] about engagement in environmentally motivated actions. The question is formulated as follows “Have you done any of the following activities during the past month for environmental reasons” with yes/no responses and includes the following behaviours: “separated most of my waste for recycling”; “Cut down my energy consumption (e.g., turning down air-conditioning or heating, not leaving appliances on stand-by, buying energy saving light bulbs)”, and “reduced the consumption of disposable items (plastic bags, certain kind of packaging, etc.)”. A subject was classified as environmentally conscious if they indicated to have engaged in the past month in three actions for environmental reasons.
As we can see from Table 7, the probability of announcing green in the market does not depend on the environmental consciousness of the sellers in the experiments, but the probability of announcing green is higher in the ENVIRONMENTAL FRAME, as we had already concluded. Therefore, it is not subjects’ characteristics that explain the different behaviour registered on the supply side of the market in both treatments but the different context under which their decisions were made.

4.3. Demand Side Behaviour

On the demand side of the market we have already identified the existence of prosocial preferences in both experimental treatments because, as we have seen before (Table 5), consumers pay a price premium for green goods, even if they have exactly the same private value as brown goods (100 experimental points). We now analyse the probability of buying green goods considering their availability in the market (sellers’ announcements for green), price as well as the price of brown goods, the number of green units bought by the other consumers in the previous market, and control for the impact of subjects’ environmental consciousness and treatment effect. Results for a random effects logit regression of green choice is presented in Table 8.
As it becomes clear from results in Table 8, choosing green goods does not depend on the greenness of the market announcements neither on subjects’ environmental consciousness. Additionally, behaviour of the other buyers in the market in previous periods in terms of green goods purchased it is not relevant for subjects’ choices. The probability of buying green depends only on the price being charged for green and brown goods and on the experimental treatment. In the ENVIRONMENTAL FRAME treatment, the probability of choosing green is higher than in the NEUTRAL FRAME treatment.

5. Discussion and Conclusions

The present economic experiment addresses negative externalities associated with market decisions of production and consumption. In the two experimental treatments, a negative externality is similarly parametrized in terms of payoff impacts but is differently presented in terms of framing and context in the instructions. The results indicate that the context presented to participants in the laboratory experiment, through instructions wording, matters and influences subjects’ behaviour.
The market output in the two experimental treatments was statistically significantly different, with a result much closer to the social optimum (all greens outcome) under the ENVIRONMENTAL FRAME treatment than with the NEUTRAL FRAME treatment. This result was the consequence of varying exclusively the context presented to participants. The NEUTRAL FRAME treatment used neutral language to present the market for green and brown goods, calling them A and B, respectively, and the ENVIRONMENTAL FRAME treatment labelled the goods precisely as green and brown. Besides the difference in the labelling of goods in these two treatments, the negative externality was also presented differently to participants: As a negative impact to the other buyers in the market in both experimental treatments, but in the ENVIRONMENTAL FRAME treatment subjects were told that brown goods harms the environment, which is why other consumers in the experiment are harmed.
In the ENVIRONMENTAL FRAME treatment, both the intention (announcements) of selling green goods and the green goods effectively traded in the market were higher than in the NEUTRAL FRAME treatment. Buyers paid a price premium for green goods in both treatments, but this was smaller than the additional cost of production in the NEUTRAL FRAME. In fact, buyers’ earnings were higher in the NEUTRAL FRAME than in the ENVIRONMENTAL FRAME, which seems to indicate that when the negative externality is presented as also having a negative impact on the environment, a more altruistic behaviour arises, and subjects give up some of their earnings in favor of a social (environmental) cause. Consequently, more green units were sold in the market, with a higher price premium, which represented a higher profit for sellers in the ENVIRONMENTAL FRAME treatment.
The present work aimed at contributing to the ongoing methodological discussion about the usual procedure of using neutral framing in economic experiments, as currently, this is not a consensual option, in particular in what concerns prosocial behaviour. This study adds arguments to the literature that considers framing as a relevant research variable for experimental studies, as the market outcome we obtained was sensitive to the introduction of a more realistic experimental context, revealing a significant influence of the wording used to describe the experiment. The question now is if this is something undesirable and should be avoided in experimental studies about environmental questions or, on the contrary, an indication that neutral language is not appropriate for this type of study.
According to Alekseev et al. [22], for external validity purposes and environmental policy guidance, laboratory experiments aiming to evaluate prosocial behaviour should not use neutral framing. Following this argument, if the objective is to evaluate voluntary approaches to solve environmental problems given their public good nature, by voluntarily internalizing negative externalities, subjects’ behaviour in the laboratory under a context-rich environment would certainly be closer to the one in the field. Therefore, economic experiments using non-abstract contexts can be more realistic and informative than if an abstract frame is used.
However, when analyzing the results from the present experiment more thoroughly, we argue that some caution should be taken in this kind of generalization, in particular when designing laboratory experiments to test issues related with green markets or other environmental matters. In the context-rich treatment, ENVIRONMENTAL FRAME, results show strong prosocial preferences and behaviours, which we interpret as “too green” to be real when compared to real-life consumption decisions. As with Pevnitskaya and Ryvkin [32], we conclude that including an environmental context in the experiment results in a higher manifestation of preferences for externality reduction than under a neutral context treatment.
When confronting the results with empirical evidence, the NEUTRAL FRAME results are more in line with real market shares for green goods. In fact, in spite of widespread support in surveys for pro-environmental consumption choices, actual purchases make green goods still part of a niche market [14]. As a consequence, a more realist setup in terms of results to explore the potential of green goods to promote the environmental public good is to use more neutral language. Going back to the original recommendation by Smith [23], in this case, abandoning the neutral frame leads to much “rosier” conclusions as to the potential internalization of externalities through green consumerism. This can lead to an overestimation of the potential of supply and demand to promote the public good.
Therefore, Smith’s [23] recommendation to use more abstract or neutral wording in the instructions should remain in practice if laboratory results are supposed to serve for policy guidance about real market outcomes for green goods and have external validity. Subjects’ behaviour is different when evoking environmental impacts, with much more prosocial behaviour within the experiment, than when the wording only evokes the damage done to other experimental participants. It should, however, be noted that it does not necessarily follow from this experiment that other experiments involving environmental matters should opt for an abstract frame. We can speculate that for issues involving prosocial behaviour, which is sensitive to experimental context effects [41], a more abstract frame can provide more realistic results, but do not claim to generalize this to other environmental issues.

Author Contributions

Both authors were equally involved in all stages of development and writing of the paper.

Funding

The authors acknowledge the financial support of COMPETE and FCT Portugal project grant PTDC/IIM-ECO/4574/2012 and reference POCI-01-0145-FEDER-006683 (NIPE-UID/ECO/03182/2013).

Acknowledgments

We acknowledge the useful comments and suggestions made by two anonymous reviewers and the editor.

Conflicts of Interest

The authors declare no conflict of interest. The funders had no role in the design of the study; in the collection, analyses, or interpretation of data; in the writing of the manuscript, and in the decision to publish the results.

Appendix A. Instructions for Treatment NEUTRAL FRAME

Welcome to the experiment
You can earn money in this experiment and the amount that you earn depends on your choices and those of the other participants.
Read these instructions carefully and if you have any questions, please raise your hand and wait for the experimenter to come to your seat. Do not talk during this experiment with anyone other than the experimenter.
Today’s session has 4 Parts:
Part 1 (Instructions):
You are given paper instructions to read and a short oral summary will be made by the experimenter. You will be asked to answer a few questions to check you understood the instructions.
Part 2 (Experiment):
A market experiment that has 20 periods.
Part 3 (Questionnaire):
Once all participants have finished, there will be a short questionnaire about you and today’s session.
Part 4 (Earnings):
After the questionnaire, the experimenter conducting today’s session will pay you in private the earnings from the decisions you’ve made, in cash. The currency unit in this experiment will be in points and at the end of the session points will be converted to pounds (£) at the following exchange rate: 100 points = £1.75.
You will be asked to sign a receipt for your earnings. Please remain seated for this to ensure privacy. All the decisions you make and your earnings will be private and anonymous.
What is this experiment about?
At the beginning of today’s experiment each participant will be assigned a role: Buyer or Producer. The roles will remain the same throughout the experiment. Each participant will make their decisions in a group of 3 Producers and 3 Buyers, which will remain fixed throughout the session. Since all your decisions are anonymous, you will not learn with whom you interacted today.
Rules of the market experiment
In each market, in each period, fictitious goods will be traded. There are two types of goods available to be produced, Type A and Type B. Each producer will choose one type, propose a price and will be able to sell up to three units. Each buyer decides from whom to buy one unit.
There are two types of goods which differ in their production costs and the fact that during production they may cause negative impacts on the earnings of buyers in the group:
Type A: is more costly to produce (50 points) but does not cause any negative impact on buyers;
Type B: is less costly to produce (40 points) but if a buyer chooses it, it causes a negative impact on the earnings of the other two buyers in the group (10 points each).
Procedure for this experiment in each period:
Each group is formed of Producers 1, 2 and 3 and Buyers 1, 2 and 3.
1-  Producers announce their price and product type
Producers can choose from two types of goods when making their proposals.
In the beginning of each period, each Producer announces:
-the type of good (A or B)
-the price (s)he will charge per unit sold (this can be any integer from 0 to 110)
These are proposals, and only if buyers agree to buy, do they become effective in terms of earnings, production costs, prices and negative impact on buyers.
2-  Buyer makes an order
The Buyer learns the price and type for each Producer in his/her group. The Buyer can order 1 unit and decides from which Producer to buy.
The Buyer can choose not to buy a unit in any given period.
3-  Earnings are calculated by the computer:
The computer receives the orders of the buyer and executes the production accordingly.
At the end of each period, earnings for the Producers and Buyers are calculated, according to the following rules:
Producers:
  • If a Producer does not sell anything, his earnings for that period are Zero.
  • If a Producer sells something, he receives the unit price minus the production cost per unit sold.
This is multiplied by the number of units sold (which can be 1, 2 or 3). The maximum price a Producer can announce is 110 points.
Earnings of a Producer = (Price − Production cost) * Number of units of the good sold
At the beginning of the experiment each Producer will be given a fixed amount of 400 points. Any gains or losses the Producer makes per period are added or subtracted to this amount.
Buyers:
At the beginning of each period, each Buyer will be given a fixed amount of 20 points (corresponding to a total of 400 points).
In each period, one unit of good the buyer buys is worth 100 points to him/ her.
  • If buyer buys one unit:
Earnings = 20 points + 100 points − price paid −negative impact caused by purchases of other buyers*
  • If buyer does not buy one unit:
Earnings = 20 points − negative impact caused by purchases of other buyers*
* If other buyers buy Type B goods.
At the end of today’s experiment, the earnings from the 20 periods are summed and converted into pounds.
Before you proceed to the experiment, please let the experimenter know you have read the instructions, by raising your hand.
You will be asked to answer some quick questions to check if the instructions were clear to you.

Appendix B. Instructions for Treatment ENVIRONMENTAL FRAME

Welcome to the experiment
You can earn money in this experiment and the amount that you earn depends on your choices and those of the other participants.
Read these instructions carefully and if you have any questions, please raise your hand and wait for the experimenter to come to your seat. Do not talk during this experiment with anyone other than the experimenter.
Today’s session has 4 Parts:
Part 1 (Instructions):
You are given paper instructions to read and a short oral summary will be made by the experimenter. You will be asked to answer a few questions to check you understood the instructions.
Part 2 (Experiment):
A market experiment that has 20 periods.
Part 3 (Questionnaire):
Once all participants have finished, there will be a short questionnaire about you and today’s session.
Part 4 (Earnings):
After the questionnaire, the experimenter conducting today’s session will pay you in private the earnings from the decisions you’ve made, in cash. The currency unit in this experiment will be in points and at the end of the session points will be converted to pounds (£) at the following exchange rate: 100 points = £1.75.
You will be asked to sign a receipt for your earnings. Please remain seated for this to ensure privacy. All the decisions you make and your earnings will be private and anonymous.
What is this experiment about?
At the beginning of today’s experiment each participant will be assigned a role: Buyer or Producer. The roles will remain the same throughout the experiment. Each participant will make their decisions in a group of 3 Producers and 3 Buyers, which will remain fixed throughout the session. Since all your decisions are anonymous, you will not learn with whom you interacted today.
Rules of the market experiment
In each market, in each period, fictitious goods will be traded. There are two types of goods available to be produced, Green Goods and Brown Goods. Each producer will choose one type, propose a price and will be able to sell up to three units. Each buyer decides from whom to buy one unit.
The two types of goods in this market have identical characteristics, in terms of quality and performance, therefore are worth the same for consumers. However, the two goods differ in their production costs because of the technology used: either cleaner and more expensive technologies or polluting and cheaper techniques. Brown Goods are cheaper to produce but impact negatively the environment through pollution and waste generation, which in turn has a negative effect on other individuals in society (due to health problems caused by pollution, for instance, or the adverse effects caused by the loss of environmental quality). For that reason, in this experiment, when a Brown Good is purchased, the earnings of the other buyers in a group are negatively affected. Green goods have higher production costs, but since they do not harm the environment, there is no negative impact on the other buyers in the group.
Procedure for this experiment in each period:
Each group is formed of Producers 1, 2 and 3 and Buyers 1, 2 and 3.
1-  Producers announce their price and product type
Producers can choose from two types of goods when making their proposals.
In the beginning of each period, each Producer announces:
-the type of good (Green or Brown)
-the price (s)he will charge per unit sold (this can be any integer from 0 to 110)
These are proposals, and only if buyers agree to buy, do they become effective in terms of earnings, production costs, prices and negative impact on the environment and on buyers.
2-  Buyer makes an order
The Buyer learns the price and type for each Producer in his/her group. The Buyer can order 1 unit and decides from which Producer to buy.
The Buyer can choose not to buy a unit in any given period.
3-  Earnings are calculated by the computer:
The computer receives the orders of the buyer and executes the production accordingly.
At the end of each period, earnings for the Producers and Buyers are calculated, according to the following rules:
Producers:
  • If a Producer does not sell anything, his earnings for that period are Zero.
  • If a Producer sells something, he receives the unit price minus the production cost per unit sold.
This is multiplied by the number of units sold (which can be 1, 2 or 3). The maximum price a Producer can announce is 110 points.
Earnings of a Producer = (Price − Production cost) * Number of units of the good sold
At the beginning of the experiment each Producer will be given a fixed amount of 400 points. Any gains or losses the Producer makes per period are added or subtracted to this amount.
Buyers:
At the beginning of each period, each Buyer will be given a fixed amount of 20 points (corresponding to a total of 400 points).
In each period, one unit of good the buyer buys is worth 100 points to him/ her.
  • If buyer buys one unit:
Earnings = 20 points + 100 points − price paid −negative impact caused by purchases of other buyers*.
  • If buyer does not buy one unit:
Earnings = 20 points − negative impact caused by purchases of other buyers*.
* If other buyers buy Brown goods, the buyer knows for sure how much impact the purchases have on his/her payments (−10 points per unit)—this information is revealed at the end of each period.
At the end of today’s experiment, the earnings from the 20 periods are summed and converted into pounds.
Before you proceed to the experiment, please let the experimenter know you have read the instructions, by raising your hand.
You will be asked to answer some quick questions to check if the instructions were clear to you.

References

  1. Mishan, E.J. The postwar literature on externalities: An interpretative essay. J. Econ. Lit. 1971, XXII, 1–28. [Google Scholar]
  2. Cropper, M.L.; Oates, W.E. Environmental economics: A survey. J. Econ. Lit. 1992, XXX, 675–740. [Google Scholar]
  3. Lancaster, K.J. A new approach to consumer theory. J. Political Econ. 1966, 74, 132–157. [Google Scholar] [CrossRef]
  4. Kotchen, M.J. Green markets and the private provision of public goods. J. Political Econ. 2006, 114, 816–834. [Google Scholar] [CrossRef]
  5. Cornes, R.; Sandler, T. The comparative static properties of the impure public good model. J. Public Econ. 1994, 54, 403–421. [Google Scholar] [CrossRef]
  6. OECD (Organisation for Economic Co-Operation and Development). Greening Household Behaviour: The Role of Public Policy; OECD Publishing: Paris, France, 2011. [Google Scholar]
  7. OECD (Organisation for Economic Co-operation and Development). Household Behaviour and the Environment: Reviewing the Evidence; 1997–0900; OECD Publishing: Paris, France, 2014. [Google Scholar]
  8. Selectra. Renewable Energy Supply Options in France. Available online: https://en.selectra.info/energy-france/guides/electricity-green-suppliers (accessed on 16 July 2018).
  9. NEF. Green Energy Supply Certification Scheme. Available online: http://www.nef.org.uk/service/search/result/green-energy-supply-certification-scheme (accessed on 16 July 2018).
  10. IFOAM (International Federation of Organic Agriculture Movements). Leading Change Organically—Consolidated Annual Report of IFOAM—Organics International; IFOAM: Bonn, Germany, 2017. [Google Scholar]
  11. NYT (New York Times). Flying Is Bad for the Planet. You Can Help Make It Better. Available online: https://www.nytimes.com/2017/07/27/climate/airplane-pollution-global-warming.html (accessed on 16 July 2018).
  12. European Commission. Flash Eurobarometer 367—Attitudes of Europeans towards Building the Single Market for Green Products; European Commission: Brussels, Belgium, 2013. [Google Scholar]
  13. Boulstridge, E.; Carrigan, M. Do consumers really care about corporate responsibility? Highlighting the attitude-behaviour gap. J. Commun. Manag. 2000, 4, 355–368. [Google Scholar] [CrossRef]
  14. Devinney, T.M.; Auger, P.; Eckhardt, G.M. The Myth of the Ethical Consumer; Cambridge University Press: Cambridge, UK, 2010. [Google Scholar]
  15. Gleim, M.; Lawson, S.J. Spanning the gap: An examination of the factors leading to the green gap. J. Consumer Market. 2014, 31, 503–514. [Google Scholar] [CrossRef]
  16. European Commission. Special Eurobarometer 416—Attitudes of European Citizens towards the Environment; European Commission: Brussels, Belgium, 2014. [Google Scholar]
  17. Bartling, B.; Valero, V.; Weber, R. On the scope of externalities in experimental markets. Exper. Econ. 2017. [Google Scholar] [CrossRef]
  18. Bartling, B.; Weber, R.A.; Yao, L. Do markets erode social responsibility? Q. J. Econ. 2015, 130, 219–266. [Google Scholar] [CrossRef]
  19. Bougherara, D.; Piguet, V. Market behavior with environmental quality information costs. J. Agric. Food Ind. Org. 2009, 7. [Google Scholar] [CrossRef]
  20. Cason, T.N.; Gangadharan, L. Environmental labeling and incomplete consumer information in laboratory markets. J. Environ. Econ. Manag. 2002, 43, 113–134. [Google Scholar] [CrossRef]
  21. Plott, C.R. Externalities and corrective policies in experimental markets. Econ. J. 1983, 93, 106–127. [Google Scholar] [CrossRef]
  22. Alekseev, A.; Charness, G.; Gneezy, U. Experimental methods: When and why contextual instructions are important. J. Econ. Behav. Org. 2017, 134, 48–59. [Google Scholar] [CrossRef]
  23. Smith, V.L. Experimental economics: Induced value theory. Am. Econ. Rev. 1976, 66, 274–279. [Google Scholar]
  24. Tversky, A.; Kahneman, D. The framing of decisions and the psychology of choice. Science 1981, 211, 453–458. [Google Scholar] [CrossRef] [PubMed]
  25. Tversky, A.; Kahneman, D. Rational choice and the framing of decisions. J. Bus. 1986, 59, S251–S278. [Google Scholar] [CrossRef]
  26. Smith, V.L. Theory and experiment: What are the questions? J. Econ. Behav. Organ. 2010, 73, 3–15. [Google Scholar] [CrossRef] [Green Version]
  27. Levitt, S.D.; List, J.A. What do laboratory experiments measuring social preferences reveal about the real world? J. Econ. Perspect. 2007, 21, 153–174. [Google Scholar] [CrossRef]
  28. Harrison, G.W.; List, J.A. Field experiments. J. Econ. Lit. 2004, 42, 1009–1055. [Google Scholar] [CrossRef]
  29. Engel, C.; Rand, D.G. What does “clean” really mean? The implicit framing of decontextualized experiments. Econ. Lett. 2014, 122, 386–389. [Google Scholar] [CrossRef]
  30. Cason, T.N.; Raymond, L. Framing effects in an emissions trading experiment with voluntary compliance. In Experiments on Energy, the Environment, and Sustainability; Emerald Group Publishing Limited: Bingley, UK, 2011; pp. 77–114. [Google Scholar]
  31. Cookson, R. Framing effects in public goods experiments. Exper. Econ. 2000, 3, 55–79. [Google Scholar] [CrossRef]
  32. Pevnitskaya, S.; Ryvkin, D. Environmental context and termination uncertainty in games with a dynamic public bad. Environ. Dev. Econ. 2013, 18, 27–49. [Google Scholar] [CrossRef]
  33. Raymond, L.; Cason, T.N. Can affirmative motivations improve compliance in emissions trading programs? Policy Stud. J. 2011, 39, 659–678. [Google Scholar] [CrossRef]
  34. Holt, C.A. Industrial organization: A survey of laboratory research. Handbook Exp. Econ. 1995, 349, 402–403. [Google Scholar]
  35. Etilé, F.; Teyssier, S. Signaling corporate social responsibility: Third-party certification versus brands. Scand. J. Econ. 2016, 118, 397–432. [Google Scholar] [CrossRef]
  36. Rode, J.; Hogarth, R.M.; Le Menestrel, M. Ethical differentiation and market behavior: An experimental approach. J. Econ. Behav. Org. 2008, 66, 265–280. [Google Scholar] [CrossRef] [Green Version]
  37. Valente, M. Ethical differentiation and consumption in an incentivized market experiment. Rev. Ind. Organ. 2015, 47, 51–69. [Google Scholar] [CrossRef]
  38. Cartwright, E. A comment on framing effects in linear public good games. J. Econ. Sci. Assoc. 2016, 2, 73–84. [Google Scholar] [CrossRef]
  39. Fischbacher, U. Z-tree: Zurich toolbox for ready-made economic experiments. Exper. Econ. 2007, 10, 171–178. [Google Scholar] [CrossRef]
  40. Friedman, D.; Cassar, A. Economics Lab—An Intensive Course in Experimental Economics; Routledge: London, UK; New York, NY, USA, 2004. [Google Scholar]
  41. Cooper, D.J.; Kagel, J.H. Other-regarding preferences: A selective survey of experimental results. In The Handbook of Experimental Economics, Volume 2; Kagel, J.H., Roth, A.E., Eds.; Princeton University Press: Princeton, NJ, USA, 2016. [Google Scholar]
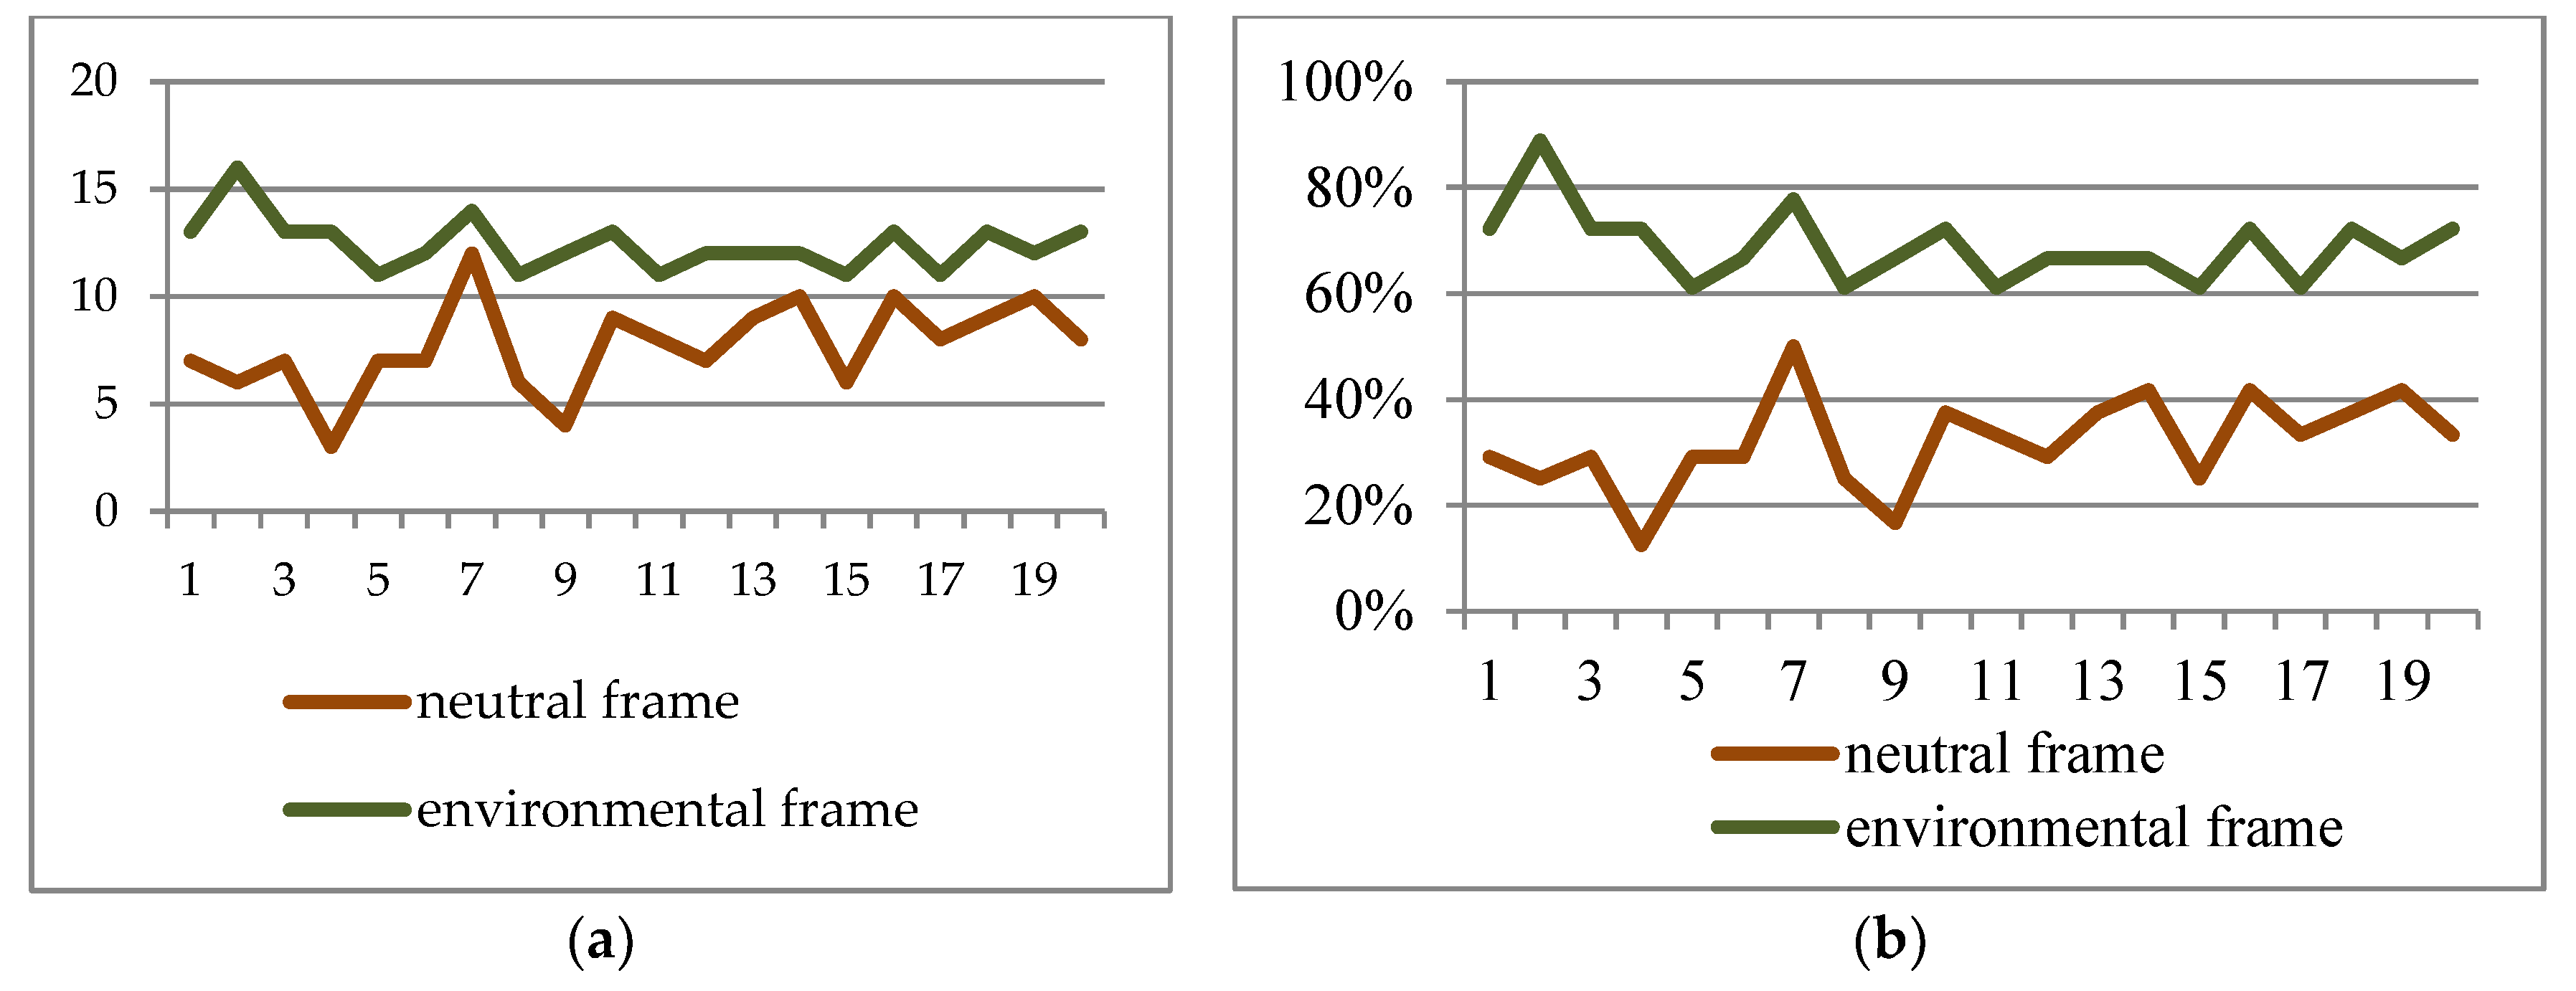
Figure 1. Announcements of green goods in NEUTRAL FRAME and ENVIRONMENTAL FRAME treatments (pooled market observations): (a) number of greens (b) share of green.
Games 09 00070 g001
Figure 2. Announcements of green goods in NEUTRAL FRAME Treatment, per period and market.
Games 09 00070 g002
Figure 3. Announcements of green goods in ENVIRONMENTAL FRAME treatment, per period and market.
Games 09 00070 g003
Table 1. Instructions about the rules of the market in the two experimental treatments.
Neutral Frame
In each market, in each period, fictitious goods will be traded. There are two types of goods available to be produced, Type A and Type B. Each producer will choose one type, propose a price and will be able to sell up to three units. Each buyer decides from whom to buy one unit.
There are two types of goods which differ in their production costs and the fact that during production they may cause negative impacts on the earnings of buyers in the group:
Type A:
is more costly to produce (50 points) but does not cause any negative impact on buyers;
Type B:
is less costly to produce (40 points) but if a buyer chooses it, it causes a negative impact on the earnings of the other two buyers in the group (10 points each).
Environmental Frame
In each market, in each period, fictitious goods will be traded. There are two types of goods available to be produced, Green Goods and Brown Goods. Each producer will choose one type, propose a price and will be able to sell up to three units. Each buyer decides from whom to buy one unit.
The two types of goods in this market have identical characteristics, in terms of quality and performance, therefore, are worth the same for consumers. However, the two goods differ in their production costs because of the technology used: either cleaner and more expensive technologies or polluting and cheaper techniques. Brown Goods are cheaper to produce but impact negatively on the environment through pollution and waste generation, which in turn has a negative effect on other individuals in society (due to health problems caused by pollution, for instance, or the adverse effects caused by the loss of environmental quality). For that reason, in this experiment, when a Brown Good is purchased, the earnings of the other buyers in a group are negatively affected. Green goods have higher production costs, but since they do not harm the environment, there is no negative impact on the other buyers in the group.
Green Good:
is more costly to produce (50 points) but does not cause any negative impact on the environment neither on other buyers;
Brown Good:
is less costly to produce (40 points) but if a buyer chooses it, it causes a negative impact on the environment and on the earnings of the other two buyers in the group (10 points each).
Table 2. Parameters for the green (A) and brown (B) goods (in experimental units).
ParametersGreen (A)Brown (B)
(−) production cost5040
(−) externalities020
(+) benefit100100
(=) net social benefit5040
Table 3. Sessions overview.
Treatments# Groups or Markets# Subjects# Sellers# Buyers
neutral frame2 sessions × 4 groups482424
environmental frame2 sessions × 3 groups361818
Total14844242
Table 4. Share of green (A) goods in proposals and purchases.
TreatmentProposalsMarket Share
neutral frame31.9%18.1%
environmental frame68.9%70.0%
Table 5. Prices paid for green and brown goods in both treatments.
Price green goodsNMeansdMin.Max.
neutral frame8753.34.38674570
environmental frame25255.75.75684480
Price Brown goodsNMeansdMin.Max.
neutral frame39044.25.65042065
environmental frame10644.34.98101570
Table 6. Panel data Logit model for the probability of seller selling at least one unit.
VARIABLES
Proposed price−0.334 ***
(0.0371)
Proposed Price * Environmental Frame0.221 ***
(0.0416)
Lowest competitors’ price0.331 ***
(0.0368)
Lowest Competitors’ Price * Environmental Frame−0.292 ***
(0.0404)
Green good proposed (1: yes 0: no)0.965 ***
(0.358)
Green good proposed * Environmental Frame0.168
(0.491)
Relative green reputation0.175 ***
(0.0470)
Relative Green Reputation * Environmental Frame−0.0903
(0.0642)
Environmental Frame (1: yes 0: no)2.828 *
(1.578)
Constant1.003
(1.209)
Observations840
Number of subjects42
Notes: dependent variable: dummy variable for seller selling or not in a given period; variable Environmental Frame is 1 in the ENVIRONMENTAL FRAME treatment and 0 in the NEUTRAL FRAME treatment; robust standard errors in parentheses; levels of statistical significance: *** p < 0.01, ** p < 0.05, * p < 0.1.
Table 7. Panel data Logit model for the probability of announcing green goods.
VARIABLESGreen Announcements
Environmental Consciousness (1: yes 0: no)0.577
(0.505)
Environmental Consciousness * Environmental Frame0.142
(1.195)
Environmental Frame (1: yes 0: no)1.792 *
(1.041)
Constant−1.201 ***
(0.357)
Observations840
Number of subjects42
Notes: dependent variable: dummy variable for seller announcing or not a green good in a given period; independent variables: variable Environmental Consciousness is 1 if individual has performed three actions in the past month for environmental reasons, 0 otherwise; variable Environmental Frame is 1 in the ENVIRONMENTAL FRAME treatment and 0 in the NEUTRAL FRAME treatment; robust standard errors in parentheses; levels of statistical significance: *** p < 0.01, ** p < 0.05, * p < 0.1.
Table 8. Panel data Logit model for the probability of buying green.
VARIABLES
Number of sellers announcing green0.470
(0.352)
Green units bought by other consumers (lagged)0.236
(0.219)
Lowest price for green good−0.216 ***
(0.0593)
Lowest price for brown good0.239 ***
(0.0581)
Environmental consciousness1.228
(0.928)
Environmental Frame2.898 ***
(1.115)
Constant−2.460
(2.452)
Observations435
Number of subjects42
Notes: dependent variable: dummy variable for buyers buying or not a green good in a given period; Robust standard errors in parentheses; levels of statistical significance: *** p < 0.01, ** p < 0.05, * p <0.1.