Article

Dynamic Contributions to a Public Project: The Impact of Rising Marginal Benefit and Completion Benefits

1
Department of Economics, Millersville University of Pennsylvania, Millersville, PA 17551-0302, USA
2
Internal Revenue Service, Washington, DC 20333, USA
*
Author to whom correspondence should be addressed.
The views expressed in this article are not necessarily those of the U.S. government.
Games 2018, 9(3), 43; https://doi.org/10.3390/g9030043
Submission received: 24 May 2018 / Revised: 21 June 2018 / Accepted: 23 June 2018 / Published: 1 July 2018
(This article belongs to the Special Issue Public Good Games)

Abstract

:
Many public projects are funded in a dynamic manner in which contributors are able to make gradual increases in contributions and condition additional contributions on the cooperation of others. This study presents results from experiments in which subjects with an initial fixed endowment make contributions to a public project gradually over a series of rounds. A 2 × 2 experimental design is used to examine the effectiveness of multiple thresholds that once crossed increase the marginal benefit of a contribution to the public project and the existence of a completion benefit upon project completion. Results reveal that when the multiple threshold design is combined with a completion benefit, overall contributions and project completion rates increase relative to other treatments. Without the presence of a completion benefit, contributions in the multiple threshold design are not significantly different from a constant marginal benefit design. In addition, completion benefits are shown to strongly encourage additional cooperation and project completion. Finally, projects are more likely to be completed when substantial contributions occur in the early rounds.
JEL Classification:
C92; H41

1. Introduction

Many public projects are funded in a dynamic manner (e.g., a university fund drive to construct a building). People can make gradual repeated contributions to the project from a fixed initial endowment over time. The fundraiser can also attempt to persuade potential donors by providing updates to the total contributions raised up to that point (e.g., posting a sign of a thermometer that the fundraiser fills in as contributions rise to the fundraising goal.). Funding in a dynamic manner may allow for establishment of trust through mutual reciprocity1, which permits greater overall cooperation than is available in static funding environments where people make a single contribution decision without knowledge of the decisions made by others.2,3 This study uses laboratory experiments to examine the funding of a public project with voluntary contributions in a dynamic environment. Our experimental framework consists of subjects making repeated simultaneous decisions about contributions to a group project from fixed initial endowments. The total group contribution to the public project is made public to group members after each round and the endpoint is publicly known. Our study examines the interaction of the marginal benefit of a contribution to the public project and a completion benefit in a 2 × 2 design, with the marginal benefit constant or increasing as thresholds are reached and the existence or non-existence of a completion benefit.
Our experimental design was first studied in the model of Marx and Matthews (2000) [4]. They show that when a separate completion benefit exists upon completion of a public project, equilibria in which the project is fully funded may exist when the project is funded dynamically over a number of rounds. This is true even when such equilibria would not exist if the project was funded using a static design. These equilibria result from trigger strategies in which subjects make gradual contributions that will eventually complete the project, but immediately drop contributions to zero upon a deviation.4
Duffy et al. (2007) [6] report on experiments making use of the repetitive simultaneous decisions setup of the Marx and Matthews (2000) [4] model.5 The Duffy et al. study compares treatments with a repetitive simultaneous voluntary contribution mechanism (VCM) design to identically parameterized static VCM treatments. They also examine treatments with and without the presence of a completion benefit. They find that while group account contributions are greater in the dynamic VCM treatments than in identically parameterized static VCM treatments, this result is not dependent on the existence of a completion benefit, as the Marx and Matthews model predicts. Most relevant to our study, they find evidence that average contributions are higher, and projects are completed more often in the dynamic VCM treatment that includes a completion benefit relative to the dynamic VCM treatment that does not.
Evidence from static VCM laboratory experiments and fundraising projects in the field suggests that increased marginal benefits to contributions and completion benefits exist and merit consideration. For example, consider a multi-stage university building project that is funded by voluntary donations. As certain levels of project funding are reached, it may be possible that the benefit of making an additional contribution to the project will increase in the following two ways. First, contributors may feel they are taking part in completing a crucial stage in the project. And, as portions of the project are finished, completing additional portions of the project may become more important. Second, due to portions of the project having been previously completed, individuals could become aware that others have made contributions, thus enhancing their reciprocal motivations.6 In addition, as in Vesterlund (2003) [11], initial leadership donations may lower the perceived risk of contributing to a low-quality project, thus providing greater marginal benefit to later contributions.
Contributors to a project may receive a separate extra benefit upon completion of a project. For example, contributors to a university project may receive some benefit to contributing to the project while the building is taking place, but will also receive a further benefit when the project is finally completed and is in use. A completion benefit exists for any project in which its benefits are not fully experienced until the project is completed.7 Completion benefits are akin to provision point public goods, where Nash Equilibria exist, which fund public good up to the provision point, in addition to the no-provision complete free-riding case (see Palfrey and Rosenthal, 1984 [12]; Marks and Croson, 1998 [13]; Croson and Marks, 2000 [14]).
The primary finding of this study is that total contributions to a public project are significantly enhanced and the project is completed more often when a completion benefit exists. The importance of completion benefits provides further support for game theoretic evidence of the importance of completion benefits found in Marx and Matthews (2000) [4]. Further, our results show that the existence of completion benefits yield more completed projects than found in Duffy et al. (2007) [6]. In analogous treatments, approximately 10% of projects were completed in Duffy et al. (2007) [6] compared to 34% of projects completed in this study.
Secondary findings of this study include the following: (1) The project is completed most often when a completion benefit is combined with a marginal benefit of contributing to a public project, which progresses as threshold levels of project funding are reached; (2) total contributions are not significantly different between rising and constant marginal benefit treatments when no completion benefit is present; and, (3) projects are more likely to be completed when contributions are substantial in early rounds.
The paper is structured as follows. The next section describes the experiment. Details included in this section are the theoretical analysis of our experimental problem, the parameterization of our experiments, and our experimental procedures. Section 3 presents the experimental results. Finally, Section 4 contains a discussion of our results and concluding remarks.

2. Experiment

2.1. Theoretical Analysis

We now describe a simple model of funding a public project based upon Marx and Matthews (2000) [4] to demonstrate the problem our experiments examine. Assume that there are n identical individuals who participate in funding a project for T rounds. Each individual is initially endowed with Zi tokens that can be contributed to fund the public project, or retained to earn a constant private marginal benefit equal to Pi. Any contributions made to fund the public project are non-refundable. In any round t { 1 , T } , each individual must decide how much to contribute to funding the project. Let mi(t) represent individual i’s contribution in round t, and define M ( t ) =   i = 1 n m i ( t ) . M ( t ) is the total number of tokens allocated by the whole group to the group project in round t. After round T is completed, individual i receives his private benefit from any tokens remaining in his endowment, and receives a benefit from the public project that depends upon the aggregate contribution made by the n individuals over all T rounds. Individual i’s payoff after round T is calculated as:
U i =   [ Z i   t = 1 T m i ( t ) ] P i +   f ( t = 1 T M ( t ) )
The individual benefit from the public project f ( t = 1 T M ( t ) ) increases with contributions until enough has been contributed to complete the project. The project is completed if t = 1 T M ( t )   M ¯ . The function f ( t = 1 T M ( t ) ) is varied across treatment conditions in this study using a 2 × 2 design. First, we analyze whether the marginal benefit of contributing a token to the group project increases as funding thresholds are reached, or stays constant. Second, we examine whether completion of the project results in individuals receiving a completion benefit or not.
The function f ( t = 1 T M ( t ) ) for our most simple treatment, in which the marginal benefit of contributing a token to the group project is constant and no completion benefit exists, is shown below. Henceforth, we refer to this as the constant marginal benefit treatment (CMB):
  f ( t = 1 T M ( t ) ) = { λ 2 t = 1 T M ( t )   if   t = 1 T M ( t ) < M ¯ λ 2 M ¯   if   t = 1 T M ( t ) M ¯
In the function above, λ 2 represents the individual marginal benefit of contributing a token to the group project, and n λ 2 represents the marginal benefit for the whole group of any token being allocated to the group project. If at least M ¯ tokens are allocated to the group project by the group, the project is completed and additional allocations above M ¯ do not provide an additional benefit. To create a social dilemma, we assume that 0 < λ 2 <   P i and that n λ 2 > P i . Given these assumptions, it is socially optimal for the group to contribute a total of M ¯ tokens to complete the project. But, since λ 2 <   P i , it is individually optimal for individuals to retain all tokens in their private accounts. This results in zero provision of the public project being the only equilibrium outcome under standard non-cooperative assumptions.
In our next treatment, we retain the fact the no completion benefit exists, but the marginal benefit of contributing a token to the group project increases as funding thresholds are reached. Henceforth, we refer to this treatment as the rising marginal benefit (RMB) treatment. The function f ( t = 1 T M ( t ) ) for the RMB treatment is shown below.
f ( t = 1 T M ( t ) ) = { λ 1 t = 1 T M ( t )    if   t = 1 T M ( t )     Ω 1 λ 1 Ω 1 + λ 2 ( t = 1 T M ( t ) Ω 1 )    if   Ω 1 < t = 1 T M ( t )     Ω 2 λ 1 Ω 1 + λ 2 ( Ω 2 Ω 1 ) + λ 3 ( t = 1 T M ( t ) Ω 2 )    if   Ω 2 < t = 1 T M ( t )   < M ¯ λ 1 Ω 1 + λ 2 ( Ω 2 Ω 1 ) + λ 3 ( M ¯ Ω 2 )    if   t = 1 T M ( t )   M ¯
In the function above, the Ωs represent thresholds of total group contributions to the group project, with Ω 1 < Ω 2 < M ¯ . The λs again represent individual marginal benefits of contributing a token to the group project. As total group contributions pass the funding thresholds, the marginal benefit of allocating an additional token to the group project increases with λ 1 < λ 2 < λ 3 < P i , and n λ 3 > n λ 2 > n λ 1 > P i . This again creates a social dilemma in which fully funding the project is optimal for the group, while it is individually optimal for group members to retain all tokens in their private accounts. Again, zero provision of the public project is the only equilibrium outcome under standard assumptions.
The next two treatments are analogous to the CMB and RMB treatments with the exception of the existence of a completion benefit. First, we add a completion benefit to the CMB treatment. The function f ( t = 1 T M ( t ) ) for the constant marginal benefit plus completion benefit treatment (CMB CB) is shown below:
  f ( t = 1 T M ( t ) ) = { λ 2 t = 1 T M ( t )   if   t = 1 T M ( t ) < M ¯ λ 2 ( M ¯ 1 ) + B   if   t = 1 T M ( t ) M ¯
In the above equation, B represents the completion benefit that each individual receives upon completion of the project. We choose a completion benefit that is small enough that zero-provision is the only equilibrium of a one-round game ( T = 1 ) , but is large enough that project completion equilibria exist if the game lasts a sufficient number of rounds.8
First consider a one-round game ( T = 1 ) . Given the previous assumption that λ 2 <   P i , the only way an individual would contribute to the project in a one-round game is to complete it: m i = M ¯ m i where m i is the sum of the other group members’ allocations.
Following Duffy et al. (2007 pp. 4–5) [6], group member i would be unwilling to contribute m i tokens to complete the group project if her payoff would be less than her payoff from complete free riding. This requires that:
  P i ( Z i m i ) + λ 2 ( M ¯ 1 ) + B < λ 2 ( m i ) + P i Z i
This reduces to:
  B < P i m i λ 2 ( M ¯ 1 m i )
Let m be the critical value of m i that makes the group member indifferent to completing the project. Using the above definition of m i and the above inequality, we find:
  m = ( M ¯ m i ) = B λ 2 P i λ 2
Therefore, a member’s best response to contributing to the group project is:
  m i ( m i ) = { M ¯ m i     if   M ¯ m i   m 0   otherwise
While we choose a B that it is small enough that the public project cannot be funded in equilibrium in a one-round game, we also choose a B that is large enough for full funding equilibria to exist when the project is funded over multiple rounds. This requires at a minimum that B > P i . With B of sufficient size, it is possible for the project to be funded in equilibrium because as the project is funded gradually over multiple rounds, a contribution level can eventually be reached in which an individual has the incentive to complete the project rather than retaining the tokens in her private account. These equilibria can be supported if group members play trigger strategies in which they make repeating small contributions that will eventually complete the project, but immediately drop contributions to zero upon a deviation. A deviation would be known to group members because they are informed of the total group contribution after every round. There are of course numerous equilibria, both symmetric and non-symmetric, that could be supported this way.9
In our final treatment, we add a completion benefit to the RMB treatment. The function f ( t = 1 T M ( t ) ) for the rising marginal benefit plus completion benefit treatment (RMB CB) is shown below:
f ( t = 1 T M ( t ) ) = { λ 1 t = 1 T M ( t )    if   t = 1 T M ( t )     Ω 1 λ 1 Ω 1 + λ 2 ( t = 1 T M ( t ) Ω 1 )    if   Ω 1 < t = 1 T M ( t )     Ω 2 λ 1 Ω 1 + λ 2 ( Ω 2 Ω 1 ) + λ 3 ( t = 1 T M ( t ) Ω 2 )    if   Ω 2 < t = 1 T M ( t )   < M ¯ λ 1 Ω 1 + λ 2 ( Ω 2 Ω 1 ) + λ 3 ( M ¯ Ω 2 1 ) + B    if   t = 1 T M ( t )   M ¯
In a similar manner to the CMB treatment, the completion benefit B is chosen such that zero-provision is the only equilibrium in a one-round game, but the project can be fully completed in equilibrium in a multiple round game.10

2.2. Parameterization of Experiments

In all the experimental treatments of our study, groups of size n = 5 subjects make decisions about funding a public project over a series of T = 10 rounds. Each subject is endowed with Zi = 20 tokens. The marginal benefit of retaining a token in one’s private account, Pi, is $0.10 per token. The public project is completed if at least M ¯ = 60 tokens are allocated to the group project by the entire group.
The individual marginal benefit of contributing a token to the group project in the CMB, and CMB CB treatments, λ 2 , is $0.06. In the RMB, and RMB CB treatments, the thresholds Ω 1 and Ω 2 are set at 20 and 40 tokens, respectively, with λ1 = $0.04, λ2 = $0.06, and λ3 = $0.08.11 Finally, the completion benefit, B, in the CMB CB and RMB CB treatments is set at $0.30.12,13 This parameterization meets the requirements given for these parameters in the previous section.
We designed these treatments to specifically test whether a rising marginal benefit from the public project will affect behavior relative to a constant marginal benefit design. For this reason, we parameterize the treatments so that the total benefit available to an individual from the public project is equivalent across CMB and RMB treatments. Given our parameterization:
  λ 2 M ¯ =   λ 1 Ω 1 +   λ 2 ( Ω 2 Ω 1 ) + λ 3 ( M ¯ Ω 2 ) = $ 3.60.
Similarly, the total benefit available to an individual from the public project in the CMB CB and RMB CB treatments is approximately equal with:
  λ 2 ( M ¯ 1 ) + B = $ 3.84
  and :   λ 1 Ω 1 +   λ 2 ( Ω 2 Ω 1 ) + λ 3 ( M ¯ Ω 2 1 ) + B =   $ 3.80

2.3. Experimental Design

A total of 10 experimental sessions were conducted at Penn State Worthington Scranton and at Millersville University of Pennsylvania. Each session involved either 10 or 15 subjects. A total of 130 undergraduate subjects recruited from general education courses14 at the two universities participated in the experiments. We used a between-subject design, with each subject participating in only one experimental treatment. All of the experiments were fully computerized, and took place in computer labs on the two campuses. The experiments were programmed and conducted using z-Tree (Fischbacher 2007) [15].15 See Appendix A for the experimental instructions for the RMB CB treatment. The instructions for the remaining treatments are similar.
Each experimental session proceeded as follows. Subjects were seated at computer terminals and were given a set of printed instructions. The instructions were projected on an overhead projector while the experimenter read the instructions aloud. The instructions contained a neutral framework (e.g., “allocate” as opposed to “contribute”). Further, the instructions referenced a “group account”, not a “group project”.
The instructions informed the subjects that they would participate in a series of four 10-round sequences, and that before each sequence they would be randomly and anonymously assigned to a five-person group. The instructions described how decisions would be made within each sequence, and gave visual examples of how information would be displayed on the computer. Once the reading of the instructions was completed, any student questions were answered. The first 10-round sequence then began.16
Within each sequence, before subjects made an allocation decision in each round, they were shown information on the number of tokens they had remaining in their private accounts and the total number of tokens placed in the group account by the entire group in all previous rounds. In each round, they submitted the number of tokens they wished to allocate to the group account. Since subjects were endowed initially with 20 tokens in their private accounts, they could allocate any number from 0 to 20 tokens in round 1. In the following rounds, they could allocate any number from 0 to the number of tokens remaining in their private account. Following each round, subjects were shown information on the number of tokens in the group account following that round’s decisions, and were informed of their total earnings to that point. These earnings were broken down by earnings from the private account and group account separately, and a visual accounting was shown, which demonstrated how these earnings were calculated. After the completion of each 10-round sequence, subjects were informed of their final earnings for that sequence, and reminded that they would be randomly assigned to a new five-person group for the next sequence.
Following completion of the fourth sequence, subjects were paid the sum of their earnings from the four sequences, and also received a $5 show-up payment. Experimental sessions typically lasted between 1 and 1.5 h, and total earnings per participant tended to fall between $15 and $25. Table 1 summarizes our experimental sessions and treatments.

3. Results

Subject decisions are analyzed both graphically and econometrically to examine the impact of the experimental treatments on group project allocations. Results are presented with data at the group level and at the subject level. Areas of analysis include total contributions to the group project, the probability of completing the group project, and an analysis of within-group behavior and patterns of cooperation.

3.1. Group Level Results

Result 1: Contributions are higher in the presence of completion benefits.
Table 2 displays descriptive statistics for the total number of tokens contributed to the group project by the whole group in each 10-round sequence. The data is pooled across each experimental session and includes all four sequence repetitions within each session. Contributions to the group project are significantly greater than zero in all treatment conditions. The lowest total contribution to the group project observed was 12 tokens for one group in the RMB treatment. Therefore, no evidence for the zero-contribution equilibrium exists, which is the only equilibrium outcome of the CMB and RMB treatments and also is a possible equilibrium outcome of the CMB CB and RMB CB treatments.
To examine differences between treatments, while also accounting for the impact of the sequences, Figure 1 displays the mean total allocation to the group project across groups within a treatment (i.e., the total contributions after round 10) at each sequence. With the exception of the first sequence, the mean contributions for the treatments with completion benefits are higher than those treatments without completion benefits.17,18 A Kruskal-Wallis test using total contributions to the group project as the variable of interest was completed for each sequence to compare for treatment differences. The test is significant at the 10% level in Sequence 2 (p = 0.08). All other sequences show no differences in group project allocations between treatments.
We estimate an ordinary least squares regression using all 104 group observations to provide a more formal comparative static investigation between experimental treatments. The dependent variable is the total group allocation to the group project. The independent variables include treatment and sequence dummies. To account for the lack of independence across decisions made in an experimental session, we use robust clustered standard errors clustered by experimental session.19 Table 3 displays the results of the regression and relevant comparative static hypothesis tests to compare differences in allocations across treatments and sequences.
The regression coefficients generally match the data presented in Figure 1. The RMB CB treatment has the largest coefficient, followed by CMB CB and RMB. Contributions in the treatments with completion benefits are significantly larger than CMB. Further pairwise tests of the treatments yield surprising results. There is no statistical difference in contributions in RMB compared to both RMB CB and CMB CB. However, contributions in RMB CB are significantly larger than those in CMB CB. The results show that the combination of both a rising marginal benefit and a completion benefit is most effective at increasing contributions to the group project. Table 3 also shows the decay of contributions as the sequences progress. All three sequence dummies are significantly negative. Further, the magnitude of the decrease in contributions relative to the first sequence increases as the sequences progress. All pairwise F-tests comparing sequence coefficients are significant at the 2% level.
Result 2: Completion benefits are necessary to increase the probability of project completion.
Figure 2 displays the percentage of groups that completed the group project in each treatment across sequences. The figure shows that projects are completed the most often in the first sequence. Further, projects are completed at the highest rate in the RMB CB treatment. That is the only treatment where groups completed the project in all four sequences. Figure 2 also shows deterioration in completion rates as the sequences are repeated.
A logit regression model, with binary dependent variable equal to 1 if a group completed the project and zero if they did not, is used to provide further evidence for Result 2. The independent variables again are treatment and sequence repetition dummies. Table 4 displays the regression coefficients, marginal effects, and the appropriate comparative static Wald tests to compare whether project completion rates differ between treatments and sequences. The results show the importance of a completion benefit. The rising marginal benefit is not enough to increase the probability of completing the group project from the CMB treatment, as the RMB coefficient is not significant from zero at the 10% significance level. However, projects in both the rising and constant marginal benefit treatments are more likely to be completed when a completion benefit is present compared to the CMB treatment. The completion benefit increases the probability of project completion by 47 percentage points in the RMB treatment and 31 percentage points in the CMB treatment. While the Wald test shows the probability of completing the project is significantly higher in RMB CB than the RMB treatment, there is no significant difference in the probability of completion between RMB and CMB CB. Finally, the regression shows that the probability of completing a project significantly decreases in later sequences compared to the first. Pairwise Wald tests of sequence coefficients show that the probability of project completion is significantly lower in the 4th sequence relative to the 2nd sequence. The remaining Wald tests of sequence coefficients are not significant at the 10% level.
We observe much more project completion than what is observed in the Duffy et al. study. For example, in a treatment analogous to our CMB CB treatment, they find that the project is completed approximately 10% of the time. In our CMB CB treatment, the project is completed more than 34% of the time. In our RMB CB treatment, the project is completed almost 50% of the time. The Duffy et al. study has significant differences from our study but the size of their completion benefit is proportional to ours. This difference in outcomes could be due to a combination of the following factors: (1) Our experiments last a longer number of rounds than theirs, thus providing more opportunity for gradual increases in group contributions to reach a critical point at which the completion benefit becomes important; (2) we use a larger group size, so a larger number of group members can react to the completion benefit once a critical point has been reached; (3) the number of repetitions in their study is larger than ours, and both studies exhibit declining completion rates across repetitions; and (4) our study includes comparisons between RMB CB and CMB CB treatments Duffey et al. (2007) [6] does not address rising marginal benefits.

3.2. Individual Level Results

Figure 3 displays the group member mean allocation to the group account by treatment for each round and sequence. Mean contributions are above three in the first round of Sequence 1, but quickly fall below two for the remainder of the sequence. The remaining sequences begin at means of two, then remain around one for the vast majority of rounds. A Kruskal-Wallis test was performed for each sequence and each round to examine for differences in treatments. The test was significantly different than zero at the 10% significance level in seven of the 40 rounds.20 No differences in individual contributions occur across the treatments as the rounds and sequences progress.
Result 3: Subjects respond strongly to completion benefit as projects near completion in both the CMB CB and RMB CB treatments.
As stated previously, subjects are strictly better off contributing to completion of the group project in both the RMB CB and the CMB CB treatments once a critical number of tokens have been allocated to the group project by the group. In the RMB CB treatment, this critical value is 49 tokens. In the RMB CB treatment, 13 of the 28 groups reach a total group allocation of 49 tokens before the 10th and final round. In 12 of these 13 groups, the project is eventually completed, providing strong evidence for some groups reaching the equilibrium in which the group project is fully funded.
Similarly, the critical value is 54 tokens in the CMB CB treatment. Twelve of the 32 groups in the CMB CB treatment reach the critical value before the 10th and final round. In 11 of these 12 groups, the project is completed.
Result 4: Substantial early contributions to the group project often lead to eventual project completion. Project completion is extremely rare when early contributions are not made.
In order to explore the question of how early cooperative behavior affects future round dynamics, we examine group contributions conditionally on whether or not the group contributed 20 or more tokens after three rounds. While this design is essentially arbitrary, we find that it is very predictive of later group cooperation and eventual project completion during the final seven rounds.
Table 5 shows project completion rates and the mean percentage of the remaining project contributed over the final seven rounds, conditional on whether a group reached 20 tokens before round 4. It is quite clear from the table that reaching 20 tokens before round four is an indicator of later group contributions and eventual project completion. None of the groups in the CMB, RMB, or CMB CB treatments complete the project if they do not reach at least 20 tokens before round four. Two such groups exist in the RMB CB treatment in which project completion was more common overall.
When groups reach at least 20 tokens before round 4, projects are completed a sizable percentage of the time. These percentages increase in the expected way with the RMB CB treatment being the highest percentage with more than 60% of these groups completing the project. As previously shown, project completion rates are higher in the treatments with a completion benefit. Possible explanations for this result are twofold: (1) In both the CMB CB and the RMB CB treatments, a larger percentage of groups make sizable contributions in early rounds (this is most pronounced in the CMB CB treatment); and (2) in the RMB CB treatment, groups with sizable early contributions tend to go on to complete the project more frequently than similar groups in other treatments.
Result 4 is largely consistent with papers that demonstrate the effectiveness of seed donations or challenge gifts in fundraising, both theoretically as in Andreoni (2006) [16] and experimentally as in Bracha et al. (2011) [17], Rondeau and List (2008) [18], and Tavoni et al. (2011) [19]. In our experiments, early leadership contributions appear necessary to allow eventual project completion to “get out of the gate.”

3.3. Evidence of Confusion

Result 5: Some behavior that could not possibly be in the interest of subjects is observed. In all but one case, this behavior is minor.
In our experiments, it could never be in the interest of an individual to contribute to the group project in any round after which the group project has already been completed. Contributions of this kind occur in 16 of the 33 groups that we observe completing the group project across all four treatments. In all but two of these instances, these events occurred in the first sequence repetition. Secondly, these events are only for a relatively minor number of tokens, averaging close to two extra tokens per group. However, we did observe one outlying group in the RMB treatment that contributed 30 additional tokens in rounds after the project had already been completed. That outlying group is the only extreme example of confusion observed in our results.

4. Conclusions

Many public goods and projects are funded by voluntary contributions that are made repeatedly by the same group of individuals with individuals being repeatedly updated on the level of contributions. This study examines such dynamic funding of a public good or project over a sequence of rounds in the lab with an experimental design based upon the theoretical model of Marx and Matthews (2000) [4]. In results similar to previous research, we find that significant funding of the public project occurs in such a dynamic environment.
We make a completely original contribution to the existing experimental literature on the dynamic funding of public goods with our examination of rising marginal benefit treatments in which the marginal benefit of contributing to a project increases as the project gets closer to completion. We find, absent a completion benefit, there is little difference in project funding with a rising marginal benefit relative to a constant marginal benefit. This result is contradictory to static VCM experiments that show a positive correlation between contributions to the group project and the individual payoff to a contribution (see Ledyard, 1995 [3] and Isaac and Walker, 1988 [20]) Some possible reasons that explain the ineffectiveness of the rising marginal benefit treatment to increase contributions relative to constant marginal benefit treatment are: (1) Since the rising marginal benefit does not alter the total value of the project, there is no theoretical difference in results between the treatments without the existence of the completion benefit; (2) the initial lower individual payoff for contributing to the project for the first 20 tokens in the rising marginal benefit treatment may hinder subjects from contributing to the project in the early rounds; and (3) unlike the traditional static provision point public good experiments, passing the threshold in our rising marginal benefit treatment only raises payoffs for further contributions rather than all contributions (e.g., passing 40 tokens only increases the payoff for the 41st through 60th token, not the first through 60th token).
Our study finds strong evidence for the importance of completion benefits. We find that group contributions to a public project increase in the presence of a completion benefit and projects are completed much more often compared to the constant marginal benefit treatment. This is true in spite of the fact that completion benefits are small compared to the total benefit of projects, and would not be enough to make full project funding worthwhile for groups in a static environment. This provides evidence for the game theoretic equilibria derived in Marx and Matthews (2000) [4] which achieve full project completion when a completion benefit exists.
We find that completion benefits are more important to group outcomes than was found in Duffy et al. (2007) [6].

Author Contributions

“Conceptualization, M.H.; Methodology, M.H.; Software, M.H.; Formal Analysis, R.B. and M.H.; Investigation, R.B. and M.H.; Resources, R.B. and M.H.; Data Curation, R.B.; Writing-Original Draft Preparation, R.B. and M.H.; Writing-Review & Editing, R.B.; Funding Acquisition, R.B. and M.H.

Funding

This research received no external funding.

Acknowledgments

We acknowledge research support from Pennsylvania State University, and Millersville University of Pennsylvania. Also, we would like to acknowledge helpful comments received at the 2010 meeting of the Southern Economic Association, and the 2011 International Meeting of the Economic Science Association.

Conflicts of Interest

The authors declare no conflict of interest.

Appendix A

Experiment Instructions: RMB CB Treatment

This is an experiment in the economics of group and individual decision making. In the course of the experiment, you will have the opportunity to earn money. The actual amount of money that you earn will depend upon your decisions during the experiment. It is, therefore, important that you read these instructions carefully. Please do not communicate with other participants during the experiment. If you have any questions, please raise your hand.
In this experiment, you will participate in a series of 4 sequences. At the start of each sequence, you will be randomly assigned to a 5 person group. The other 4 members of your group will never know your identity nor will you know their identity. All decisions you make in this experiment are anonymous. Each sequence will consist of 10 rounds. You will be matched with the same 4 people for all 10 rounds of each sequence.
At the beginning of a sequence, each group member will have 20 tokens in his or her private account. In each round of the sequence, you and each of the other 4 group members must decide how many tokens to allocate to the group account in addition to the tokens you have allocated to the group account in the previous rounds of the sequence. Tokens not allocated to the group account will remain in your private account. All members of your group will see the number of tokens in the group account on their computer screens, but no member of your group will know how many of the tokens in the group account came from anyone other than him or herself.
At the beginning of each round, you will be shown how many tokens remain in your private account and how many tokens are in the group account. The number of tokens in the group account equals the sum of tokens placed by you and the other 4 group members into the group account in all previous rounds of the sequence. You will then be asked to make your allocation decision for that round. You may choose to allocate any number of tokens to the group account from 0 tokens up to the number of tokens remaining in your private account. Once tokens have been allocated to the group account, you will not be able to remove them from the group account in the following rounds of the sequence.
In each round, an input screen like the one below will appear:
Figure A1. Input Screen.
Games 09 00043 g0a1
The number of the current sequence appears in the top left corner of the screen. The number of the current round in the sequence is shown in the center of the screen above the input box. A table showing possible earnings from the sequence is to the left of the input box. Finally, inside the input box, you are shown the current round of the sequence, how many tokens have been allocated by the entire group including yourself to the group account in previous rounds of the sequence, and how many tokens are remaining in your private account in the current round of the sequence. Within the input box, you will enter your decision of how many tokens you wish to allocate to the group account in each round.
A close-up view of where you will make your decision in each round is shown below:
Figure A2. Subject Decision Screen.
Games 09 00043 g0a2
After you enter your group account allocation decision in each round, press the okay button with the mouse. You will then be asked to confirm your decision. Double check that you entered what you intended, and confirm your decision with the mouse.
Your earnings from each sequence will be determined after the 10 rounds of decisions. Your earnings depend on the number of tokens remaining in your private account, and the total number of tokens you and the other 4 group members have placed into the group account at the end of the 10 rounds. For each token remaining in your private account at the end of round 10, you will earn 10 cents.
For each token placed into the group account, payments will accrue to all group members in the way shown below. Each group member’s earnings from the group account depend solely on the total number of tokens in the group account; they do not depend specifically on how many tokens that particular group member allocated to the group account.
For each additional token allocated to the group account by any group member up to 20 total tokens, you and each of the other group members will earn 4 cents.
For each additional token allocated to the group account by any group member from 21 to 40 total tokens, you and each of the other group members will earn 6 cents.
For each additional token allocated to the group account by any group member from 41 to 59 total tokens, you and each of the other group members will earn 8 cents.
Finally, if the total number of tokens in the group account reaches 60 or more total tokens, each group member will receive an additional one-time payment of 30 cents.
Additional allocations to the group account beyond 60 tokens will not increase anyone’s earnings from the group account any further.
For example, assume that during the 10 rounds of the sequence, you place a total of 9 tokens into the group account and keep 11 in your private account. Also, assume that the total number of tokens placed in the group account by the entire group at the end of the sequence (including the 9 tokens you placed in the group account) is 47.
From the group account, you would earn 4 cents for each of the first twenty tokens, plus 6 cents for each of the next twenty tokens, plus 8 cents for the last 7 tokens in the group account. Your total earnings from the group account would be:
0.04 × 20 + 0.06 × 20 + 0.08 × 7 = $2.56
For each of the 11 tokens remaining in your private account you would earn 10 cents, for a total of $1.10.
Your total earnings at the end of the sequence would be the sum of your earnings from the group account, and from the private account:
$2.56 + $1.10 = $3.66
This result will display on the screen in the way shown below:
Figure A3. Output Screen.
Games 09 00043 g0a3
You will see a screen like the one above after every round, which displays the decisions that have been made so far, and breaks down what your current earnings are as a result of those choices. Remember that tokens can be added to the group account in every round, so this output screen will only show you final earnings for a sequence after the 10th and last round of each sequence.
After each 10-round sequence, you will a screen similar to the one below that displays how much you earned during the previous sequence and your total earnings from all sequences so far. Remember that you will be randomly assigned to a new 5-person group before each sequence.
Figure A4. End of Sequence Screen.
Games 09 00043 g0a4
To review, your total payoff for each sequence is the sum of your earnings from your private account and from the group account. Your total payoff will be shown on your computer screen. Remember that earnings from the group account depend only on the total number of tokens in the group account; they do not depend specifically on how many tokens you allocated to the group account.
After the 4 sequences are completed, you will be asked to complete a very short questionnaire. The information you provide will not be shared with anyone besides the experimenters.
Your earnings at the end of the experiment will be the sum of your earnings from each of the 4 sequences. At the end of the experiment, you will be called to the side of the room to be paid your total earnings, plus a $5.00 show up fee in private.
Does anyone have any questions before we begin?

References

  1. Croson, R.T.A. Theories of Commitment, Altruism and Reciprocity: Evidence from Linear Public Goods Games. Econ. Inq. 2007, 45, 199–216. [Google Scholar] [CrossRef]
  2. Schelling, T.C. The Strategy of Conflict; Harvard University Press: Cambridge, MA, USA, 1960. [Google Scholar]
  3. Ledyard, J.O. Public Goods: A Survey of Experimental Research. In Handbook of Experimental Economics; Kagel, J., Roth, A., Eds.; Princeton University Press: Princeton, NJ, USA, 1995. [Google Scholar]
  4. Marx, L.M.; Matthews, S.A. Dynamic Voluntary Contribution to a Public Project. Rev. Econ. Stud. 2000, 67, 327–358. [Google Scholar] [Green Version]
  5. Compte, O.; Jehiel, P. Gradualism in Bargaining and Contribution Games. Rev. Econ. Stud. 2004, 71, 975–1000. [Google Scholar] [CrossRef] [Green Version]
  6. Duffy, J.; Ochs, J.; Vesterlund, L. Giving Little by Little: Dynamic Voluntary Contribution Games. J. Public Econ. 2007, 91, 1708–1730. [Google Scholar] [CrossRef]
  7. Choi, S.; Gale, D.; Kariv, S. Sequential Equilibrium in Monotone Games: Theory-Based Analysis of Experimental Data. J. Econ. Theory 2008, 143, 302–330. [Google Scholar] [CrossRef]
  8. Battaglini, M.; Nunnari, S.; Palfrey, T.R. The Dynamic Free Rider Problem: An Experimental Study. Am. Econ. J. Microecon. 2016, 8, 268–308. [Google Scholar] [CrossRef]
  9. Gachter, S.; Mengel, F.; Tsakas, E.; Vostroknutov, A. Growth and inequality in public good provision. J. Public Econ. 2017, 150, 1–13. [Google Scholar] [CrossRef]
  10. Andreoni, J. Giving with Impure Altruism: Applications to Charity and Ricardian Equivalence. J. Polit. Econ. 1989, 97, 1447–1458. [Google Scholar] [CrossRef]
  11. Vesterlund, L. The Informational Value of Sequential Fundraising. J. Public Econ. 2003, 87, 627–657. [Google Scholar] [CrossRef]
  12. Palfrey, T.R.; Rosenthal, H. Participation and the provision of discrete public goods: A strategic analysis. J. Public Econ. 1984, 24, 171–193. [Google Scholar] [CrossRef]
  13. Marks, M.B.; Croson, R. Alternative rebate rules in the provision of a threshold public good: An experimental investigation. J. Public Econ. 1998, 67, 195–220. [Google Scholar] [CrossRef] [Green Version]
  14. Croson, R.T.A.; Marks, M.B. Step returns in threshold public goods: A meta- and experimental analysis. Exp. Econ. 2000, 2, 239–259. [Google Scholar] [CrossRef]
  15. Fischbacher, U. z-Tree: Zurich Toolbox for Ready-Made Economic Experiments. Exp. Econ. 2007, 10, 171–178. [Google Scholar] [CrossRef]
  16. Andreoni, J. Leadership Giving in Charitable Fundraising. J. Public Econ. Theory 2006, 8, 1–22. [Google Scholar] [CrossRef]
  17. Bracha, A.; Menietti, M.; Vesterlund, L. Seeds to Succeed? Sequential giving to public projects. J. Public Econ. 2011, 95, 416–427. [Google Scholar] [CrossRef]
  18. Rondeau, D.; List, J.A. Matching and Challenge Gifts to Charity: Evidence from Laboratory and Natural Field Experiments. Exp. Econ. 2008, 11, 253–267. [Google Scholar] [CrossRef]
  19. Tavoni, A.; Dannenberg, A.; Kallis, G.; Löschel, A. Inequality, communication, and the avoidance of disastrous climate change in a public goods game. Proc. Natl. Acad. Sci. USA 2011, 108, 11825–11829. [Google Scholar] [CrossRef] [PubMed] [Green Version]
  20. Isaac, R.M.; Walker, J.M. Group Size Effects in Public Goods Provision: The Voluntary Contribution Mechanism. Q. J. Econ. 1988, 53, 179–200. [Google Scholar] [CrossRef]
1
Strong preferences for reciprocity have been shown to drive behavior in VCM experiments, see Croson (2007) [1].
2
Shelling (1960) [2] originated this theoretical idea.
3
See Ledyard (1995) [3] for a review of static public goods experiments.
4
The model of Compte and Jehiel (2004) [5] provides similar conclusions about how contributions can be enhanced in dynamic funding environments. In the place of a completion benefit, Compte and Jehiel (2004) rely upon the existence of outside options and the ability of subjects to terminate the project to facilitate cooperative equilibria.
5
Other studies that use a repeating simultaneous dynamic design are Choi et.al. (2008) [7], Battaglini et al. (2016) [8], and Gachter et al. (2017) [9].
6
A rising marginal benefit of contribution as a project nears completion would also be consistent with the warm giving hypothesis of Andreoni (1989) [10] because later contributions could be viewed by contributors as more likely to influence whether others will be able to enjoy a completed project.
7
Fundraisers often provide explicit completion benefits to contributors in the form of plaques or bricks placed in completed building projects that display the names of contributors.
8
If T = 1 , λ 2 = 0 , and B > P i M ¯ , the CMB CB treatment becomes a traditional provision point VCM with no rebate. See for example, Marks and Croson (1998) [13]. Provision point VCMs can have funding equilibria in one-round games.
9
Zero-provision of the group project would also be a possible equilibrium of the multi-round game.
10
For this to be true, it would be sufficient that P i < B < λ 3 ( 1 M ¯ n ) + P i ( M ¯ n ) .
11
Note that λ2 is parametrized to be the mean of λ1, λ2, and λ3. This allows the CMB and RMB treatments to be comparable, as the return to a completed project is identical between these treatments.
12
Duffy et al. (2007) [6] contains treatments analogous to our CMB and CMB CB treatments. Using the symbols of our model, their experiments are parameterized as follows: n = 3, T = 4, Zi = 6, Pi = $0.10, M ¯ = 12 , λ2 = $0.05, and B = $0.10.
13
Our design is structured such that the M ¯ th token does not pay the individual marginal benefit, λ 2   in the CMB CB treatment or λ3 in the RMB CB treatment, and only pays the completion benefit. Alternatively, as is done in Duffy et al. (2007) [6], the payoff function could have been structured such that the M ¯ th token did pay the individual marginal benefit with B = $0.30 − λ2 in the CMB CB treatment, and B = $0.30 − λ3 in the RMB CB treatment. The designs are mathematically identical, and the predictions of our model would not change.
14
Subjects include: economics, business, history, geography, and earth sciences.
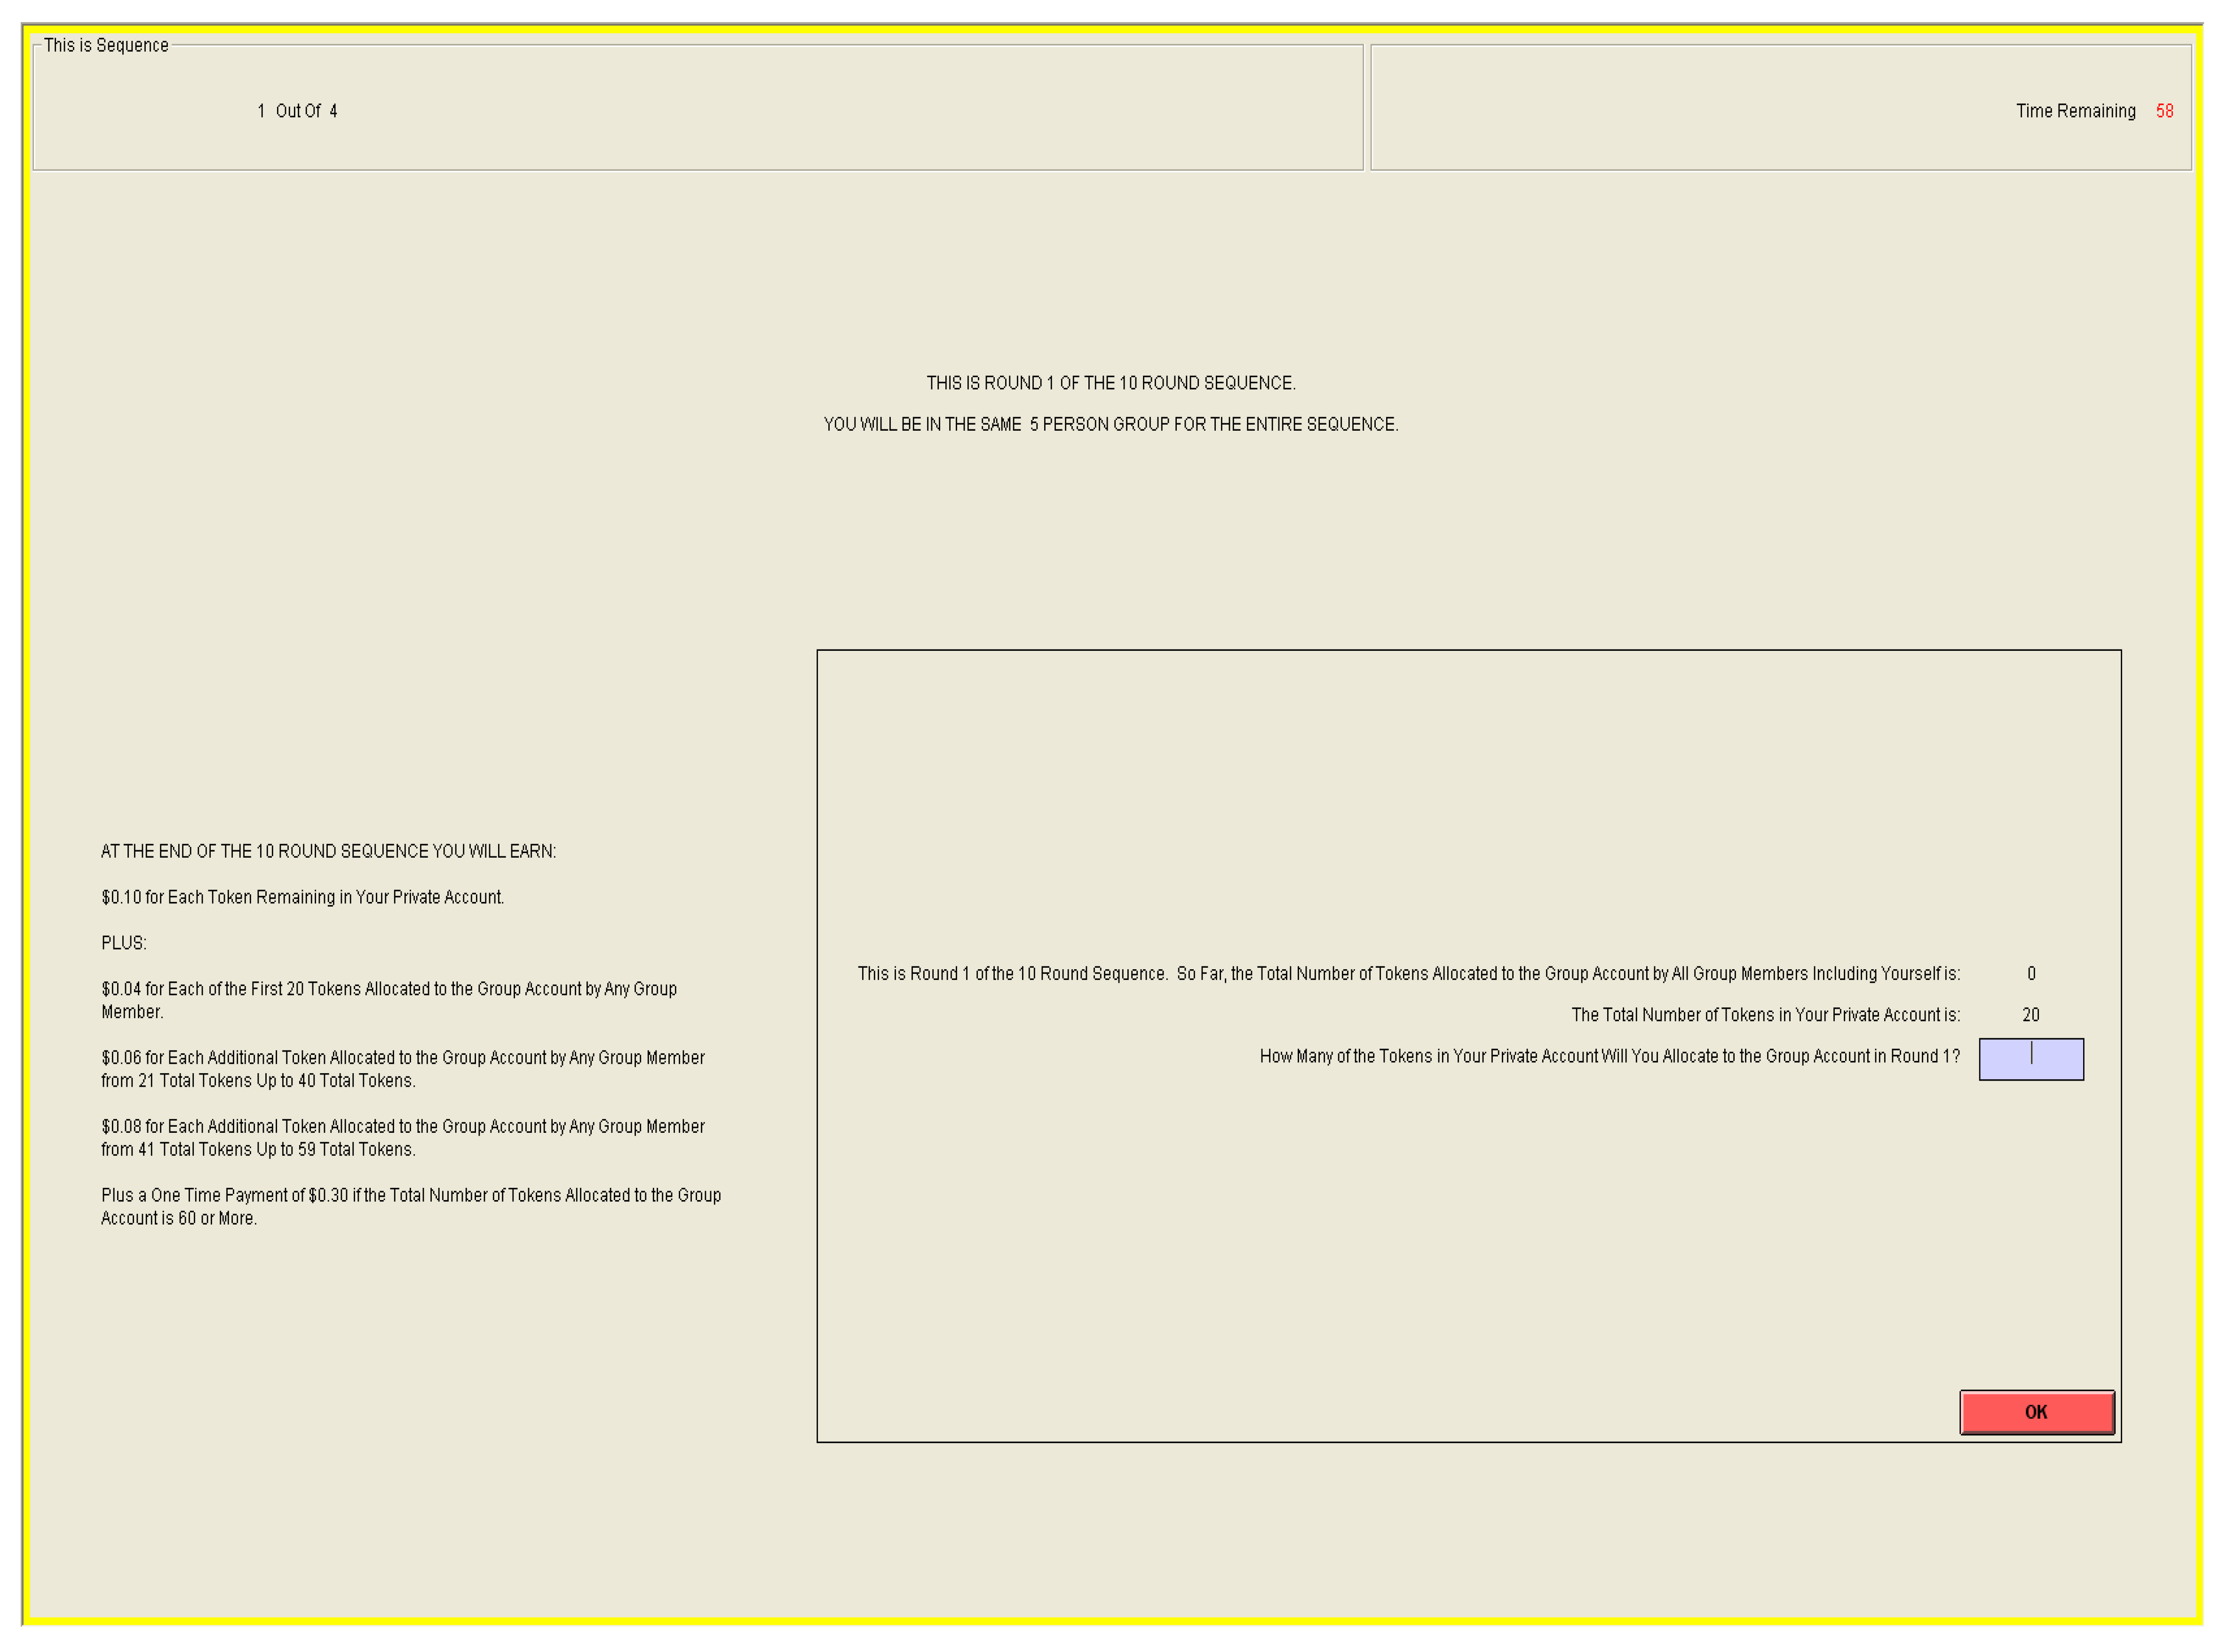
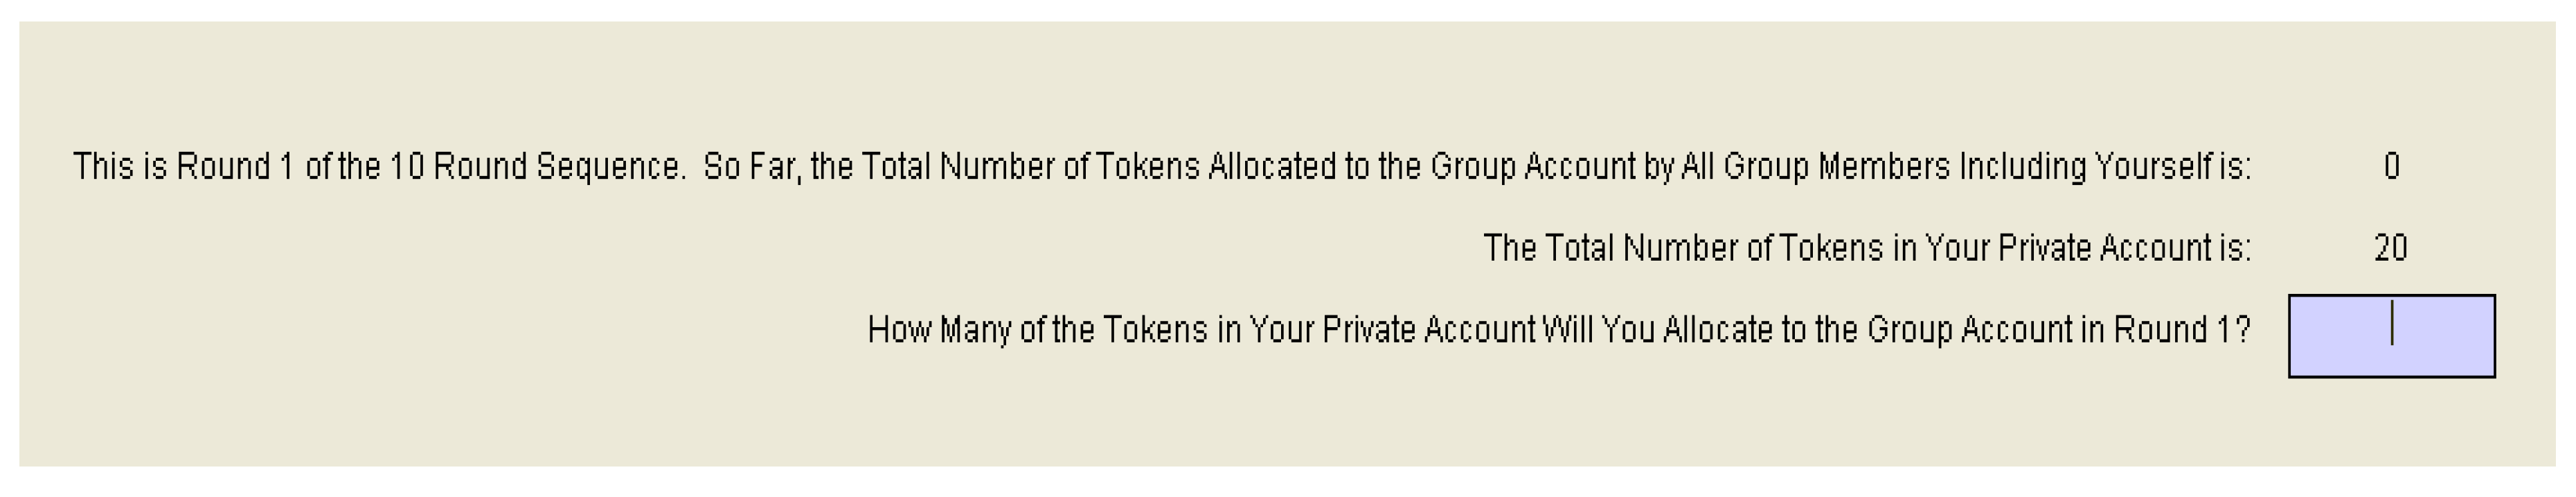
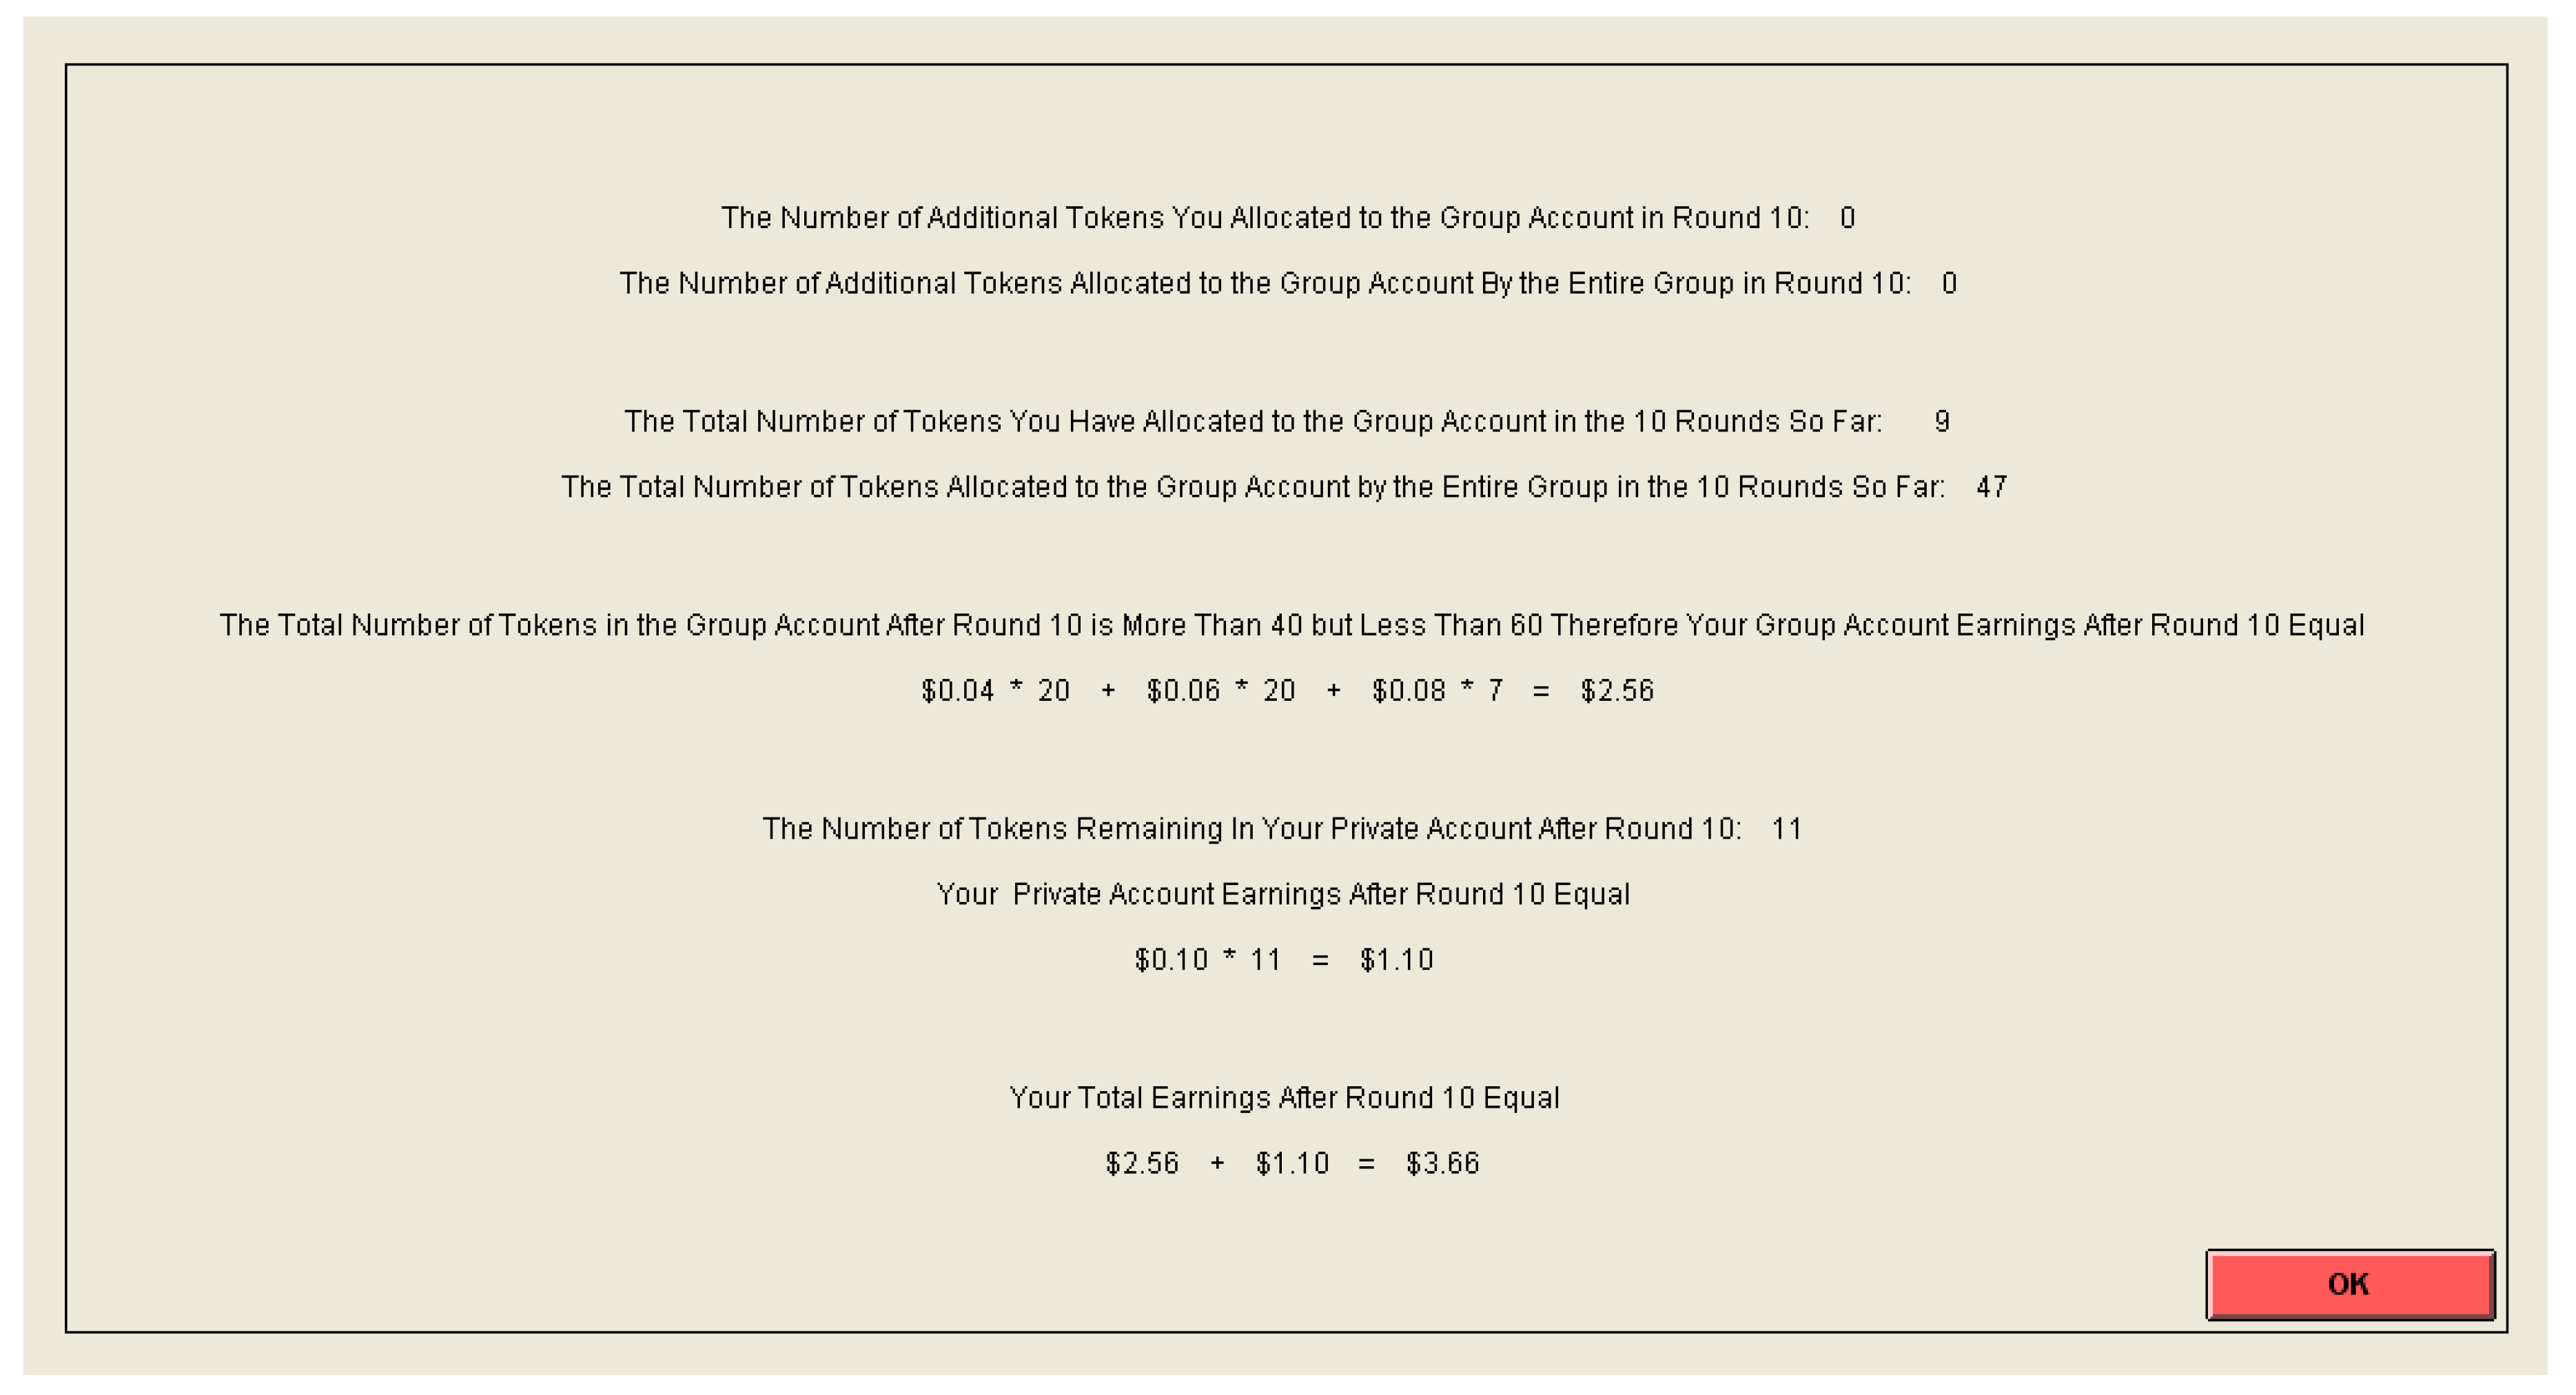
15
Computer screenshots and software are available upon request from the authors.
16
Instructions for the RMB CB treatment are included in the appendix, other instructions are similar. Copies of the instructions for all treatments are available upon request from the authors.
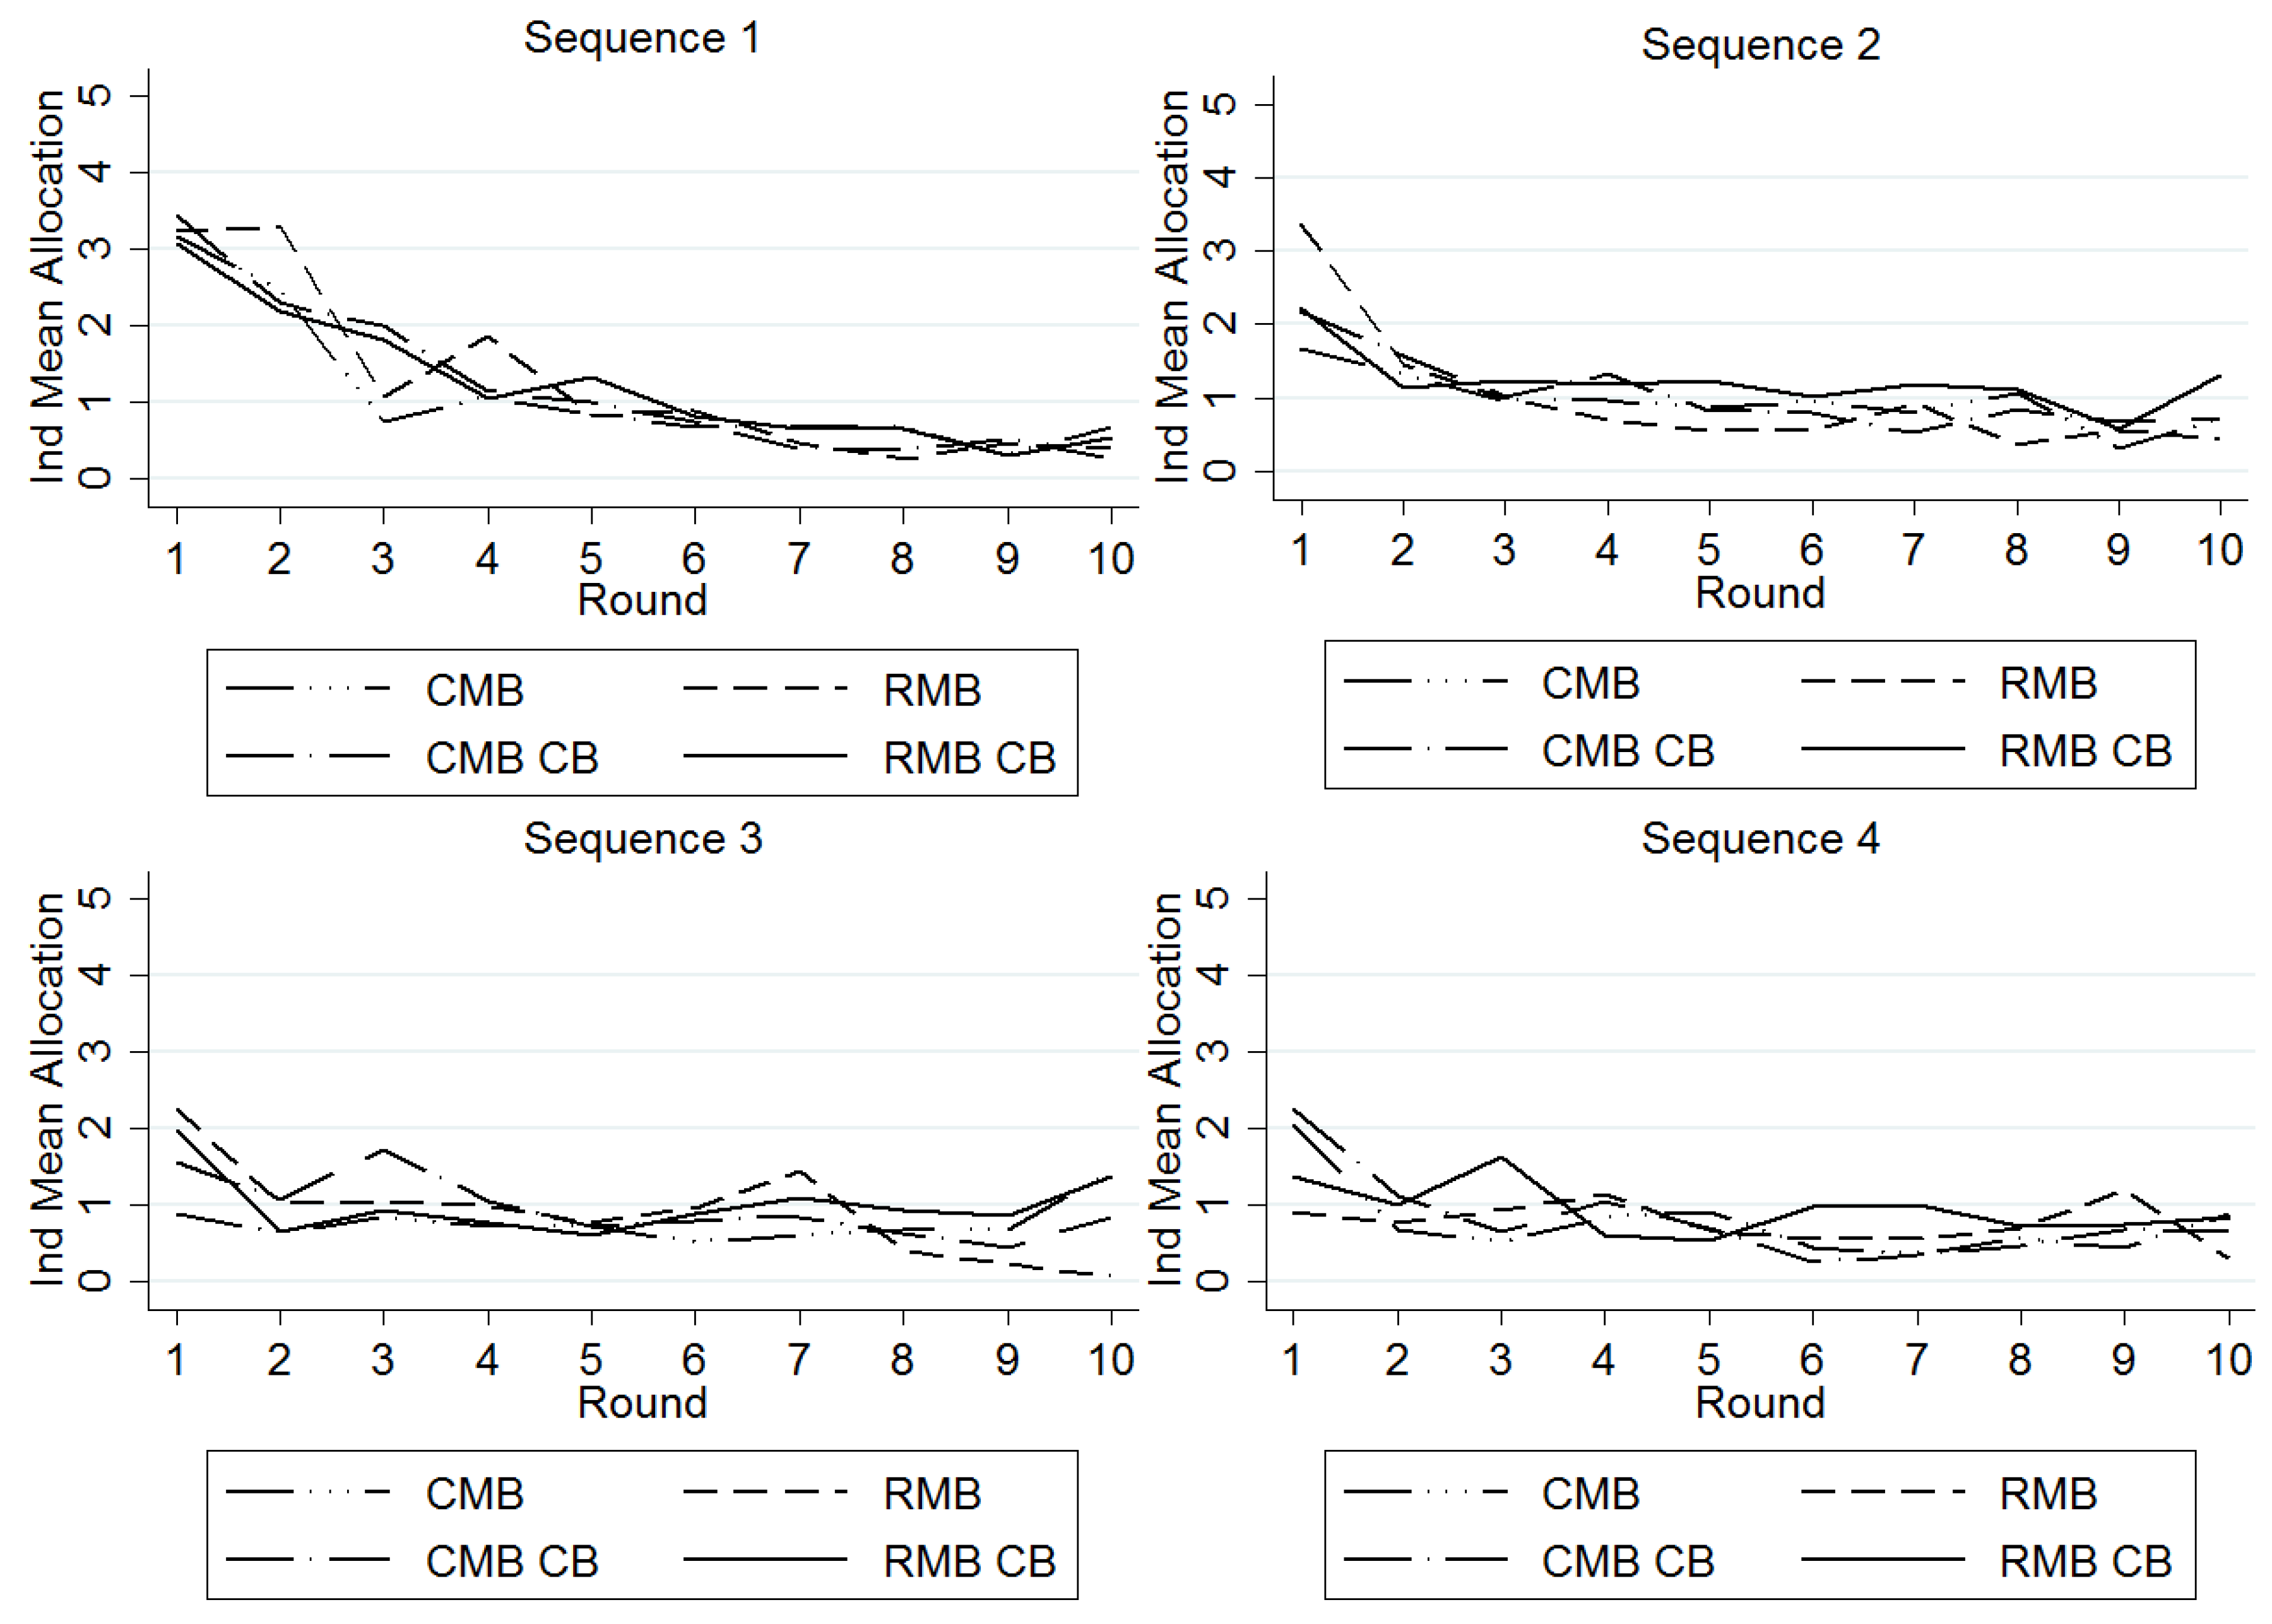
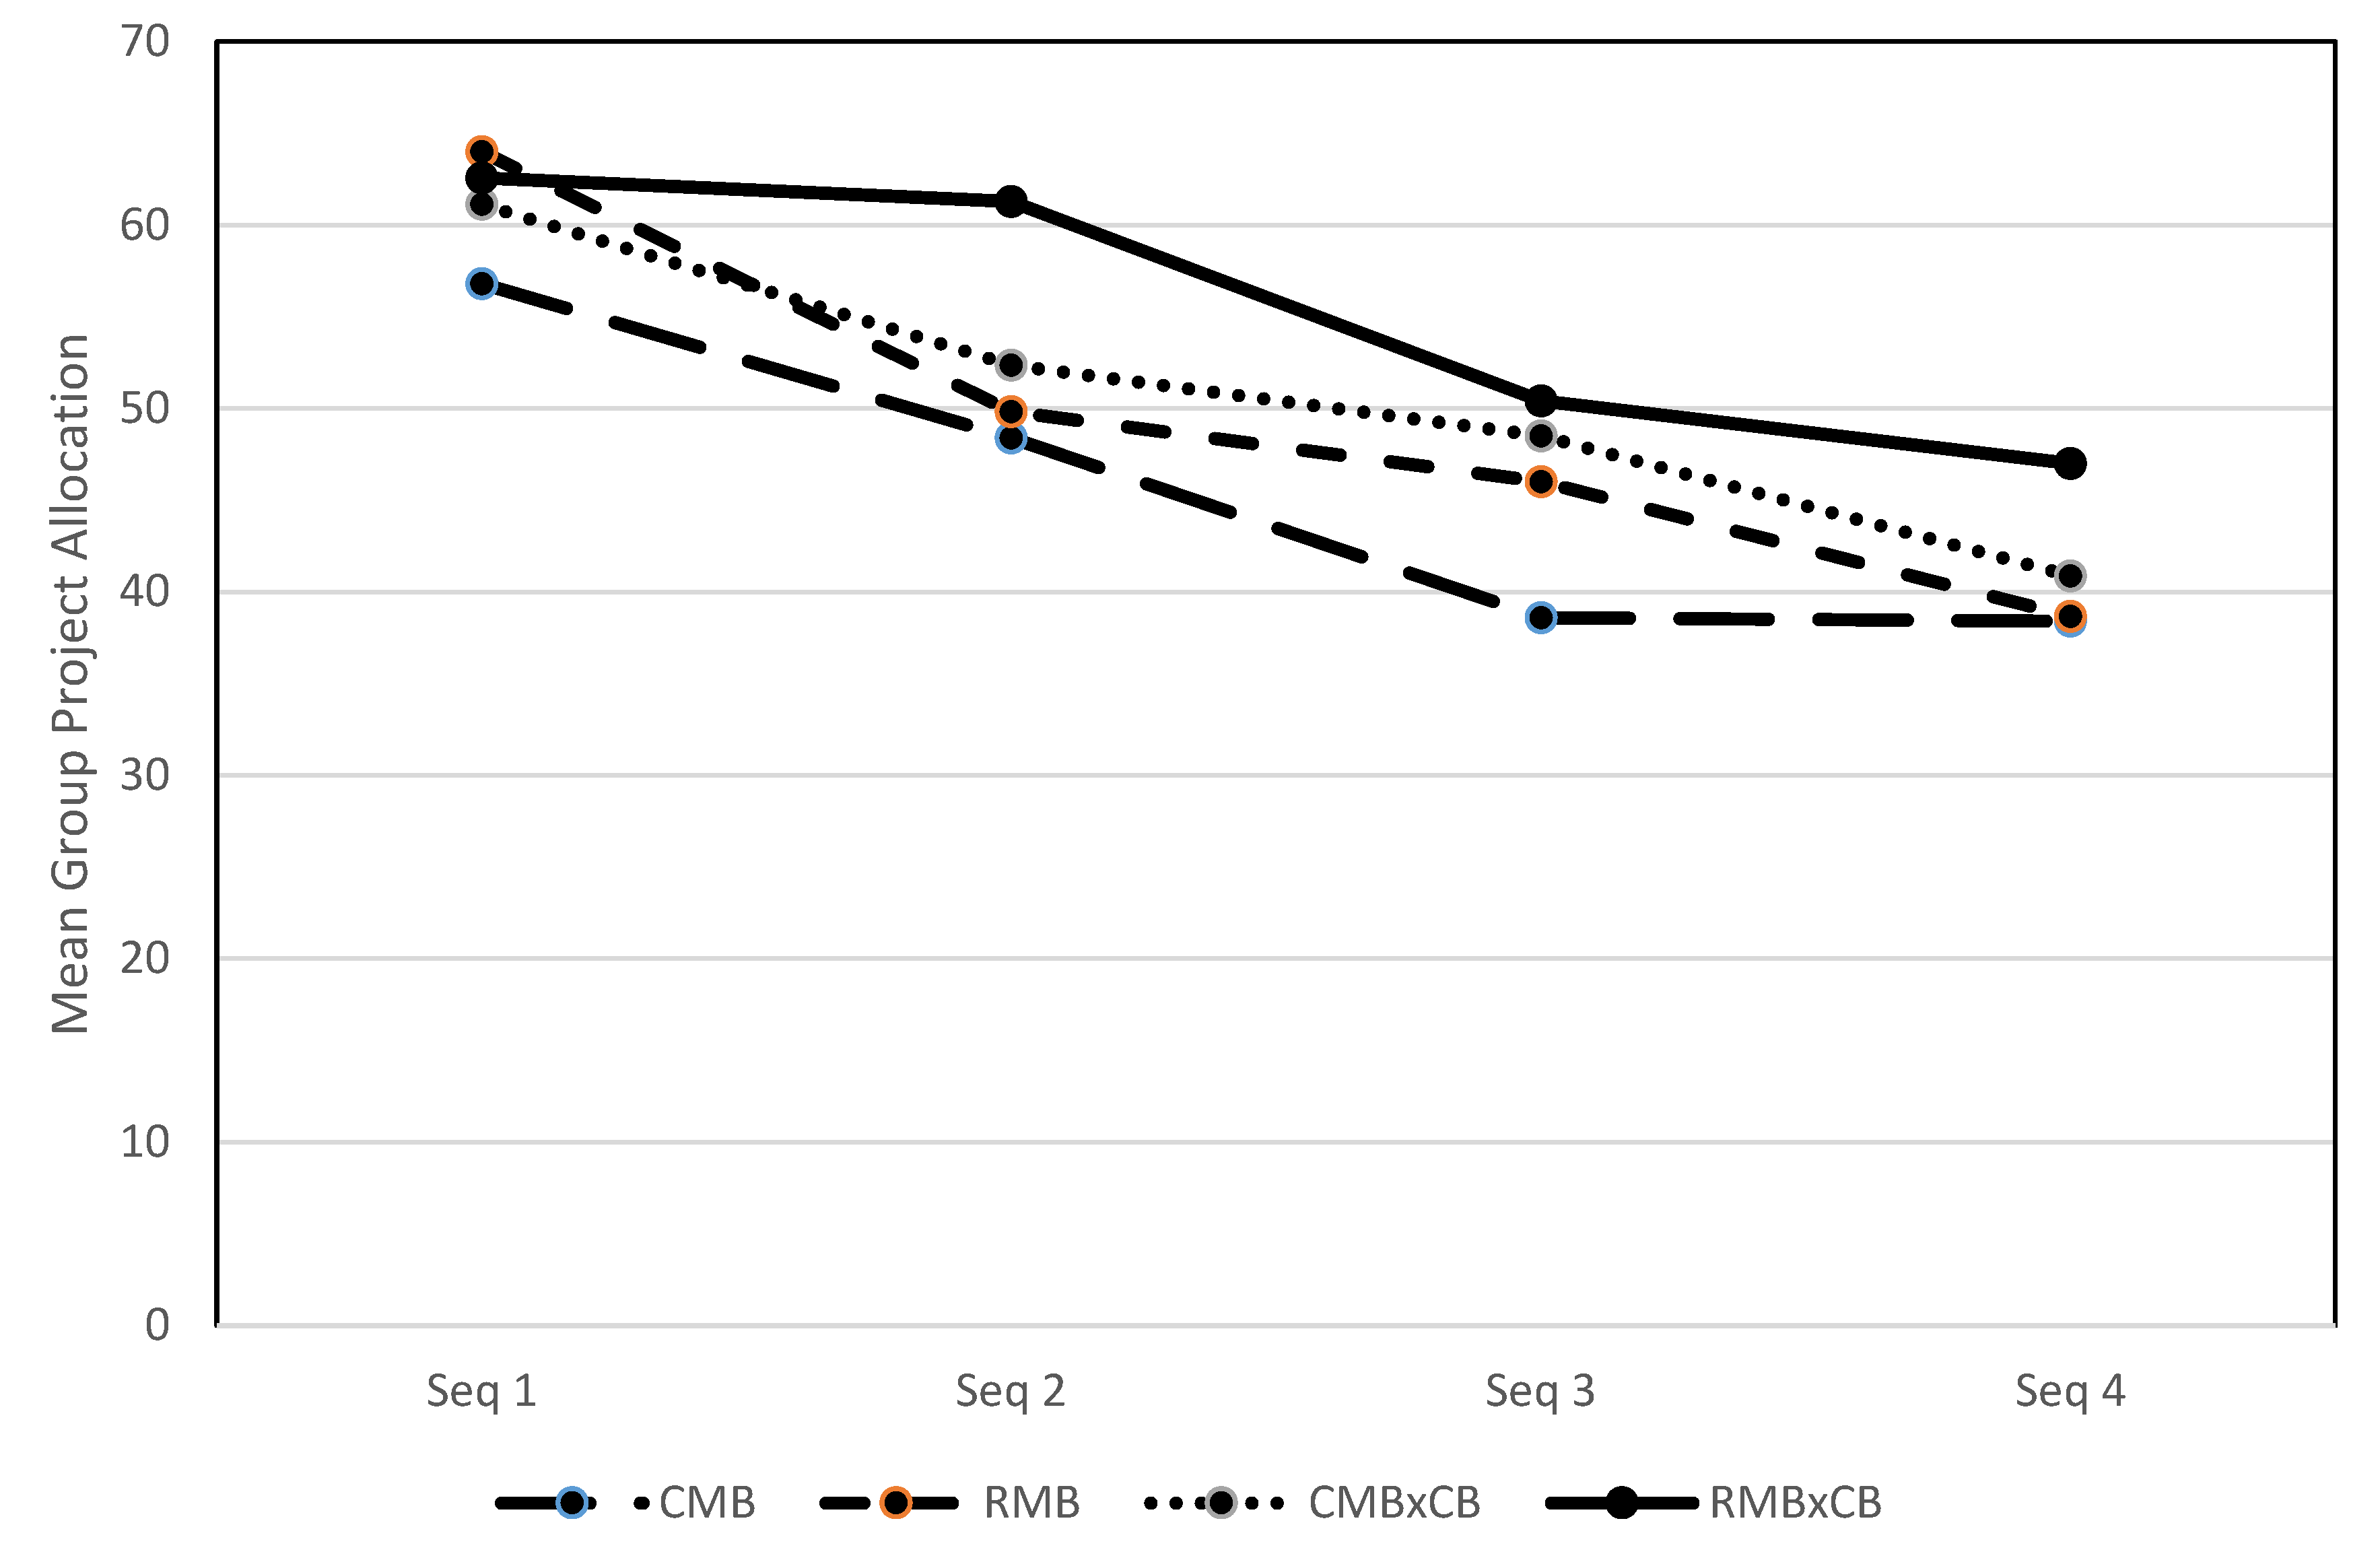
17
When the data analysis presented in this section is repeated using only data from the first sequence, there is no statistical difference in contributions or completion rates between treatments. Subjects may be forming beliefs about how others will behave in the game based on their previous interactions. Examining Figure 1, it appears the existence of the completion benefit prevents contributions from decaying as much as the CMB and RMB treatments as the sequences progress.
18
There is one outlying group with a total group contribution of 91 tokens in the RMB treatment. Members of this group made mistaken choices as 30 additional tokens were contributed to the group project in rounds following the round in which the project was completed. All results are qualitatively similar if this group is removed from the data.
19
Recall that new groups were formed for each sequence within an experimental session.
20
Sequence 1: Round 3 (p = 0.003); Sequence 2: Round 4 (p = 0.08), Round 6 (p = 0.08), Sequence 3: Round 3 (p = 0.08), Round 7 (p = 0.09), Round 10 (p = 0.02); Sequence 4: Round 6 (p = 0.04).
Figure 1. Mean Group Project Allocation by Sequence.
Games 09 00043 g001
Figure 2. Percentage of Completed Group Projects by Sequence.
Games 09 00043 g002
Figure 3. Ind Mean Allocations to the Group Project.
Games 09 00043 g003
Table 1. Experimental Sessions and Treatments.
Treatment ConditionNumber of Experimental SessionsNumber of SubjectsTotal Number of 10-Round Sequences Completed by 5-Subject Groups
CMB22520
RMB23024
CMB CB34032
RMB CB33528
Table 2. Total Group Contributions to the Group Project.
TreatmentNumber of ObservationsMeanStandard DeviationMinimum ObservationMaximum Observation
CMB2045.5513.202070
RMB2449.6316.451291
CMB CB3250.7212.772570
RMB CB2855.3211.192673
Table 3. OLS Regression with Robust Clustered Standard Errors. Dependent Variable: Total Group Contribution to the Group Project.
(a) Coefficients
Independent VariableCoefficient EstimateStandard ErrorHo: Coefficient = 0
tp-Value
Constant56.1851.41139.830.000
RMB4.0754.3990.930.378
CMB CB5.1691.0644.860.001
RMB CB9.7711.1778.300.000
2nd Sequence−7.9232.019−3.920.003
3rd Sequence−14.8082.011−7.360.000
4th Sequence−19.8081.854−10.680.000
(b) Hypothesis tests across treatments and sequences
Compared TreatmentsHop-Value
CMB vs. RMBRMB = 00.378
CMB vs. CMB CBCMB CB = 00.001
CMB vs. RMB CBRMB CB = 00.000
RMB vs. CMB CBRMB − CMB × CB = 00.813
RMB vs. RMB CBRMB − RMB × CB = 00.240
CMB CB vs. RMB CBCMB × CB − RMB × CB = 00.014
2nd Seq vs. 3rd Seq2nd Seq − 3rd Seq = 00.011
2nd Seq vs. 4th Seq2nd Seq − 4th Seq = 00.000
3rd Seq vs. 4th Seq3rd Seq − 4th Seq = 00.008
(a): Total number of observations = 104, R-squared = 0.3623.
Table 4. Logit Model with Robust Clustered Standard Errors. Dependent Variable: 1 if Group Project Completed, 0 Otherwise.
(a) Coefficients
Independent VariableCoefficient EstimateStandard ErrorHo: Coefficient = 0
Zp-Value
Constant−0.3290.571−0.580.565
RMB0.8390.7421.130.258
CMB x CB1.4820.6692.210.027
RMB x CB2.2130.7532.940.003
2nd Sequence−1.6490.745−2.210.027
3rd Sequence−2.8170.470−5.990.000
4th Sequence−3.6350.657−5.530.000
(b) Marginal Effects
Independent VariableMarginal EffectStandard ErrorHo: coefficient = 0
Zp-Value
RMB0.1720.1631.060.290
CMB x CB0.3060.1362.250.024
RMB x CB0.4710.1553.030.002
2nd Sequence−0.2450.078−3.130.002
3rd Sequence−0.3620.043−8.360.000
4th Sequence−0.4290.051−8.480.000
(c) Hypothesis tests across treatments and sequences
Conditional Means ComparedHop-Value
CMB vs. RMBRMB = 00.258
CMB vs. CMB CBCMB CB = 00.027
CMB vs. RMB CBRMB CB = 00.003
RMB vs. CMB CBRMB − CMB × CB = 00.238
RMB vs. RMB CBRMB − RMB × CB = 00.041
CMB CB vs. RMB CBCMB × CB − RMB × CB = 00.157
2nd Seq vs. 3rd Seq2nd Seq − 3rd Seq = 00.126
2nd Seq vs. 4th Seq2nd Seq − 4th Seq = 00.001
3rd Seq vs. 4th Seq3rd Seq − 4th Seq = 00.336
(a): Total number of observations = 104, Log pseudolikelihood = −46.7668, Pseudo R2 = 0.2803.
Table 5. Later Round Behavior and Project Completion Conditional on Contributions in the First Three Rounds.
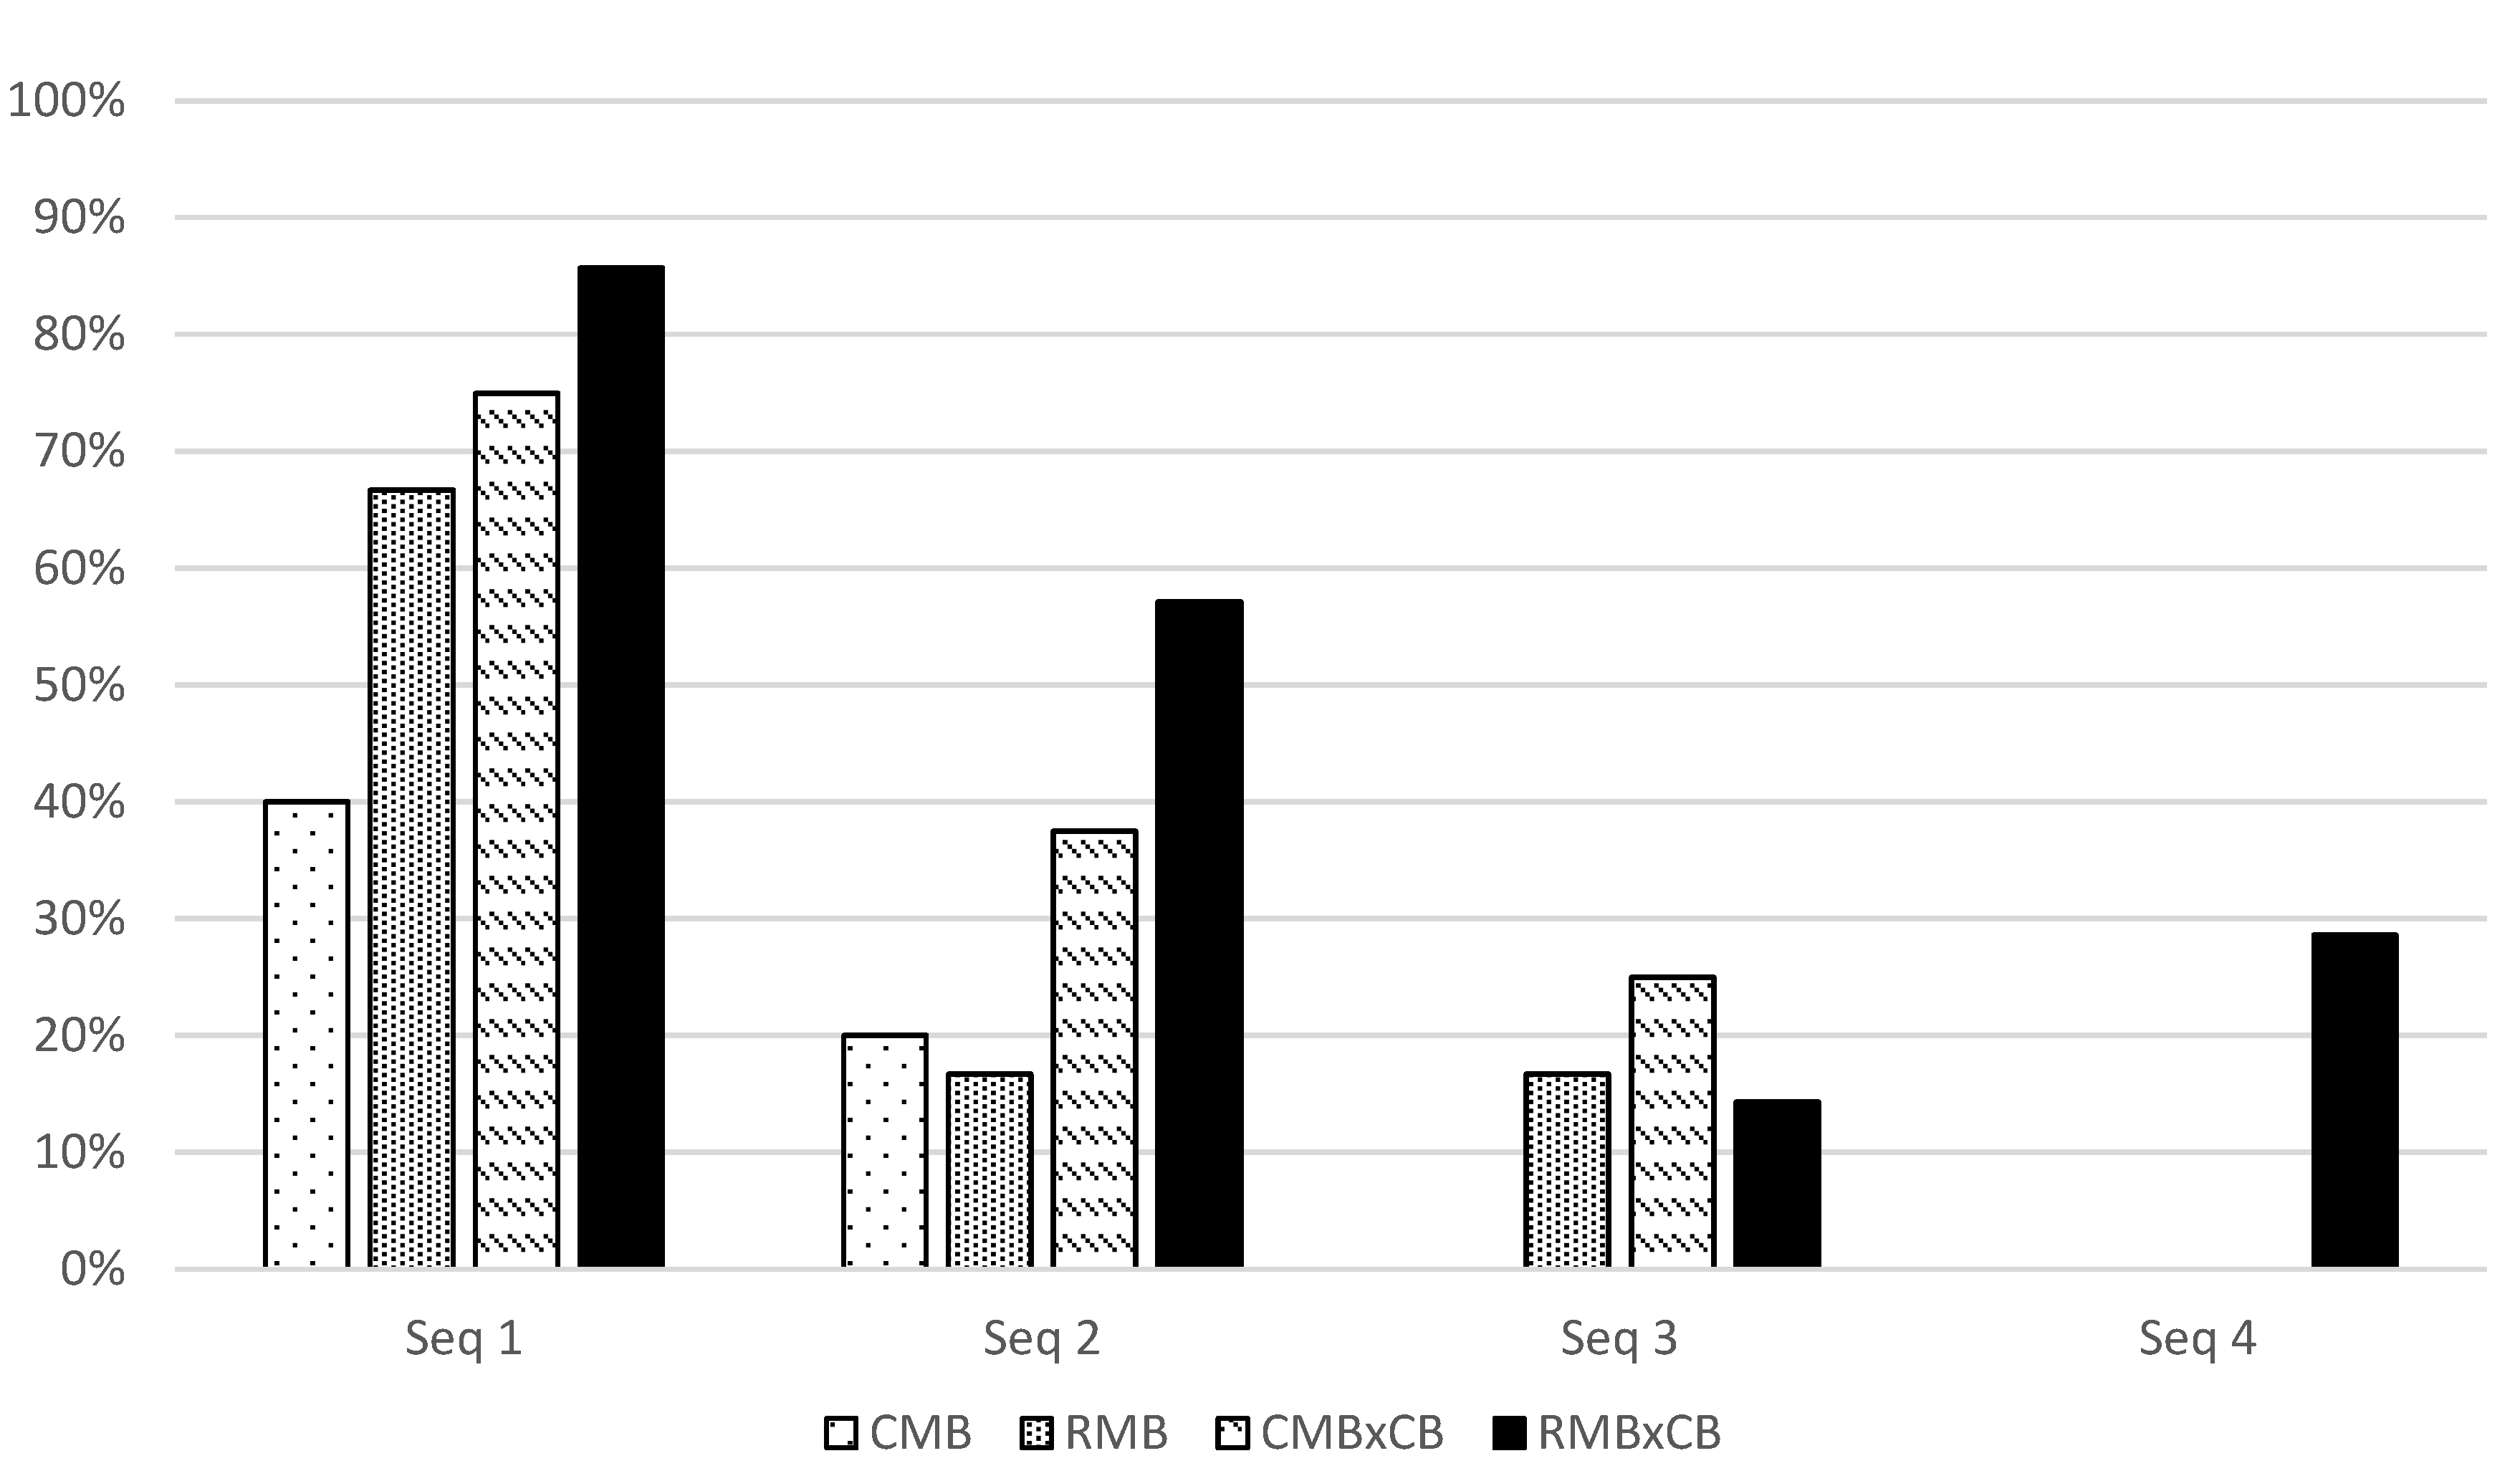
(a) Groups that Reach 20 Tokens Before Round Four
TreatmentTotal Number of GroupsNumber of Groups that Reach Minimum of 20 Tokens before Round 4 (Percentage of Total Groups)Number of Groups that Complete Project Conditional on Reaching Minimum of 20 Tokens before Round 4 (Percentage of Such Groups)Average Percentage of Remaining Project Completed Conditional on Reaching 20 Tokens before Round 4
CMB208 (40.00%)3 (37.50%)88.09%
RMB2413 (54.17%)6 (46.15%)125.34% *
CMB CB3223 (71.88%)11 (47.83%)81.82%
RMB CB2817 (60.71%)11 (64.71%)107.63%
(b) Groups that do not Reach 20 Tokens Before Round Four
TreatmentTotal Number of GroupsNumber of Groups that Complete Project Conditional on not Reaching 20 Tokens before Round 4 (Percentage of Such Groups)Average Percentage of Remaining Project Completed Conditional on Not Reaching 20 Tokens before Round 4
CMB200 (0.00%)57.40%
RMB240 (0.00%)58.09%
CMB CB320 (0.00%)55.36%
RMB CB282 (18.00%)74.22%
* This striking result is the result of the outlying group mentioned in result 9. If this group is removed, this number is 90.54%.

