Article

Cyclic Competition and Percolation in Grouping Predator-Prey Populations

by
Alessandra F. Lütz
1,
Annette Cazaubiel
2 and
Jeferson J. Arenzon
1,*
1
Instituto de Física, Universidade Federal do Rio Grande do Sul, CP 15051, 91501-970 Porto Alegre RS, Brazil
2
Normale Supérieure, International Center of Fundamental Physics, 45 Rue d’Ulm, 75005 Paris, France
*
Author to whom correspondence should be addressed.
Games 2017, 8(1), 10; https://doi.org/10.3390/g8010010
Submission received: 8 December 2016 / Accepted: 17 January 2017 / Published: 2 February 2017
(This article belongs to the Special Issue Evolutionary Games and Statistical Physics of Social Networks)

Abstract

:
We study, within the framework of game theory, the properties of a spatially distributed population of both predators and preys that may hunt or defend themselves either isolatedly or in group. Specifically, we show that the properties of the spatial Lett-Auger-Gaillard model, when different strategies coexist, can be understood through the geometric behavior of clusters involving four effective strategies competing cyclically, without neutral states. Moreover, the existence of strong finite-size effects, a form of the survival of the weakest effect, is related to a percolation crossover. These results may be generic and of relevance to other bimatrix games.

1. Introduction

Cyclic dominance is an important mechanism underlying the coexistence of competing species or strategies in several different contexts [1,2]. When one or more intransitive loops are present in the effective flux graph that contains information on how those species interact, the hierarchy introduced by other transitive loops may be attenuated, enhancing the conditions for the persistent survival of several species. The simplest, one loop example is the Rock-Paper-Scissors (RPS) game in which all three species have one prey and one predator each. Generalizations with more than three species may have more overlapping loops, some of which may be transitive, and introduce asymmetries and heterogeneities. When interacting with an odd number of other species, the symmetry between preys and predators is broken. Not only the number of preys and predators may be different, but this may change from one species to the other, one having more preys while other, more predators. As a consequence of this non-homogeneity, the flux graph is not invariant upon a permutation of labels. In addition to those games in which cyclic dominance is explicitly included in the flux graph, in some cases it may emerge from the payoff matrix. One example is three-strategies games with optional participation: Although not explicit in the payoff matrix, dominance emerges in the presence of these agents that do not follow the rules of the game and prefer, instead, to earn a smaller payoff [3]. Another scenario in which cyclic dominance appears is among preys and predators choosing, respectively, their hunt and defense strategy while trying to outcompete each other [4]. Predators may attack in a cooperative, coordinated way, with their actions being correlated in space and time [5]. There are several examples of such group hunting, including lions [6,7,8,9], hawks [10], crocodiles [11], spiders [12,13], and several other species [5]. Interspecies collaborations exist as well: Fishermen and dolphins in the south of Brazil [14,15] or honey-hunters and honey-guides in Mozambique [16], among others [17]). Group hunting may improve the capability of capturing a large prey [18], defending the carcass from other predators [19], spotting and chasing preys [20], etc. In opposition, there may be costs as well: Resources should be shared between members of the group, searches focus on a smaller territory, etc. Grouping tactics may also benefit preys [21] by improving: Surveillance [22,23,24], hiding [25,26], distraction [27], intimidation, etc. On the other hand, a group of preys may be more easily spotted than an isolated one and the resources should be shared by all members [28,29].
Game theory and the replicator equation [1,30,31,32] were used to model coordinated hunting by Lett et al. [33] in a fully mixed system. The number of preys and predators were assumed constant but the fractions of each population using either an individual or collective strategy could vary (see also Refs. [34,35]). The main hypothesis is that grouping, for preys, lowers their risk of being preyed but increases the competition for resources, while predators have a greater probability of success at the expense of having to share the prey with others, sometimes referred to as the “many-eyes, many mouths” trade off [28,29]. Recently, Cazaubiel et al. [4] revisited the model and proposed a spatial version with local interactions and binary strategies, unveiling the mechanism underlying the stability of the coexistence phase. In this version, all predators in site i may form a single group ( x i = 1 ) or hunt independently ( x i = 0 ), while the preys have a similar behavior ( y i = 0 , 1 ). Thus, the four possible combinations for each site are ( x i y i ): 00, 01, 10 and 11. Interestingly, these strategies obey cyclic dominance relations leading to persistent coexistence for a broad set of parameters [4]. This behavior is reminiscent of the generalizations of the RPS game with more than three species [1,2].
In this paper we further explore the spatial version of the model by quantifying some geometrical and percolative properties of the clusters formed by the above four strategies. When neighboring sites have the same strategy (for both x and y), we say they belong to the same geometrical cluster. Once a cluster spans the whole system, it is said to percolate. Whether or not such percolating clusters exist for a given finite-size realization of the system will have a strong role in its dynamics. In particular, the existence of a size dependent percolation crossover helps to understand, as a realization of the survival of the weakest principle [36], the strong finite-size effects presented by the model.

2. The Model

The more general version of the model proposed by Lett et al. is fully described in Refs. [4,33]. We here present, as also done in Refs. [4,33], a simplified version in which we reduce the number of free parameters to only two. We consider no reduction in resource intake by the preys when they are grouped ( γ = 1 in the notation of Ref. [33]). Each group of predators is formed by three agents and capture two preys each time they succeed. We also assume that the probability p of a group capturing a lone prey is 1/2. The remaining parameters are the loss of preying efficiency due to grouped preys ( 0 α 1 ) and when hunting alone ( 0 β 1 ).
While both populations keep a fixed size, the densities of grouped predators, x ( t ) , and preys, y ( t ) , may increase or decrease depending on how their payoff compare with the average payoff of the respective population. It is indeed the difference between the payoff P x and its average P x ¯ that drives the evolution of x (and, analogously, for P y and y). For example, if collective hunting earns a larger payoff than the average, P x > P x ¯ and x ( t ) increases. Preys and predators have distinct payoff matrices (the game is asymmetric [30]), given respectively by matrices [33] B and A in Table 1.
As an example, the α / 3 element of A is the accumulated payoff of grouped predators when attacking a group of preys (the rate of success is α / 2 with two preys being captured and shared among the three predators). We refer the interested reader to Refs. [4,33] for a detailed discussion of each element of these matrices. Thus, the replicator equations, x ˙ / x = P x P x ¯ and y ˙ / y = P y P y ¯ , giving the rate at which these two densities evolve in time, may be written as [30,33]:
x ˙ = x ( 1 x ) [ α 12 ( 1 y ) α 21 y ] y ˙ = y ( 1 y ) [ β 12 ( 1 x ) β 21 x ] ,
where
α 12 = 1 / 6 β / 2 α 21 = α ( β / 2 1 / 3 ) β 12 = β ( 1 α ) / 2 β 21 = α 1 / 2 .
Equation (1) has five fixed points [33]: The vertices of the unit square, { ( 0 , 0 ) , ( 0 , 1 ) , ( 1 , 0 ) , ( 1 , 1 ) } , and the coexistence state ( x * , y * ) given by:
x * = β 12 β 12 + β 21 = β ( 1 α ) β ( 1 α ) + 2 α 1
y * = α 12 α 12 + α 21 = 3 β 1 3 β ( 1 α ) + 2 α 1 .
Multiplying the numerator and denominator of Equation (3) by β 12 we see that β 12 β 21 0 in order to have x * 1 , otherwise x ( t ) is attracted either to 0 or 1. Analogously, for y * 1 in Equation (4) it is necessary that α 12 α 21 0 . Thus, the asymptotic state is determined only by the signs of α 12 , α 21 , β 12 and β 21 [30]. While β 12 is always positive, β 21 , α 12 and α 21 change sign at 2 α = 1 , 3 β = 1 and 3 β = 2 , respectively, locating the mean-field transition lines between the diverse phases of the system. The homogeneous, absorbent phases occur either when α 12 α 21 < 0 ( β < 1 / 3 or β > 2 / 3 ) or β 12 β 21 < 0 ( α < 1 / 2 ). The only region left is α > 1 / 2 and 1 / 3 < β < 2 / 3 . In this region, from the stability analysis [33], the system evolves along closed orbits around the center ( x * , y * ) and the strategies 0 and 1 coexist. It is interesting to notice that fully individualistic (00) sites are only possible, along with the other strategies, in this coexistence phase. As expected, preys are grouped when α is small and collective hunting is very ineffective against them, whatever the value of β. Similarly, for small values of β it does not pay to hunt alone, leading to cooperating predators for all values of α.
The above description assumes fully mixing and does not take into account possible spatial correlations and geometric effects. Therefore, we consider an agent based version with local interactions between the nearest-neighbors sites on a square lattice (self-interaction are included since each site has both predators and preys) with N = L 2 sites [4]. The size of the unit cell corresponds to the smallest viable group and on each site of the lattice there is a certain constant number of predators that may (or not) organize into such a group. The same happens for the preys. The state of those agents is represented by the variables x i (predators) and y i (preys), both assuming the values 1 or 0, whether they are grouped or not, respectively. At each step of the simulation, the predators on a randomly chosen site (i) interact with the preys in i and in all neighboring sites, accumulating P x ( i ) as given by matrix A in Equation (1). Similarly, the preys in i accumulate P y ( i ) using matrix B in Equation (1). In parallel, both predators and preys on a random neighbor of i (j) also accumulate their payoffs. The probability that the agents in site i adopt the strategy of those in site j (or vice versa) is proportional to the difference of payoffs. For example, for predators (and analogously for preys), if P x ( j ) > P x ( i ) , the probability that x i takes the value of x j is:
Prob ( x i x j ) = P x ( j ) P x ( i ) P x max ,
where P x max is the maximum value of the accumulated payoff of the predators for the chosen parameters. This rule is known to recover the replicator equation when passing from the microscopic, agent based level to the macroscopic, coarse grained one [1].

3. Results

We here focus on the non-trivial behavior inside the coexistence phase where both preys and predators present mixed, collective and individual, strategies. Figure 1 shows the asymptotic values x x ( t ) and y y ( t ) as a function of α for β = 0.4 and 0.6. The former was extensively discussed in Ref. [4], albeit with a slightly different dynamics, and is shown here for comparison purposes. The mean-field behavior (solid lines) barely changes for different values of β: x and y are monotonously decreasing functions of α, with a continuous or discontinuous transition, respectively, when passing from the (1,1) phase, at α c = 0.5 , into the coexistence phase. For 0.5 α 1 , as β goes from 1/3 up to 2/3, y tends to be flatter and closer to 1. On the other hand, simulations on the square lattice depend on the particular values ( α , β ) . Quite noticeably, there are strong finite-size effects. For large values of α, both cases β = 0.4 and 0.6 get absorbed by the (0,1) phase. The region where this happens, however, decreases with L and eventually disappears. These two cases differ in at least two remarkable features: The behavior close to the transition and the overshoot of x toward 1 just before being absorbed by the 0 state. Notice also that the location and nature of the transitions change, differing from the mean-field predictions.
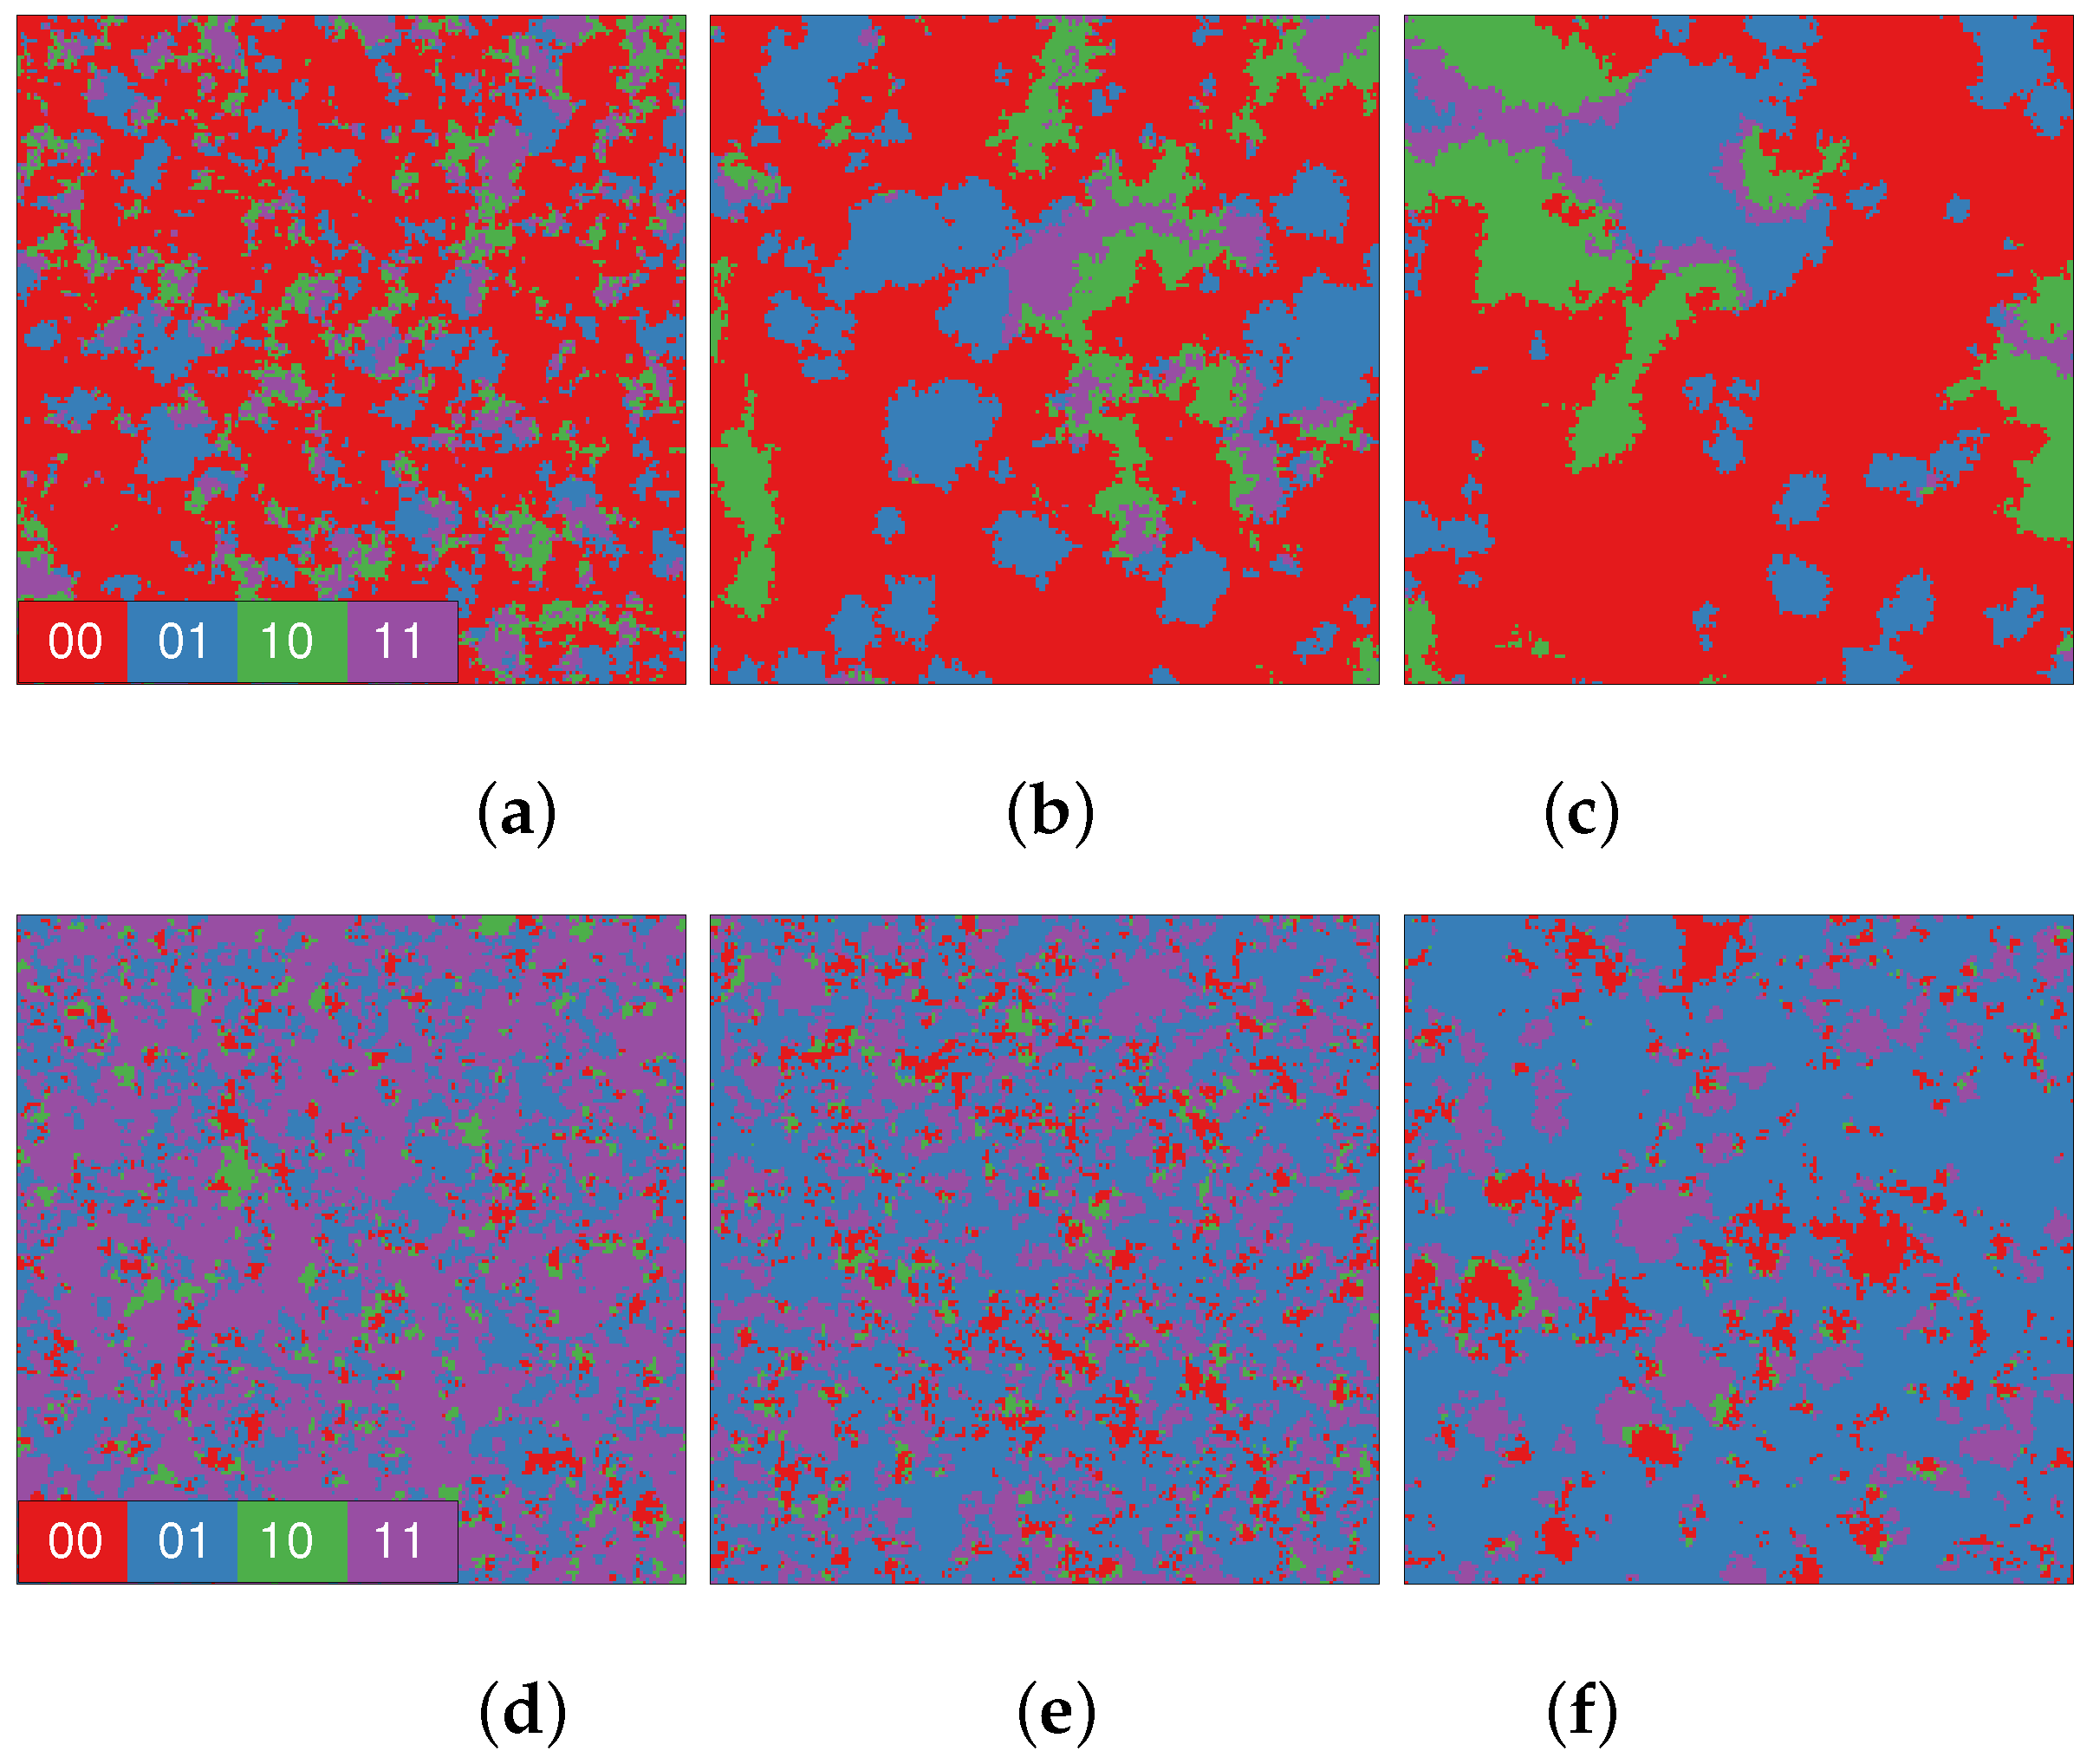
Another convenient local variable is the combination x i y i whose possible values are 00, 01, 10 and 11. Examples of their spatial distribution are shown in the snapshots of Figure 2 for different values of α and β. For β = 0.4 and those values of α (a-c), x and y are small and most of the sites adopt individual strategies (00), being organized in a large, percolating cluster. The (finite) system is said to percolate when at least one cluster spans it from side to side. For β = 0.6 and away from the transition where finite-size effects are important, y is large with most of the preys behaving collectively. Thus, 11 and 01 strategies are more frequent, while clusters of 00 and 10 are small or rare. Here we present some new results for the percolation properties of the different relevant clusters seen in Figure 2, discussing the origin of such differences and their role in the finite-size effects as well. The densities of these strategies, ρ m n ( m , n = 0 , 1 ), are obviously related to x and y by x = ρ 10 + ρ 11 and y = ρ 01 + ρ 11 and can quantify what was illustrated by the above snapshots.
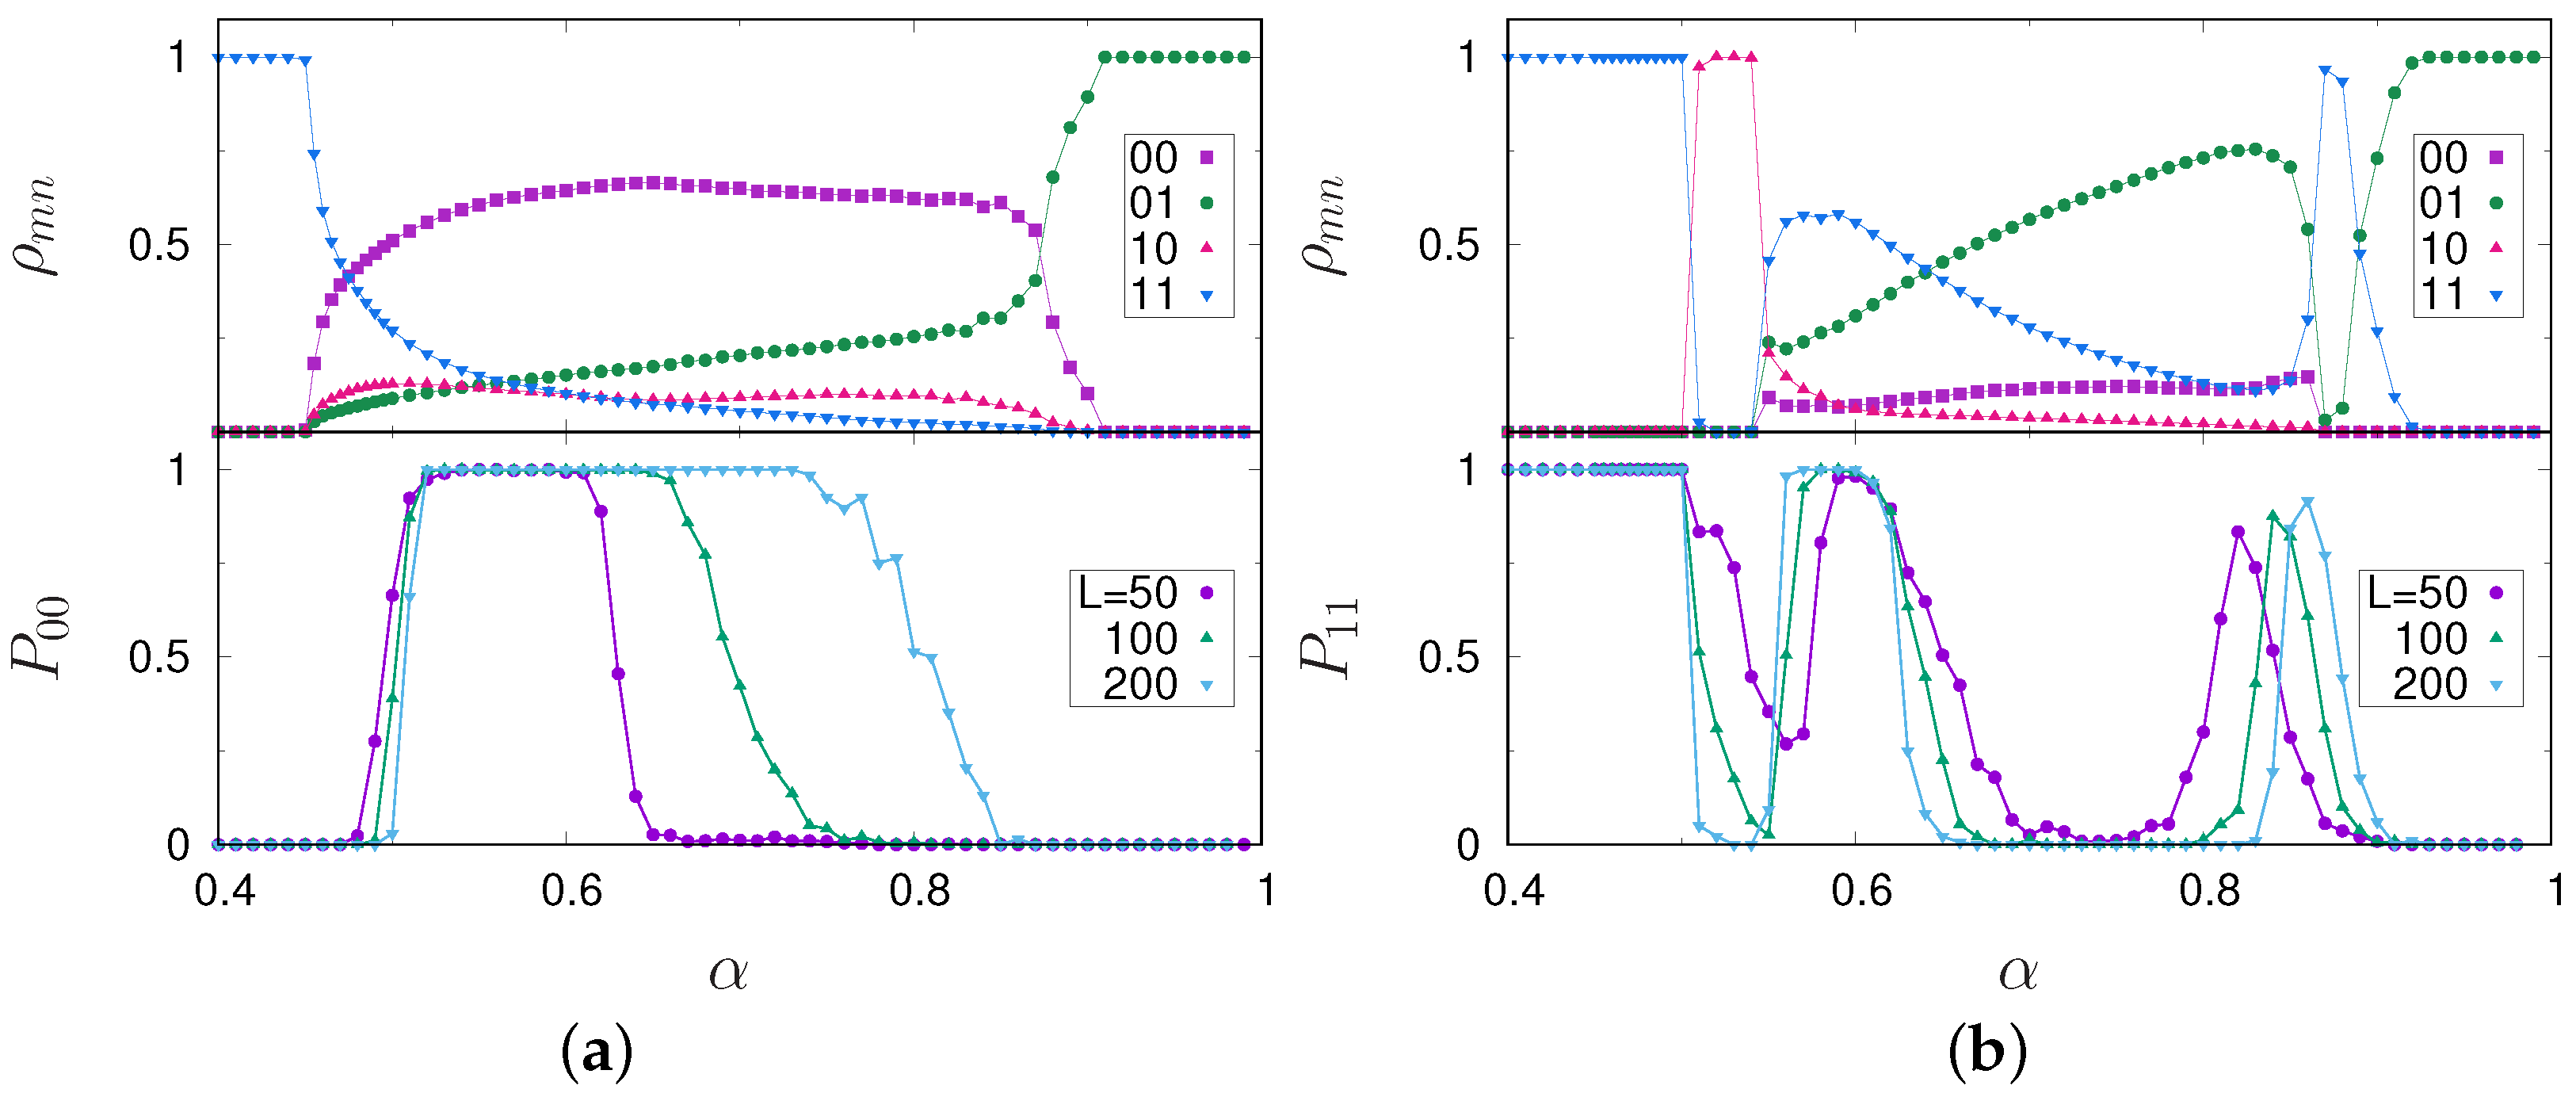
Figure 3a shows that the 00 strategy is the dominant one within the considered range of α. The sites with that strategy are spatially distributed forming the percolating background on top of which the other, smaller clusters interact. Indeed, the fraction of samples with a percolating 00 cluster is P 00 1 up to a size dependent value, α p ( L ) , where P 00 drops to zero. This point coincides with the value of α where the system is absorbed by the (0,1) phase (Figure 1a), indicating that these finite-size effects are correlated to this percolation event. This is not an actual percolative transition, but a crossover behavior that disappears for very large systems, α p ( L ) 1 . As mentioned above, the behavior may change for different values of α and β. Indeed, for β = 0.6 (Figure 3b), besides two different absorbing states, (1,0) close to the transition and (0,1) for large α, there is a small overshoot region in which the preys turn to collective behavior and the frequency of 11 sites has a sudden increase. The origin of this rich behavior can be traced to the heterogeneous nature of the competition, where which effective strategy is a prey and which is a predator changes along with the parameters α and β.
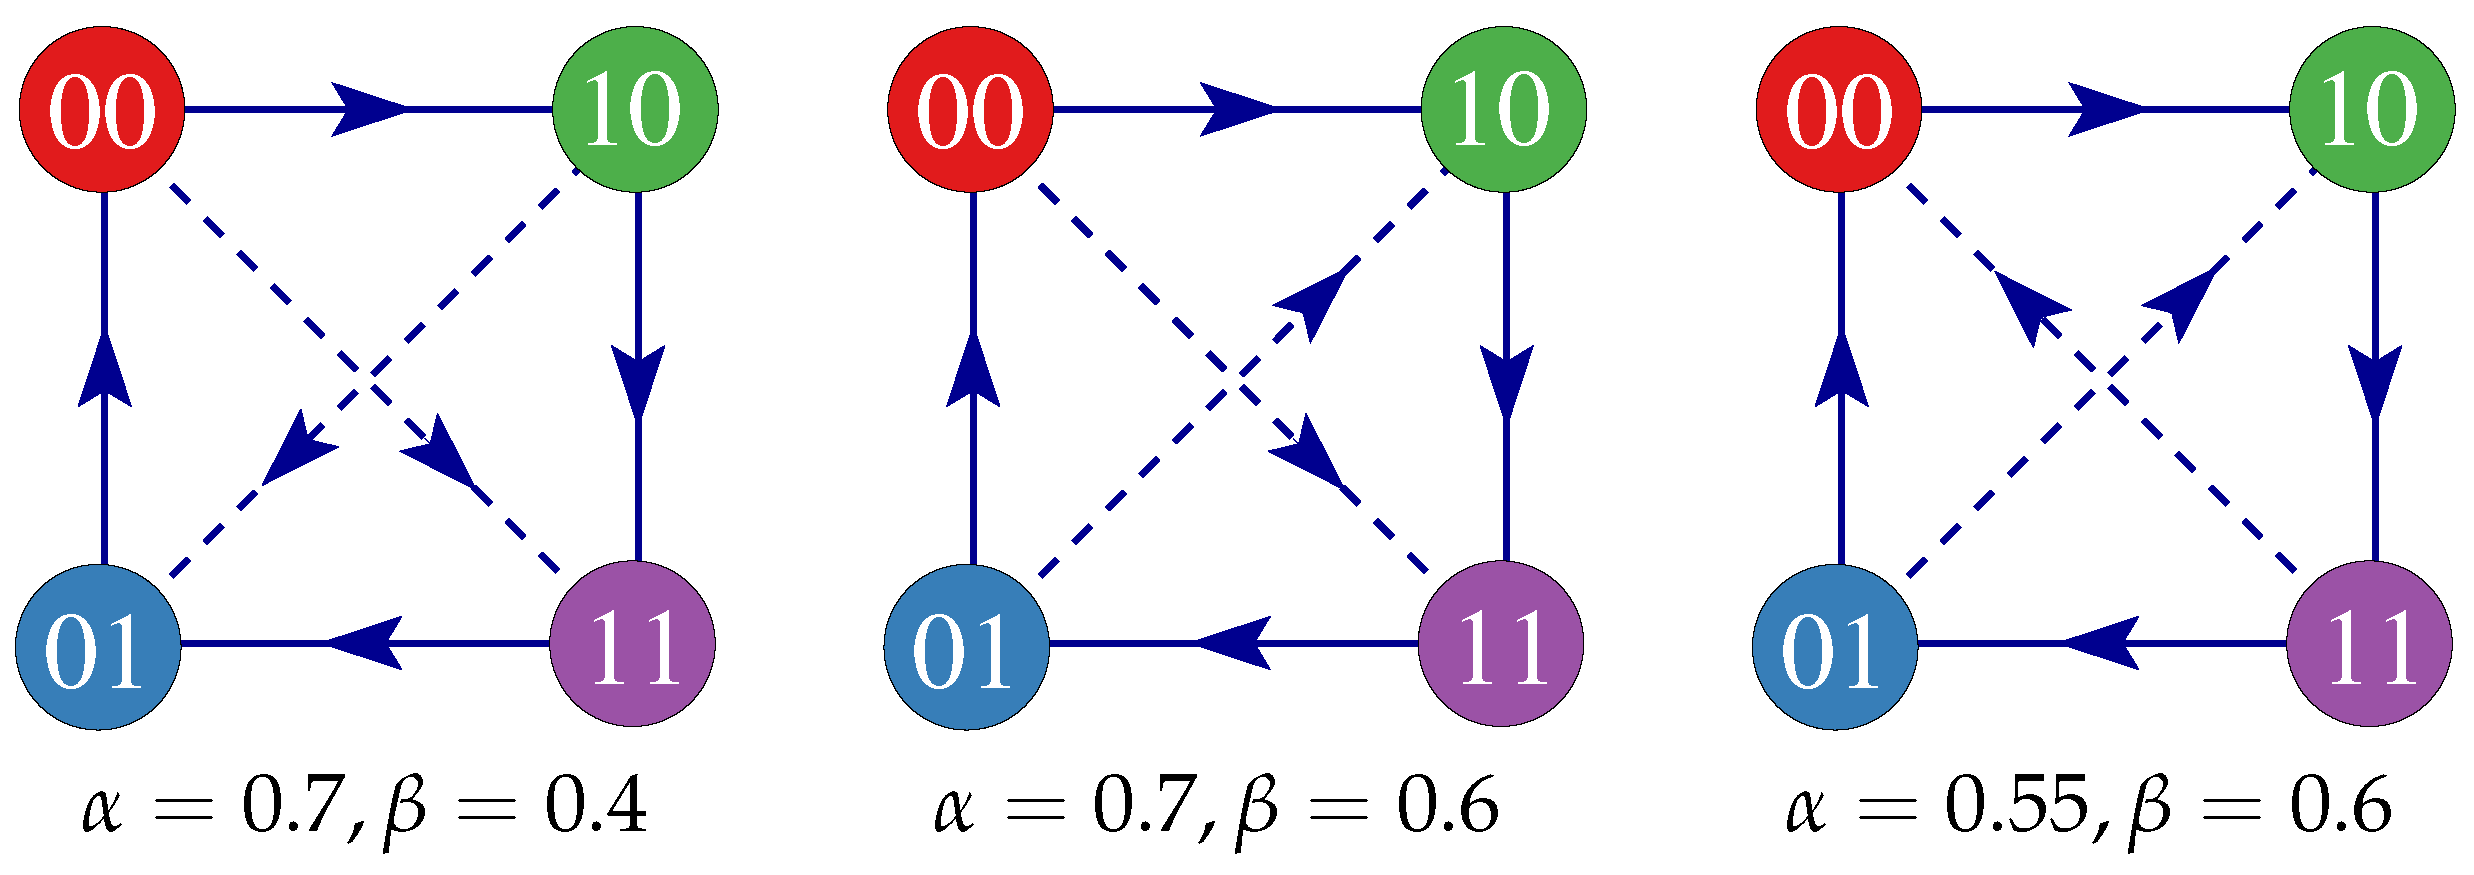
In Ref. [4], through specially designed initial conditions, the direction of the invasions were obtained. A circular patch with one effective strategy embedded into a sea of a different strategy were let to evolve and the direction defined by which strategy is suppressed while the other thrives (by switching their positions, the invasion was also in the opposite direction, ruling out the curvature of the interface as the driven mechanism). Figure 4 combines this information for some points inside the coexistence phase into a flux graph, similar to recently studied generalizations of the RPS game involving more than three species [1,2,37,38]. The only difference between these graphs is the orientation of the diagonal arrows. Other combinations of α and β may present further inversions as well [4]. These graphs help to understand the origin of different dynamics and asymptotic states for different points ( α , β ) , as shown by the two cases in Figure 3. Although the model does not consider mutations as a possible mechanism to re-inject extinct strategies, the effective strategies reproduce in a way similar to diploid organisms, and when two strategies along any of the diagonals of the flux graph are present, all other strategies may result. For example, consider an initial state with only 01 and 00 strategies. It is not possible to create the strategies with x i = 1 because x i = 0 for all sites. On the contrary, with a mixture of 01 and 10 (or, equivalently, 00 and 11), all four strategies may be obtained with their recombination. Starting from a random initial state in which all four strategies are equally present, their time evolution may be represented by an orbit inside the 3-simplex (the configuration space left invariant by the dynamics). Thus, any edge connecting the vertices of the 3-simplex that correspond to the arrows on the outer perimeter of the flux graph is absorbent. All other regions of the simplex, including the edges that correspond to the diagonals, do not absorb. Notice that for the typical generalizations of the RPS game involving four or more species, the whole hull of the simplex is absorbent, while here only some of its edges actually absorb.
The presence of a percolating underlying cluster seems to be essential to sustain coexistence and the finite-size effects observed in the coexistence phase occur once this background cluster is disrupted. For example, for the ( α , β ) = ( 0.7 , 0.4 ) case, the background strategy is the 00. Without it, the other three strategies form a transitive loop and does not sustain coexistence. Once 00 starts to decline, remarkably, it is the 01 strategy, the single predator of 00 in this case, the only surviving strategy. This is a realization of the survival of the weakest effect related to the finite-size effects, as was discussed in Ref. [4]. When the number of 00 sites decreases, 10 (its prey), increases its number. Since they prey on 11, the end result is the survival of 01. Notice that not all transitions related to percolation event are crossovers linked to the finite-size effects. Indeed, Figure 3a shows the richer case for β = 0.6 . Not only we notice that finite-size effects do appear (the peaks of P 11 around α = 0.8 ), but true percolative transitions exist as well (e.g., at α 0.61 ). This is related with the flux graph changing with the values of α and β.
Nonetheless, although stochastic in nature, the origin of the strong finite size effects is not completely clear. It is well known that similar systems, even without spatial structure, may present such effects because of the inherent stochasticity associated with finite sizes and a limited range of interaction [39,40]. Indeed, when the fixed point is neutral and global oscillations occur, the closer the orbit is from an absorbing boundary, the shorter is the time necessary for a fluctuation trigger the extinction cascade. By organizing into domains, strategies may last longer and the stochastic processes leading to extinction may not be so simple as in the mean field case, but instead, be strongly affected by the size and geometry of such domains. In addition, as can be seen in the snapshots of Figure 2, vortices are also present and may be relevant as well. Thus, the scenario is somewhat more complicated and further studies are necessary to disentangle all these mechanisms.

4. Discussion

Predators and preys, as a consequence of their continuous struggle for survival, may develop complex foraging and defense strategies. In this paper we explored the mechanisms sustaining the coexistence of individual and collective strategies used by spatially distributed populations of hunters and preys using the model introduced by Lett et al. [33]. In particular, agents not only form local groups (in each site) but these groups organize on larger scales forming clusters whose percolative properties seem relevant for the persistent coexistence in finite systems. This organization, that initially may be located in space and have short duration in time, can eventually unfold into more complex forms of sociability [41,42,43].
A further extension, that is related to the interesting phenomena caused by the change of the flux graph within the parameter space, is to consider spatially heterogeneous cyclic competition models, in which different regions of the system (or different agents) may play following different graphs. This may be relevant in complex landscapes where the prey-predator relations may change, or even be reversed [44], depending under which conditions the competitors interact. Another point to be explored in the future is the connection of this model with physical and chemical models presenting a transition between an active, coexistence steady state and an absorbing state (the Ziff-Gulari-Barshad [45] is an example, among many others [46]).

Acknowledgments

AC thanks the IF-UFRGS for the hospitality and the ENS-Paris for partial support during her stay in Porto Alegre. AFL is partially supported by a CNPq PhD grant. JJA thanks the INCT Sistemas Complexos and the Brazilian agencies CNPq, Fapergs and CAPES for partial support.

Author Contributions

J.A. conceived and designed the study; A.L. and A.C. performed the simulations; A.L., A.C. and J.A. analyzed the data; J.A. wrote the paper.

Conflicts of Interest

The authors declare no conflict of interest.

References

  1. Szabó, G.; Fáth, G. Evolutionary games on graphs. Phys. Rep. 2007, 446, 97–216. [Google Scholar] [CrossRef]
  2. Szolnoki, A.; Mobilia, M.; Jiang, L.L.; Szczesny, B.; Rucklidge, A.M.; Perc, M. Cyclic dominance in evolutionary games: A review. J. Royal Soc. Int. 2014, 11, 20140735. [Google Scholar] [CrossRef] [PubMed]
  3. Semmann, D.; Krambeck, H.J.; Milinski, M. Volunteering leads to rock-paper-scissors dynamics in a public goods game. Nature 2003, 425, 390. [Google Scholar] [CrossRef] [PubMed]
  4. Cazaubiel, A.; Lütz, A.F.; Arenzon, J.J. Spatial organization, grouping strategies and cyclic dominance in asymmetric predator-prey games. Available online: https://arxiv.org/abs/1611.09624 (accessed on 24 January 2017).
  5. Bailey, I.; Myatt, J.P.; Wilson, A.M. Group hunting within the Carnivora: Physiological, cognitive and environmental influences on strategy and cooperation. Behav. Ecol. Sociobiol. 2013, 67, 1–17. [Google Scholar] [CrossRef]
  6. Stander, P.E. Cooperative hunting in lions: The role of the individual. Behav. Ecol. Sociobiol. 1992, 29, 445–454. [Google Scholar] [CrossRef]
  7. Heinsohn, R.G.; Packer, C. Complex cooperative strategies in group-territorial Africa lions. Science 1995, 269, 1260–1262. [Google Scholar] [CrossRef] [PubMed]
  8. Legge, S. Cooperative lions escape the Prisoner’s Dilemma. Tree 1996, 11, 2–3. [Google Scholar] [CrossRef]
  9. Yeakel, J.D.; Patterson, B.D.; Fox-Dobbs, K.; Okumura, M.M.; Cerling, T.E.; Moore, J.W.; Koch, P.L.; Dominy, N.J. Cooperation and individuality among man-eating lions. Proc. Nat. Acad. Sci. 2009, 106, 19040–19043. [Google Scholar] [CrossRef] [PubMed]
  10. Bednarz, J.C. Cooperative Hunting in Harris’ Hawks. Science 1988, 239, 1525–1527. [Google Scholar] [CrossRef] [PubMed]
  11. Dinets, V. Apparent coordination and collaboration in cooperatively hunting crocodilians. Eth. Ecol. Evol. 2015, 27, 244. [Google Scholar] [CrossRef]
  12. Nentwig, W. Social spiders catch larger prey: A study of Anelosimus eximius (Araneae: Theridiidae). Behav. Ecol. Sociobiol. 1985, 17, 79–85. [Google Scholar] [CrossRef]
  13. Vakanas, G.; Krafft, B. Coordination of Behavioral Sequences Between Individuals During Prey Capture in a Social Spider, Anelosimus eximius. J. Insect Behav. 2001, 14, 777–798. [Google Scholar] [CrossRef]
  14. Pryor, K.; Lindbergh, J.; Lindbergh, S.; Milano, R. A Dolphin-Human Fishing Cooperative in Brazil. Mar. Mammal Sci. 1990, 6, 77–82. [Google Scholar] [CrossRef]
  15. Daura-Jorge, F.G.; Cantor, M.; Ingram, S.N.; Lusseau, D.; Simões-Lopes, P.C. The structure of a bottlenose dolphin society is coupled to a unique foraging cooperation with artisanal fishermen. Biol. Lett. 2012, 8, 702–705. [Google Scholar] [CrossRef] [PubMed]
  16. Spottiswoode, C.N.; Begg, K.S.; Begg, C.M. Reciprocal signaling in honeyguide-human mutualism. Science 2016, 353, 387. [Google Scholar] [CrossRef] [PubMed]
  17. Bshary, R.; Hohner, A.; Ait-el Djoudi, K.; Fricke, H. Interspecific Communicative and Coordinated Hunting between Groupers and Giant Moray Eels in the Red Sea. PLoS Biol. 2006, 4, e431. [Google Scholar] [CrossRef] [PubMed]
  18. Malan, G. Solitary and social hunting in pale chanting goshawk (Melierax canorus) families: Why use both strategies? J. Raptor Res. 1998, 32, 195–201. [Google Scholar]
  19. Brockmann, H.J.; Barnard, C.J. Kleptoparasitism in birds. Anim. Behav. 1979, 27, 487–514. [Google Scholar] [CrossRef]
  20. Pitcher, T.; Magurran, A.; Winfield, I. Fish in larger shoals find food faster. Behav. Ecol. Sociobiol. 1982, 10, 149–151. [Google Scholar] [CrossRef]
  21. Garay, J. Cooperation in defence against a predator. J. Theor. Biol. 2009, 257, 45–51. [Google Scholar] [CrossRef] [PubMed]
  22. Pulliam, H.R. On the advantages of flocking. J. Theor. Biol. 1973, 38, 419–422. [Google Scholar] [CrossRef]
  23. Beauchamp, G. What is the magnitude of the group-size effect on vigilance? Behav. Ecol. 2008, 19, 1361–1368. [Google Scholar] [CrossRef]
  24. Pays, O.; Renaud, P.C.; Loisel, P.; Petit, M.; Gerard, J.F.; Jarman, P.J. Prey synchronize their vigilant behaviour with other group members. Proc. R. Soc. Lond. B 2007, 274, 1287–1291. [Google Scholar] [CrossRef] [PubMed]
  25. Hamilton, W. Geometry for the selfish herd. J. Theor. Biol. 1971, 31, 295–311. [Google Scholar] [CrossRef]
  26. Ioannou, C.C.; Guttal, V.; Couzin, I.D. Predatory Fish Select for Coordinated Collective Motion in Virtual Prey. Science 2012, 337, 1212–1215. [Google Scholar] [CrossRef] [PubMed]
  27. Cresswell, W.; Quinn, J.L. Attack frequency, attack success and choice of prey group size for two predators with contrasting hunting strategies. Anim. Behav. 2010, 80, 643–648. [Google Scholar] [CrossRef]
  28. Giraldeau, L.A. The stable group and the determinants of foraging group size. In The Ecology of Social Behavior; Slobodchikoff, C.N., Ed.; Academic Press: San Diego, USA, 1988; pp. 33–53. [Google Scholar]
  29. Ritz, D.A. Costs and benefits as a function of group size: Experiments on a swarming mysid, Paramesopodopsis rufa Fenton. In Animal Groups in Three Dimensions; Parrish, J.K., Hamner, W.M., Eds.; Cambridge University Press: Cambridge, UK, 1997; pp. 194–206. [Google Scholar]
  30. Hofbauer, J.; Sigmund, K. Evolutionary Games and Population Dynamics; Cambridge University Press: Cambridge, UK, 1998. [Google Scholar]
  31. Roca, C.P.; Cuesta, J.A.; Sánchez, A. Evolutionary game theory: Temporal and spatial effects beyond replicator dynamics. Phys. Life Rev. 2009, 6, 208–249. [Google Scholar] [CrossRef] [PubMed] [Green Version]
  32. Wang, Z.; Kokubo, S.; Jusup, M.; Tanimoto, J. Universal scaling for the dilemma strength in evolutionary games. Phys. Life Rev. 2015, 14, 1–30. [Google Scholar] [CrossRef] [PubMed]
  33. Lett, C.; Auger, P.; Gaillard, J.M. Continuous cycling of grouped vs. solitary strategy frequency in a predator-prey model. Theor. Pop. Biol. 2004, 65, 263–270. [Google Scholar] [CrossRef] [PubMed]
  34. Packer, C.; Ruttan, L. The evolution of cooperative hunting. Am. Nat. 1988, 132, 159–198. [Google Scholar] [CrossRef]
  35. Mchich, R.; Auger, P.; Lett, C. Effects of aggregative and solitary individual behaviors on the dynamics of predator-prey game models. Ecol. Model. 2006, 197, 281. [Google Scholar] [CrossRef]
  36. Frean, M.; Abraham, E.R. Rock-scissors-paper and the survival of the weakest. Proc. R. Soc. Lond. B 2001, 268, 1323–1327. [Google Scholar] [CrossRef] [PubMed]
  37. Lütz, A.F.; Risau-Gusman, S.; Arenzon, J.J. Intransitivity and coexistence in four species cyclic games. J. Theor. Biol. 2013, 317, 286–292. [Google Scholar] [CrossRef] [PubMed]
  38. Rulquin, C.; Arenzon, J.J. Globally synchronized oscillations in complex cyclic games. Phys. Rev. E 2014, 89, 6. [Google Scholar] [CrossRef] [PubMed]
  39. Reichenbach, T.; Mobilia, M.; Frey, E. Coexistence versus extinction in the stochastic cyclic Lotka-Volterra model. Phys. Rev. E 2006, 74, 051907. [Google Scholar] [CrossRef] [PubMed] [Green Version]
  40. Cremer, J.; Reichenbach, T.; Frey, E. Anomalous finite-size effects in the Battle of the Sexes. Eur. Phys. J. B 2008, 63, 373–380. [Google Scholar] [CrossRef] [Green Version]
  41. van Veelen, M.; García, J.; Avilés, L. It takes grouping and cooperation to get sociality. J. Theor. Biol. 2010, 264, 1240–1253. [Google Scholar] [CrossRef] [PubMed]
  42. Potts, J.R.; Lewis, M.A. How do animal territories form and change? Lessons from 20 years of mechanistic modelling. Proc. R. Soc. Lond. B 2014, 281, 20140231. [Google Scholar] [CrossRef] [PubMed]
  43. Herbert-Read, J.E.; Romanczuk, P.; Krause, S.; Strömbom, D.; Couillaud, P.; Domenici, P.; Kurvers, R.H.J.M.; Marras, S.; Steffensen, J.F.; Wilson, A.D.M.; et al. Proto-cooperation: Group hunting sailfish improve hunting success by alternating attacks on grouping prey. Proc. R. Soc. B 2016, 283, 20161671. [Google Scholar] [CrossRef] [PubMed]
  44. Cortez, M.H.; Weitz, J.S. Coevolution can reverse predator-prey cycles. PNAS 2014, 111, 7486–7491. [Google Scholar] [CrossRef] [PubMed]
  45. Ziff, R.M.; Gulari, E.; Barshad, Y. Kinetic Phase Transitions in an Irreversible Surface-Reaction Model. Phys. Rev. Lett. 1986, 56, 2553. [Google Scholar] [CrossRef] [PubMed]
  46. Marro, J.; Dickman, R. Nonequilibrium phase transitions in lattice models; Cambridge University Press: Cambridge, UK, 1999. [Google Scholar]
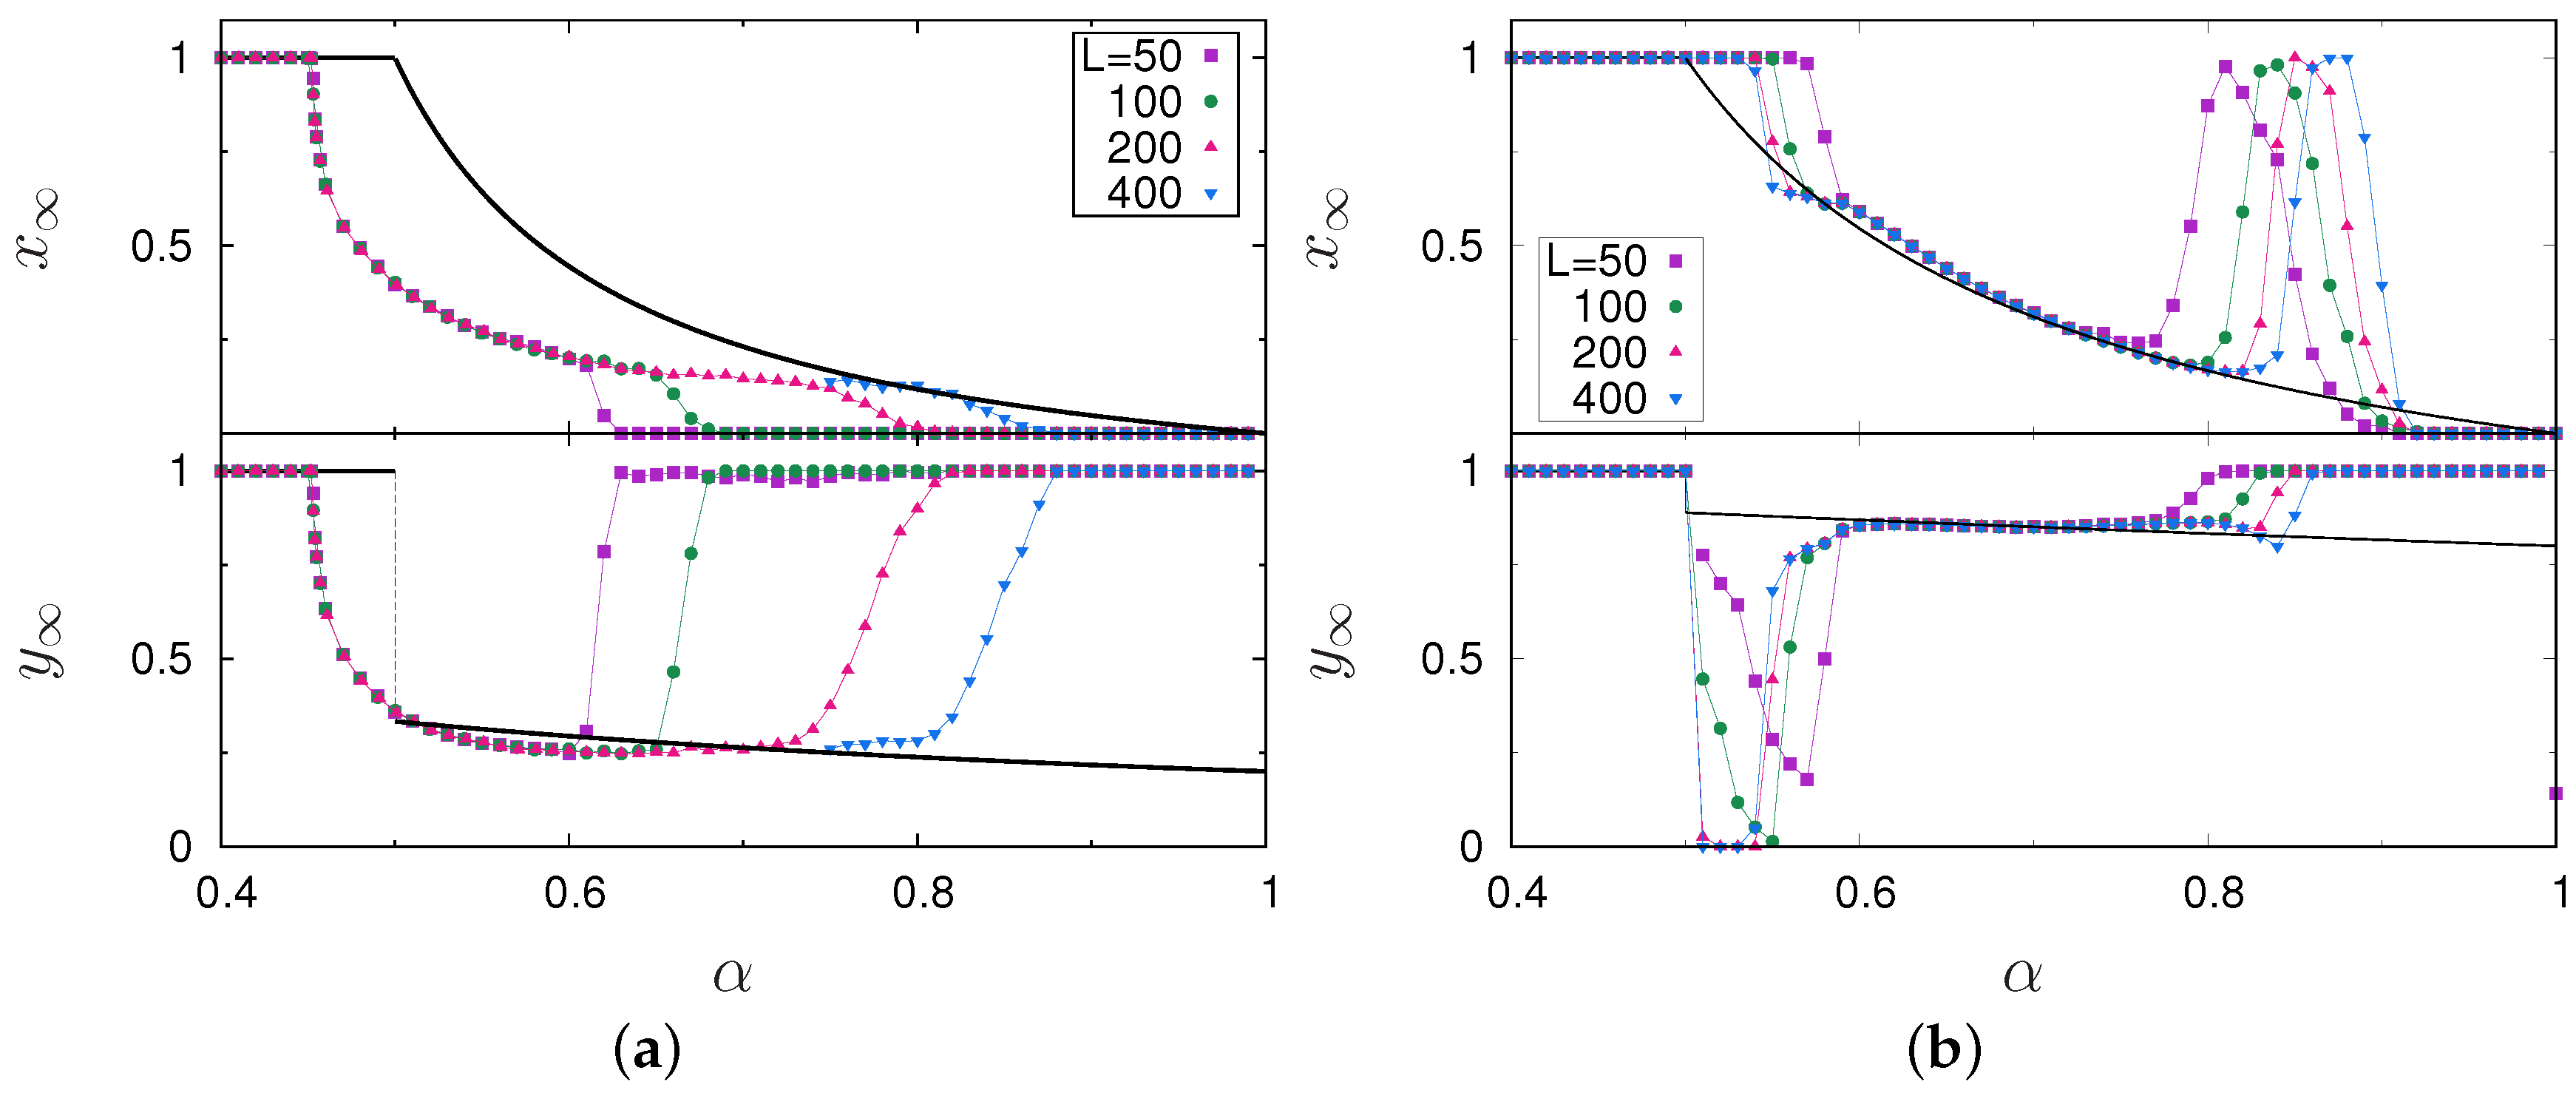
Figure 1. Asymptotic fraction of the population of predators hunting (respectively, preys defending) collectively, x x ( t ) and y y ( t ) , for β = 0.4 [4] (a) and 0.6 (b) as a function of α. The expected behavior from the replicator Equations (3)–(4), solid lines, is that the larger α is, the less efficient predators become because preys are grouped. The results on a two dimensional lattice (symbols) differ from that.
Games 08 00010 g001
Figure 2. Snapshots of the combined x i y i strategy for β = 0.4 (a-c) and 0.6 (d-f) with, from left to right, α = 0.6 , 0.7 and 0.8.
Games 08 00010 g002
Figure 3. Asymptotic value of ρ m n , with m , n = 0 , 1 and β = 0.4 (a) and 0.6 (b), as a function of α, for L = 200 . The percolation probability for the relevant cluster for each β, P 00 (a) and P 11 (b), and several system sizes are also shown.
Games 08 00010 g003
Figure 4. Examples of flux graphs showing the direction of invasions for some values of α and β, the difference being the orientation of the diagonals, 01-10 and 00-11, invasions. Notice that there are no neutral strategies, although the invasions along the diagonals are not direct and involve the creation of the intermediate strategies.
Games 08 00010 g004
Table 1. Payoff matrices for predators (A) and preys (B).
Games 08 00010 i001