Article

Reciprocity in Labor Market Relationships: Evidence from an Experiment across High-Income OECD Countries

1
Department of Economics, University of Heidelberg, Berheimerstr. 20, Heidelberg 69115, Germany
2
Department of Economics, School of Social Sciences, Universiti Sains Malaysia, Penang 11800, Malaysia
3
Department of Economics, University of Kiel, Olshausenstr. 40, 24118 Kiel, Germany
4
Department of Economics, California Polytechnic State University, San Luis Obispo, CA 93407, USA
5
Department of Economics, University Jaume I, Castellón 12071, Spain
6
Department of Economics, Kyoto Sangyo University, Kyoto 6038555, Japan
7
Department of Economics, The Max Stern Yezreel Valley College, 19300 Emek Yezreel, Israel
*
Author to whom correspondence should be addressed.
Games 2015, 6(4), 473-494; https://doi.org/10.3390/g6040473
Submission received: 20 July 2015 / Revised: 18 September 2015 / Accepted: 28 September 2015 / Published: 9 October 2015
(This article belongs to the Special Issue Experimental Studies of Social Dilemma Games)

Abstract

:
We study differences in behavior across countries in a labor market context. To this end, we conducted a bilateral gift-exchange experiment comparing the behavior of subjects from five high-income OECD countries: Germany, Spain, Israel, Japan and the USA. We observe that in all countries, effort levels are increasing while rejection rates are decreasing in wage offers. However, we also find considerable differences in behavior across countries in both one-shot and repeated relationships, the most striking between Germany and Spain. We also discuss the influence of socio-economic indicators and the implications of our findings.
JEL Classifications:
D03; C91; D81

1. Introduction

There is now a large literature that models incomplete labor contracts between firms and their workers as a “gift exchange”, where the worker perceives his/her wage as a “gift” and reciprocates with (costly) effort that benefits the firm. In the labor market context, this is referred to as the “efficiency wage hypothesis” (see [1,2]). Subsequently, a large literature of gift-exchange experiments has evolved (initially started by [3]; see the recent review by [4]), testing the efficiency wage hypothesis in a controlled environment. The typical findings of these gift-exchange studies are that both wage offers and effort levels are above the minimum and that repeated interaction between firms and workers leads to higher effort levels (e.g., [5,6,7]).
In the current study, we use a bilateral gift-exchange game as a work horse model to explore whether and to what extent behavioral differences are observed in a sequence of one-shot interactions (random-matching protocol) and also in repeated relationships (fixed matching) across subjects from five high-income OECD countries: Germany, Israel, Japan, Spain and the USA.
Although there is growing recognition that culture matters for a variety of economic outcomes (see, e.g., [8,9,10,11]), even models of social preferences that allow for individual-specific characteristics do not include an explicit culture- or country-specific variable.1 Moreover, despite the growing experimental literature comparing the behavior of subjects from different countries, there are only a few studies employing subjects from more than four countries (for example, [13,14,15,16,17,18]) and no such study of the labor market gift-exchange game. In the absence of a concrete model that predicts behavior across countries, our approach is similar to [16] (and also to other studies, such as [19,20]), in that we want to learn if there is evidence of differences in behavior across countries, rather than testing a particular theory.
Bilateral gift-exchange experiments have already been conducted in a variety of countries, mostly in Europe and the USA (see [4]). The contribution of this paper is to carefully control the experimental procedures across countries to allow for direct comparisons of results. In this respect, we utilize the inequity aversion model by [21] to study if differences in behavior could be explained by different aversions to advantageous inequity across countries. Moreover, our findings broaden the set of countries where comparable gift-exchange studies have been conducted, so that we can combine our results with previous research to investigate if some prominent socio-economic indicators could account for the differences in behavior.
Although there has not yet been a multi-country gift-exchange study, results from cross-country trust game experiments may shed some light on the expected results of bilateral gift-exchange studies due to the similarities in the two games. Like the gift-exchange game, the trust game ([22]) is a two-player game that measures reciprocity.2 The static subgame perfect equilibrium under standard preferences is similar in both games (no reciprocity in the second stage and, hence, no giving in the first stage). Here, we briefly present the results of trust game studies involving at least two of our five countries.3 Croson and Buchan [26] conducted a trust game experiment with subjects from China, South Korea, Japan and the United States, finding that women reciprocate more than men in all countries, but finding no differences across countries. Buchan et al. [27] conducted an additional trust game study in those four countries, finding that American and Chinese subjects are the most trusting, while Chinese and Korean subjects are the most reciprocal.4 Hennig-Schmidt et al. [30] find, in a trust game study with German, Israeli, and Palestinian subjects, that Palestinians trust more than Germans, who trust more than Israelis. Back transfers by Germans and Israelis are not different, but both are lower than that of Palestinians. The results of trust games in different countries are summarized in the meta-analysis by [31], indicating no large differences in average behavior across our sample of countries, i.e., subjects sent (sent back) between 51% and 59% (32% and 45%) of the possible amount (see Table A1 in the Appendix). As to the effect of repetition [32] compare the standard (one-shot) trust game with a repeated (fixed-matching) game. They observe that in the repeated game, subjects sent (sent back) 75% (56%) of the possible amount, while in the one-shot game, subjects sent (sent back) only 50% (38%) of the possible amount. In addition, Bohnet and Huck [33] study a binary trust game under stranger and partner matching. They find that 59% (61%) of the first (second) movers choose to trust (reciprocate) in partner matching compared to 32% (30%) in the stranger matching.
Note that there are two important differences between the bilateral gift-exchange game and the trust game: First, in contrast to the neutrally-framed trust game, our design imposes the labor market context (with which individuals in virtually all countries are familiar).5 Second, the parameters in the bilateral gift exchange game are different from the trust game, and this may affect behavior. Particularly, in the bilateral gift-exchange game, a firm earns a very low payoff if its assigned worker does not reciprocate. By contrast, in the trust game, the first mover can assure himself/herself a significant payoff, regardless of the reciprocity of the second mover.
Our main findings can be summarized as follows: In the random matching treatments, we observe that Germans offer the highest wages, while Spanish offer the lowest. We do not observe differences in rejection rates across treatments. Further, we find that the efficiency wage hypothesis is confirmed in all countries, except for Spain, where at best, it is only weakly supported by the data. In terms of overall surplus, German subjects perform on average the best, while Spanish perform the worst. When the relationship between a firm and a worker is repeated (fixed matching treatments), we observe higher wages in all countries, except for Japan, and higher effort levels in all countries. This leads to higher surplus in repeated relationships compared to random matching treatments in all countries. German subjects also perform better than those of the other countries in terms of both effort and overall surplus in the repeated relationships.
The paper is organized as follows: In the next section, we explain the experimental design and procedure used in our experiment. In Section 3, we present the results. In Section 4, we compare our results to similar gift-exchange experiments conducted in different countries. Finally, in Section 5, we summarize and conclude.

2. Experimental Design and Procedure

We use the bilateral gift-exchange (BGE) game initially used by [5,6,36] to compare the performance of undergraduate students from five high-income OECD countries: Germany, Israel, Japan, Spain and the USA.
At the beginning of the game, subjects are randomly assigned the roles of “firms” and “workers” (they retain these roles throughout the experiment). The experiment lasts 10 rounds. In each round, each firm is matched with one worker. At the beginning of each round, each firm receives an endowment of 120 ECU (“experimental currency units”). The firm, moving first, offers a wage (w) to the worker (between 20 and 120 ECU). Then, the worker chooses whether to accept or reject the offer. If the worker rejects, both the worker and the firm receive a payoff of 0. If the worker accepts the offer, he/she has to choose an effort level (e) from a finite grid between 0.1 and 1.0. Selecting an effort level above the minimum level is costly, as displayed in Table 1.
Table 1. Effort levels and effort costs.
Effort Level (e)0.10.20.30.40.50.60.70.80.91.0
Cost per effort level ( C e )01246810121518
Additionally, if a worker accepts the offer, he or she has to pay a fixed cost of 20 ECU, which in the instructions is labeled as a travel cost. At the end of each round, the payoff is calculated. If a worker accepts the offer, the firm’s payoff for the actual round is determined by:
Π i F w i , e j = 120 w i e j
and the worker’s payoff is given by:
Π j W w i , e j = w i 20 C e j
where w i denotes the wage offer of firm i, e j denotes the effort level of the corresponding worker j and C e j is the cost of worker j’s effort.
At the end of the experiment, subjects earn their accumulated payoffs from the 10 rounds. We chose these particular design parameters (i.e., cost and payoff functions) because they have been used in several previous gift-exchange studies conducted in Austria, France, Hungary, Malaysia, Portugal and the USA. In Section 4, we discuss the findings of these experiments. In the static subgame perfect equilibrium (SPE) of this game under standard homo economicus preferences, the firms offer a wage of 21 (or 20) units, anticipating that workers will choose the lowest positive effort level, i.e., e = 0.1 . The resulting payoffs are 9.9 (or 10) ECU to the firm and 1 (or 0) ECU to the worker. An alternative outcome is predicted by the “efficiency wage hypothesis,” that workers reciprocate with respect to a high wage offer with high effort and that firms anticipate this reciprocity. This more optimistic outcome is also predicted by the inequity aversion model [21]. According to this model, a worker’s utility depends positively on his/her payoff, but negatively on the difference between his/her payoff and the payoff of the firm. If such workers are offered a sufficiently high wage, they would choose a positive effort that reduces the difference in payoff between themselves and the firm. Although this aversion to payoff inequality is not a direct measure of reciprocity, it can be thought of as a proxy for it.
In each country, we conducted both random and fixed matching treatments. Random matching (RM) represents a sequence of one-shot interactions between a firm and a worker, whereas fixed matching (FM) implies a repeated relationship. The subgame perfect equilibrium is the same in both random and fixed matching. However, due to the possibility to build up reputation, repeated interactions between firms and workers may yield different results than a sequence of one-shot interactions, since a selfish worker would reciprocate in early rounds if he/she believes that it will pay off in terms of future wage offers (see [5]). We therefore expect to observe higher wage offers and higher reciprocity in the FM treatments than in the RM treatments.
A total of 428 undergraduate students (mostly economics or business majors) participated in our experiment, which was programmed and conducted using the z-Tree experimental software [37]. The experiment was conducted at the University of Kiel (Germany), University Jaume I, Castellón de la Plana (Spain), the Max Stern Yezreel Valley College, Emek Yezreel (Israel), California Polytechnic State University at San Luis Obispo (USA) and Kyoto Sangyo University (Japan).
Upon entering the computer lab, the subjects were given 10 min to read the instructions, which included a set of four questions to test whether they understood the experiment.6 Then, we read the instructions aloud and showed how to calculate the answers to the four questions from the instructions. An experimenter from Germany was present during each of the other countries’ sessions to ensure that the same protocol was followed in the different countries.7 The instructions were translated from English to the relevant language and then back to English by two different persons. The exchange rate between ECU and the local currencies was calculated to have a similar purchasing power in each country.

3. Results

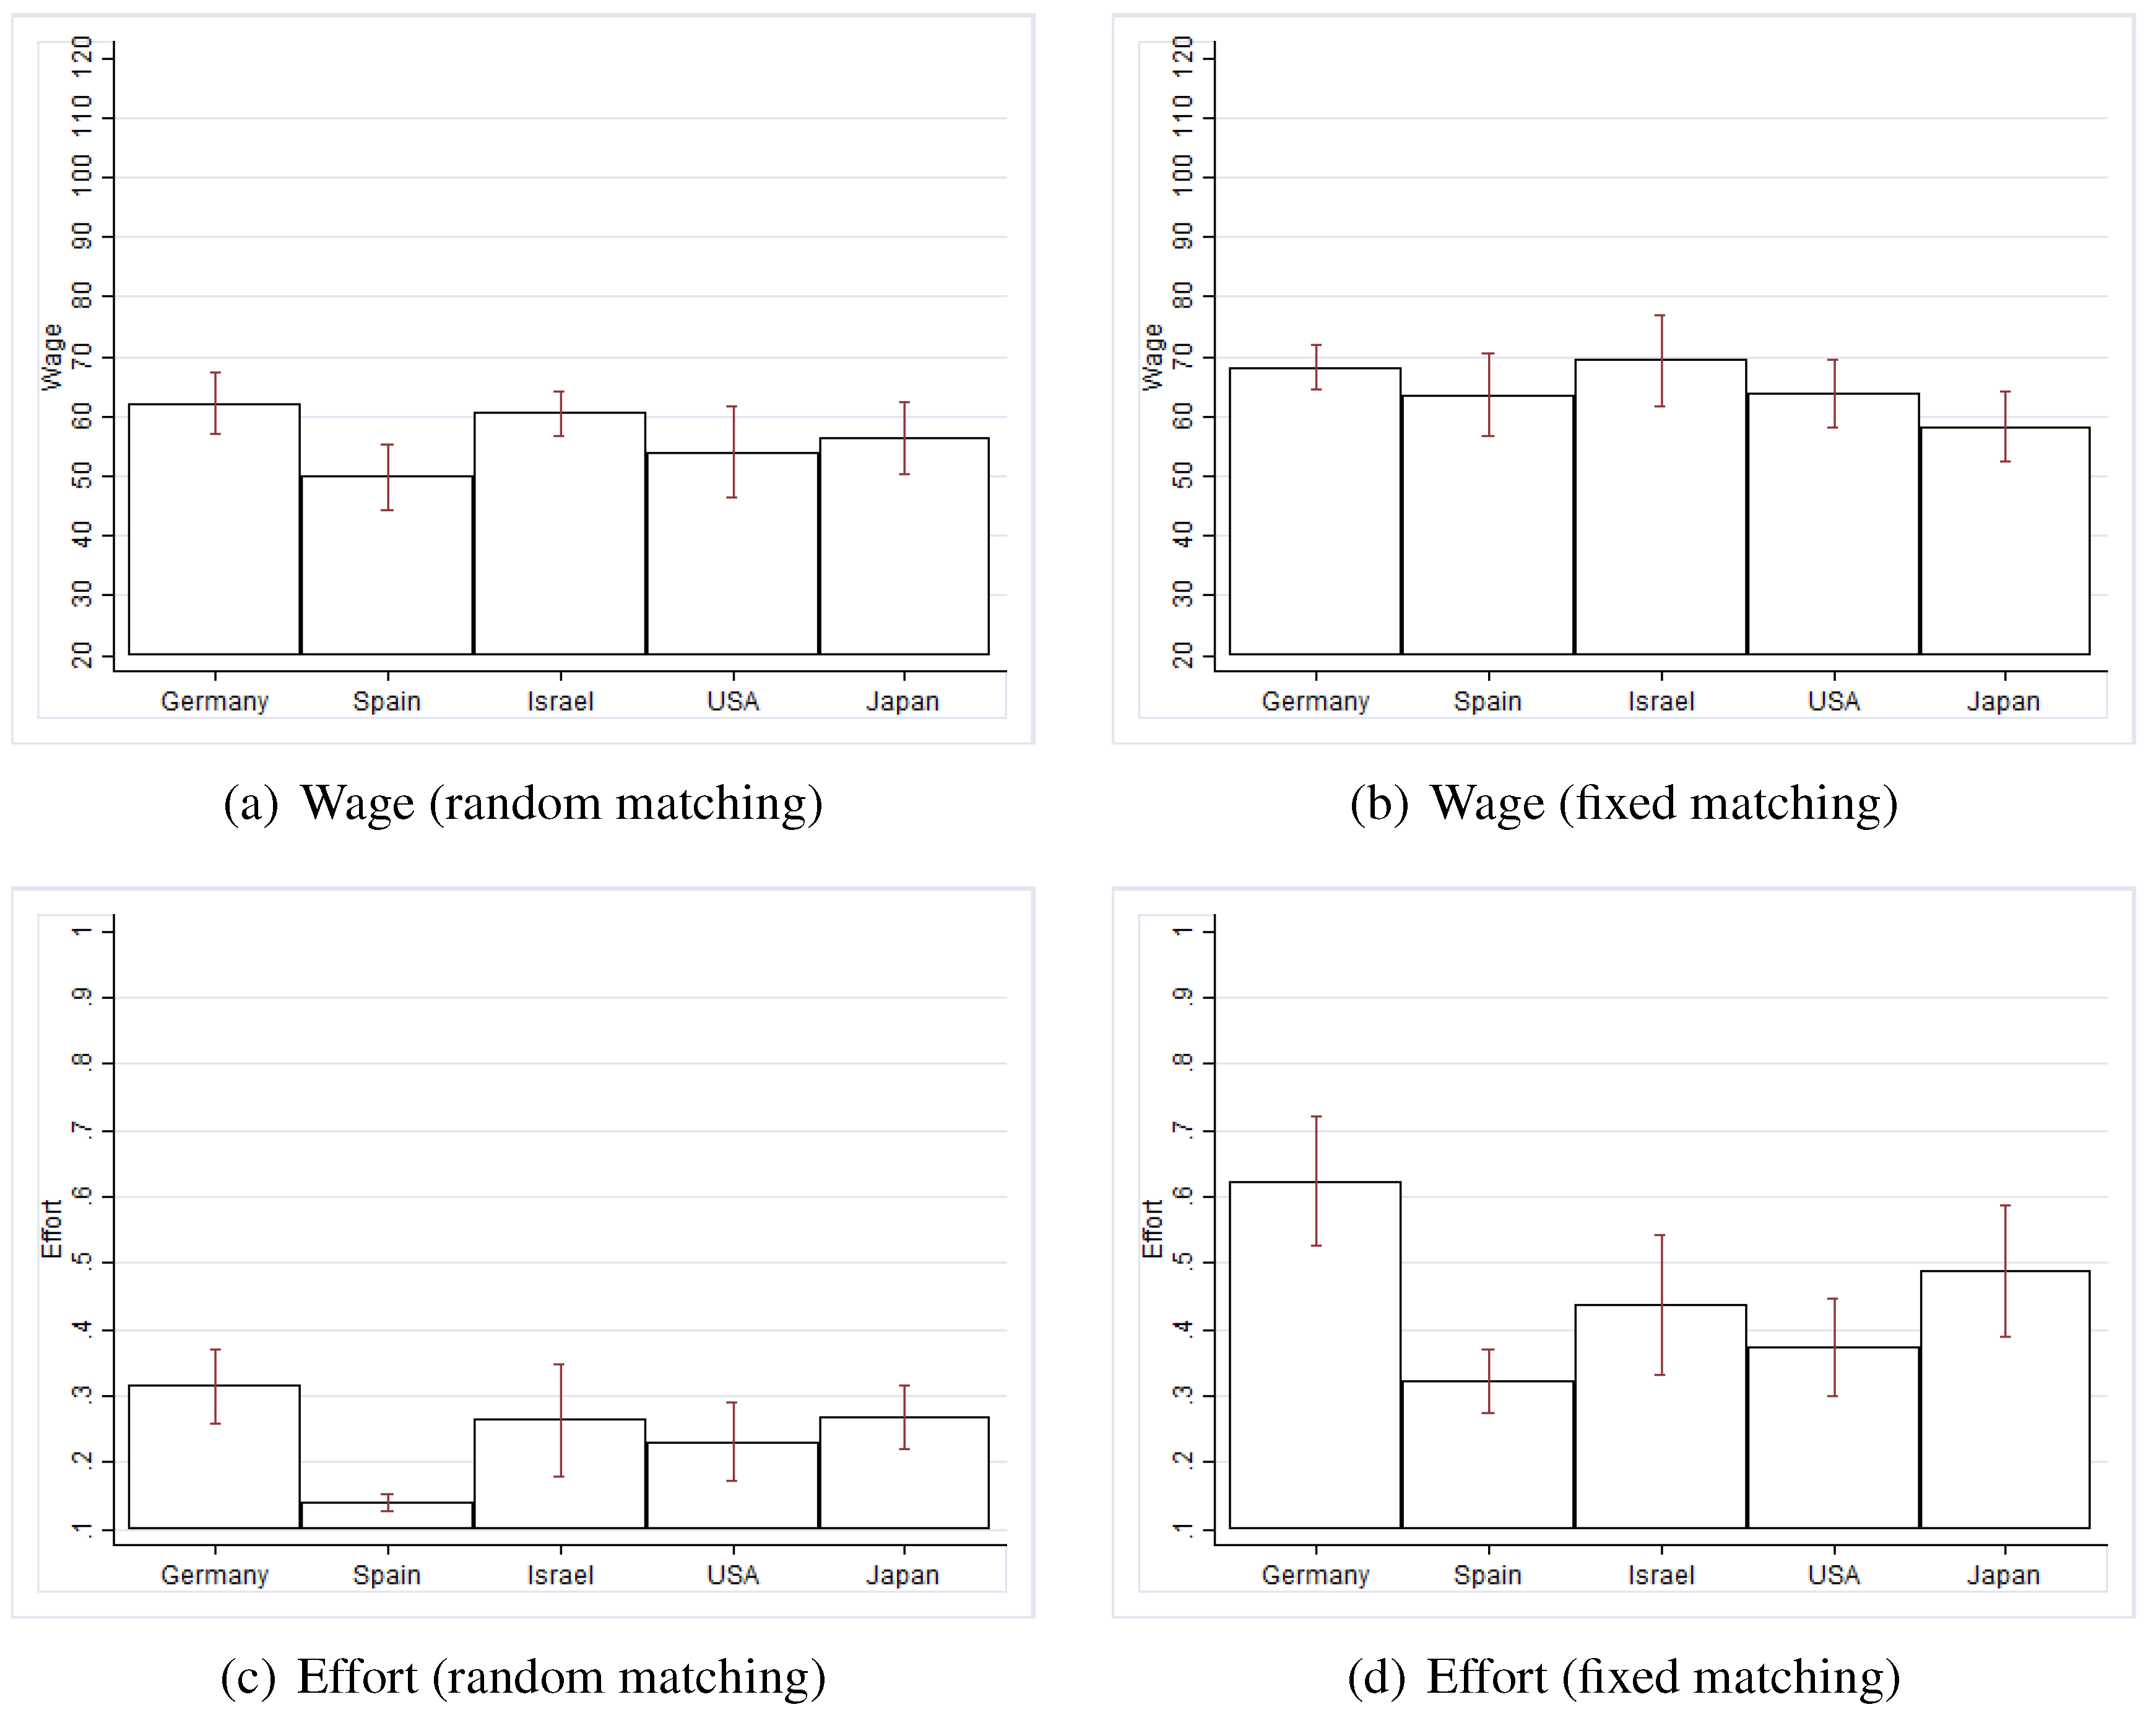
Table 2 provides the first glance at the performance of the different subject pools, while Figure 1 illustrates the mean (and standard errors) of wage offers and effort levels in each treatment. For the non-parametric analysis, we exclude the first and last round (due to possible “start-game” effects stemming from unfamiliarity with the task in the first round and “end-game” effects in the last round of the fixed-matching treatments).8 As an observation for both the random and fixed matching treatment, we are using the average performance per worker over Rounds 2–9 (i.e., in both the RM and FM treatments, the number of independent observations is equal to number of firms or workers). The procedure is explained below.
Table 2. Average outcomes in the different treatments (Rounds 2–9). RM, random matching; FM, fixed matching.
TreatmentAll OffersAccepted OffersRejected Offers
(Number of Subjects) w ¯ Joint-Π w ¯ e ¯ Π-ratio w ¯ Rejections
Germany RM (36)61.3753.97 62.070.313.81 28.330.02
Germany FM (36)67.9366.09 67.970.631.73 67.140.04
Spain RM (54)49.1537.04 50.400.145.06 27.830.05
Spain FM (52)60.5751.40 63.670.324.00 34.360.10
Israel RM (34)59.6650.44 60.630.264.32 27.500.02
Israel FM (36)67.9858.54 70.490.455.25 44.710.09
USA RM (42)53.0142.28 55.090.234.31 30.070.08
USA FM (42)62.2154.77 64.100.373.21 35.270.06
Japan RM (50)55.8447.80 56.660.264.28 23.600.02
Japan FM (46)57.6756.6158.700.491.6927.330.03
The symbols “ w ¯ ” and “ e ¯ ” indicate average wage and effort, respectively. “Joint-Π” indicates the surplus from a relationship. It is equal to Π W + Π F . “Π-ratio” is equal to Π W / Π F , where Π W ( Π F ) denotes the worker’s (firm’s) payoff. In calculating the “Π-ratio”, we omitted three observations where Π F = 0 , but not due to a rejection of offer (two cases in the Spain FM treatment and one case in the Israel RM treatment).

3.1. Behavior in a Sequence of One-Shot Interactions

We first examine the results in the RM treatments, in which workers are matched with different firms in every round, thus leaving no opportunity for building up reputation or applying dynamic strategies. We start by using a robust rank order test to pairwise compare across countries. The p-values of these comparisons are shown in Table B1 in the Appendix. When pairwise comparing wage offers across countries, we find that German subjects adopting the roles of firms offer the highest wages (significantly higher than their counterparts from Spain, the USA and Japan). Spanish subjects representing firms offer significantly lower wages than those from the other countries (except for the USA). In addition, we observe that hardly any firm offers the SPE wage of 20 or 21 (less than 2% in any of the subject pools). When such a wage offer is observed, the worker either rejects it or selects the minimum effort level.9
Figure 1. Mean wage and effort levels (with standard errors) for accepted offers in the random- and fixed-matching treatment over Rounds 2–9.
Games 06 00473 g001
Next, we want to learn how wage offers affect rejection and effort levels. For this purpose, we use the Hurdle model specification (see [38]) to capture the worker’s two-stage decision: whether or not to reject the wage offer (by a logit model) and, if not rejected, which effort level to choose (by a truncated linear regression).10
Table 3 indicates that, first, rejections depend (significantly) negatively on the wage offers for all subject pools, but we observe no significant difference in the “propensity to reject” across countries. Second, we observe that in all countries, effort levels depend (significantly) positively on the wage offers.11 We find no difference in reciprocity (effort levels per wage offer) across countries, except for a lower reciprocity in Spain (the significance level is p = 0.059 ). This means that for an average wage offer of 60 ECU (in Round 5), the average effort in both Germany and the USA is equal to 0.23, but in Spain, it is only 0.13. For an average wage offer of 80 ECU, the average efforts in Germany and the USA are 0.35 and 0.33, but only 0.15 in Spain.
Table 3. Hurdle model estimation for the random-matching treatments.
RejectionEffort Level
Germany3.677 (2.386)−0.063 (0.130)
Spain−0.031 (94.991)0.144 (0.108)
Israel−1.679 (3.240)−0.001 (0.175)
Japan1.827 (8.048)0.034 (0.108)
Wage−0.151 *** (0.051)0.005 *** (0.002)
Wage × Germany−0.130 (0.090)0.001 (0.003)
Wage × Spain−0.021 (3.804)−0.004 * (0.002)
Wage × Israel0.036 (0.107)−0.000 (0.004)
Wage × Japan−0.121 (0.393)−0.000 (0.002)
Round dummies (2–10)yesyes
Constant4.00 ** (1.439)−0.017 (0.110)
Observations10801030
Wald chi2 ( k 1 ) 314.94 ***9223.03 ***
Pseudo R 2 / R 2 0.370.29
The rejection decision is estimated using a logit specification. The effort level decision is estimated using a truncated linear regression. Standard errors are in parentheses. Both specifications are estimated using bootstrapped clustered robust standard error (by session) with USA as the benchmark country (1000 replications per specification, 369 and 535 of them were completed in the logit and linear regression, respectively). Finally, *, ** and *** denote equal to or less than the 10%, 5% and 1% significance levels, respectively.
Although workers reciprocate with higher effort when receiving higher wages, they do not attempt to split payoffs evenly. In fact, for no pair of matched subjects did the firm earn a positive payoff equal to the worker’s payoff. For all matched pairs, workers’ payoffs are found to be significantly larger than the firms’ payoffs.12 Even though on average the payoff ratios range between 3.81 (Germany) and 5.06 (Spain), we find no statistical difference between the subject pools.13 Finally, in terms of surplus (measured by the joint payoffs of the firm and the worker), we find that Germans perform better than Spanish and U.S. Americans. Spanish subjects perform worse than subjects from all other countries, except for U.S. Americans. Our first result can now be formulated as follows:
Result 1 (random matching): In the treatments representing a sequence of one-shot relationships, we find that: (i) German subjects offer higher wages than the other subject pools (except for Israelis), while Spanish offer lower wages than the other pools (except for U.S. Americans); (ii) rejections and effort levels (per given wage offer) are not different across countries, except for Spanish subjects, who reciprocate with less effort (per wage) than their counterparts in the other countries; (iii) payoff inequality between workers and firms is not different across countries; and (iv) as to surplus, German subjects outperform Spanish and U.S. American subjects, while Spanish subjects fall behind all of the other countries’ subjects, except for the U.S. Americans.
Models of social preferences are often used to explain the higher levels of effort observed in gift-exchange experiments compared to the standard economic prediction. Along these lines, we estimate country-specific parameters of the inequity aversion model of [21] and use these estimates to show how different norms regarding social preferences may explain observed differences across countries. As noted above, in the FM treatments, there are other reasons why workers may give high effort that are not based on social preferences, so we focus only on the RM treatments for this analysis. In their model, Fehr and Schmidt assume that individual utility depends on an individual’s payoff, but is also negatively affected by the difference between the individual’s payoff and the partner’s payoff. Formally, the utility of worker j is:
U j W ( e j ) = Π j W w i , e j α max ( Π i F w i , e j Π j W w i , e j , 0 )
β max ( Π j W w i , e j Π i F w i , e j , 0 )
where Π j W w i , e j denotes the payoff of worker j, receiving a wage offer w i from the respective firm and choosing an effort e j . Similarly, Π i F w i , e j represents the payoff of firm i offering a wage offer w i and receiving an effort e j from the respective worker.
The β and α parameters are the worker’s marginal utility loss from advantageous and disadvantageous inequality, respectively. Fehr and Schmidt further assume that 0 < β < 1 and α β . In the gift-exchange game, workers with a high β may choose a higher effort level to reduce the disutility from an unequal payoff. However, the α parameter will not affect a worker’s choice in most situations (see [39]). The α parameter is defined so that it only affects a worker’s choice when a worker is earning less than the firm. In most situations in the gift exchange game, a worker can prevent earning less than the firm by choosing a low enough effort.14 In the range of (high) efforts where α does affect utility, a decrease in effort will both increase the worker’s payoff and reduce payoff inequality. Therefore, the inequity aversion model predicts that the worker would always want to reduce effort and avoid earning less than the firm (for any value of α). Hence, in the following, we estimate only the “aversion to advantageous inequity” parameter, β.
In the context of the worker decision in a gift exchange game, the inequity aversion model of social preferences offers similar behavioral predictions to models based on reciprocity. With both models of social preferences, workers are inclined to respond to high wages with high effort, either to reduce payoff inequality or to reciprocate with respect to the generous wage offer. It is not our goal to determine whether high effort levels stem from inequity aversion or reciprocity; instead, we consider the β estimates to be informative about whether there are some kinds of social preferences that influence worker behavior in gift-exchange games and how those social preferences vary across countries.
To estimate β, we assume that workers choose the effort level with the highest utility where utility for each effort level is determined as described in Equation (3) plus an error term. We assume that the random error terms for each effort level have an independent, identical extreme value distribution. This framework leads to multinomial logit choice probabilities. Let E { 0 , 0.1 , 0.2 , 0.3 , 0.4 , 0.5 , 0.6 , 0.7 , 0.8 , 0.9 , 1 } denote the set of possible effort levels, and let e j E denote the effort chosen by worker j. Then, the probability that a worker chooses effort level e j is:
P r ( e j ) = exp U j W ( e j ) k E exp U j W ( k )
We estimate β by maximum likelihood and bootstrap standard errors. Estimates for each country are shown in Table 4. The baseline model shows a single estimate for each country. To allow for heterogeneity among subjects, we also estimate a finite mixture model with multiple types of subjects in each country. Each type has a distinct β, and the proportion of subjects (θ) of each type is estimated along with the β estimates. To determine how many types to use, we continued to add types as long as the addition results in an improvement to the Bayesian information criterion (BIC). The BIC is equal to B I C = 2 L L + k l o g ( n ) , where L L is the log likelihood, k is the number of parameters and n is the number of observations.15
Table 4. Estimates of the aversion to advantageous inequity parameter.
CountryParameterBaselineMixture Model
ModelType 1Type 2Type3
Germanyβ0.24 *** (0.02)0.26 *** (0.08)0.10 (0.08)
θ0.72 *** (0.20)
Spainβ0.02 (0.01)
θ
Israelβ0.20 *** (0.04)0.48 ** (0.21)0.30 (0.21)0.04 (0.12)
θ 0.11 (0.14)0.30 (0.20)
USAβ0.19 *** (0.03)0.31 *** (0.07)0.18 *** (0.06)0.00 (0.27)
θ 0.16 (0.20)0.51 *** (0.14)
Japanβ0.21 *** (0.02)0.24 *** (0.08)0.09 (0.08)
θ 0.57 *** (0.13)
Estimates are from maximum likelihood estimation with bootstrapped standard errors using data from workers in the RM treatments only. In the baseline model, a single β is estimated for each country. For the mixture model, distinct β are estimated for each type, and θ is the prior probability that a subject is of that type. Instead of estimating θ for the last type, it is set such that probabilities sum to one. To determine the number of types to estimate for each country, we added types until the Bayesian information criterion did not decrease. Standard errors are in parentheses. *, ** and *** denote equal to or less than the 10%, 5% and 1% significance levels, respectively.
Looking at the baseline model, note that Spain, the country with the lowest effort levels, has a β close to zero and that is not statistically significant ( p = 0.12 ), indicating that Spanish workers gain little utility from reciprocal behavior that reduces the inequality in earnings between themselves and their firm. All of the other countries, on the other hand, have β estimates that are close to 0.2 and are statistically significant at p < 0.01 (with Germany a little higher than the other three countries). These subjects do have some utility gain from reciprocating with respect to their firms. Notably, our β estimates in the four countries other than Spain are quite close to the original calibration by [21] that had a median value of 0.25.
The mixture model provides more insight into the distribution of β within each country. First, note that in Spain, the addition of a second type did not improve the BIC, so no results are reported for the mixture model. In particular, both types estimated for Spain had β close to zero and that was statistically insignificant, not very different than in the baseline model. In both Germany and Japan, the mixture model leads to two types, one with a β of about 0.25 and another with β close to 0.1 (and not statistically significant). In these countries, a large fraction of subjects are of the type with the higher β (0.72 in Germany, 0.57 in Japan). From this, it appears that between three quarters and one half of the subjects in Germany and Japan are averse to advantageous inequity, while the remaining subjects show little to no aversion. The mixture model leads to three types in Israel and the USA. The USA is similar to Germany and Japan with about two thirds of the subjects demonstrating significant aversion to advantageous inequity. Finally, in Israel, slightly more than half of the subjects are not averse to advantageous inequity, but the remaining subjects have greater aversion than in the other countries. In short, the mixture model demonstrates that all countries have a considerable proportion of subjects who exhibit little or no aversion to advantageous inequity. Further, the distribution of β varies somewhat, but not greatly among four of the countries, while Spain stands alone in having no subjects with significantly positive β.

3.2. The Effect of a Repeated Relationship

To examine behavior in repeated relationships (like most existing labor markets), we conducted fixed matching (FM) treatments where the same firm and worker are matched together in all 10 rounds. In the following, we are using the robust rank order test to pairwise compare (i) between the RM and FM treatments (a within-country comparison that isolates the effect of a repeated interaction between a firm and a worker) and (ii) across the FM treatments (a between-country comparison in the treatments with a repeated interaction between a firm and a worker). The p-values of these comparisons are shown in Table B2 and Table B3 in the Appendix. When comparing the performance between the random matching (RM) and fixed matching (FM) treatments within each country and across subject pools, we find that wage offers are significantly higher under FM than under RM in all countries, except for Japan (and in the FM treatments, we find no systematic differences in wage offers across countries in the pairwise tests). Further, we also observe that a repeated relationship increases effort levels in all countries. As for the difference across countries in the FM treatments, we observe that effort is the highest in Germany ( p < 0.01 for all countries, except for Japan with p = 0.06 ).
Next, when inspecting the workers’ payoffs, we find these to be significantly larger than the firms’ payoffs in all treatments. A repetitive relationship reduces payoff inequality between workers and firms for German and Japanese subjects, but not for Spanish, Israeli and American subjects. Moreover, in the FM treatments, we find that payoff inequality is lower in Germany and Japan than in each of the other countries ( p < 0.01 in all pairwise comparisons). Finally, for all subject pools, we observe that repeated relationships increases surplus (joint payoff of firms and workers). Germany has significantly higher surplus than all countries, expect for Israel. However, in FM treatments, the surpluses of Spanish subjects are not lower than those of Israelis, Americans and Japanese. We summarize these results below.
Result 2 (fixed matching): In the treatments with a repeated relationship between a firm and a worker, we find that: (i) wage offers do not systematically differ across countries; (ii) Germans choose the highest effort levels; (iii) the lowest payoff inequality between workers and firms is observed among German and Japanese subjects; and (iv) Germans obtain the highest surplus, but by and large we observe no differences in surplus among the other subject pools.
Result 3 (random vs. fixed matching): The effect of repeated relationship between a firm and a worker leads to: (i) higher wage offers for all subject pools, except for the Japanese; (ii) higher effort levels in all countries; (iii) a reduction in payoff inequality between workers and firms among German and Japanese subjects; and (iv) higher surplus for all subject pools.
4. Comparison to Previous Gift-Exchange Studies

As was mentioned earlier, we chose a design that had already been implemented in several countries. We now want to inspect our results in light of these previous studies. Table 5 shows the average wage ( w ¯ ) and effort levels ( e ¯ ) in those studies, only including treatments that: (i) use the bilateral version of the game (i.e., one worker is randomly assigned to one firm); (ii) employ the same payoffs and effort cost schedules as in [5,6]; and (iii) only provide information to subjects regarding their own relationships (i.e., subjects do not receive information about other firm-worker pairs). Notably, all of the previous treatments satisfying (i)–(iii) were conducted in OECD countries, except for one study conducted in Malaysia.
When inspecting the values in Table 5 together with our results (summarized in Table 2), we find the following: First, the low effort observed in our RM treatment in Castellón, Spain, and the high effort observed in the RM and FM treatments in Debrecen, Hungary, seem exceptional.16 When omitting those two outliers from the comparison, we observe that in the RM treatments, the average wage offers (effort levels) in previous studies range between 53.51 and 63.41 ECU (0.24 and 0.33). In our sample, the average wage offers (effort levels) range between between 53.01 and 61.37 ECU (0.23 and 0.31). Hence, aside from the very high effort in Debrecen and the very low effort in Castellón, the average behavior does not seem to largely differ across countries and also between our sample and previous studies.17
Table 5. Performance in comparable previous bilateral gift-exchange game studies.
StudyPlaceSubjects w ¯ e ¯
Random matching
[6]Linz; ViennaSoldiers62.360.30
[36]LinzSoldiers≈56–66-
[43]DebrecenStudents60.600.53
[5]ViennaStudents≈57–63-
[41]CaliforniaStudents54.820.30
[42]OhioStudents59.760.31
[40]LisbonStudents≈60–70≈0.40–0.55
[44]LyonStudents53.510.24
[7]PenangStudents63.410.33
Fixed matching
[6]Linz; ViennaSoldiers64.120.51
[43]DebrecenStudents61.100.73
[5]ViennaStudents57.600.47
[7]PenangStudents58.420.43
In the studies by [41,42], workers could not reject the wage offer (it also seems that way in [40]). The mean wages and efforts in [6] are inferred from the regressions on p. 326 (with T = 5) [36,40], and the random matching treatment by [5] did not report on mean wage or effort; we thus denote the wage and effort in these treatments by the highest and lowest average wage and effort in Figure 2a (p. 340) in Fehr et al. [36], Figures 1 and 2 (p. 411) in Pereira et al. [40] and Figure 1 (p. 7) in Gächter & Falk [5]. Next, [42] used a maximum wage offer of 100, but without a fixed cost of 20. For comparability we therefore added 20 to the wage offers (we show here their standard no-table treatment). Finally, “-” indicates those cases where values are not reported.
In the FM treatments, average wage offers (effort levels) of previous studies range between 57.60 and 64.12 ECU (0.43 and 0.51). In our data, average wage offers (effort levels) range between 57.67 and 67.98 ECU (0.32 and 0.49, excluding Germany with an effort level of 0.63). Hence, average behavior does not considerably differ across these subject pools.
Next, we inspect the possible correlations between socio-economic indicators and performance in those countries where similar BGE experiments have been conducted (i.e., our sample of countries combined with the sample shown in Table 5 above). Table A1 in the Appendix presents the socio-economic indicators. When using a non-parametric Spearman correlation between each of these indicators and the average wage offers or effort levels per country, we do not find any obvious correlation between these country-specific indicators and behavior in the RM treatments.18 However, in the FM treatments, the indicators of “norms of civic cooperation” (NCC, measuring the efficiency for which a society is solving collective action problems; see [45]) and the “long-term orientation index” (LTOI, defined as “fostering of virtues oriented towards future rewards”, [46] p. 239) are positively correlated with effort (LTOI: Spearman coefficient 0.66, including eight countries, NCC: Spearman coefficient 0.65, including six countries).19 Nevertheless, due to the low number of observations, the evidence is not statistically significant. We conclude that much further research is necessary to establish the link between socio-economic indicators and subjects’ decisions in economic experiments.

5. Discussion and Conclusions

Despite the growing popularity in studying cross-culture behavioral differences, there have been only a handful of experiments with subjects from four or more countries and, until now, no cross-country labor market gift-exchange game study. The aim of this study is to learn about systematic differences in behavior across high-income OECD countries in a labor market experiment and also if these differences grow larger or smaller when the employer-employee relationship is repeated.
Our findings can be summarized as follows: In the random matching treatments, we observe that Germans offer the highest wages, while Spanish the lowest. We do not observe differences in rejection rates across treatments. Further, we find that the efficiency wage hypothesis is confirmed in all countries, expect for Spain, where at best, it is only weakly supported by the data. The overall surplus of German subjects is, on average, the highest, while that of Spanish subjects is, on average, the lowest. We also observe that in comparison with random matching, fixed matching increases wages in all countries, except for Japan, and increases effort levels in all countries. This leads to higher surplus in all countries. Finally, we observe that German subjects also perform better than those of the other countries in terms of effort and overall surplus under fixed matching.
In addition, we use the data from the random matching treatments to model differences across countries in a particular way, by estimating the “aversion to advantageous inequity” parameter of the inequity aversion model [21] in each country. We do not observe large differences in aversion to advantageous inequity in Germany, Israel, Japan and the USA. However, this aversion is considerably lower in Spain. We also show that the distribution of inequity aversion across subjects within a country is similar across the four countries (except Spain) and that all five countries have a considerable proportion of subjects who do not exhibit aversion to advantageous inequity.
The fact that Germans offer higher wages and effort than their American counterparts is consistent with the gift-exchange game study by [47], who speculate that country-specific norms are behind the lower wages and effort levels of their American subjects in comparison with similar gift-exchange studies conducted by Fehr and colleagues in Europe.20 In addition, in a variant of a trust game conducted with international PhD students, [48] find that subjects from Northern Europe earn substantially more than their Southern European counterparts. This result is in line with our most remarkable differences in behavior between Germans (Northern European) and Spanish (Southern European).
In addition, the low offers by Spanish subjects in the one-shot treatment are consistent with the findings from ultimatum game experiments (see the meta-analysis by [49]). An additional example of low transfers made by Spanish subjects in a trust game is provided by [50], who conducted a binary trust game experiment with subjects from Morocco, France and Spain. These authors observe that Spanish subjects are significantly less trustworthy than subjects from Morocco or France.21 Further, in contrast to what could be conjectured from the ultimatum game study by [19], we do not find higher wage offers by American subjects than by Israeli and Japanese subjects, and rejection rates are also not lower in Israel and Japan than in the USA. In line with [26] and at odds with [27,29], we do not find considerable differences in trust (i.e., wage offers) and reciprocity (i.e., effort levels) between Americans and Japanese.
In short, we find that, while some prior results from games involving reciprocity and trust are confirmed by our experiments, in other cases, the results do not extend to the gift-exchange setting. Our results demonstrate the value of conducting further cross-country studies that provide evidence on the consistency and robustness of previous findings.

Acknowledgments

Financial assistance was provided by Universiti Sains Malaysia (1001/PSosial/816117). We would like to thank Avi Weiss and Gianluca Grimalda for useful comments and remarks. Finally, we would like to thank the editor and three anonymous referees for their comments and suggestions.

Author Contributions

Israel Waichman, Ch’ng Kean Siang, and Till Requate designed the study. Israel Waichman, Ch’ng Kean Siang, Till Requate, Aric P. Shafran, Eva Camacho-Cuena, Yoshio Iida, and Shosh Shahrabani conducted the study. Israel Waichman and Aric P. Shafran analyzed the data. Israel Waichman, Till Requate, and Aric P. Shafran wrote the paper.

Conflicts of Interest

The authors declare no conflict of interest.

A. Appendix File: Cross-Country Socio-Economic Indicators

In this section, we report on several socio-economic indicators and formulate how they are expected to impact behavior in a bilateral gift-exchange game study. The indicators are displayed in Table A1 (in addition to the findings of the of the trust game meta-analysis by [31]).
We start by inspecting two cross-nation indicators suggested by [46]. These authors define the power distance index (PDI) as “the extent to which the less powerful members of the institutions and organizations within a country expect and accept that power is distributed unequally” ([46] p. 61). In particular, we expect higher PDI to be related to lower rejection rates and high effort levels. A second cross-nation dimension of possible relevance is the long-term orientation index (LTOI), defined as “fostering of virtues oriented towards future rewards—in particular, perseverance and thrift”~ ([46] p. 239).22 Thus, we expect higher LTOI to be positively related to high wage offers (or high effort levels) in the repeated treatments.
Table A1. Socio-economic indicators.
Trust GameNational DimensionsWVSWJP
SentSent backPDILTOITrustNCCRoLaw
Our sample
Germany0.510.4435830.337.800.81
Spain--57480.197.670.68
Israel0.590.451338---
USA0.510.3440260.397.690.73
Japan0.580.3254880.368.290.78
Previous experiments
Austria0.620.381160--0.82
France0.430.3368630.187.070.74
Hungary0.510.4046580.287.840.58
Malaysia--104410.086.230.57
Portugal--6330--0.70
In the trust game, “sent” and “sent back” are the average amount sent (in the first stage) and sent back (in the second stage) from the respective available amounts. PDI stands for “power distance index”, and LTOI stands for “long-term orientation index” [46]. “Trust” measures the percentage of people responding to the item V23 in Wave 5 of the World Value Survey (WVS) in 2005–2009 by “most people can be trusted.” The last two rows are following [16]: “NCC” denotes “norms of civic cooperation.” It is the (rescaled) average of Items V198–V200 in Wave 5 of the WVS. “RoLaw” denotes the Rule of Law Index developed by the World Justice Project (we use the latest values from 2015). Finally, “-” indicates those cases where values are not reported.
A key notion as to why subjects offer high wages in a gift-exchange game is the trust a player has in receiving a “gift” (high effort) back. To this end, we use Item V23 of [52] (Wave 5: 2005–2009), which measures the percentage of those who responded with “most people can be trusted” to the following question: “Generally speaking, would you say that most people can be trusted or that you need to be very careful in dealing with people?” We expect trust to be positively correlated with high wage offers.
Finally, following [16], we include two additional indicators, “norms of civic cooperation” (NCC) and “Rule of Law Index” (RoLaw).23 NCC is defined by [45] as a measure for the efficiency for which a society is solving collective action problems. We follow [16], measuring NCC as the average of three World Value Survey items where participants are asked whether a particular behavior can be justified or not. The statements are (Item V198) “Claiming government benefits to which you are not entitled”, (V199) “Avoiding a fare on public transport” and (V200) “Cheating on taxes if you have a chance.” The higher the average, the stronger are civic norms in the respective country.24 RoLaw [53] captures the perception of how the rule of law is enforced within the country. This in particular refers to constraints on government power, the absence of corruption, open government, fundamental rights, order and security, regulatory enforcement, civil justice, criminal justice and informal justice. We expect that these two indicators (high NCC and RoLaw) are related to high wage offers and high effort levels.
As already pointed out in Section 4, when using a Spearman correlation to link these socio-economic indicators to differences in behavior across countries we do not observe obvious correlations in the random matching treatments. However, the LTOI and NCC indicators are possibly correlated with high effort levels in the fixed matching treatments. Nevertheless, as the number of studies are small, these variables should be further explored in cross-country experiments and in meta-analyses of experiments.

B. Appendix File: Additional Tables and Figures

Table B1. Statistical differences across random-matching treatments.
OutcomeAverage GermanySpainIsraelUSAJapan
W ¯ (accepted offers)56.66Japan0.090.090.270.63-
e ¯ (accepted)0.26 0.170.000.520.16-
Π-ratio (accepted)4.28 0.840.430.910.73-
Joint-Π (all offers)47.80 0.180.010.540.17-
W ¯ (accepted offers)55.09USA0.070.380.16--
e ¯ (accepted)0.23 0.000.000.65--
Π-ratio (accepted)4.31 0.490.630.98--
Joint-Π (all offers)42.28 0.010.320.21--
W ¯ (accepted offers)60.63Israel0.410.00---
e ¯ (accepted)0.26 0.120.01---
Π-ratio (accepted)4.32 0.950.53---
Joint-Π (all offers)50.44 0.210.00---
W ¯ (accepted offers)50.40Spain0.00----
e ¯ (accepted)0.14 0.00----
Π-ratio (accepted)5.06 0.29----
Joint-Π (all offers)37.04 0.00----
W ¯ (accepted offers)62.07Germany-----
e ¯ (accepted)0.31 -----
Π-ratio (accepted)3.81 -----
Joint-Π (all offers)53.97 -----
p-values of pairwise comparisons of different outcomes, using a two-sided robust rank order test, in the different fixed-matching treatments. Unit of observation: average outcome per worker (averaged over Rounds 2–9). “Π-ratio” includes only cases where the firm’s profit is larger than 0. Finally, “Average” denotes the average value of the outcome of the comparison. For instance, the average wage offer in Japan is equal to 56.66 experimental currency units (ECU) (see Table 2).
Table B2. Statistical differences across fixed-matching treatments.
OutcomeAverage GermanySpainIsraelUSAJapan
W ¯ (accepted offers)58.70Japan0.000.410.000.24-
e ¯ (accepted)0.49 0.060.000.420.13-
Π-ratio (accepted)1.69 0.720.000.000.00-
Joint-Π (all offers)56.61 0.060.240.700.57-
W ¯ (accepted offers)64.10USA0.090.730.09--
e ¯ (accepted)0.37 0.000.300.46--
Π-ratio (accepted)3.21 0.000.830.80--
Joint-Π (all offers)54.77 0.000.420.31--
W ¯ (accepted offers)70.47Israel0.670.19---
e ¯ (accepted)0.45 0.000.10---
Π-ratio (accepted)5.25 0.000.90---
Joint-Π (all offers)58.54 0.220.13---
W ¯ (accepted offers)63.67Spain0.22----
e ¯ (accepted)0.32 0.00----
Π-ratio (accepted)4.00 0.00----
Joint-Π (all offers)51.40 0.00----
W ¯ (accepted offers)67.97Germany-----
e ¯ (accepted)0.63 -----
Π-ratio (accepted)1.73 -----
Joint-Π (all offers)66.09 -----
p-values of pairwise comparisons of different outcomes, using a two-sided robust rank order test, in the different fixed-matching treatments. Unit of observation: average outcome per worker (averaged over Rounds 2–9). “Π-ratio” includes only cases where the firm’s profit is larger than 0. Finally, “Average” denotes the average outcome of comparison. For instance, the average wage offer in Japan is equal to 58.70 ECU (see Table 2).
Table B3. The impact of repetition within each country.
OutcomeGermanySpainIsraelUSAJapan
W ¯ (accepted offers)0.060.000.000.070.50
e ¯ (accepted)0.000.000.000.000.00
Π-ratio (accepted)0.000.180.630.190.00
Joint-Π (all offers)0.000.000.050.000.06
p-values of pairwise comparisons of different outcomes, using a two-sided robust rank order test. Unit of observation: average outcome per worker (averaged over Rounds 2–9).
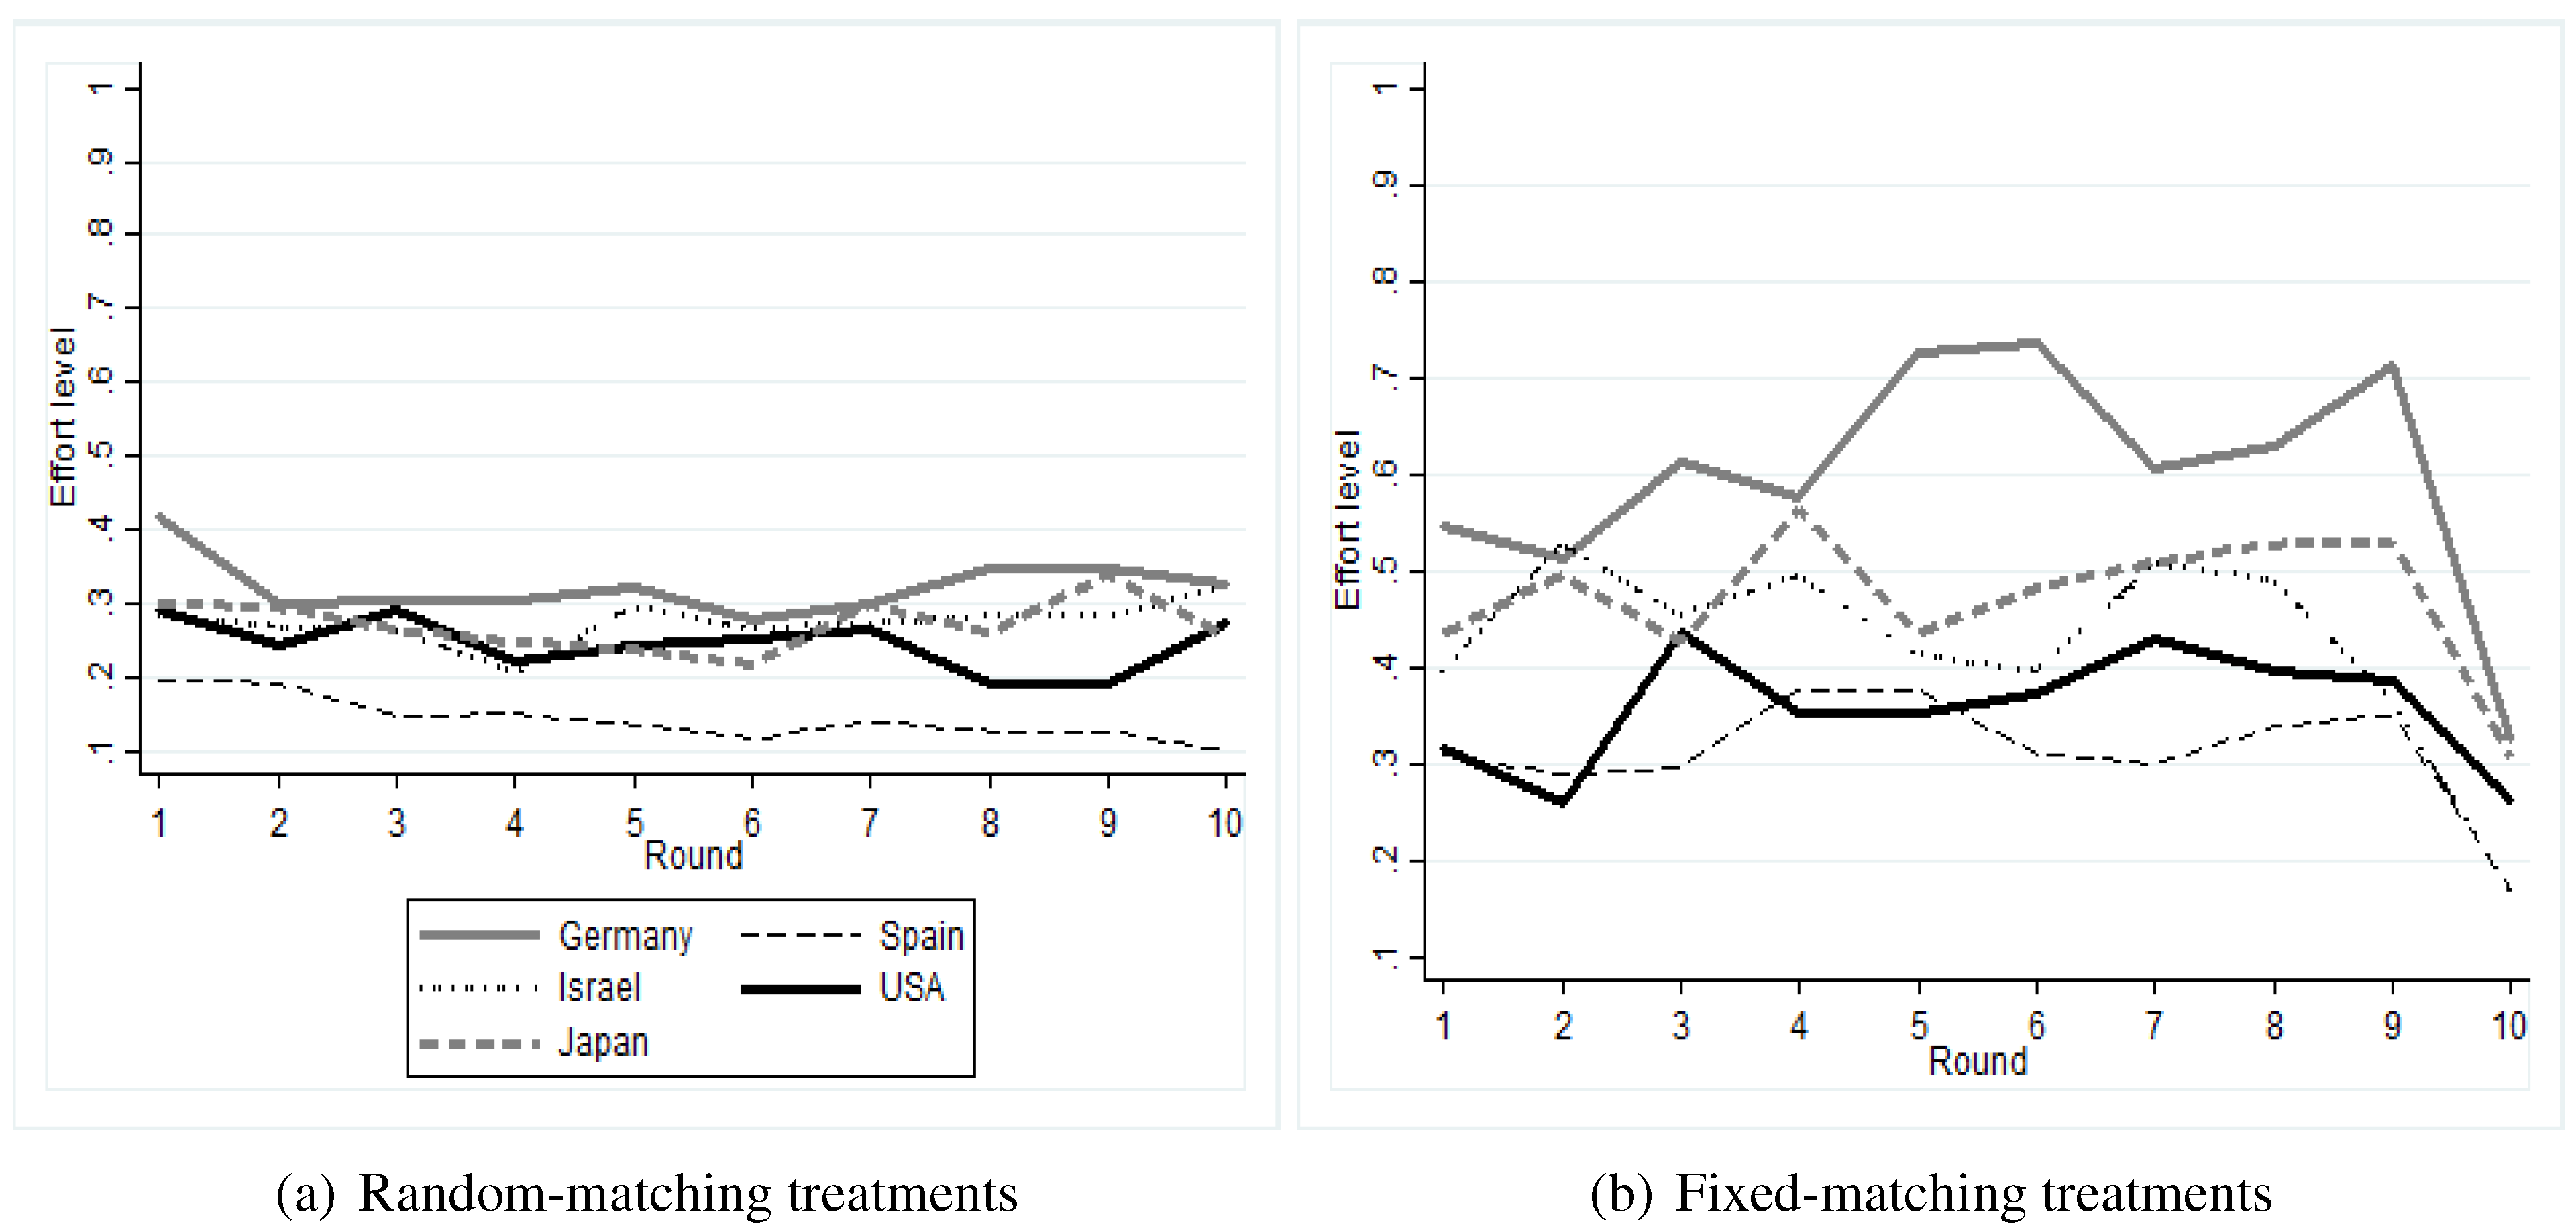
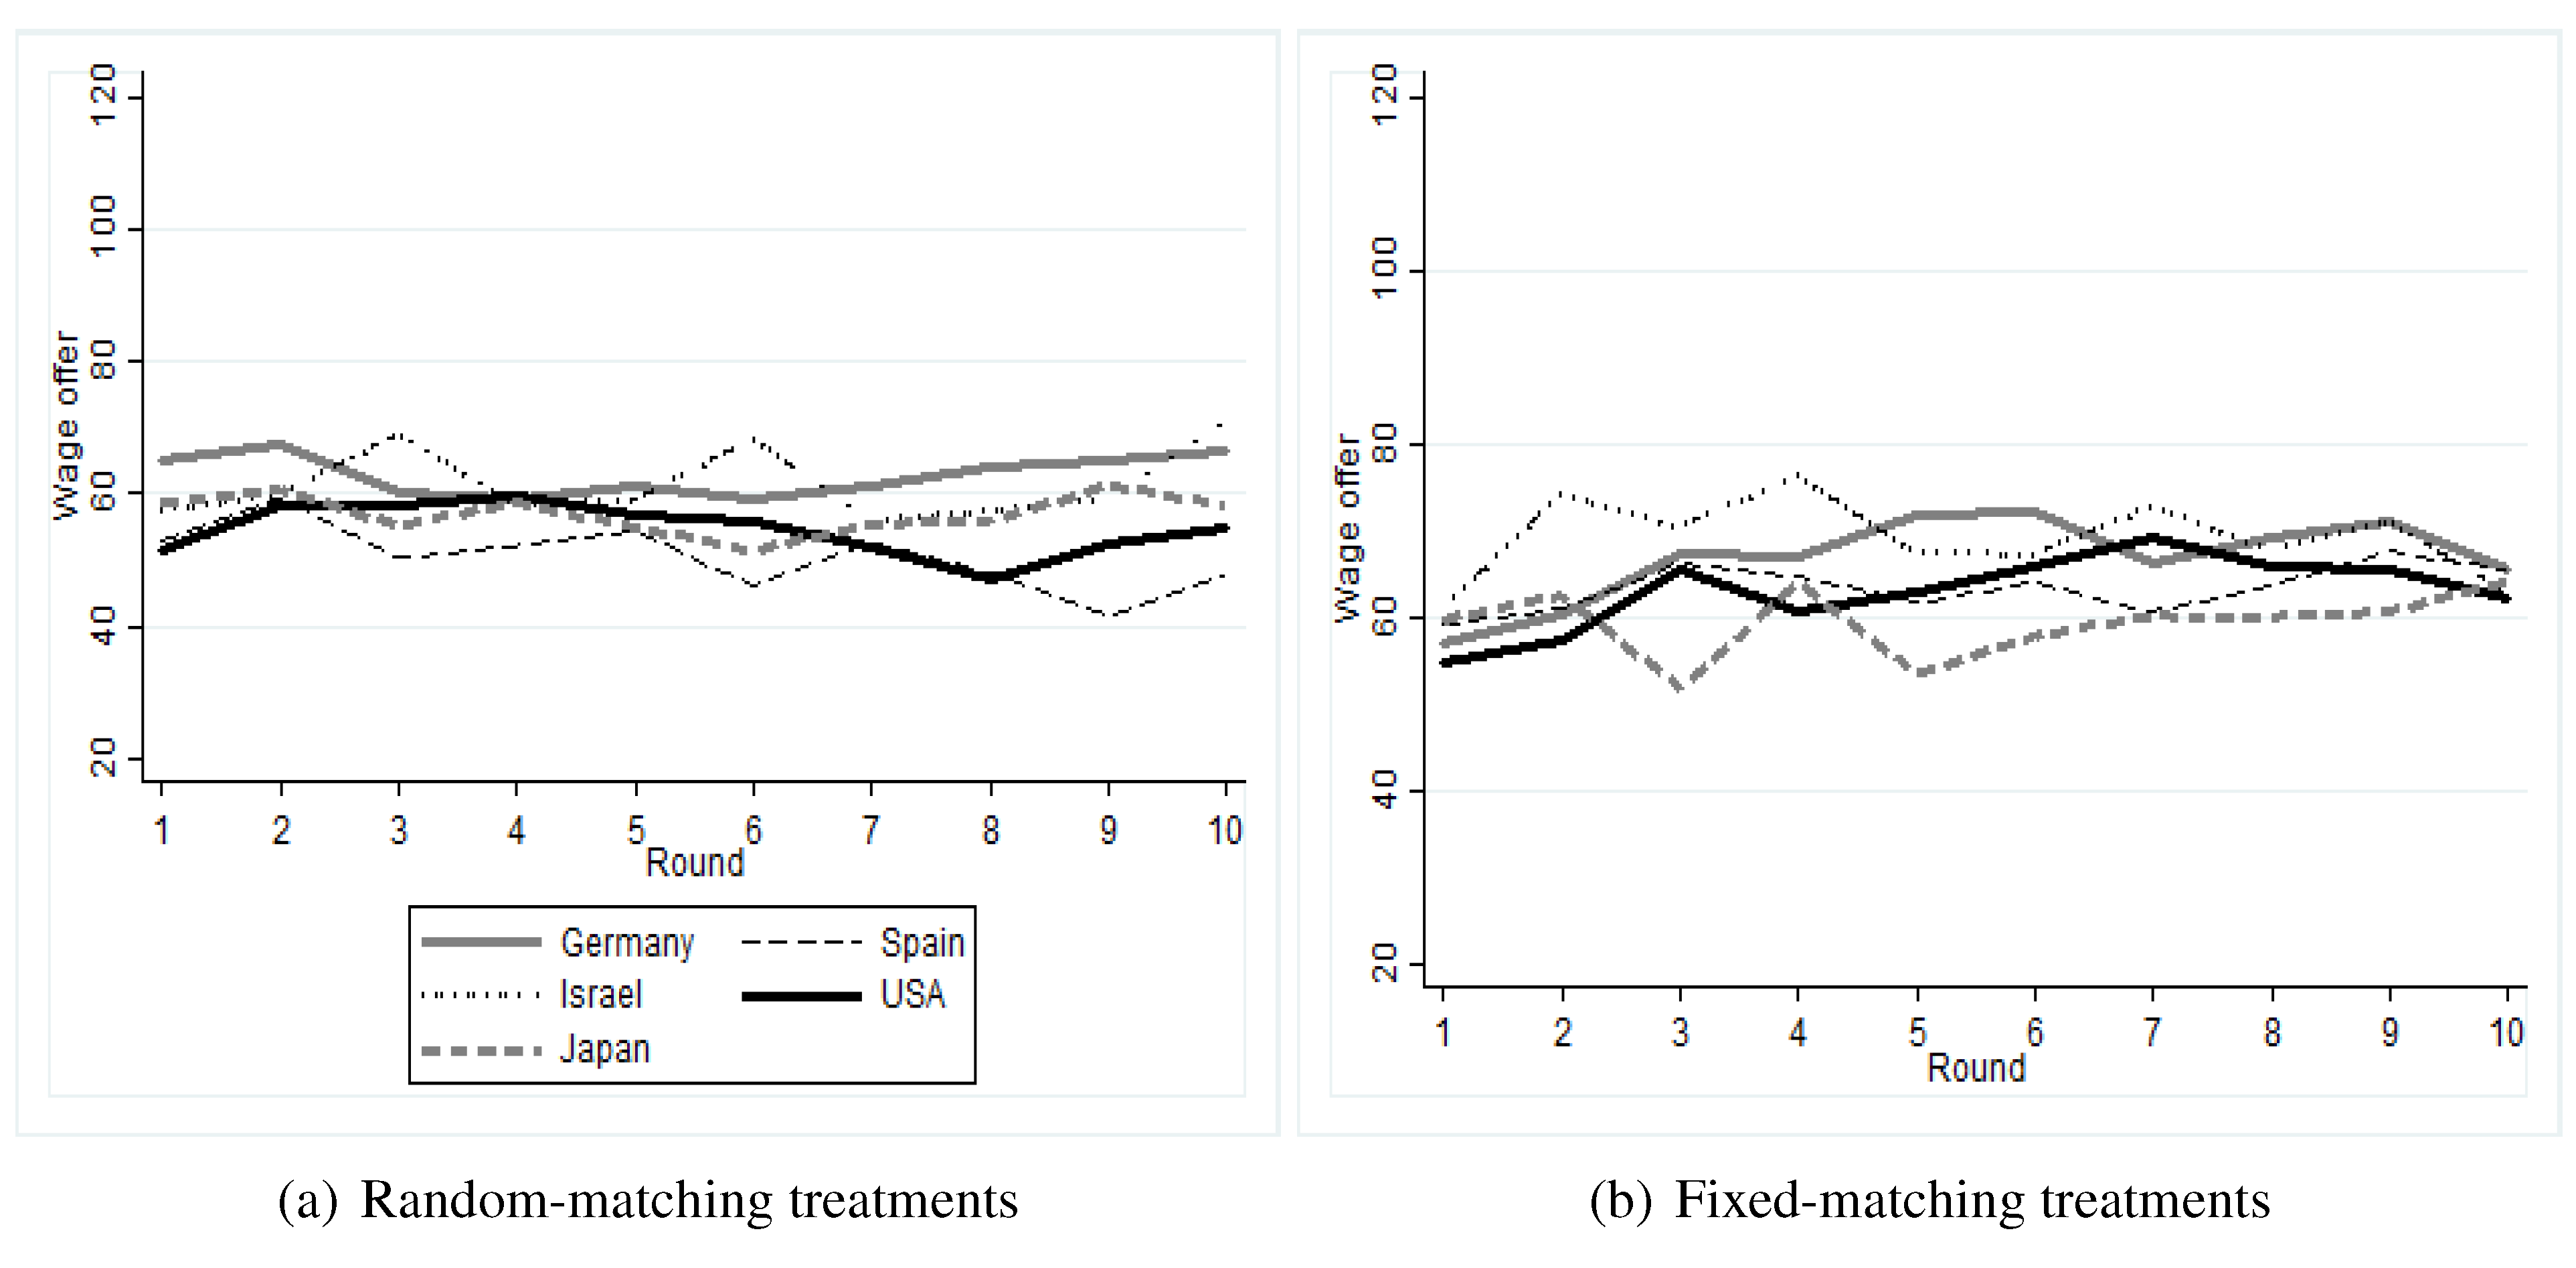
Figure B1. Evolution of average wages in the random- and fixed-matching treatments.
Games 06 00473 g002
Figure B2. Evolution of average effort in the random- and fixed-matching treatments.
Games 06 00473 g003

References

  1. Akerlof, G.A. Labor contracts as partial gift exchange. Q. J. Econ. 1982, 97, 543–569. [Google Scholar] [CrossRef]
  2. Akerlof, G.A.; Yellen, J. The fair wage—Effort hypothesis and unemployment. Q. J. Econ. 1990, 105, 255–283. [Google Scholar] [CrossRef]
  3. Fehr, E.; Kirchsteiger, G.; Riedl, A. Does fairness prevent market clearing? An experimental investigation. Q. J. Econ. 1993, 108, 437–460. [Google Scholar] [CrossRef]
  4. Casoria, F.; Riedl, A. Experimental labor markets and policy considerations: Incomplete contracts and macroeconomic aspects. J. Econ. Surv. 2013, 27, 398–420. [Google Scholar] [CrossRef]
  5. Gächter, S.; Falk, A. Reputation and reciprocity: Consequences for the labour relation. Scand. J. Econ. 2002, 104, 1–26. [Google Scholar] [CrossRef]
  6. Kirchler, E.; Fehr, E.; Evans, R. Social exchange in the labor market: Reciprocity and trust versus egoistic money maximization. J. Econ. Psychol. 1996, 17, 313–341. [Google Scholar] [CrossRef]
  7. Siang, C.K.; Requate, T.; Waichman, I. On the role of social wage comparisons in gift-exchange experiments. Econ. Lett. 2011, 112, 75–78. [Google Scholar] [CrossRef]
  8. Alesina, A.; Giuliano, P. Culture and institutions. J. Econ. Lit. 2015, in press. [Google Scholar]
  9. Cardenas, J.C.; Carpenter, J. Behavioural development economics: Lessons from field labs in the developing world. J. Dev. Stud. 2008, 44, 311–338. [Google Scholar] [CrossRef]
  10. Fernández, R. Culture and economics. In The New Palgrave Dictionary of Economics; Durlauf, S.N., Blume, L.E., Eds.; Palgrave Macmillan: Basingstoke, UK, 2008. [Google Scholar]
  11. Guiso, L.; Sapienza, P.; Zingales, L. Does culture affect economic outcomes? J. Econ. Perspect. 2006, 20, 23–48. [Google Scholar] [CrossRef]
  12. Fehr, E.; Schmidt, K.M. The economics of fairness, reciprocity and altruism—Experimental evidence and new theories. Handb. Econ. Giv. Alt. Recipr. 2006, 1, 615–691. [Google Scholar]
  13. Bohnet, I.; Greig, F.; Herrmann, B.; Zeckhauser, R. Betrayal aversion: Evidence from Brazil, China, Oman, Switzerland, Turkey, and the United States. Am. Econ. Rev. 2008, 98, 294–310. [Google Scholar] [CrossRef]
  14. Henrich, J.; Boyd, R.; Bowles, S.; Camerer, C.; Fehr, E.; Gintis, H.; Mcelreath, R. In search of homo economicus: Behavioral experiments in 15 small-scale societies. Am. Econ. Rev. 2001, 91, 73–78. [Google Scholar] [CrossRef]
  15. Henrich, J.; McElreath, R.; Barr, A.; Ensminger, J.; Barrett, C.; Bolyanatz, A.; Cardenas, J.C.; Gurven, M.; Gwako, E.; Henrich, N.; et al. Costly punishment across human societies. Science 2006, 312, 1767–1770. [Google Scholar] [CrossRef] [PubMed]
  16. Herrmann, B.; Thöni, C.; Gächter, S. Antisocial punishment across societies. Science 2008, 319, 1362–1367. [Google Scholar] [CrossRef] [PubMed]
  17. Buchan, N.R.; Brewer, M.B.; Grimalda, G.; Wilson, R.K.; Fatas, E.; Foddy, M. Global social identity and global cooperation. Psychol. Sci. 2001, 22, 821–828. [Google Scholar] [CrossRef] [PubMed]
  18. Buchan, N.R.; Grimalda, G.; Wilson, R.; Brewer, M.; Fatas, E.; Foddy, M. Globalization and human cooperation. Proc. Natl. Acad. Sci. USA 2009, 106, 4138–4142. [Google Scholar] [CrossRef] [PubMed]
  19. Roth, A.E.; Prasnikar, V.; Okuno-Fujiwara, M.; Zamir, S. Bargaining and market behavior in Jerusalem, Ljubljana, Pittsburgh, and Tokyo: An experimental study. Am. Econ. Rev. 1991, 81, 1068–1095. [Google Scholar]
  20. Brandts, J.; Saijo, T.; Schram, A. How universal is behavior? a four country comparison of spite and cooperation in voluntary contribution mechanisms. Public Choice 2004, 119, 381–424. [Google Scholar] [CrossRef]
  21. Fehr, E.; Schmidt, K.M. A theory of fairness, competition and cooperation. Q. J. Econ. 1999, 114, 817–868. [Google Scholar] [CrossRef]
  22. Berg, J.; Dickhaut, J.; McCabe, K. Trust, reciprocity, and social history. Games Econ. Behav. 1995, 10, 122–142. [Google Scholar] [CrossRef]
  23. Willinger, M.; Keser, C.; Lohmann, C.; Usunier, J.-C. A comparison of trust and reciprocity between France and Germany: Experimental investigation based on the investment game. J. Econ. Psychol. 2003, 24, 447–466. [Google Scholar] [CrossRef]
  24. Buchan, N.; Croson, R. The boundaries of trust: Own and others’ actions in the US and China. J. Econ. Behav. Organ. 2004, 55, 485–504. [Google Scholar] [CrossRef]
  25. Akaia, K.; Netzer, R.J. Trust and reciprocity among international groups: Experimental evidence from Austria and Japan. J. Socio-Econ. 2012, 41, 266–276. [Google Scholar] [CrossRef]
  26. Croson, R.; Buchan, N. Gender and culture: International experimental evidence from trust games. Am. Econ. Rev. 1999, 89, 386–391. [Google Scholar] [CrossRef]
  27. Buchan, N.R.; Croson, R.T.; Dawes, R.M. Swift neighbors and persistent strangers: A cross-cultural investigation of trust and reciprocity in social exchange. Am. J. Sociol. 2002, 108, 168–206. [Google Scholar] [CrossRef]
  28. Yamagishi, T.; Yamagishi, M. Trust and commitment in the United States and Japan. Motiv. Emot. 1994, 18, 129–166. [Google Scholar] [CrossRef]
  29. Hayashi, N.; Ostrom, E.; Walker, J.; Yamagishi, T. Reciprocity, trust, and the sense of control a cross-societal study. Ration. Soc. 1999, 11, 27–46. [Google Scholar] [CrossRef]
  30. Hennig-Schmidt, H.; Selten, R.; Walkowitz, G.; Winter, E.; Dakkak, I. Actions and Beliefs in a Trilateral Trust Game Involving Germans, Israelis and Palestinians. In Presented at Experimental Science Association (ESA) Conference, Rome, Italy, 23 June 2007; ESA 2007 World Meeting at LUISS in Rome. Available online: http://static.luiss.it/esa2007/programme/papers/221.pdf (accessed on 29 Spetember 2015).
  31. Johnson, N.D.; Mislin, A.A. Trust games: A meta-analysis. J. Econ. Psychol. 2011, 32, 865–889. [Google Scholar] [CrossRef]
  32. Cochard, F.; Nguyen-Van, P.; Willinger, M. Trusting behavior in a repeated investment game. J. Econ. Behav. Organ. 2004, 55, 31–44. [Google Scholar] [CrossRef]
  33. Bohnet, I.; Huck, S. Repetition and reputation: Implications for trust and trustworthiness when institutions change. Am. Econ. Rev. 2004, 94, 362–366. [Google Scholar] [CrossRef]
  34. Gerkey, D. Cooperation in context. Curr. Anthropol. 2013, 54, 144–176. [Google Scholar] [CrossRef]
  35. Fehr, E.; Klein, A.; Schmidt, K.M. Fairness and contract design. Econometrica 2007, 75, 121–154. [Google Scholar] [CrossRef] [Green Version]
  36. Fehr, E.; Kirchler, E.; Weichbold, A.; Gächter, S. When social norms overpower competition: Gift exchange in experimental labor markets. J. Labor Econ. 1998, 16, 324–351. [Google Scholar] [CrossRef]
  37. Fischbacher, U. z-Tree: Zurich toolbox for ready-made economic experiments. Exp. Econ. 2007, 10, 171–178. [Google Scholar] [CrossRef]
  38. Nikiforakis, N. Punishment and counter-punishment in public good games: Can we really govern ourselves? J. Public Econ. 2008, 92, 91–112. [Google Scholar] [CrossRef]
  39. Charness, G.; Haruvy, E. Altruism, equity, and reciprocity in a gift-exchange experiment: An encompassing approach. Games Econ. Behav. 2002, 40, 203–231. [Google Scholar] [CrossRef]
  40. Pereira, P.T.; Silva, N.; e Silva, J.A. Positive and negative reciprocity in the labor market. J. Econ. Behav. Organ. 2006, 59, 406–422. [Google Scholar] [CrossRef]
  41. Charness, G. Attribution and reciprocity in an experimental labor market. J. Labor Econ. 2004, 22, 665–688. [Google Scholar] [CrossRef]
  42. Charness, G.; Frechette, G.R.; Kagel, J.H. How robust is laboratory gift exchange? Exp. Econ. 2004, 7, 189–205. [Google Scholar] [CrossRef]
  43. Falk, A.; Gächter, S.; Kovacs, J. Intrinsic motivation and extrinsic incentives in a repeated game with incomplete contracts. J. Econ. Psychol. 1999, 20, 251–284. [Google Scholar] [CrossRef]
  44. Clark, A.E.; Masclet, D.; Villeval, M.-C. Effort and comparison income: Experimental and survey evidence. Ind. Labor Relat. Rev. 2010, 63, 407–426. [Google Scholar] [CrossRef]
  45. Knack, S.; Keefer, P. Does social capital have an economic payoff? A cross-country investigation. Q. J. Econ. 1997, 112, 1251–1288. [Google Scholar] [CrossRef]
  46. Hofstede, G.; Hofstede, G.J.; Minkov, M. Cultures and Organizations: Software of the Mind, 3rd ed.; McGraw-Hill: New York, NY, USA, 2010. [Google Scholar]
  47. Hannan, R.L.; Kagel, J.H.; Moser, D.V. Partial gift exchange in an experimental labor market: Impact of subject population differences, productivity differences, and effort requests on behavior. J. Labor Econ. 2002, 20, 923–951. [Google Scholar] [CrossRef]
  48. Bornhorst, F.; Ichino, A.; Kirchkamp, O.; Schlag, K.H.; Winter, E. Similarities and differences when building trust: The role of cultures. Exp. Econ. 2010, 13, 260–283. [Google Scholar] [CrossRef]
  49. Oosterbeek, H.; Sloof, R.; van de Kuilen, G. Cultural differences in ultimatum game experiments: Evidence from a meta-analysis. Exp. Econ. 2004, 7, 171–188. [Google Scholar] [CrossRef]
  50. Georgantzis, N.; Lacomba, J.A.; Lagos, F.; Milgram, J. Trust and Reciprocity among Mediterranean Countries; Economics Deprtament Working Paper; Economics Deprtament of Universidad Jaume I: Castellón de la Plana, Spain, 2013. [Google Scholar]
  51. Brandts, J.; Charness, G. Do labour market conditions affect gift exchange? Some experimental evidence. Econ. J. 2004, 114, 684–708. [Google Scholar] [CrossRef] [Green Version]
  52. World Values Survey Association. World Values Survey, Wave 5 2005–2008 Official Aggregate v.20140429; World Values Survey Association: Madrid, Spain, 2014. [Google Scholar]
  53. WJP Rule of Law Index 2015. Washington, D.C.: The World Justice Project. Available online: http://worldjusticeproject.org/rule-of-law-index (accessed on 8 September 2015).
  • 1.In contrast to the homo economicus model assuming that individuals are rational money maximizers, models of “social preferences” assume that individuals do not only care about their own monetary gains, but also about other individuals (see a review by [12]).
  • 2.In the trust game, a player can send a positive amount to another player. In the second stage, the amount is tripled, and the second player can send back a positive amount to the first player.
  • 3.There are also a number of trust game studies comparing behavior between a pair of countries (e.g., [23,24,25]), but as these studies only include one of our samples of countries, we refrain from individually reporting their results.
  • 4.Other studies that compare trust in Japan and the USA include survey evidence (e.g., [28]) and the findings from the one-shot prisoners’ dilemma game by [29]. These studies find that Americans have a higher level of general trust than Japanese, but these findings may stem from differences in beliefs about the nature of social relationships rather than from differences in social preferences.
  • 5.There is evidence that cooperation is sensitive to the particular framing (see [34] and the references therein). On the other hand, Fehr et al. [35] show, in a gift-exchange experiment, that formation in terms of “seller-buyer” instead of “firm-worker” does not matter much.
  • 6.Instructions were adapted from [5]. If subjects gave at least one incorrect answer, the experimenters individually explained to them how the payoffs were determined.
  • 7.Two of the authors located in Germany were present in all sessions conducted in Kiel, Germany. One of these authors traveled to Spain, Israel and Japan, and the other one to the USA.
  • 8.By and large, we do not observe a time trend when including Rounds 2–9. More precisely, we regressed the variables “wage offer” or “effort level” on “round” and on “round square” in each of the treatments. The only significant variable at p 0.05 is in the Spain RM treatment, where “effort level” is negatively affected by the “round.”
  • 9.We count 14 cases in Rounds 2–9 with SPE wage offers of 20 or 21 ECU. In 10 cases, the workers rejected the offers, and in four cases, they chose the minimum effort.
  • 10.In a public good game, the decision whether or not to contribute is implicit in the amount contributed to the public good. By contrast, in our gift-exchange game, the decision whether or not to reject an offer is explicit. Thus, hurdle models are especially suitable for the gift-exchange game.
  • 11.Using a joint-significance chi-squared test, we find that wage coefficients (i.e., (Wage) + (Wage × Country)) are significantly different from zero ( p < 0.01 in all countries).
  • 12.We used a median test to study if the payoff ratio is equal to one. We reject this hypotheses in all treatment at p < 0.01 .
  • 13.Notably, the results suggest that in this game, the workers have more power than firms. This feature deviates from most labor markets with an excess supply of workers.
  • 14.The exception to this is when the worker is offered a wage below 30. In this case, the firm will earn more than the worker for any effort chosen; however, by rejecting the offer, both the firm and worker earn zero. Thus, a worker with a high α might choose to reject, suffering the loss in wages from rejection in order to get a more equal payoff. Because we have very limited data where wages are this low, we do not estimate α, instead focusing on the β parameter.
  • 15.The BIC is a criterion for model selection that makes an adjustment to the log likelihood to penalize models with larger numbers of parameters.
  • 16.In addition, Pereira et al. [40] (see Figures 1 and 2 in Pereira’s work) also indicate a high average effort level in a study conducted in Lisbon, Portugal.
  • 17.Moreover, when comparing the behavior of U.S. American subjects, we observe that the wage offers in our experiment conducted in San Luis Obispo, California (53.01 ECU), are very close to the wage offers from Berkeley, California [41] (54.82 ECU), but both offers are lower than the average from Ohio State University [42] (59.76 ECU). Average effort, on the other hand, is lower in our experiment (0.23) than in Berkeley (0.30).
  • 18.We exclude from the analysis the three treatments where the mean wage and effort levels are not indicated (i.e., the RM treatments by [5,36,40]) or those countries without the respective socio-economic indicators (e.g., the World Value Survey does not provide values for Israel).
  • 19.We have used the NCC measure used by [16], who found that NCC is positively correlated with the punishment of free riders and negatively correlated with anti-social punishment in a public good game experiment.
  • 20.Charness et al. [42] show that the results by [47] may stem from their use of a comprehensive payoff table that is found to reduce wage offers and effort levels.
  • 21.Yet, in a study of gift-exchange markets, Brandts and Charness [51] confirm the efficiency wage hypothesis using student subjects from Barcelona.
  • 22.The author (Minkov) used items from theWorld Value Survey (see below) satisfying three conditions (“thrift as a desirable trait for children”, “national pride” and “importance of service to others”). The first and third conditions seems to be highly relevant to our game, while the second trait measures “self-enhancement”.
  • 23.Herrmann et al. [16] conducted a public good game with punishment in 16 locations, finding that both NCC and RoLaw are negatively and significantly correlated with anti-social punishment (punishment of prosocial cooperators), and NCC is positively correlated with the punishment of free riders.
  • 24.We follow [16,45], scaling the answers from “always justifiable (1)” to “never justifiable (10),” instead of the opposite.