1. Introduction
The first time a computer Othello agent achieved a victory over a top-ranking human player was in 1997, and this was achieved by Logistello (
Buro, 1997b).
Othello is a two-player abstract strategy board game in which players alternate between placing black or white disks on an board. The objective is to have the majority of one’s color disks on the board when the game ends. A disk must be placed on a square so that it sandwiches one or more of the opponent’s disks between the newly placed disk and another disk of player’s color, in a horizontal, vertical, or diagonal line. Any opponent’s disks that become sandwiched as a result of this move are then flipped to become the placing player’s color. When a player cannot make a valid move, the turn is passed to the opponent. The game ends when neither player can make a move, typically when the board is full.
Logistello, the strongest Othello agent, was developed to employ the n-tuple network as an evaluation function (
Buro, 2003). The n-tuple network represents points of interest on the Othello board as tuples. Logistello uses an N-Tuple network shape that was hand-crafted by an expert. The effectiveness of the N-Tuple Network is highly dependent on its shape (
Krawiec & Szubert, 2011). Furthermore, in Edax, the network maintains a constant shape throughout the game. However, the points of interest on an Othello board change with the progress of the game. For example, the corner and edge areas are important in Othello, because corner disks are never flipped and edge disks are less likely to be flipped. However, stones are rarely placed in these areas early in the game. Therefore, it is not until the middle of the game that the corner areas represent points of interest.
To satisfy this dynamic property, we optimized the shape of the n-tuple network to maximize performance for certain numbers of moves. We expect to improve the network’s performance by appropriately using the optimal shapes depending on the game’s progress.
2. N-Tuple Network
The n-tuple network was proposed for character recognition by Bledsoe et al (
Bledsoe & Browning, 1959). Subsequently, the n-tuple network was applied to classification (
Rohwer & Morciniec, 1996) and regression (
Kolcz & Allinson, 1996) tasks. In Othello, the n-tuple network was first used by Buro in Logistello (
Buro, 1997a), and then popularized by Lucas (
Lucas, 2008). It has been used recently in games such as 2048 and Connect Four (
Konen & Bagheri, 2020;
Thill et al., 2012).
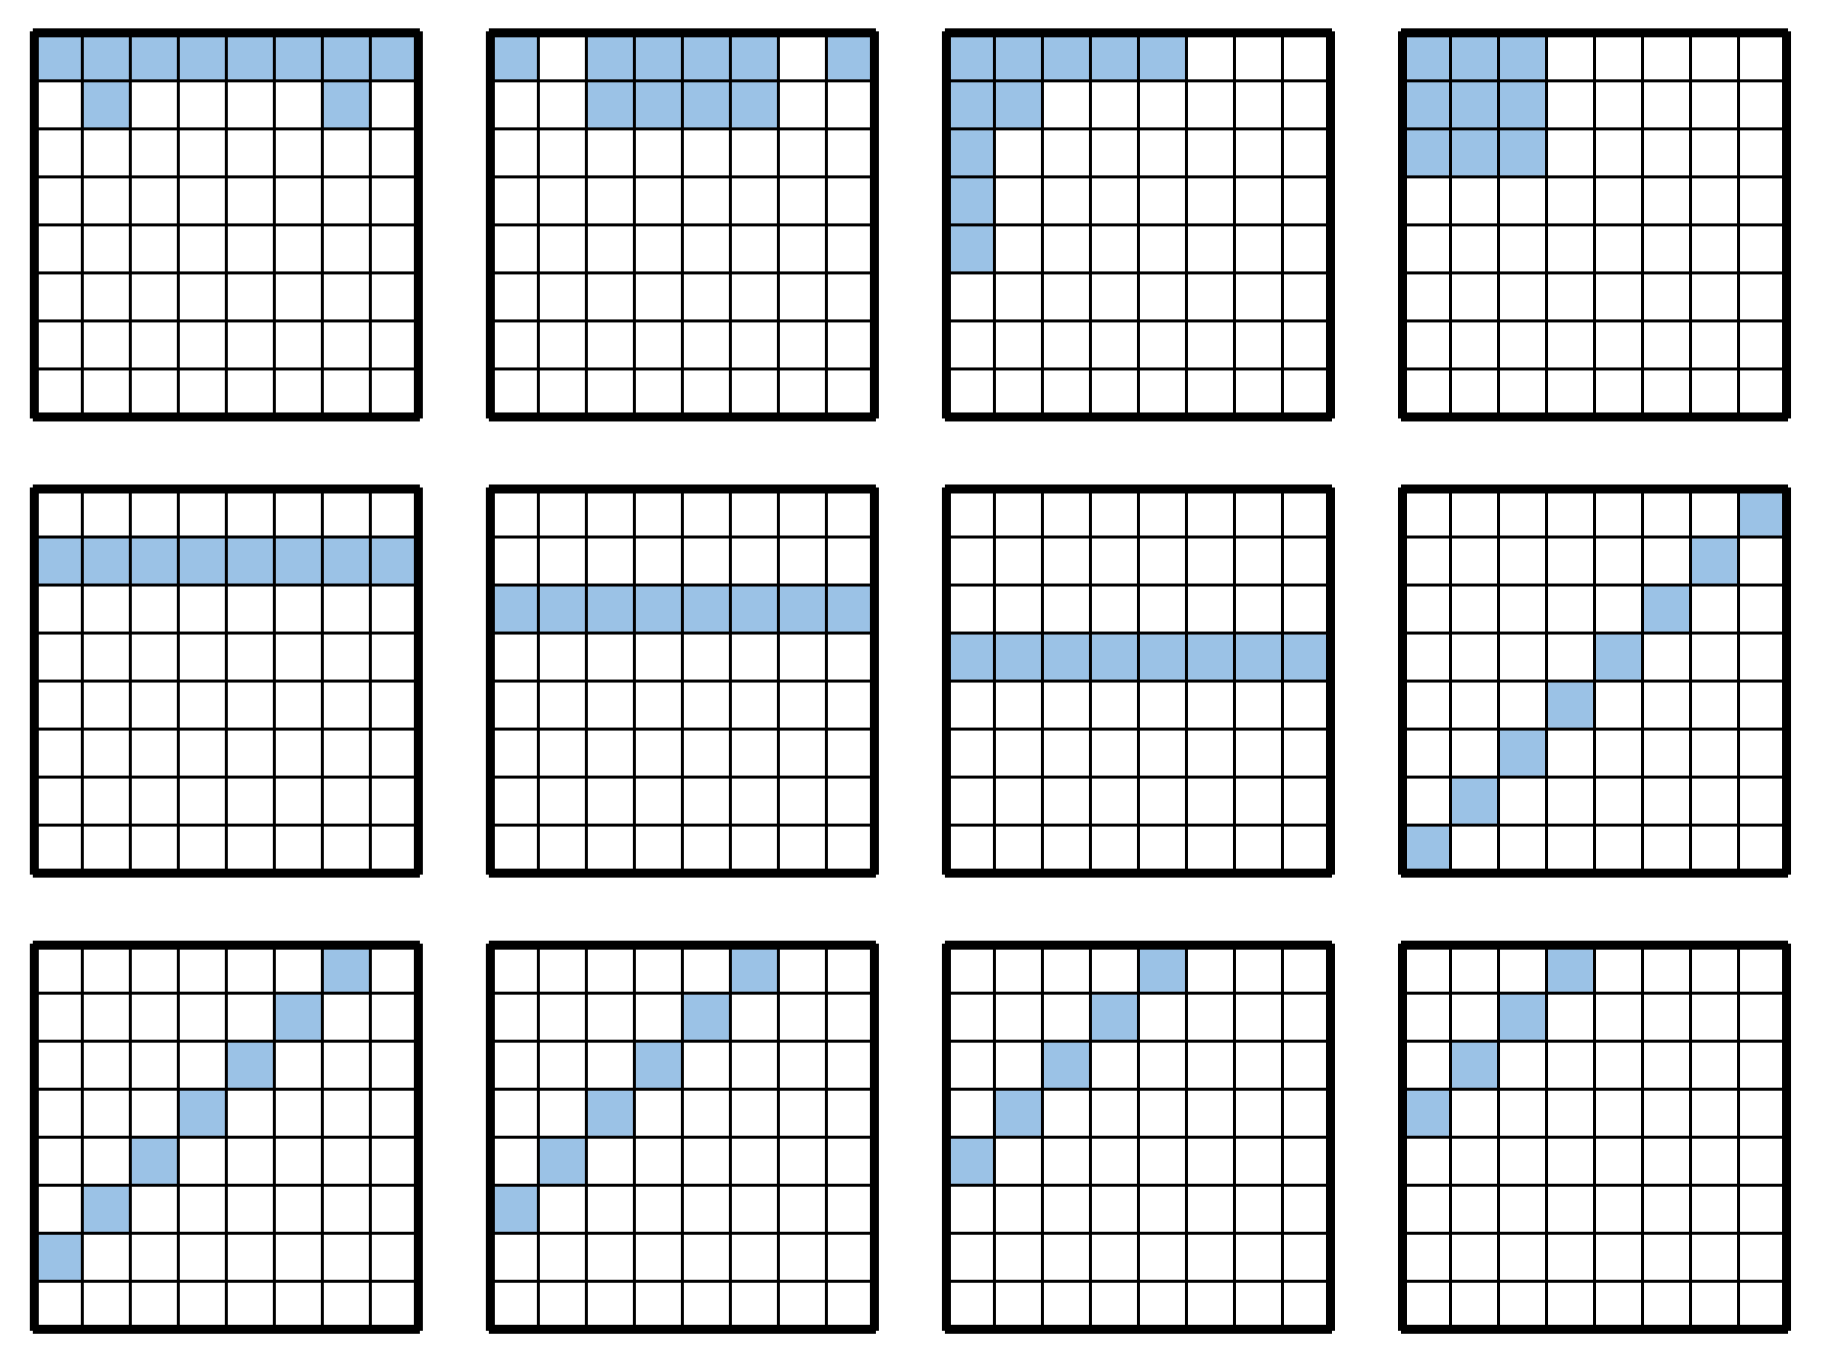
An n-tuple network comprises m tuples, each of which represents a point of interest on the board. The overall network is operated by sampling the input board at each tuple, where the i-th tuple consists of a subregion of n squares on board and weight . Throughout this paper, the term “tuple shape” refers to this subregion , and “network shape” refers to its set . The weights have a one-to-one correspondence with the possible states of the region . Because there are three possible states of a square in Othello—black stone, white stone, or empty—the number of possible states of a region is ; thus, has elements.
Each tuple outputs a weight corresponding to the input board
, and the sum of the outputs of each tuple is the total network output (Equation (
1)).
where
denotes the
k-th element of
, and
denotes the state of the
i-th square of
. The value of
is 0, 1, or 2 if the square has no stones, a white stone, or a black stone, respectively.
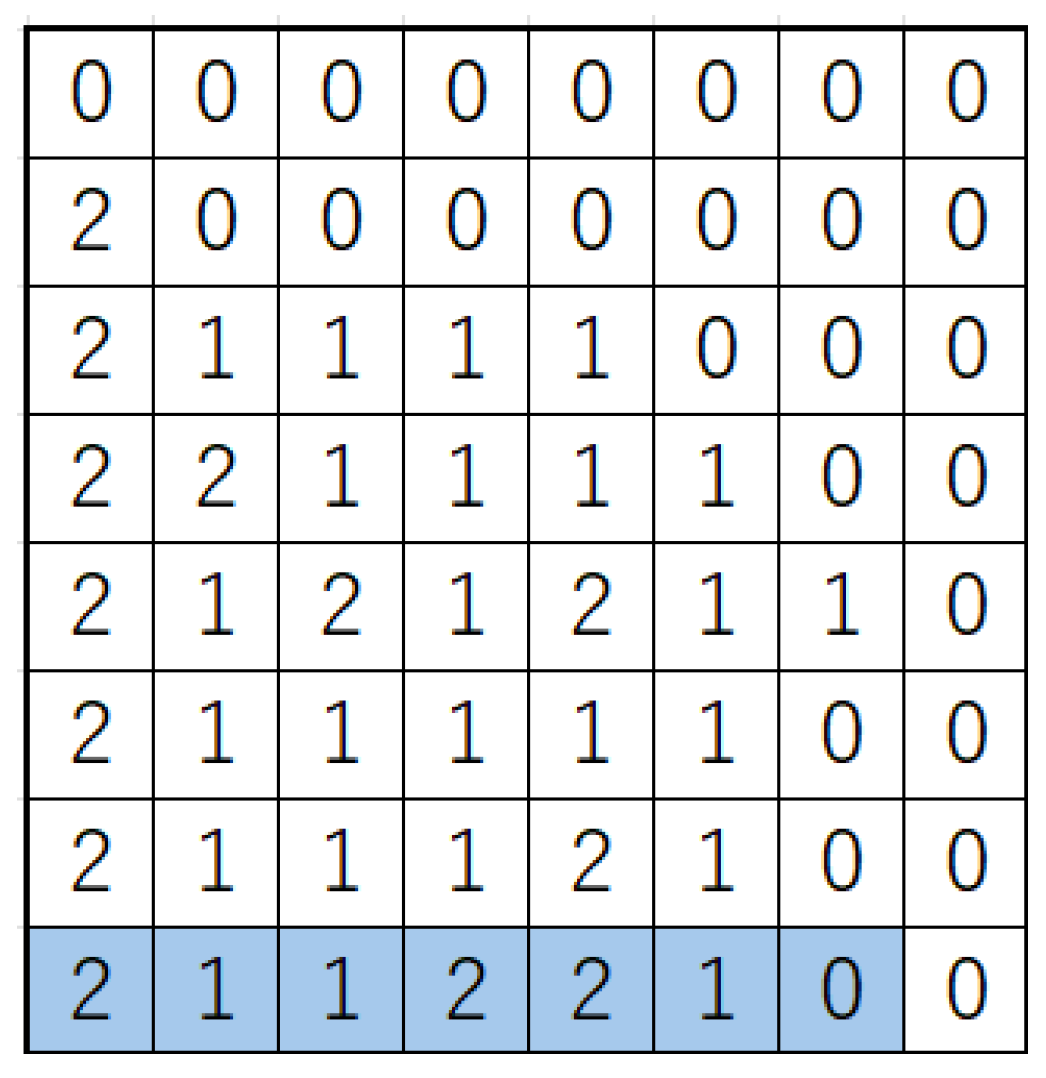
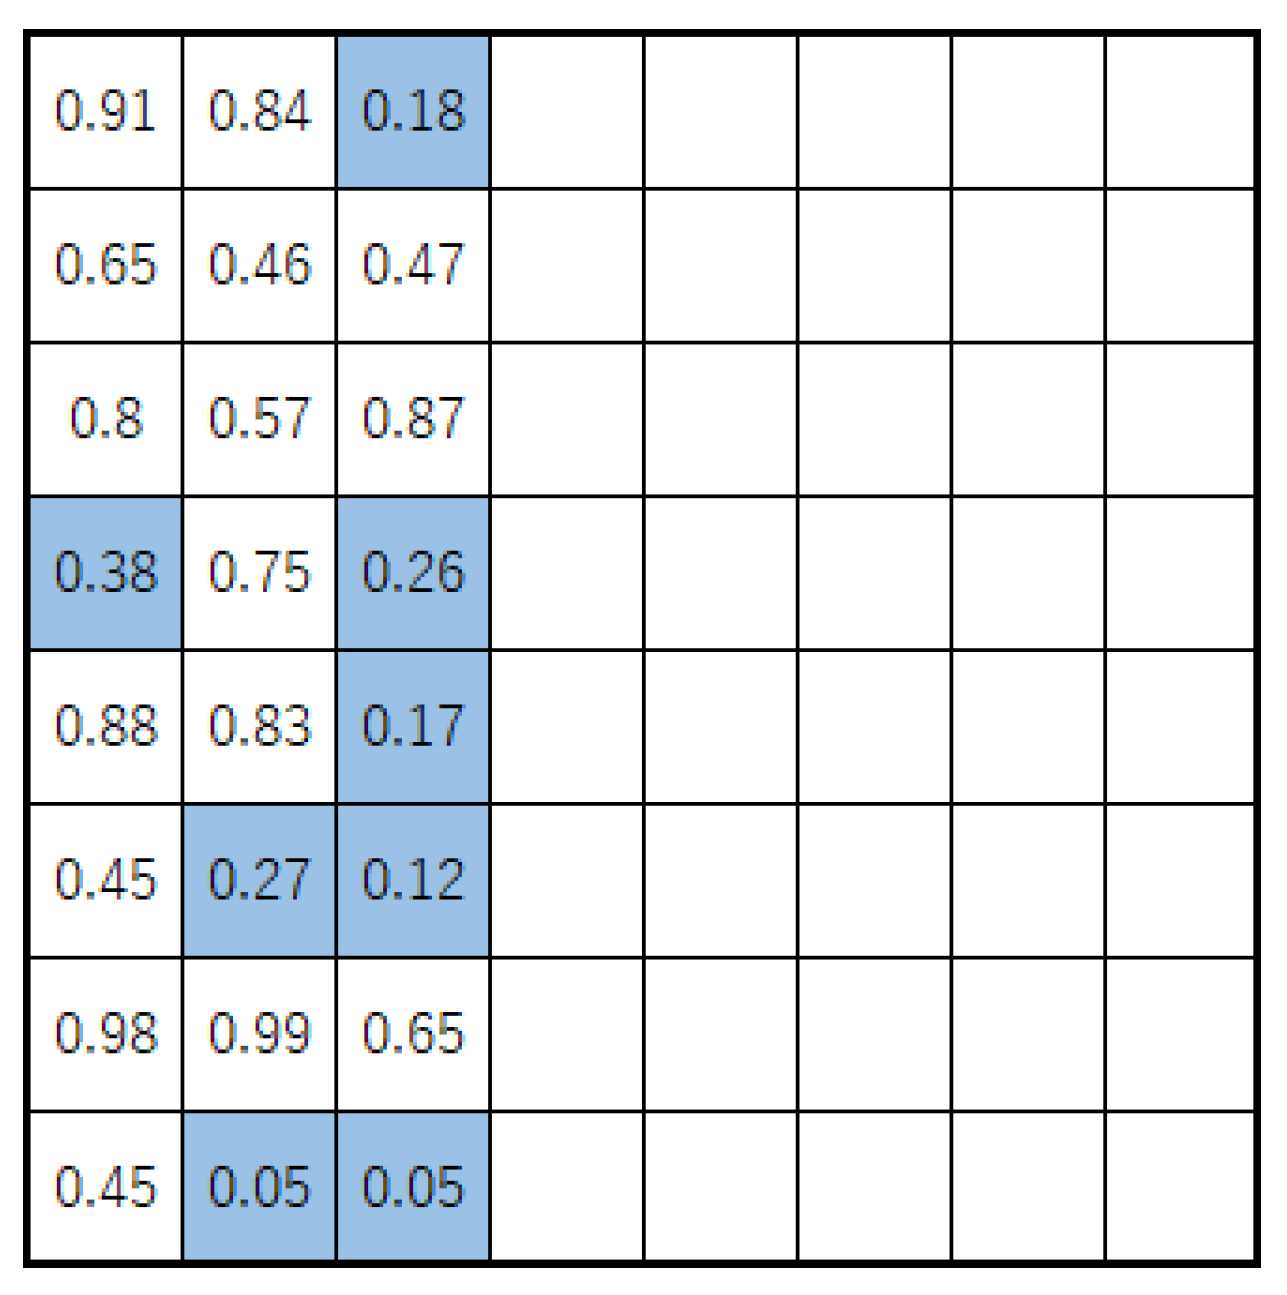
The following is an example of the computation of Equation (
1) on the board
represented in
Figure 1. For simplicity, the network consists of only one tuple, whose shape is
, highlighted in blue in
Figure 1. In this case,
are
, and the ternary notation for
is 2112210, which is the concatenation of these numbers. Therefore,
.
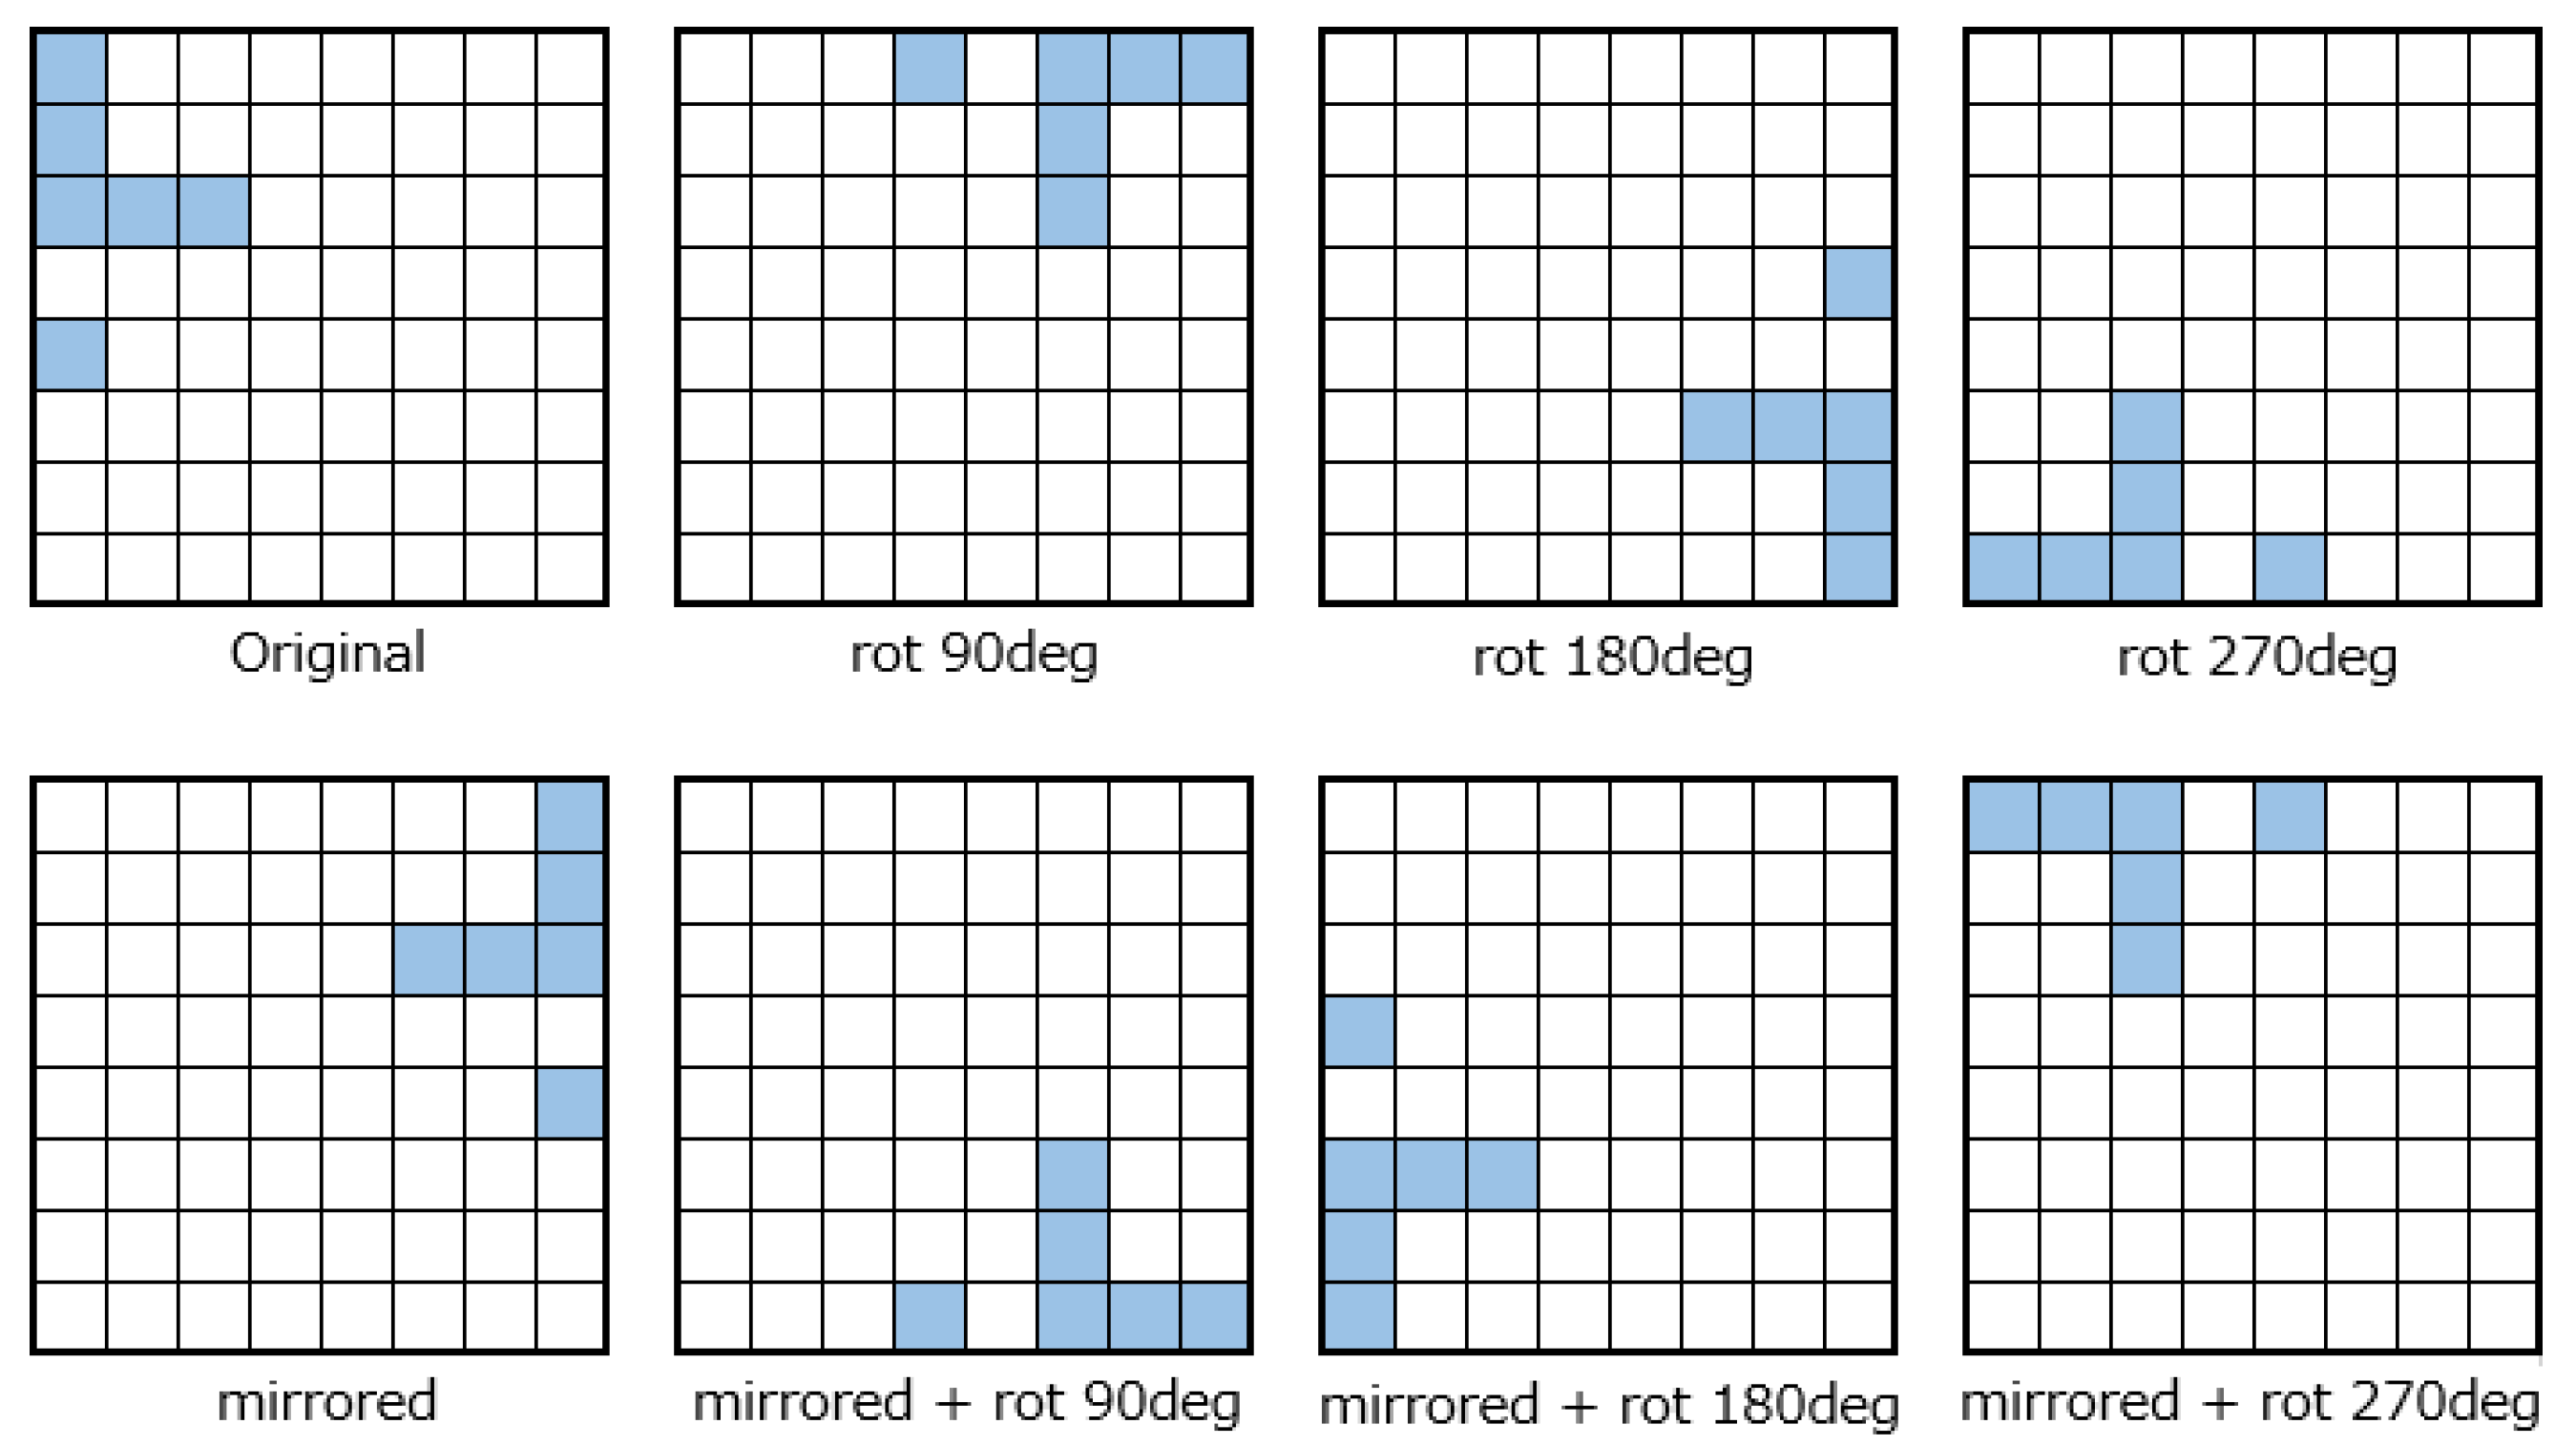
When symmetric sampling is used, the network output is the sum of the eight applications of (Equation (
1)) for the valid reflections and rotations of the board (Equation (
2)).
where
is a function that rotates the board
by
degrees, and
is a function that flips the board
horizontally. These operations can be used to generate a total of eight surfaces.
Figure 2 illustrates an example of this operation.
Throughout this paper, the term “network” denotes an n-tuple network that incorporates symmetric sampling.
The network outputs an estimate of the final game result—i.e., the stone difference—for the input board. Therefore, the search for weights is a regression problem that can be solved using the gradient descent method. In this study, the squared error is used as the loss function.
3. Related Research
Wojciech et al. (
Jaśkowski, 2014) proposed a method for analyzing the shapes and weights of n-tuple networks using an evolutionary strategy. They concluded that a network with 32 tuples of size 2 performed best.
However, the study by Wojciech et al. did not account for large network shapes, such as that used in Edax, nor did they employ different networks with respect to the game’s progress. The objective of this study was to construct a network that outperforms Edax. To achieve this, we optimized the network’s shape to a size similar to that of Edax for each progression of the game, and constructed a network using the results of this search.
4. Methods
The proposed method uses a genetic algorithm (GA). A GA is an optimization method inspired by the theory of evolution, which posits that the fittest individuals are more likely to survive and reproduce. In a GA, multiple individuals, each represented by a chromosome-like data structure, are generated. These individuals are evaluated based on a fitness function that quantifies how well a particular solution solves the given problem. The algorithm proceeds by selecting individuals with higher fitness values, and then applying genetic operators such as crossover and mutation to generate new offspring. This process is repeated iteratively until a satisfactory solution is found.
The proposed method uses a distributed GA (DGA) (
Belding, 1995) to determine the optimal network shape for each moving board. A DGA is an algorithm that divides the population into multiple islands and performs the GA on each island independently. The proposed method uses
N islands, where the
kth island is optimized at the
th move. Unlike in the conventional DGA, each island is optimized using BRKGA (
Gonçalves & Resende, 2011). Throughout the search, the network size is assumed to be constant.
4.1. Gene and Decoder
In BRKGA, a gene is represented by a vector of real numbers at intervals of . BRKGA requires a deterministic algorithm called a decoder that transforms input genes into solutions for corresponding problems.
In the proposed method, the shape of a tuple is decoded from genes of the same size as the search region. Each square of the search region is assigned an element of the gene via one-to-one correspondence and only
elements are selected from the square with the smallest value to construct
. In this study, the search area for tuples was limited to 24 squares in three rows from the edge of the board.
Figure 4 illustrates an example of this operation. Because the operation was performed for a number of tuples, each individual has a real vector of 24 m elements as its gene.
4.2. Fitness
The fitness quantifies the degree of optimality of a solution in a GA. In this study, fitness is defined as the prediction accuracy of the Logistello book skeleton dataset.
The dataset is a record of matches generated by Logistello’s self-play, representing approximately 120,000 games. In this study, 80% of the dataset was used to measure the level of fitness, with the remaining 20% used as test data. When measuring the level of fitness in a certain generation, we randomly sampled 80% of the data for fitness measurements as training data, with the remaining 20% reserved as validation data. Subsequently, each individual on the kth island was trained with the training data of each game corresponding to the th move after the weights were initialized to zero. The loss was then measured using validation data corresponding to move for each game. The loss was defined as the fitness of each individual.
4.3. Measure of Performance
To evaluate the proposed method’s generalizability at the tth move, we measured its performance against the test data. For a given network, upon initializing all weights to zero, we trained weights using the data of the tth move of each game in the fitness test data. Subsequently, we measured the loss using the data of the tth move of each game in the test data, referred to as the test score at move t.
4.4. Migration
Migration is an operation that takes place at fixed generation intervals in the DGA. During migration, individual information is exchanged between islands. In this study, migration was performed following the generation–transition operation.
Suppose that islands are arranged in an ascending or descending order of . When an island migrates, it replaces copies of individuals from neighboring islands in a sequence with the same number of individuals from its own island. In this case, individuals from neighboring islands are selected in order of fitness, with the individuals to be replaced randomly selected from the mutant population in BRKGA. The population size on each island does not change before or after this operation. The number of individuals subjected to this operation is denoted by a parameter known as the migration size.
Because each edge island has only one neighbor, the number of individuals selected for migration from this island is equivalent to the migration size. In contrast, because each non-edge island corresponds to two neighbors, the number of individuals from each of those neighbors is half the migration size.
5. Experiments
Three experiments were conducted in this study. In the first experiment, we optimized the network shape for each representative move using the proposed method. To verify the effectiveness of the optimized network shape, we evaluated the prediction precision in the dataset in the second experiment, and the performance in the game in the third experiment.
5.1. Main Experiment
This experiment was conducted to determine the shape of the n-tuple network using the proposed method. The size of the network is equivalent to that used in Edax. The number of islands was set to eight, and the number of moves to be optimized on each island alternated according to
for
, with each island referred to as the island at
moves.The settings for DGA and BRKGA are listed in
Table 1, where the BRKGA parameters are denoted as (BRKGA).
The following experimental results were obtained:
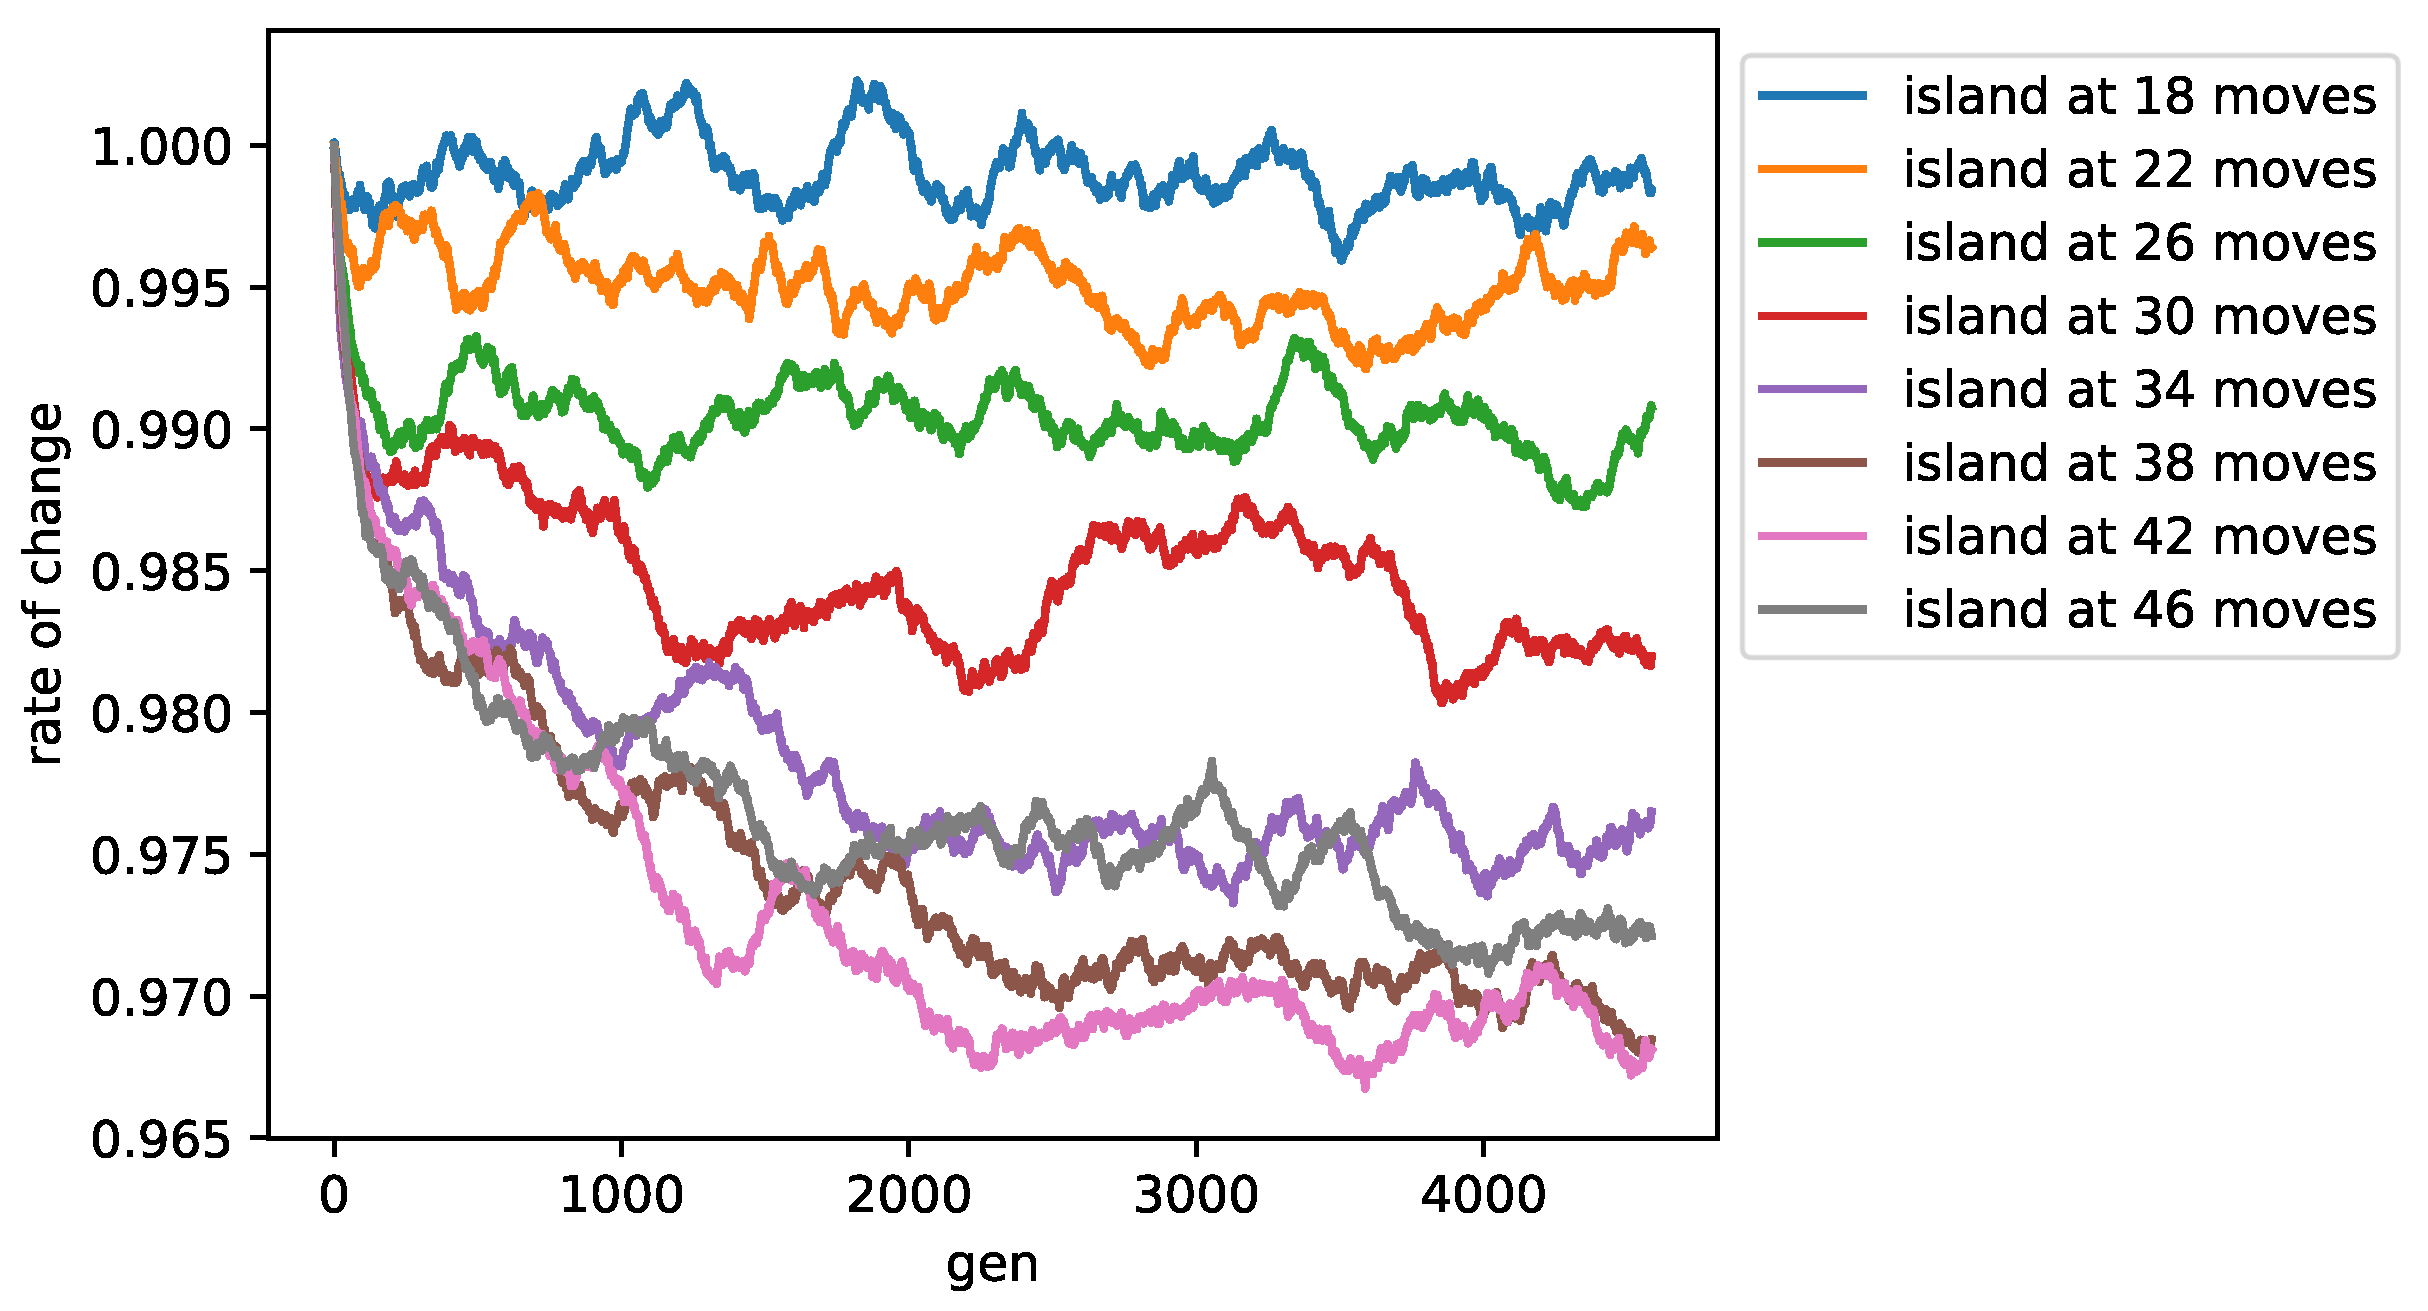
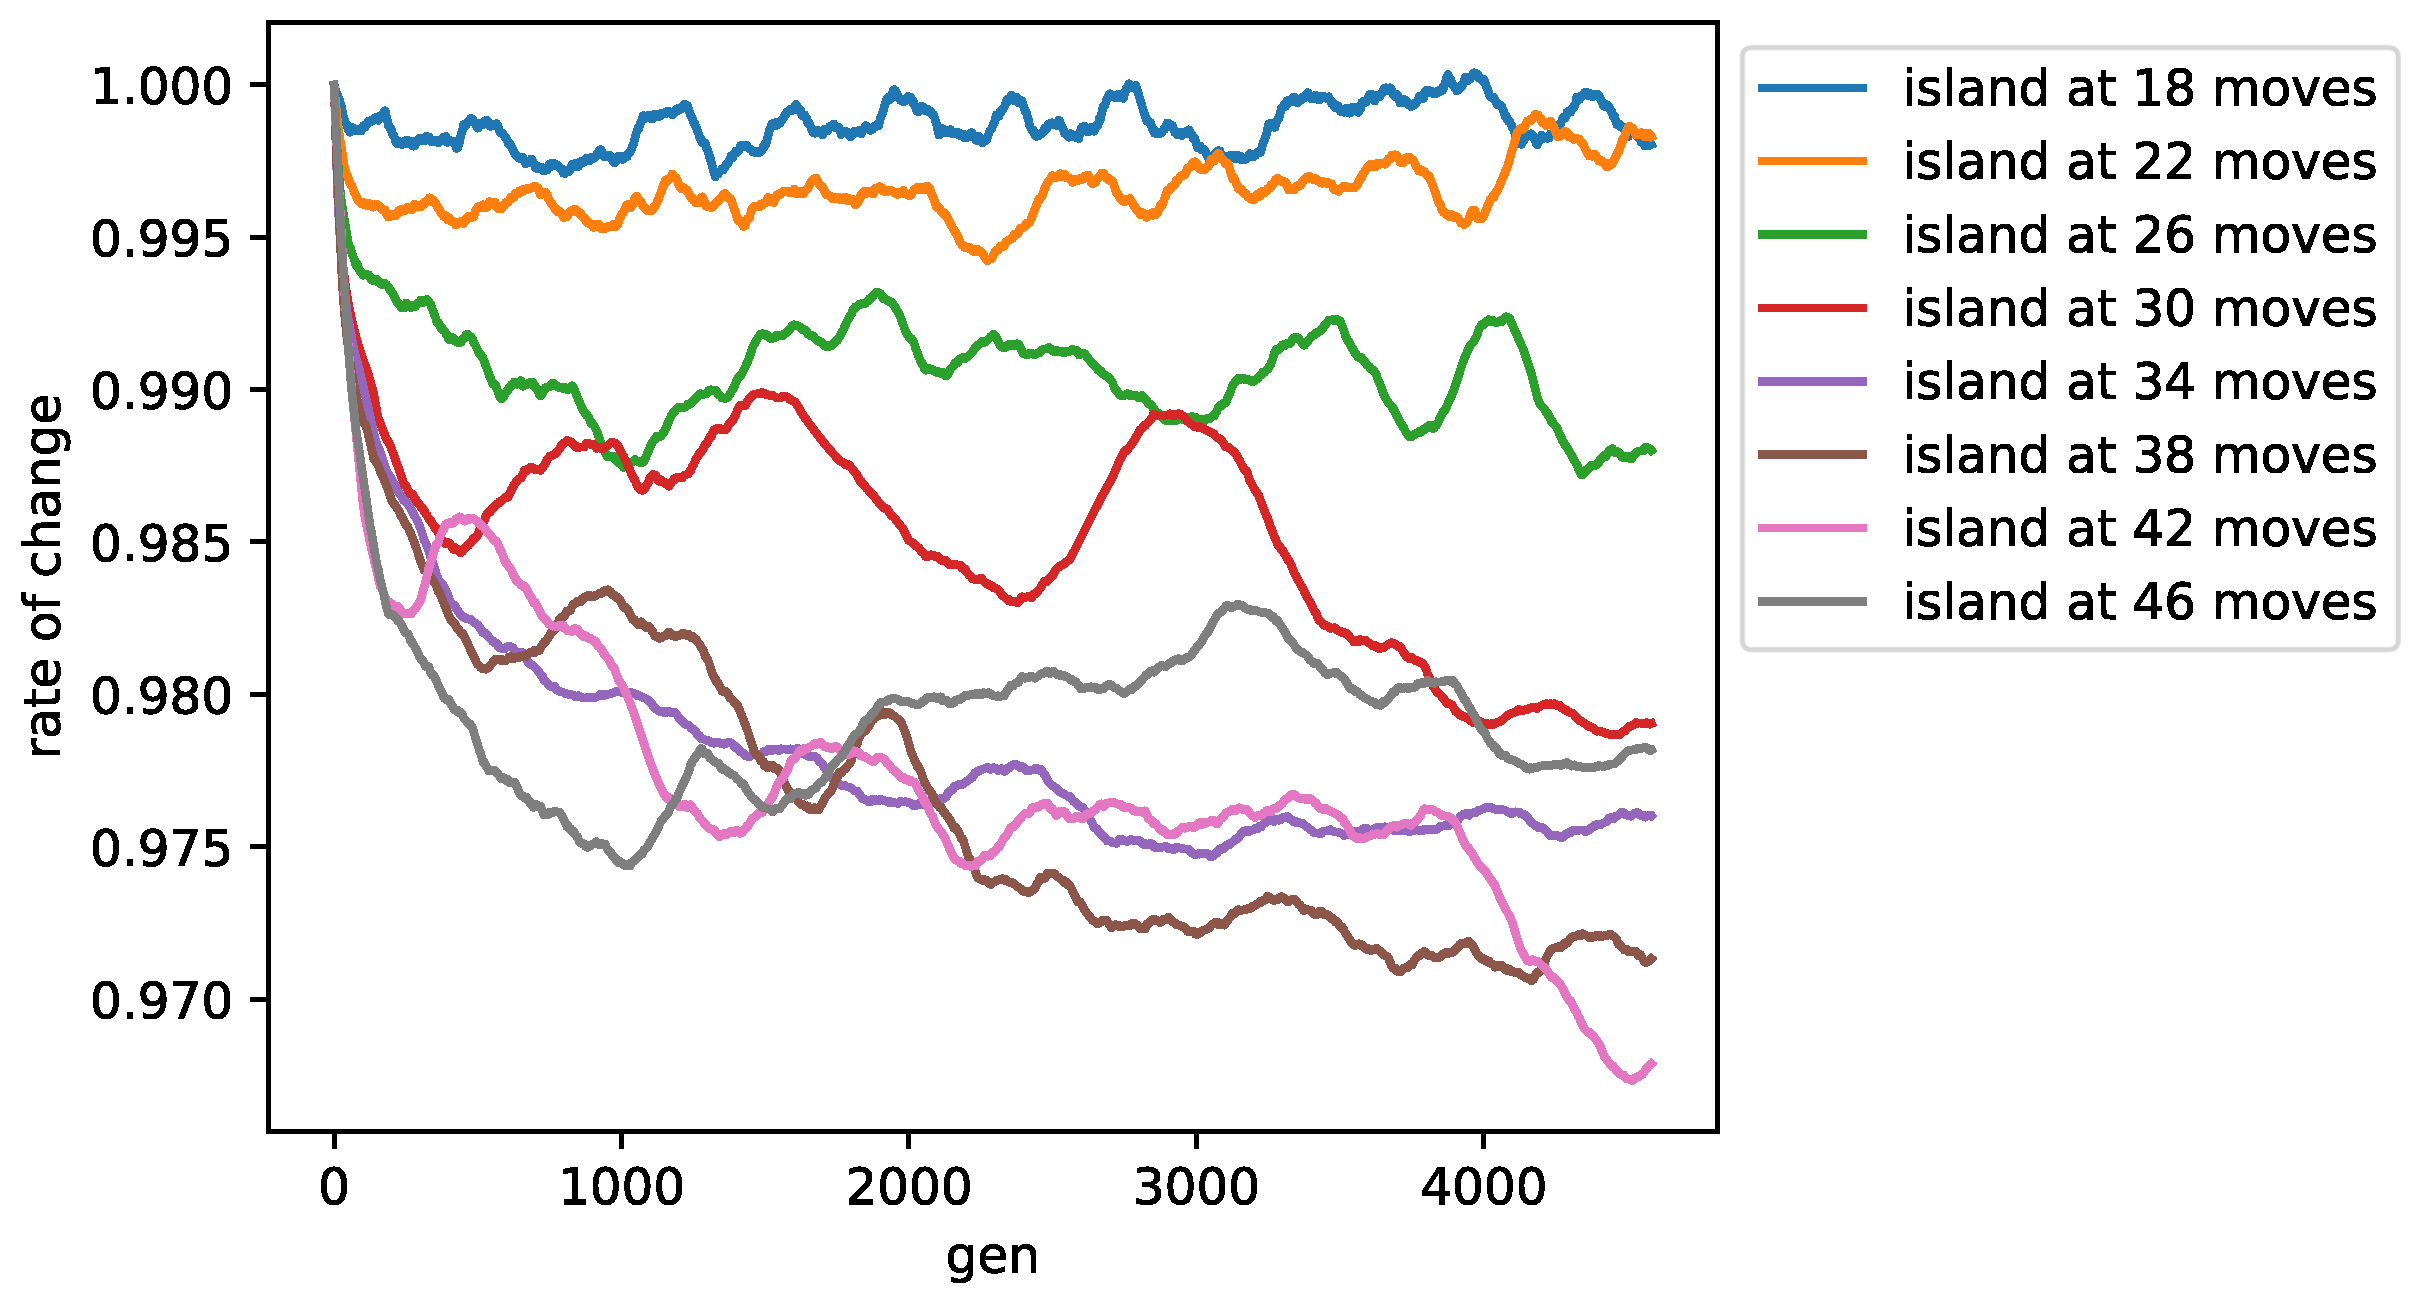
Figure 5 and
Figure 6 depict the change rates of the fitness and test scores for the best individual on each island in each generation (moving average at an interval of 250). The rate of change was based on the average of 0–50 generations for each island. For
islands, the test score was measured at the
th move.
For islands with 18 and 22 moves, the rate of change in both the fitness and test scores remained close to 1. In contrast, test scores for islands at 34–46 moves continued to decrease until approximately 2000 generations; the test score for the island at 42 moves continued to decrease even after 4000 generations.
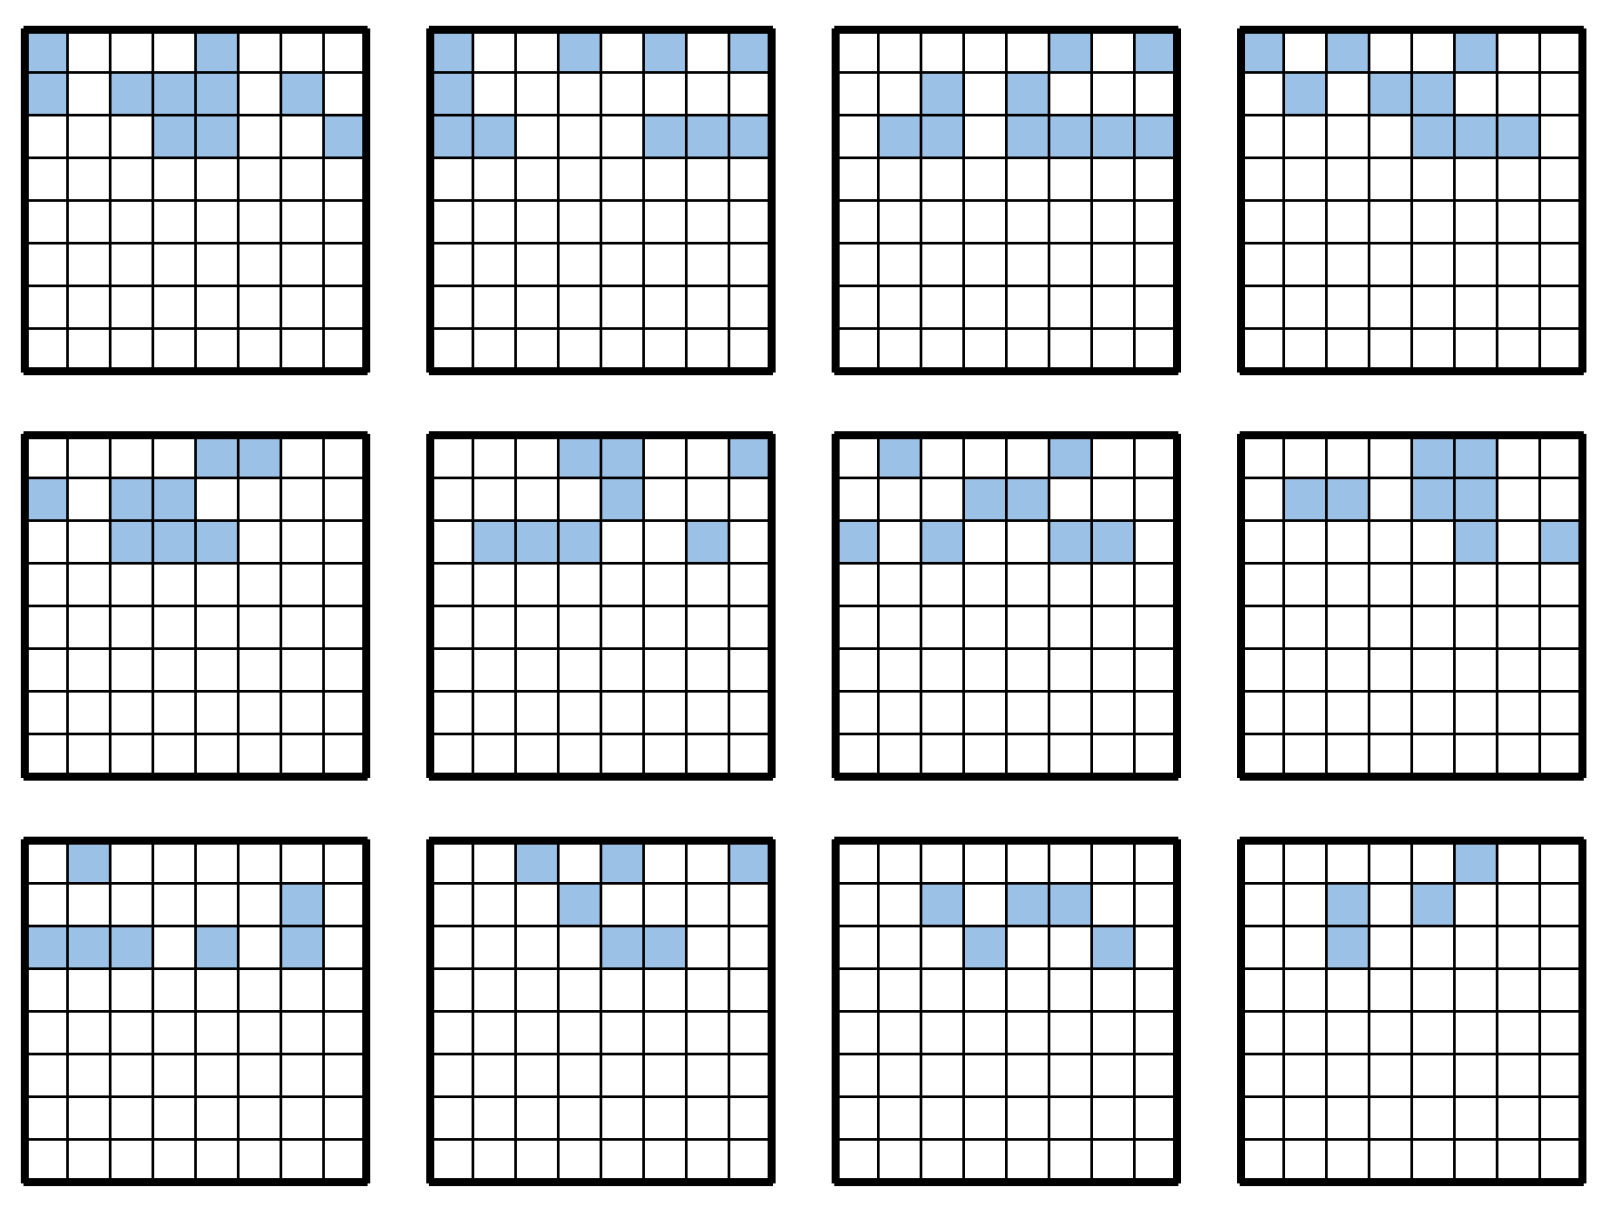
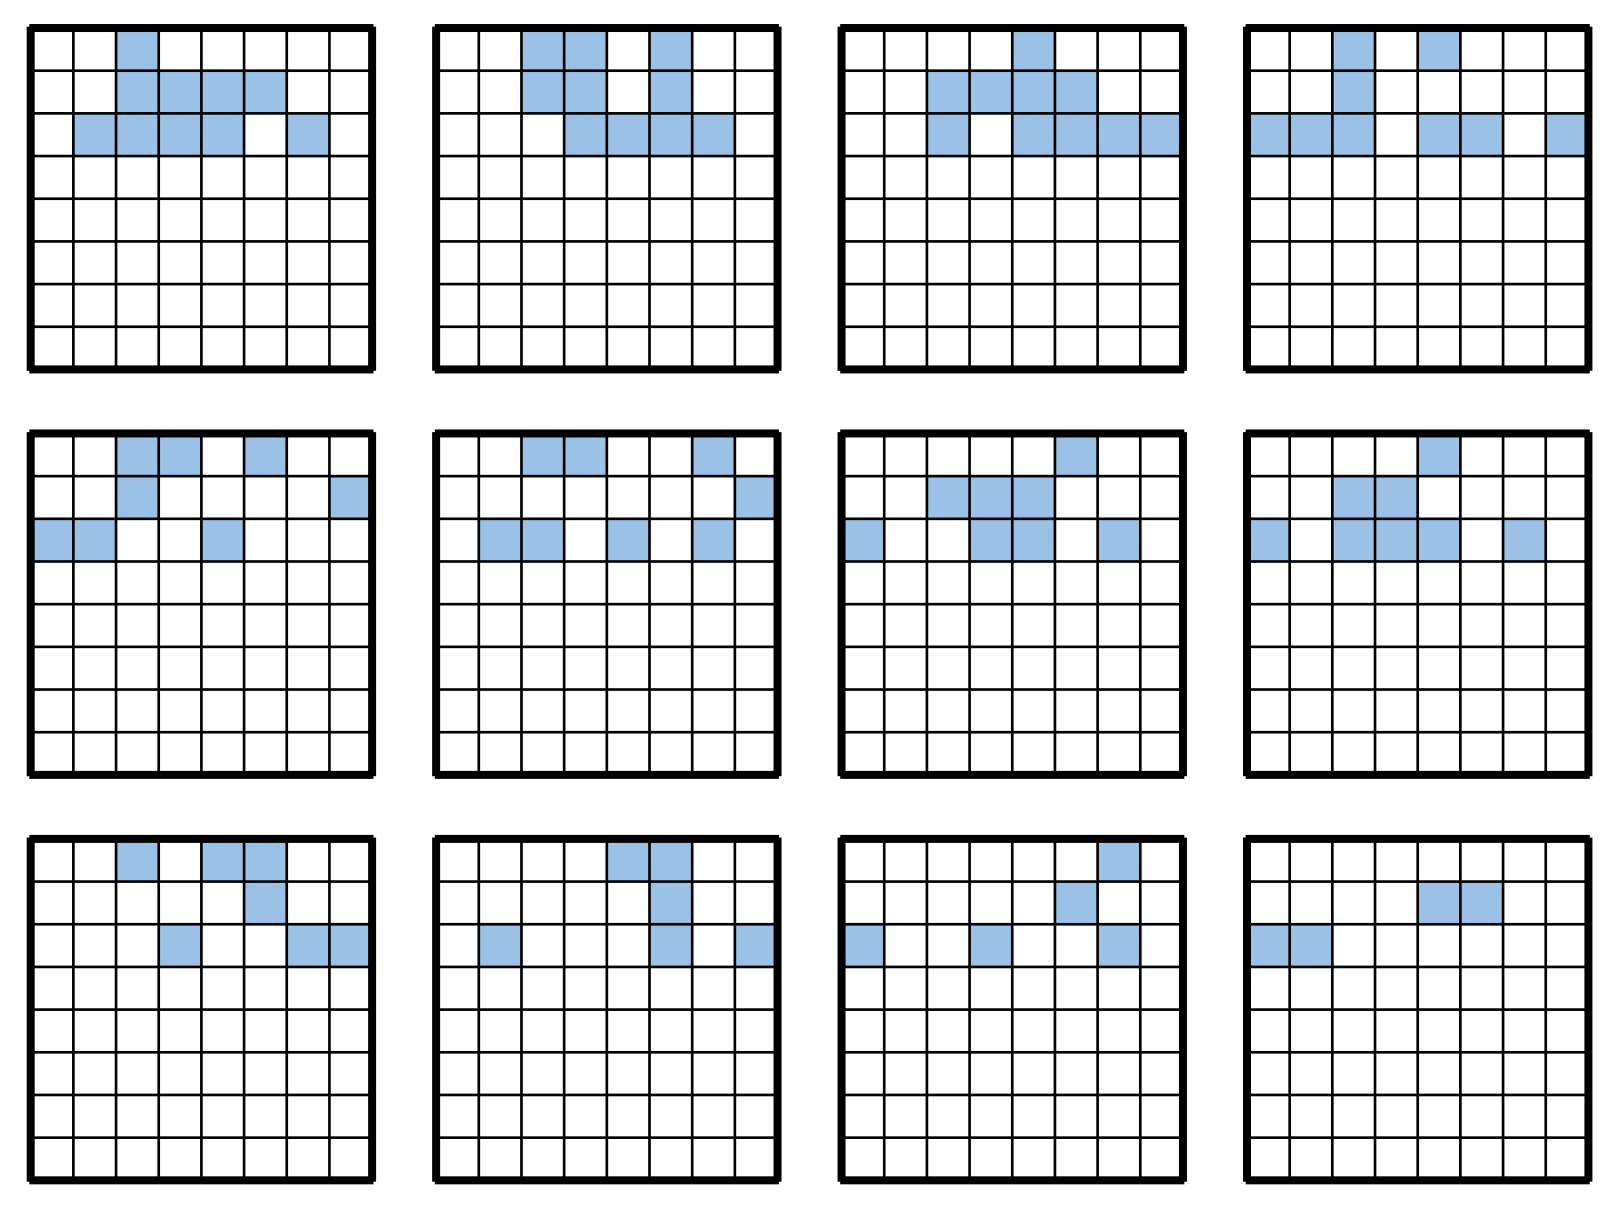
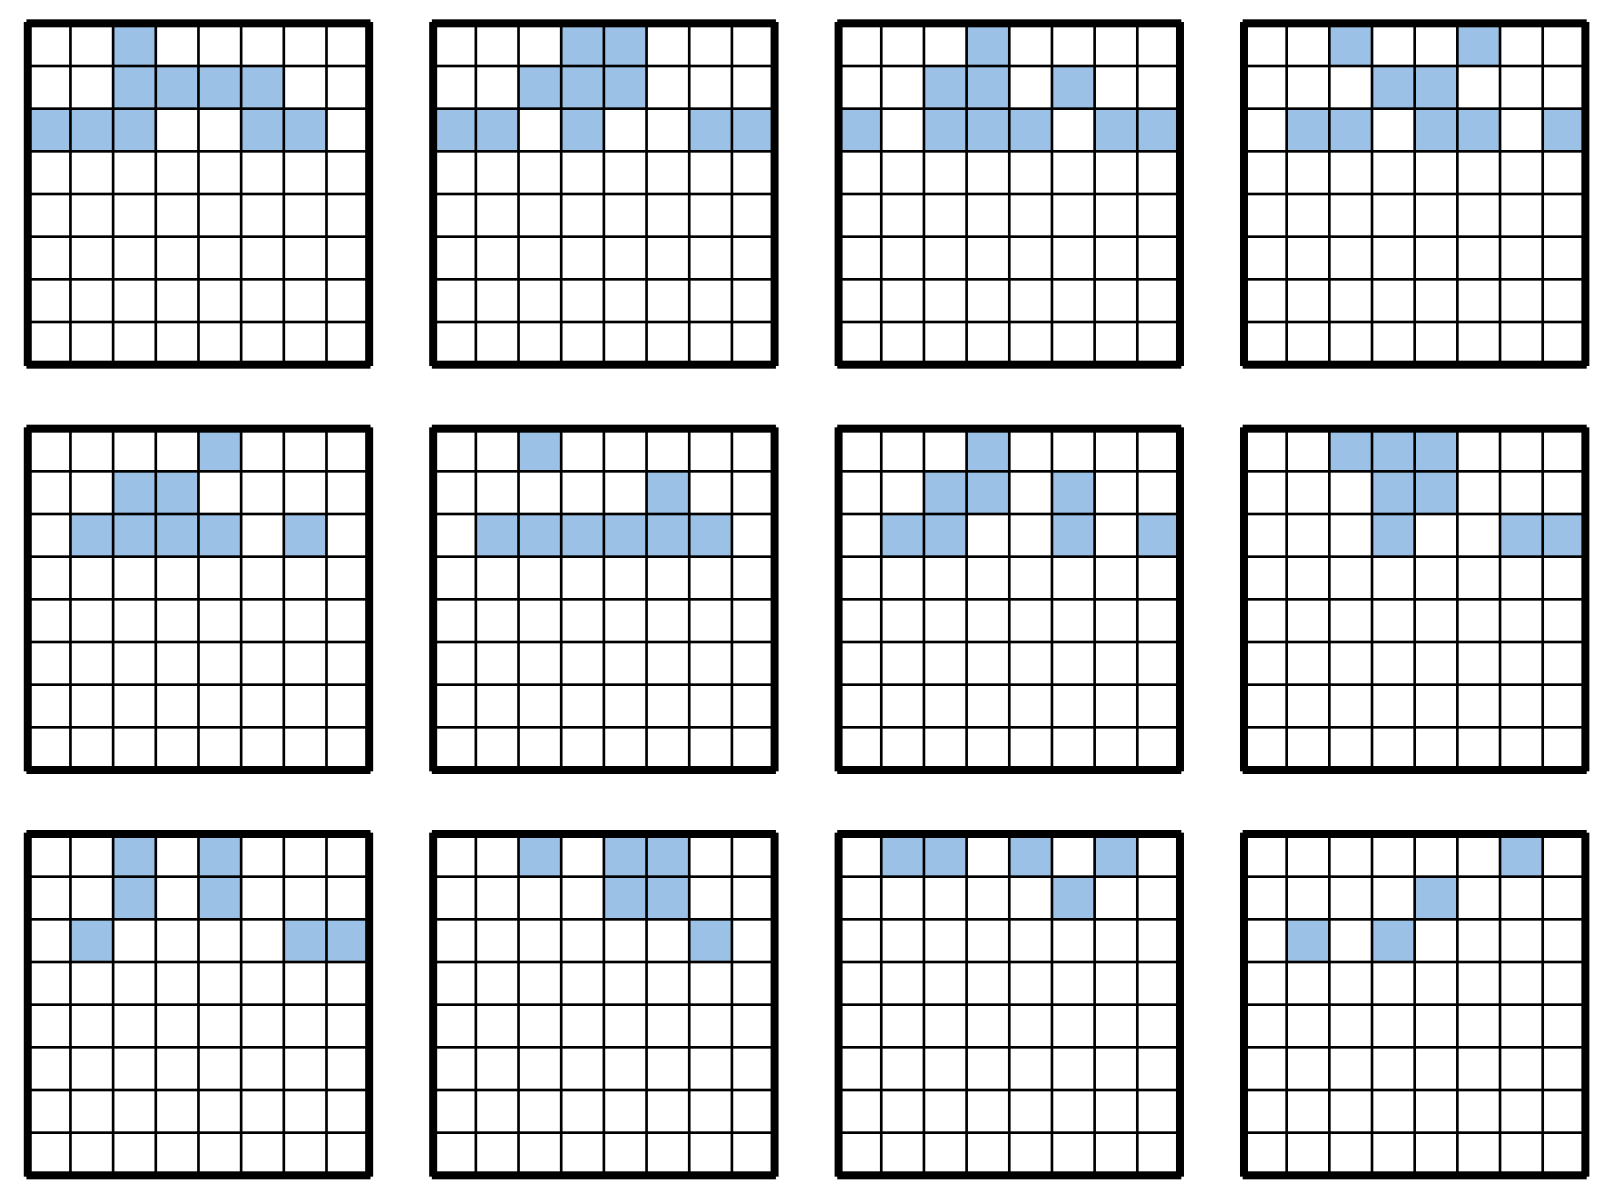
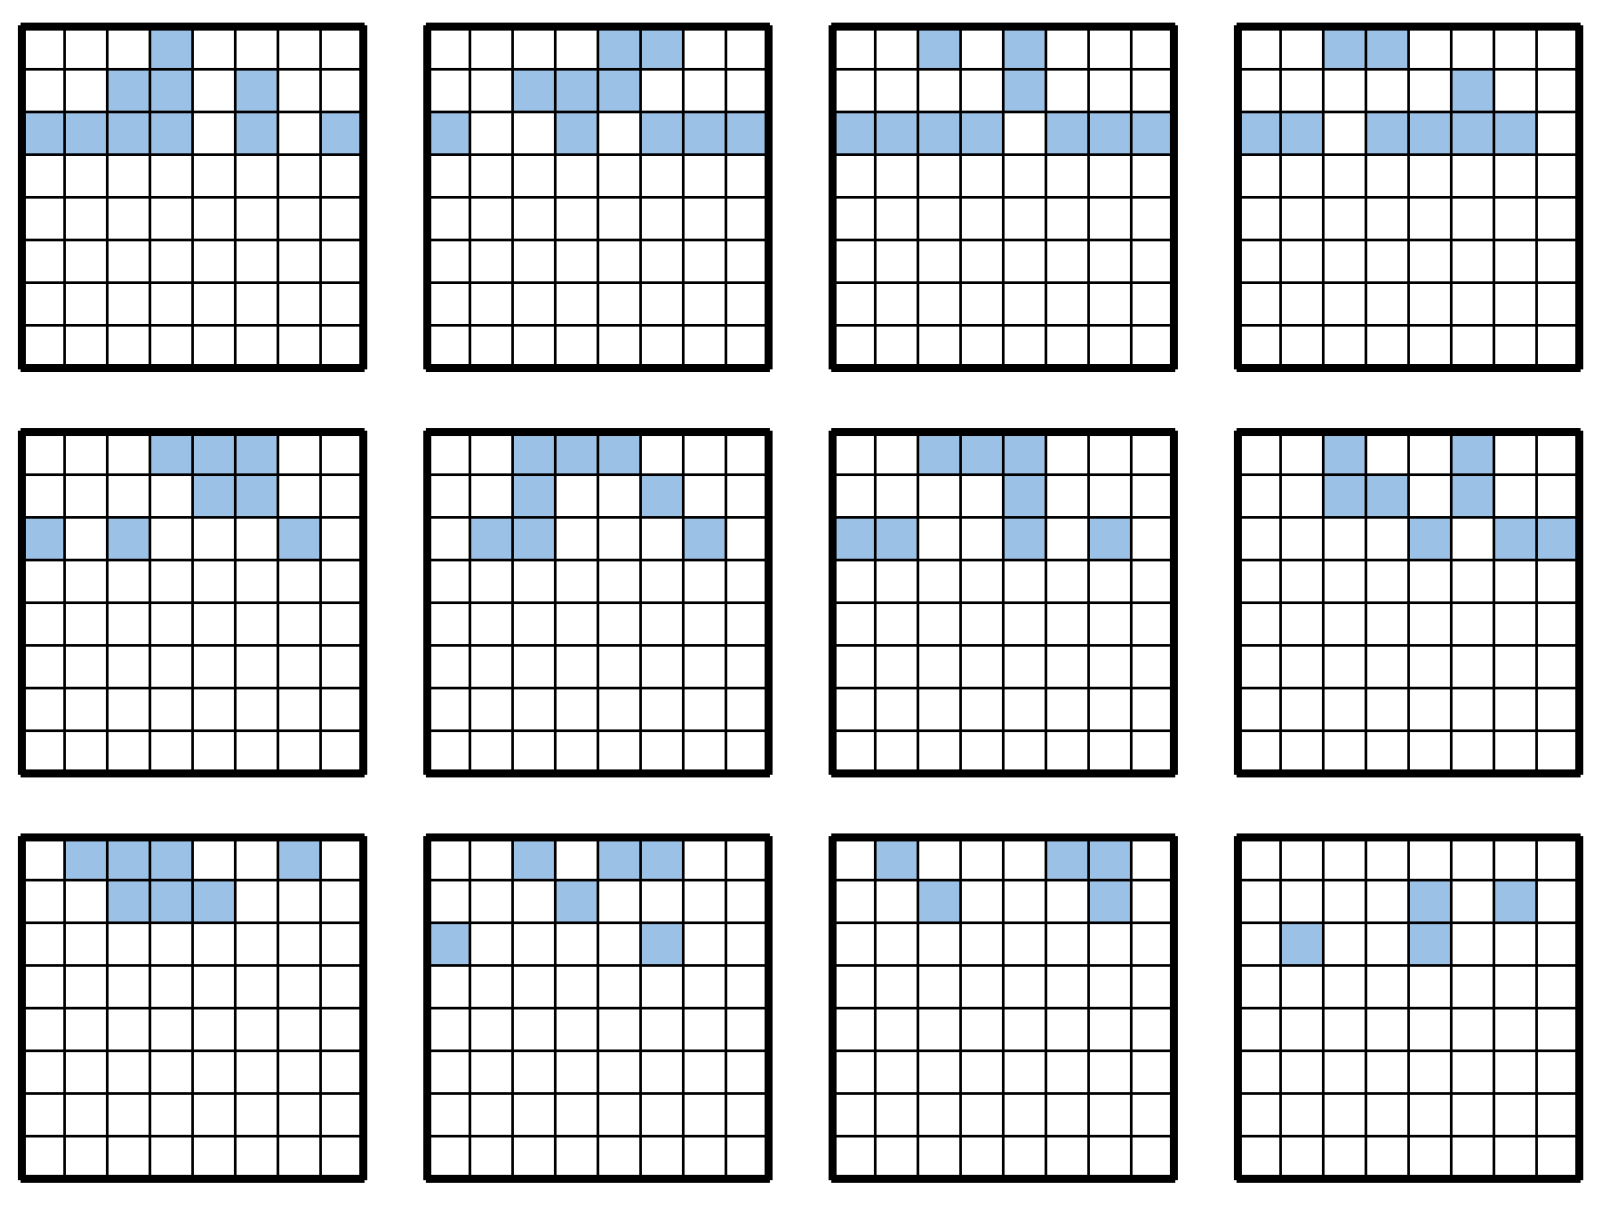
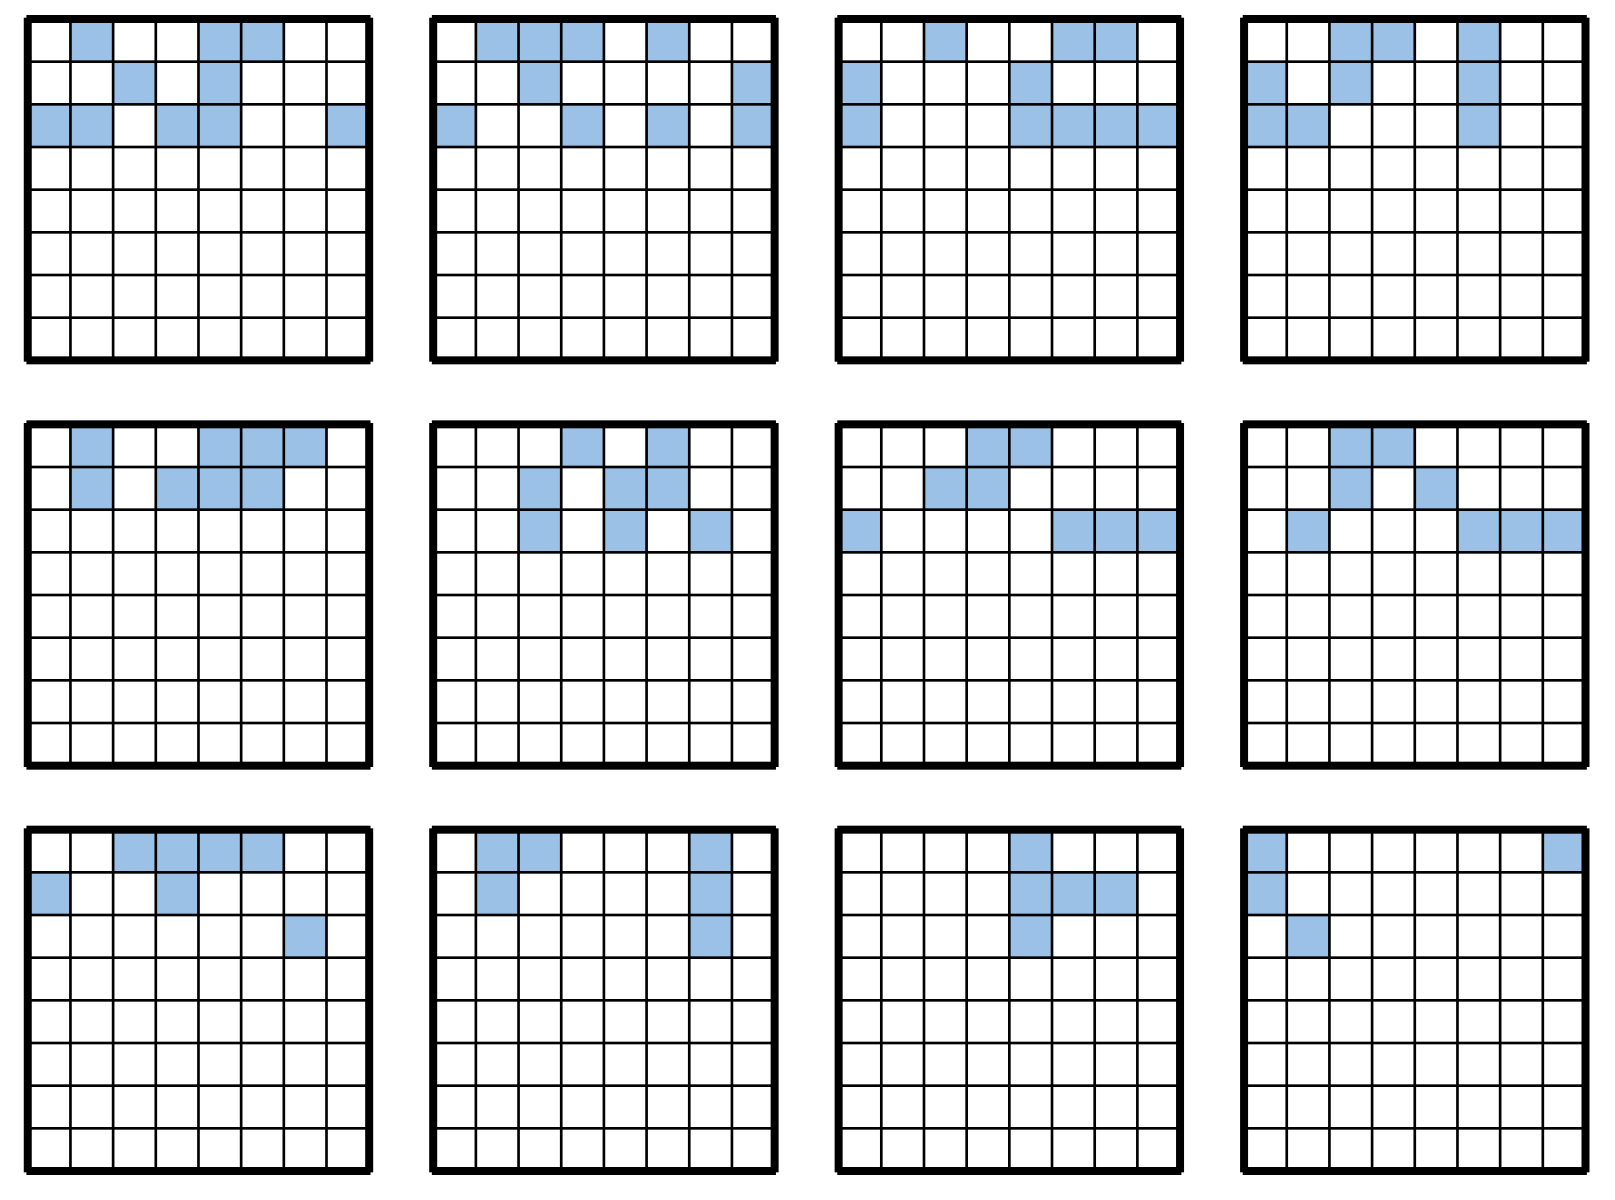
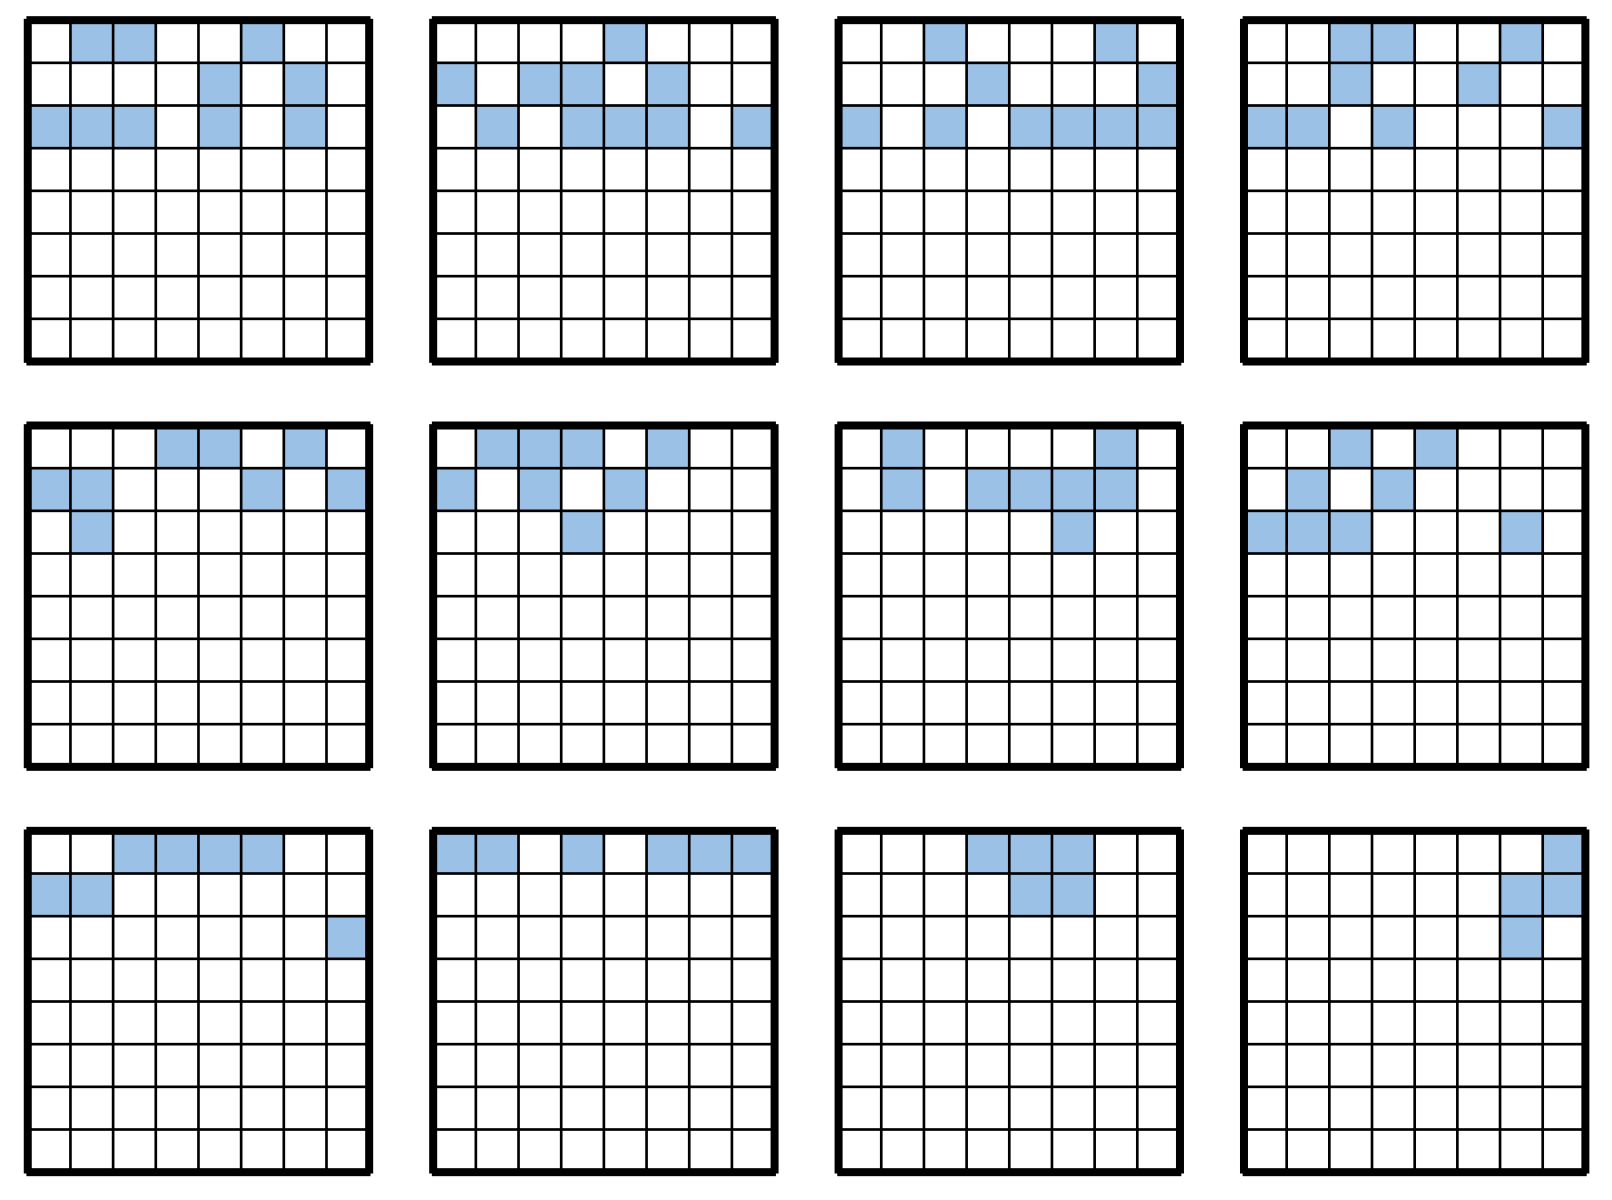
The search results for each island are shown in
Figure A1–
Figure A8 in the
Appendix A, showing the best-fit individual in the last generation of each island.
5.2. Evaluation of Test Scores
This experiment was conducted to evaluate the results of
Section 5.1. We measured the test scores at each
for the search results corresponding to each island in
Section 5.1 using the proposed network and Edax networks (
Table 2).
For 30–46 moves, the network that was optimized for that number of moves exhibited the best performance. However, for 18–26 moves, the networks optimized at 30 or 34 moves exhibited the best performance.
5.3. Evaluation of Match Performance
Whereas, in
Section 5.2, we evaluated the performance of agents on the dataset, in this experiment, we evaluated the performance of the agents in a game. First, two agents were prepared, denoted Agents 1 and 2.
Agent 1 used the network shape obtained from
Section 5.1, whereas Agent 2 used the same network shape as Edax (
Table 3). In this table, “island at
n move” refers to the results of the search for that island in
Section 5.1. Both agents used independent weights for each move.
After initializing the weights of the two agents to zero, the following procedure was carried out:
A total of 64 games were played and the winning percentage was measured.
The weights of both agents–networks were trained using data from the games in (1).
If the target number of games was not reached, (1) was repeated.
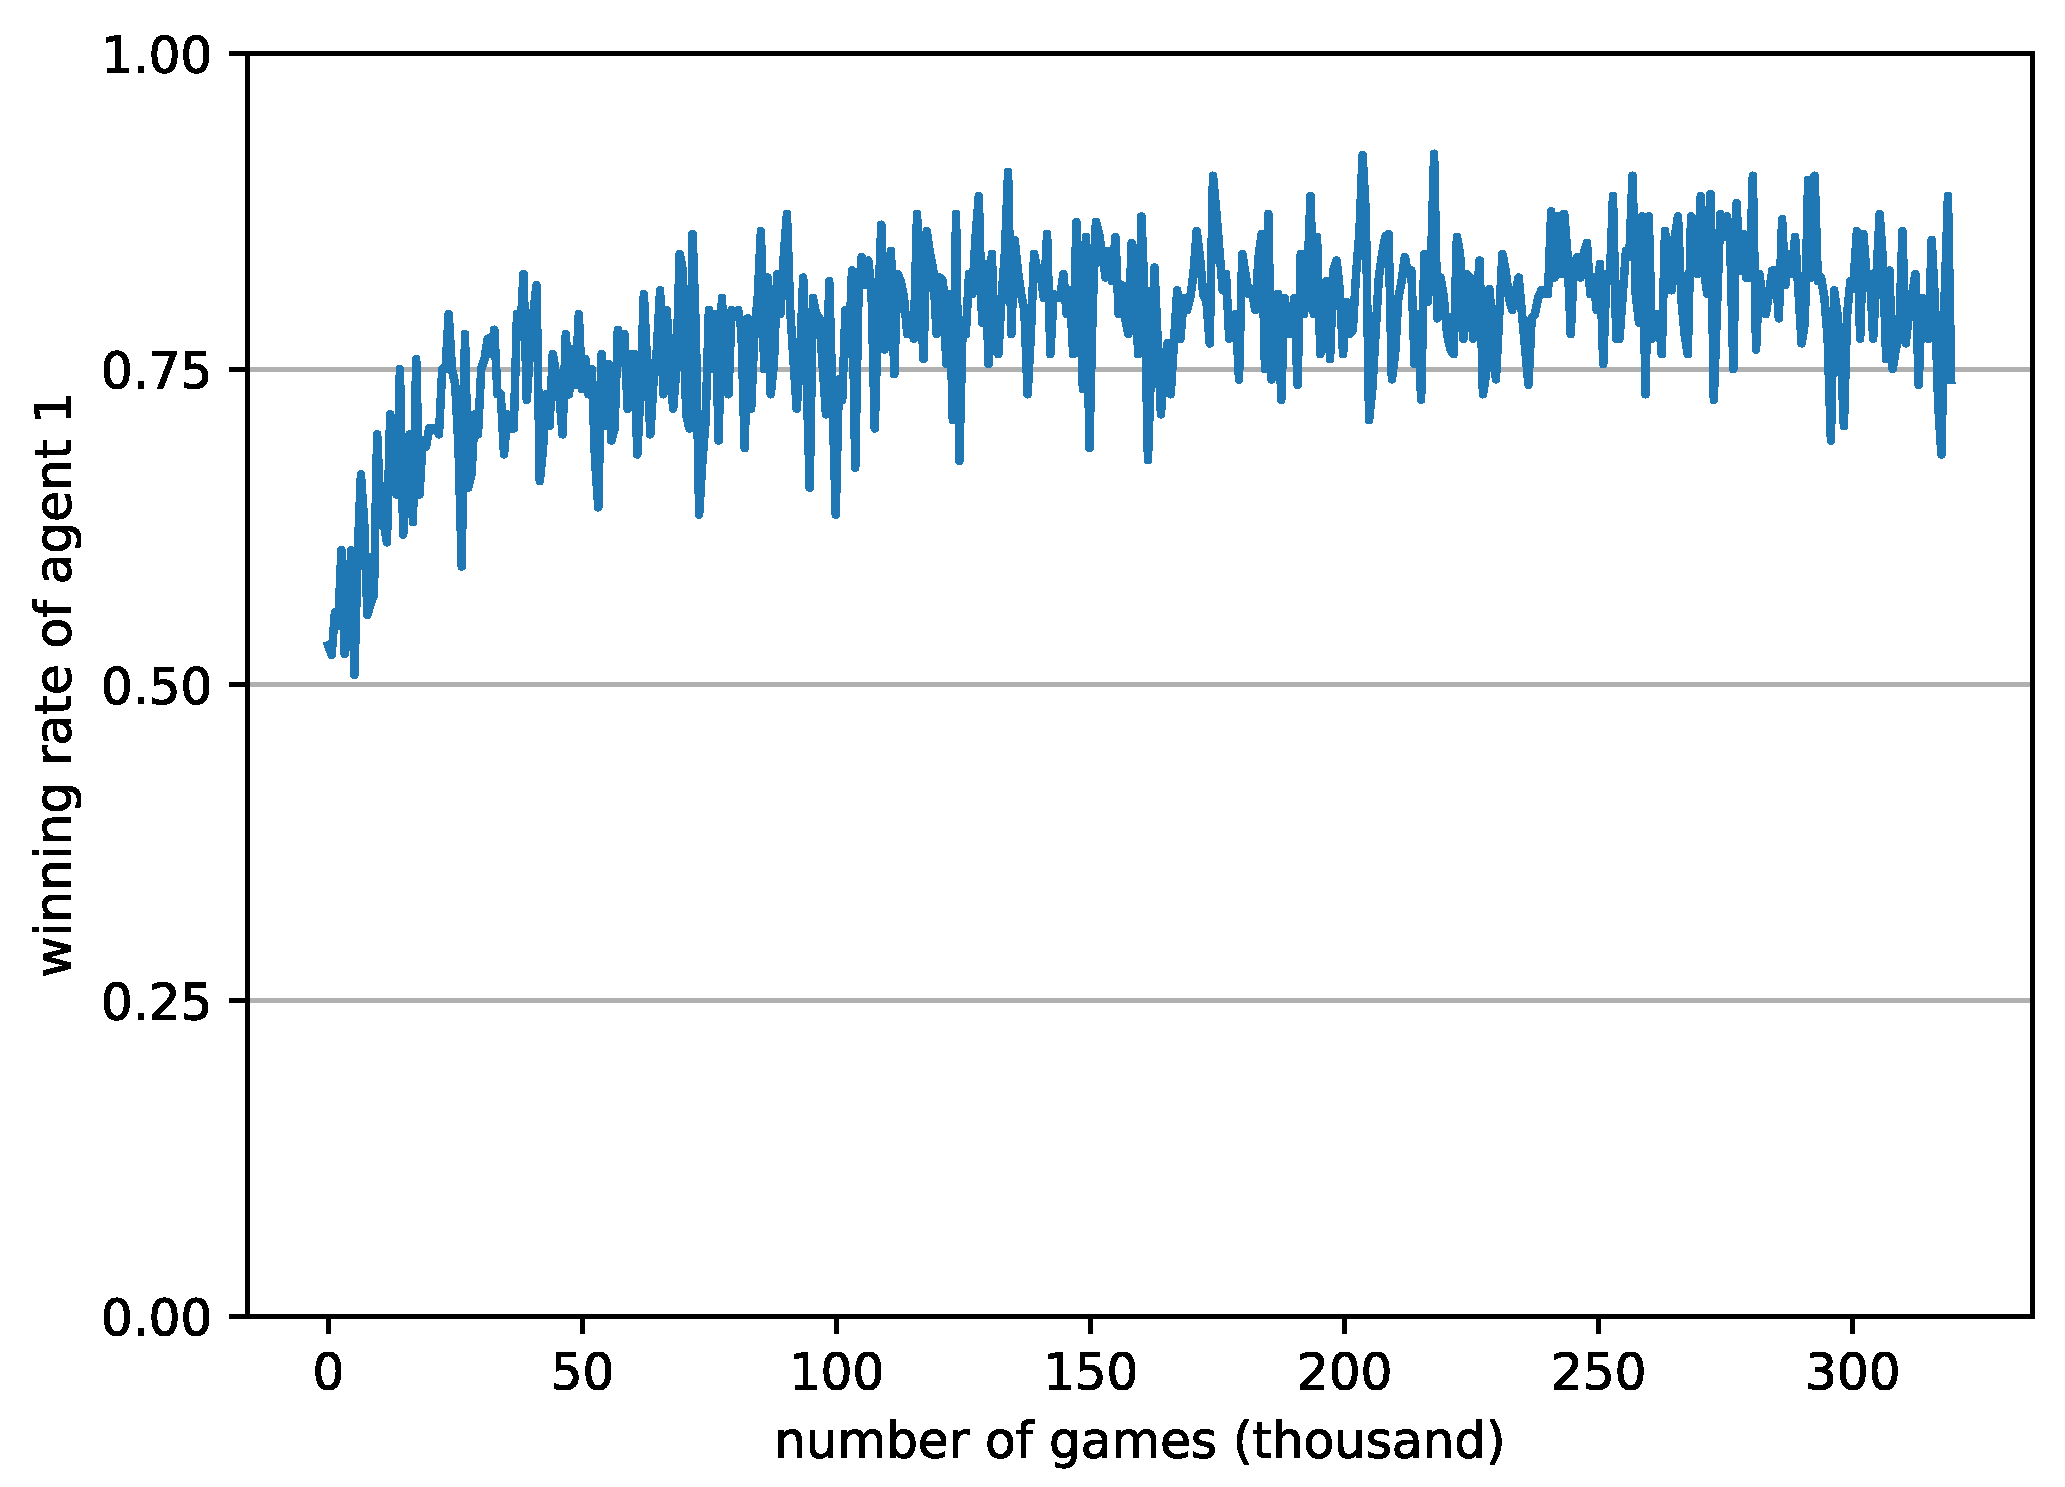
Othello agents such as Edax and Logistello move according to their book opening at early stages of the game. In other words, the evaluation function is rarely used early on in games, and its performance becomes important only mid-game. Accordingly, we evaluated the performance of the evaluation function after the middle of the game. Specifically, the game was played from the initial state of the board at the 24th move of a game randomly selected from the dataset. The parameters in the minimax search of the game tree were set to 7 and 20 for the mid-game and end-game depths of search, respectively.
The results for 300,000 games are shown in
Figure 7, with the win rate of Agent 1 exhibiting stability at approximately 0.75.
6. Discussion
According to the search results of
Section 5.1, islands with a smaller
exhibited no tuples focused on the corners, whereas those with a larger
exhibited tuples focused on the corners and edges. However, this was not the case for the island in Move 18, which contained some tuples focused on the corners. In the dataset, there were very few games in which stones were placed at the corners in Move 18. Therefore, the network is suboptimal.
In addition, the test scores in
Section 5.1 and
Section 5.2 show that islands with a smaller
are less likely to progress during the search and vice versa. There are several possible explanations for these results. One such explanation is the search range of the tuples, which was set to three rows at the edge of the board. We believe that this range was inappropriate at early stages of the game, as in the case of Move 18. Another possible explanation is the diversity of the datasets. Because the dataset used in this study included games with overlapping developments during early stages of the game, we believe that islands with a small
lacked diversity in the dataset, negatively affecting the search results.
In a comparative experiment between the proposed network and Edax, the configurations in
Section 5.2 and
Section 5.3 outperformed Edax both on the dataset and in an actual game.
One of our future tasks will be to optimize moves early in the game, as in the case of Moves 18 and 22. This can be achieved by changing the search area of the tuples, using a dataset with a wider variety of games, or migrating to an area larger than the neighboring islands.
In this study, we compared the performance when the network weights were trained from the initialized state to align with the experimental conditions. However, to demonstrate that the proposed network truly outperforms the Edax network, it is necessary to compare its performance with that of a trained Edax network.
In this study, the network size was assumed to be constant throughout the search. However, in the future, it may be possible to perform searches with a variable network size. An increased network size may improve performance at the cost of increasing the number of weights and the computational cost of inference. This trade-off must be considered when conducting a search.
The method is independent of the game characteristics of Othello, and can optimize the shape of larger (or smaller) n-tuple networks. Therefore, we expect that our method can be applied to games such as Connect-Four and 2048, where n-tuple networks have proven effective. In such cases, it may be necessary to redesign the fitness function. This paper defined the fitness function as the prediction accuracy on a dataset, which allowed us to design the fitness function to match the performance in reinforcement learning, as demonstrated in Experiment
Section 5.3. This approach, although computationally more expensive, eliminates the need for prior knowledge in the form of a dataset, allowing for its broader application to a wider range of problems. In addition, when applied to larger state spaces, such as Go, the network size should be larger. In order to verify its applicability and scalability, it needs to be evaluated in various environments, not just compared to a single agent, as in this study.
7. Conclusions
In this study, we employed DGA to optimize the shape of the n-tuple network with the objective of maximizing its performance regarding representative moves. The shapes of several networks obtained through this search were experimentally evaluated, with the results indicating that the resulting network shape is more accurate than that of the Edax network. By adjusting the use of network shapes with respect to the game’s progress, the proposed mechanism also outperformed Edax. We expect that a network constructed in this manner can be used to generate agents that further outperform Edax. Our method is expected to be applicable to games such as Connect-Four and 2048, because it is independent of game characteristics and can optimize the shape of larger (or smaller) n-tuple networks.
Author Contributions
Conceptualization, H.K. and T.M.; methodology, H.K.; software, H.K.; formal analysis, H.K.; investigation, H.K. and K.S.; data curation, H.K.; writing—original draft preparation, H.K.; writing—review and editing, H.K., T.M. and K.S.; visualization, H.K.; supervision, T.M. All authors have read and agreed to the published version of the manuscript.
Funding
This research received no external funding.
Data Availability Statement
The original contributions presented in the study are included in the article, further inquiries can be directed to the corresponding author.
Conflicts of Interest
The authors declare no conflicts of interest.
Appendix A. Search Results for Each Island
Figure A1.
Search results for each island at 18 moves.
Figure A1.
Search results for each island at 18 moves.
Figure A2.
Search results for each island at 22 moves.
Figure A2.
Search results for each island at 22 moves.
Figure A3.
Search results for each island at 26 moves.
Figure A3.
Search results for each island at 26 moves.
Figure A4.
Search results for each island at 30 moves.
Figure A4.
Search results for each island at 30 moves.
Figure A5.
Search results for each island at 34 moves.
Figure A5.
Search results for each island at 34 moves.
Figure A6.
Search results for each island at 38 moves.
Figure A6.
Search results for each island at 38 moves.
Figure A7.
Search results for each island at 42 moves.
Figure A7.
Search results for each island at 42 moves.
Figure A8.
Search results for each island at 46 moves.
Figure A8.
Search results for each island at 46 moves.
References
- Belding, T. C. (1995, July 15–19). The distributed genetic algorithm revisited. 6th International Conference on Genetic Algorithms (pp. 114–121), San Francisco, CA, USA. [Google Scholar]
- Bledsoe, W. W., & Browning, I. (1959, December 1–3). Pattern recognition and reading by machine. Eastern Joint IRE-AIEE-ACM Computer Conference (pp. 225–232), Boston, MA, USA. [Google Scholar] [CrossRef]
- Buro, M. (1997a). An evaluation function for othello based on statistics (Technical Report 31). NEC Research Institute. [Google Scholar]
- Buro, M. (1997b). The Othello match of the year: Takeshi Murakami vs. Logistello. ICGA Journal, 20, 189–193. [Google Scholar] [CrossRef]
- Buro, M. (2003). The evolution of strong Othello programs. In Entertainment computing: Technologies and application (pp. 81–88). Springer. [Google Scholar]
- Gonçalves, J. F., & Resende, M. G. (2011). Biased random-key genetic algorithms for combinatorial optimization. Journal of Heuristics, 17, 487–525. [Google Scholar]
- Jaśkowski, W. (2014). Systematic N-Tuple networks for Othello position evaluation. ICGA Journal, 37, 85–96. [Google Scholar] [CrossRef]
- Kolcz, A., & Allinson, N. M. (1996). N-tuple regression network. Neural Networks, 9, 855–869. [Google Scholar] [CrossRef] [PubMed]
- Konen, W., & Bagheri, S. (2020). Reinforcement learning for N-player games: The importance of final adaptation. In B. Filipič, E. Minisci, & M. Vasile (Eds.), Bioinspired optimization methods and their applications (pp. 84–96). Springer. [Google Scholar]
- Krawiec, K., & Szubert, M. G. (2011, July 12–16). Learning n-tuple networks for Othello by coevolutionary gradient search. 13th Annual Conference on Genetic and Evolutionary Computation (pp. 355–362), Dublin, Ireland. [Google Scholar]
- Lucas, S. M. M. (2008). Learning to play othello with N-Tuple systems. Australian Journal of Intelligent Information Processing, 4, 1–20. [Google Scholar]
- Rohwer, R., & Morciniec, M. (1996). A theoretical and experimental account of n-Tuple classifier performance. Neural Computation, 8, 629–642. [Google Scholar] [CrossRef]
- Szubert, M., Jaśkowski, W., & Krawiec, K. (2013). On scalability, generalization, and hybridization of coevolutionary learning: A case study for othello. IEEE Transactions on Computational Intelligence and AI in Games, 5, 214–226. [Google Scholar] [CrossRef]
- Thill, M., Koch, P., & Konen, W. (2012). Reinforcement learning with N-tuples on the game Connect-4. In C. A. C. Coello, V. Cutello, K. Deb, S. Forrest, G. Nicosia, & M. Pavone (Eds.), Parallel problem solving from Nature—PPSN XII (pp. 184–194). Springer. [Google Scholar]
| Disclaimer/Publisher’s Note: The statements, opinions and data contained in all publications are solely those of the individual author(s) and contributor(s) and not of MDPI and/or the editor(s). MDPI and/or the editor(s) disclaim responsibility for any injury to people or property resulting from any ideas, methods, instructions or products referred to in the content. |
© 2025 by the authors. Licensee MDPI, Basel, Switzerland. This article is an open access article distributed under the terms and conditions of the Creative Commons Attribution (CC BY) license (https://creativecommons.org/licenses/by/4.0/).


