Payment Systems, Insurance, and Agency Problems in Healthcare: A Medically Framed Real-Effort Experiment
Abstract
1. Introduction
2. Overview of Related Literature
2.1. Payment Systems, Provider Behavior, and Quality of Services
2.2. Insurance and Provider Behavior
3. Methods and Data
3.1. Experimental Design
3.2. Experimental Process
3.3. Hypotheses
4. Results
4.1. Payment Systems and Quantity of Care
4.2. Payment Systems and Quality of Care
4.3. Insurance and Quantity and Quality of Care
4.4. Payment Systems, Insurance, and Patient Welfare
4.5. Regression Analysis
5. Discussion and Concluding Remarks
Author Contributions
Funding
Data Availability Statement
Acknowledgments
Conflicts of Interest
Appendix A

Appendix B. Post-Experiment Survey
- Which role were you assigned in the experiment?
- Doctor
- Patient
- Age
- Under 25
- 25–34
- 35–44
- 45–54
- Over 55
- Gender
- Male
- Female
- Non-binary
- Prefer not to say
- Are you a medical student/doctor
- Yes
- No
- In the experiment, you were given the choice to perform tasks to solve the customer’s problem. How did the type of incentive (flat salary or fee for service) affect your decision-making?
- Yes, significantly
- Yes, to some extent
- No, not at all
- Briefly describe the key factors you considered when making decisions in the experiment.
- Did you feel any ethical considerations or moral dilemmas while making decisions in the experiment? If so, please explain
- Do you think your decisions in the experiment accurately represent how you would make similar decisions in your real-life occupation?
- Yes
- No
- How well do you think you balanced your own interests with the welfare of the customer in the experiment?
- Extremely not well
- Somewhat not well
- Somewhat well
- Extremely well
- Neutral
- Did the presence of passive customers in the same room as the provider (expert or customer) affect your decision-making?
- Yes
- No
- Not sure
- Did the waiting time negatively impact your overall experience?
- Not at all
- Somewhat
- Did not matter
- Very much
Appendix C. Instructions for Salary Treatment
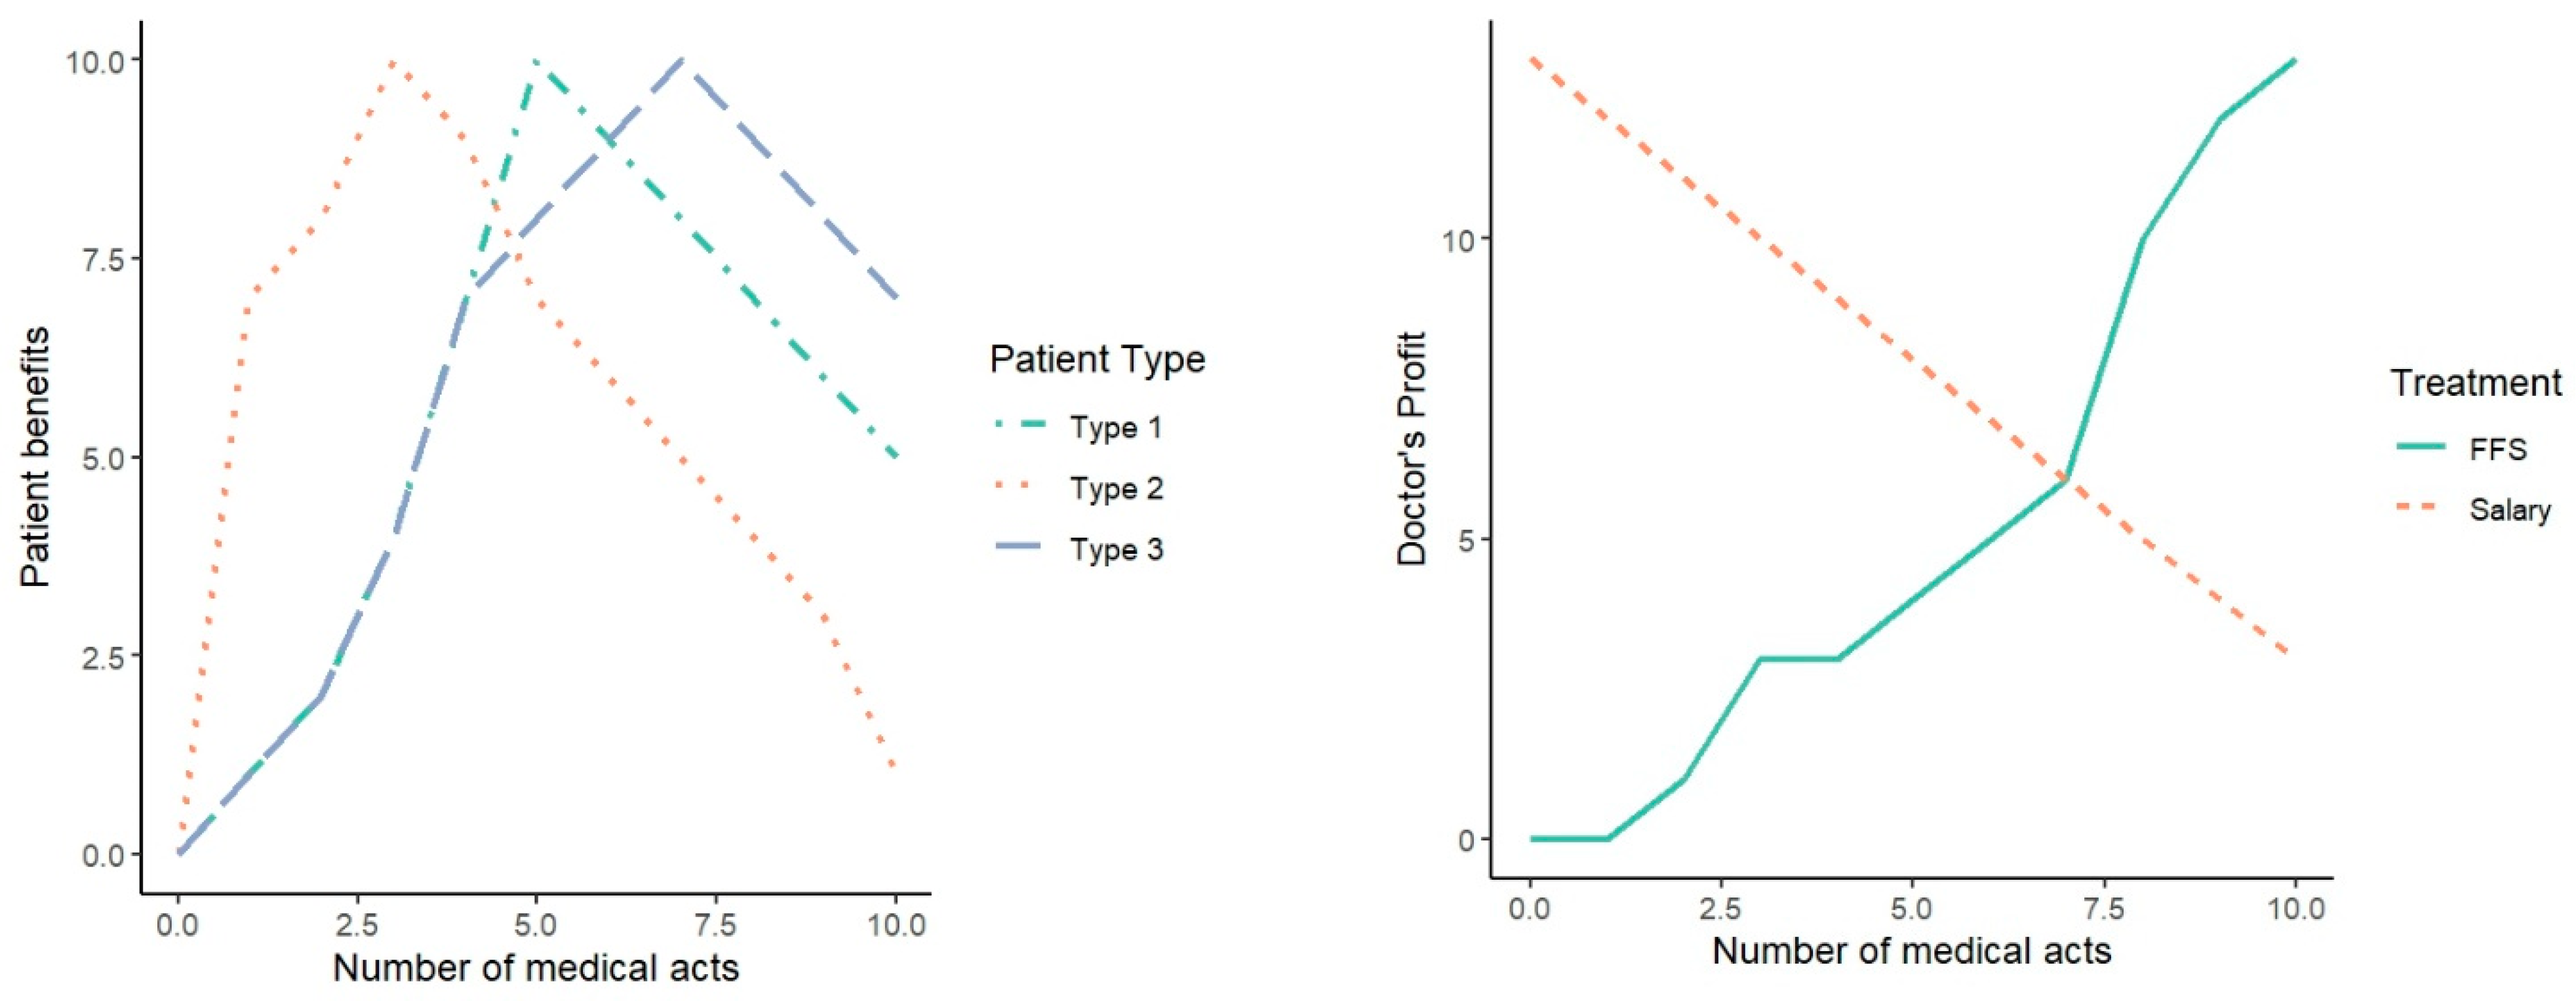
| Number of Tasks | Your Wage | Your Cost | Your Profit | Patient Benefit |
|---|---|---|---|---|
| 0 | 13 | 0 | 13 | 0 |
| 1 | 13 | 1 | 12 | 1 |
| 2 | 13 | 2 | 11 | 2 |
| 3 | 13 | 3 | 10 | 4 |
| 4 | 13 | 4 | 9 | 7 |
| 5 | 13 | 5 | 8 | 10 |
| 6 | 13 | 6 | 7 | 9 |
| 7 | 13 | 7 | 6 | 8 |
| 8 | 13 | 8 | 5 | 7 |
| 9 | 13 | 9 | 4 | 6 |
| 10 | 13 | 10 | 3 | 5 |
| Number of Tasks | Your Wage | Your Cost | Your Profit | Patient Benefit |
|---|---|---|---|---|
| 0 | 13 | 0 | 13 | 0 |
| 1 | 13 | 1 | 12 | 7 |
| 2 | 13 | 2 | 11 | 8 |
| 3 | 13 | 3 | 10 | 10 |
| 4 | 13 | 4 | 9 | 9 |
| 5 | 13 | 5 | 8 | 7 |
| 6 | 13 | 6 | 7 | 6 |
| 7 | 13 | 7 | 6 | 5 |
| 8 | 13 | 8 | 5 | 4 |
| 9 | 13 | 9 | 4 | 3 |
| 10 | 13 | 10 | 3 | 1 |
| Number of Tasks | Your Wage | Your Cost | Your Profit | Patient Benefit |
|---|---|---|---|---|
| 0 | 13 | 0 | 13 | 0 |
| 1 | 13 | 1 | 12 | 1 |
| 2 | 13 | 2 | 11 | 2 |
| 3 | 13 | 3 | 10 | 4 |
| 4 | 13 | 4 | 9 | 7 |
| 5 | 13 | 5 | 8 | 8 |
| 6 | 13 | 6 | 7 | 9 |
| 7 | 13 | 7 | 6 | 10 |
| 8 | 13 | 8 | 5 | 9 |
| 9 | 13 | 9 | 4 | 8 |
| 10 | 13 | 10 | 3 | 7 |
| Top of Form |
|---|
| Matchings: Please remember that you will be randomly matched with different patient types in each round. |
| Wage: The wage is 13 ECU. |
| Effort: Each doctor sees the wage and then chooses an effort (number of tasks) that can be any amount between (and including) 0 and 10. |
| Doctor Earnings: The doctor earns the difference between the wage and the cost of that doctor’s effort (per-unit effort cost times effort choice). |
| Patient Earnings: Each patient will receive a benefit based on his/her own need and the effort of the doctor. |
| When you have completed the experiment please raise your hand and an assistant will tell you where to go to get paid. |
| Bottom of Form |
| 1 | In the salary treatment, doctors’ earnings were calculated as 13 ECUs minus the cost per task, based on the number of tasks performed. For example, if a doctor completed seven tasks in a round, their earnings for that round would be 13 ECUs − 7 ECUs = 6 ECUs. In FFS, round earnings were the amount earned per task minus the effort cost, based on the number of tasks performed. For example, if a doctor completed 10 tasks in a round, their earnings for that round would be 23 ECUs − 10 ECUs = 13 ECUs. |
| 2 | Patients in this experiment were passive and did not make any decisions or perform any tasks. |
| 3 | Subjects were informed if they were serving an insured or uninsured patient. Insurance coverage did not affect the optimal number of services required, but it did influence patient benefits. |
| 4 | This experiment had 14 sessions, but one was cancelled due to recurring errors. Data from this session were removed from the final analysis. |
| 5 | Tampere University was chosen given the authors’ affiliation to the university. |
| 6 | This experiment unfortunately was frustratingly slow and involved rather long waiting times for both doctors and patients. It is possible that towards the end of the experiment, subjects simply wanted to maximize payoffs without paying much attention to accuracy. |
References
- Darby, M.R.; Karni, E. Free Competition and the Optimal Amount of Fraud. J. Law Econ. 1973, 16, 67–88. [Google Scholar] [CrossRef]
- Ellis, R.P.; McGuire, T.G. Provider Behavior under Prospective Reimbursement: Cost Sharing and Supply. J. Health Econ. 1986, 5, 129–151. [Google Scholar] [CrossRef]
- Balafoutas, L.; Beck, A.; Kerschbamer, R.; Sutter, M. What Drives Taxi Drivers? A Field Experiment on Fraud in a Market for Credence Goods. Rev. Econ. Stud. 2013, 80, 876–891. [Google Scholar] [CrossRef]
- Kerschbamer, R.; Neururer, D.; Sutter, M. Insurance Coverage of Customers Induces Dishonesty of Sellers in Markets for Credence Goods. Proc. Natl. Acad. Sci. USA 2016, 113, 7454–7458. [Google Scholar] [CrossRef]
- Hsiao, W. Abnormal Economics in the Health Sector. Health Policy 1995, 32, 125–139. [Google Scholar] [CrossRef]
- Lagarde, M.; Blaauw, D. Overtreatment and Benevolent Provider Moral Hazard: Evidence from South African Doctors. J. Dev. Econ. 2022, 158, 102917. [Google Scholar] [CrossRef]
- Zabrodina, V.; Dusheiko, M.; Moschetti, K. A Moneymaking Scan: Dual Reimbursement Systems and Supplier-Induced Demand for Diagnostic Imaging. Health Econ. 2020, 29, 1566–1585. [Google Scholar] [CrossRef]
- Lundin, D. Moral Hazard in Physician Prescription Behavior. J. Health Econ. 2000, 19, 639–662. [Google Scholar] [CrossRef]
- Lu, F. Insurance Coverage and Agency Problems in Doctor Prescriptions: Evidence from a Field Experiment in China. J. Dev. Econ. 2014, 106, 156–167. [Google Scholar] [CrossRef]
- Syafrawati, S.; Machmud, R.; Aljunid, S.M.; Semiarty, R. Incidence of Moral Hazards among Health Care Providers in the Implementation of Social Health Insurance toward Universal Health Coverage: Evidence from Rural Province Hospitals in Indonesia. Front. Public Health 2023, 11, 1147709. [Google Scholar] [CrossRef]
- Hennig-Schmidt, H.; Selten, R.; Wiesen, D. How Payment Systems Affect Physicians’ Provision Behaviour—An Experimental Investigation. J. Health Econ. 2011, 30, 637–646. [Google Scholar] [CrossRef] [PubMed]
- Karunadasa, M.; Sieberg, K.K.; Jantunen, T.T.K. Payment Systems, Supplier-Induced Demand, and Service Quality in Credence Goods: Results from a Laboratory Experiment. Games 2023, 14, 46. [Google Scholar] [CrossRef]
- Green, E.P. Payment Systems in the Healthcare Industry: An Experimental Study of Physician Incentives. J. Econ. Behav. Organ. 2014, 106, 367–378. [Google Scholar] [CrossRef]
- Lagarde, M.; Blaauw, D. Physicians’ Responses to Financial and Social Incentives: A Medically Framed Real Effort Experiment. Soc. Sci. Med. 2017, 179, 147–159. [Google Scholar] [CrossRef] [PubMed]
- Engel, C. Dictator Games: A Meta Study. Exp. Econ. 2011, 14, 583–610. [Google Scholar] [CrossRef]
- Eckel, C.C.; Grossman, P.J. Altruism in Anonymous Dictator Games. Games Econ. Behav. 1996, 16, 181–191. [Google Scholar] [CrossRef]
- Angerer, S.; Glätzle-Rützler, D.; Waibel, C. Framing and Subject Pool Effects in Healthcare Credence Goods. J. Behav. Exp. Econ. 2023, 103, 101973. [Google Scholar] [CrossRef]
- Brosig-Koch, J.; Hennig-Schmidt, H.; Kairies-Schwarz, N.; Wiesen, D. The Effects of Introducing Mixed Payment Systems for Physicians: Experimental Evidence: The Effects of Introducing Mixed Payment Systems for Physicians. Health Econ. 2017, 26, 243–262. [Google Scholar] [CrossRef]
- Kesternich, I.; Schumacher, H.; Winter, J. Professional Norms and Physician Behavior: Homo Oeconomicus or Homo Hippocraticus? J. Public Econ. 2015, 131, 1–11. [Google Scholar] [CrossRef]
- Hennig-Schmidt, H.; Wiesen, D. Other-Regarding Behavior and Motivation in Health Care Provision: An Experiment with Medical and Non-Medical Students. Soc. Sci. Med. 2014, 108, 156–165. [Google Scholar] [CrossRef]
- Ahlert, M.; Felder, S.; Vogt, B. Which Patients Do I Treat? An Experimental Study with Economists and Physicians. Health Econ. Rev. 2012, 2, 1–11. [Google Scholar] [CrossRef] [PubMed]
- Kazungu, J.S.; Barasa, E.W.; Obadha, M.; Chuma, J. What Characteristics of Provider Payment Mechanisms Influence Health Care Providers’ Behaviour? A Literature Review. Int. J. Health Plan. Manag. 2018, 33, e892–e905. [Google Scholar] [CrossRef] [PubMed]
- Moreno-Serra, R.; Wagstaff, A. System-Wide Impacts of Hospital Payment Reforms: Evidence from Central and Eastern Europe and Central Asia. J. Health Econ. 2010, 29, 585–602. [Google Scholar] [CrossRef] [PubMed]
- Jegers, M.; Kesteloot, K.; De Graeve, D.; Gilles, W. A Typology for Provider Payment Systems in Health Care. Health Policy 2002, 60, 255–273. [Google Scholar] [CrossRef] [PubMed]
- Ellis, R.P.; Miller, M.M. Provider Payment Methods and Incentives; Elsevier: Amsterdam, The Netherlands, 2008; pp. 395–402. [Google Scholar]
- Vengberg, S.; Fredriksson, M.; Burström, B.; Burström, K.; Winblad, U. Money Matters—Primary Care Providers’ Perceptions of Payment Incentives. J. Health Organ. Manag. 2021; ahead-of-print. [Google Scholar] [CrossRef]
- Abelson, R. Corporate Giants Buy Up Primary Care Practices at Rapid Pace. New York Times, 8 May 2023. [Google Scholar]
- Shah, S.; Rooke-Ley, H.; Fuse Brown, E.C. Corporate Investors in Primary Care—Profits, Progress, and Pitfalls. N. Engl. J. Med. 2023, 388, 99–101. [Google Scholar] [CrossRef] [PubMed]
- Gosden, T.; Forland, F.; Kristiansen, I.S.; Sutton, M.; Leese, B.; Giuffrida, A.; Sergison, M.; Pedersen, L. Impact of Payment Method on Behaviour of Primary Care Physicians: A Systematic Review. J. Health Serv. Res. Policy 2001, 6, 44–55. [Google Scholar] [CrossRef] [PubMed]
- Keser, C.; Montmarquette, C.; Schmidt, M.; Schnitzler, C. Custom-Made Health-Care: An Experimental Investigation. Health Econ. Rev. 2020, 10, 41. [Google Scholar] [CrossRef]
- Kreier, R. Moral Hazard: It’s the Supply Side, Stupid. World Aff. Wash. World Aff. 2019, 182, 205–223. [Google Scholar] [CrossRef]
- Huck, S.; Lünser, G.; Spitzer, F.; Tyran, J.-R. Medical Insurance and Free Choice of Physician Shape Patient Overtreatment: A Laboratory Experiment. J. Econ. Behav. Organ. 2016, 131, 78–105. [Google Scholar] [CrossRef]
- Green, E.P.; Kloosterman, A. Agent Sorting by Incentive Systems in Mission Firms: Implications for Healthcare and Other Credence Goods Markets. J. Econ. Behav. Organ. 2022, 200, 408–429. [Google Scholar] [CrossRef]
- Chen, D.L.; Schonger, M.; Wickens, C. oTree—An Open-Source Platform for Laboratory, Online, and Field Experiments. J. Behav. Exp. Financ. 2016, 9, 88–97. [Google Scholar] [CrossRef]
- R Studio Team. RStudio: Integrated Development for R; R Studio Team: Vienna, Austria, 2020. [Google Scholar]
- Wickham, H. Ggplot2: Elegant Graphics for Data Analysis; Springer: Berlin/Heidelberg, Germany, 2016. [Google Scholar]
- Hlavac, M. Stargazer: Well-Formatted Regression and Summary Statistics Tables; R Studio Team: Vienna, Austria, 2022. [Google Scholar]
- Twisk, J.W.R. Applied Mixed Model Analysis: A Practical Guide, 2nd ed.; Cambridge University Press: Cambridge, UK, 2019; ISBN 978-1-108-63566-0. [Google Scholar]
- Hart, O.; Shleifer, A.; Vishny, R.W. The Proper Scope of Government: Theory and an Application to Prisons. Q. J. Econ. 1997, 112, 1127–1161. [Google Scholar] [CrossRef]
- Lindqvist, E. Privatization of Credence Goods: Theory and an Application to Residential Youth Care. SSRN Electron. J. 2008. [Google Scholar] [CrossRef][Green Version]
- Sülzle, K.; Wambach, A. Insurance in a Market for Credence Goods. J. Risk Insur. 2005, 72, 159–176. [Google Scholar] [CrossRef]
- Balafoutas, L.; Kerschbamer, R. Credence Goods in the Literature: What the Past Fifteen Years Have Taught Us about Fraud, Incentives, and the Role of Institutions. J. Behav. Exp. Financ. 2020, 26, 100285. [Google Scholar] [CrossRef]


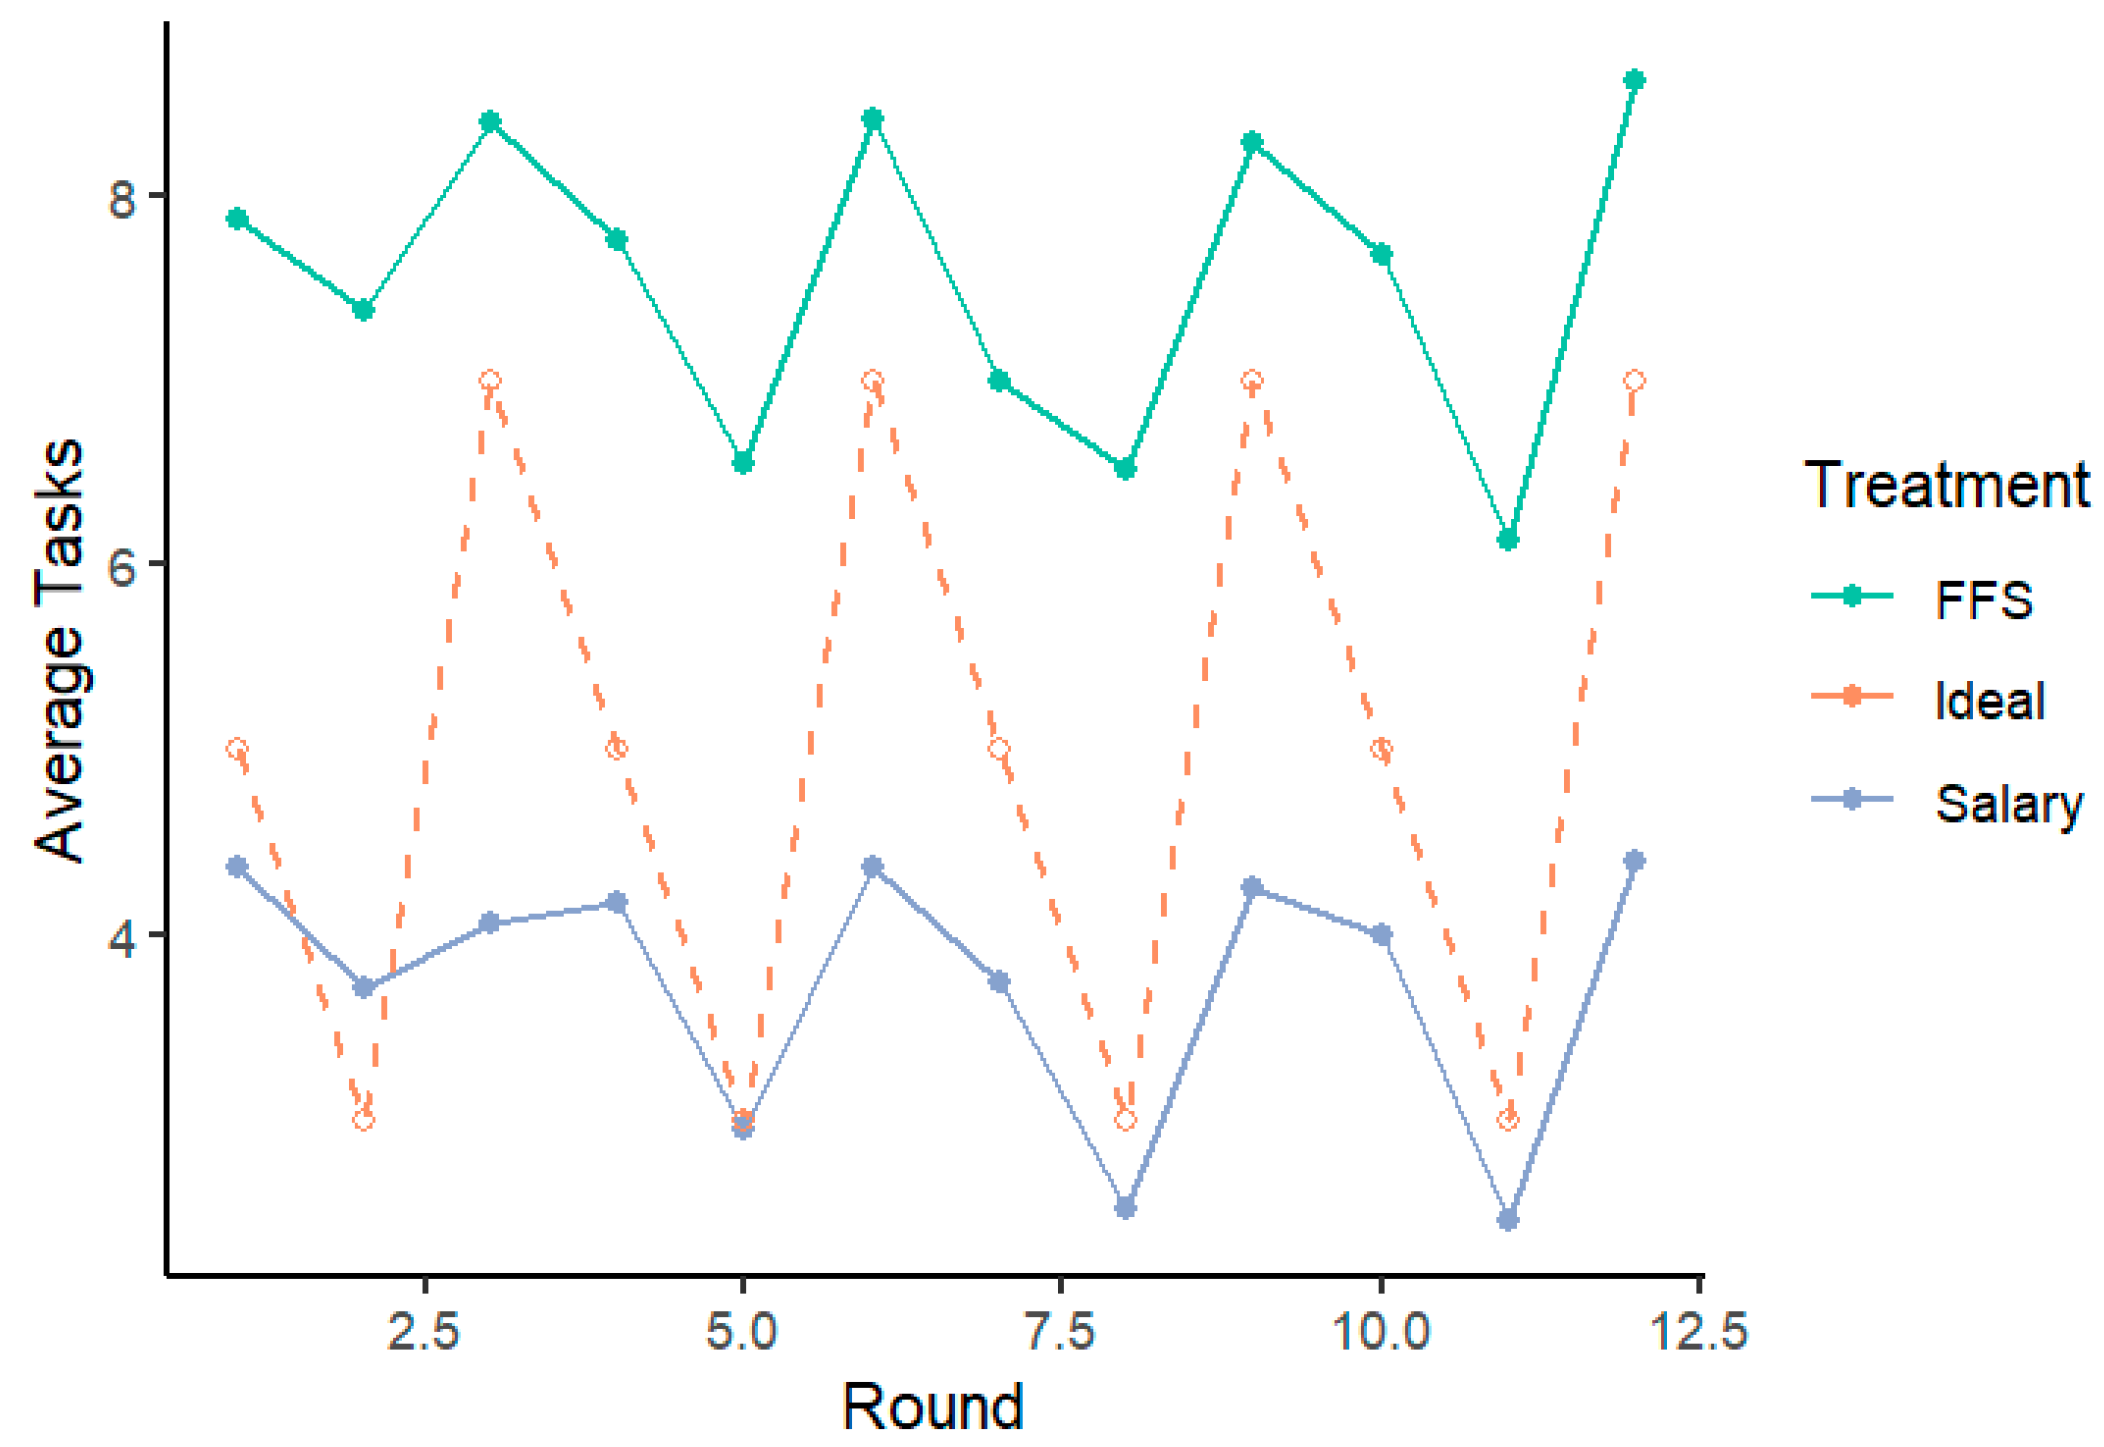
| Round | 1 | 2 | 3 | 4 | 5 | 6 | 7 | 8 | 9 | 10 | 11 | 12 |
|---|---|---|---|---|---|---|---|---|---|---|---|---|
| Patient Type | 1 | 2 | 3 | 1 | 2 | 3 | 1 | 2 | 3 | 1 | 2 | 3 |
| Ideal Task Count | 5 | 3 | 7 | 5 | 3 | 7 | 5 | 3 | 7 | 5 | 3 | 7 |
| Treatment | Salary (Mean) | FFS (Mean) | p |
|---|---|---|---|
| Doctor | 111 | 106 | 0.24 |
| Patient | 80.4 | 61.85 | 0.000006 |
| Patient Type | Salary | FFS | p |
|---|---|---|---|
| Type 1 | 1.77 | 5.18 | <0.00005 |
| Type 2 | 1.20 | 4.76 | <0.00005 |
| Type 3 | 3 | 4.6 | <0.00005 |
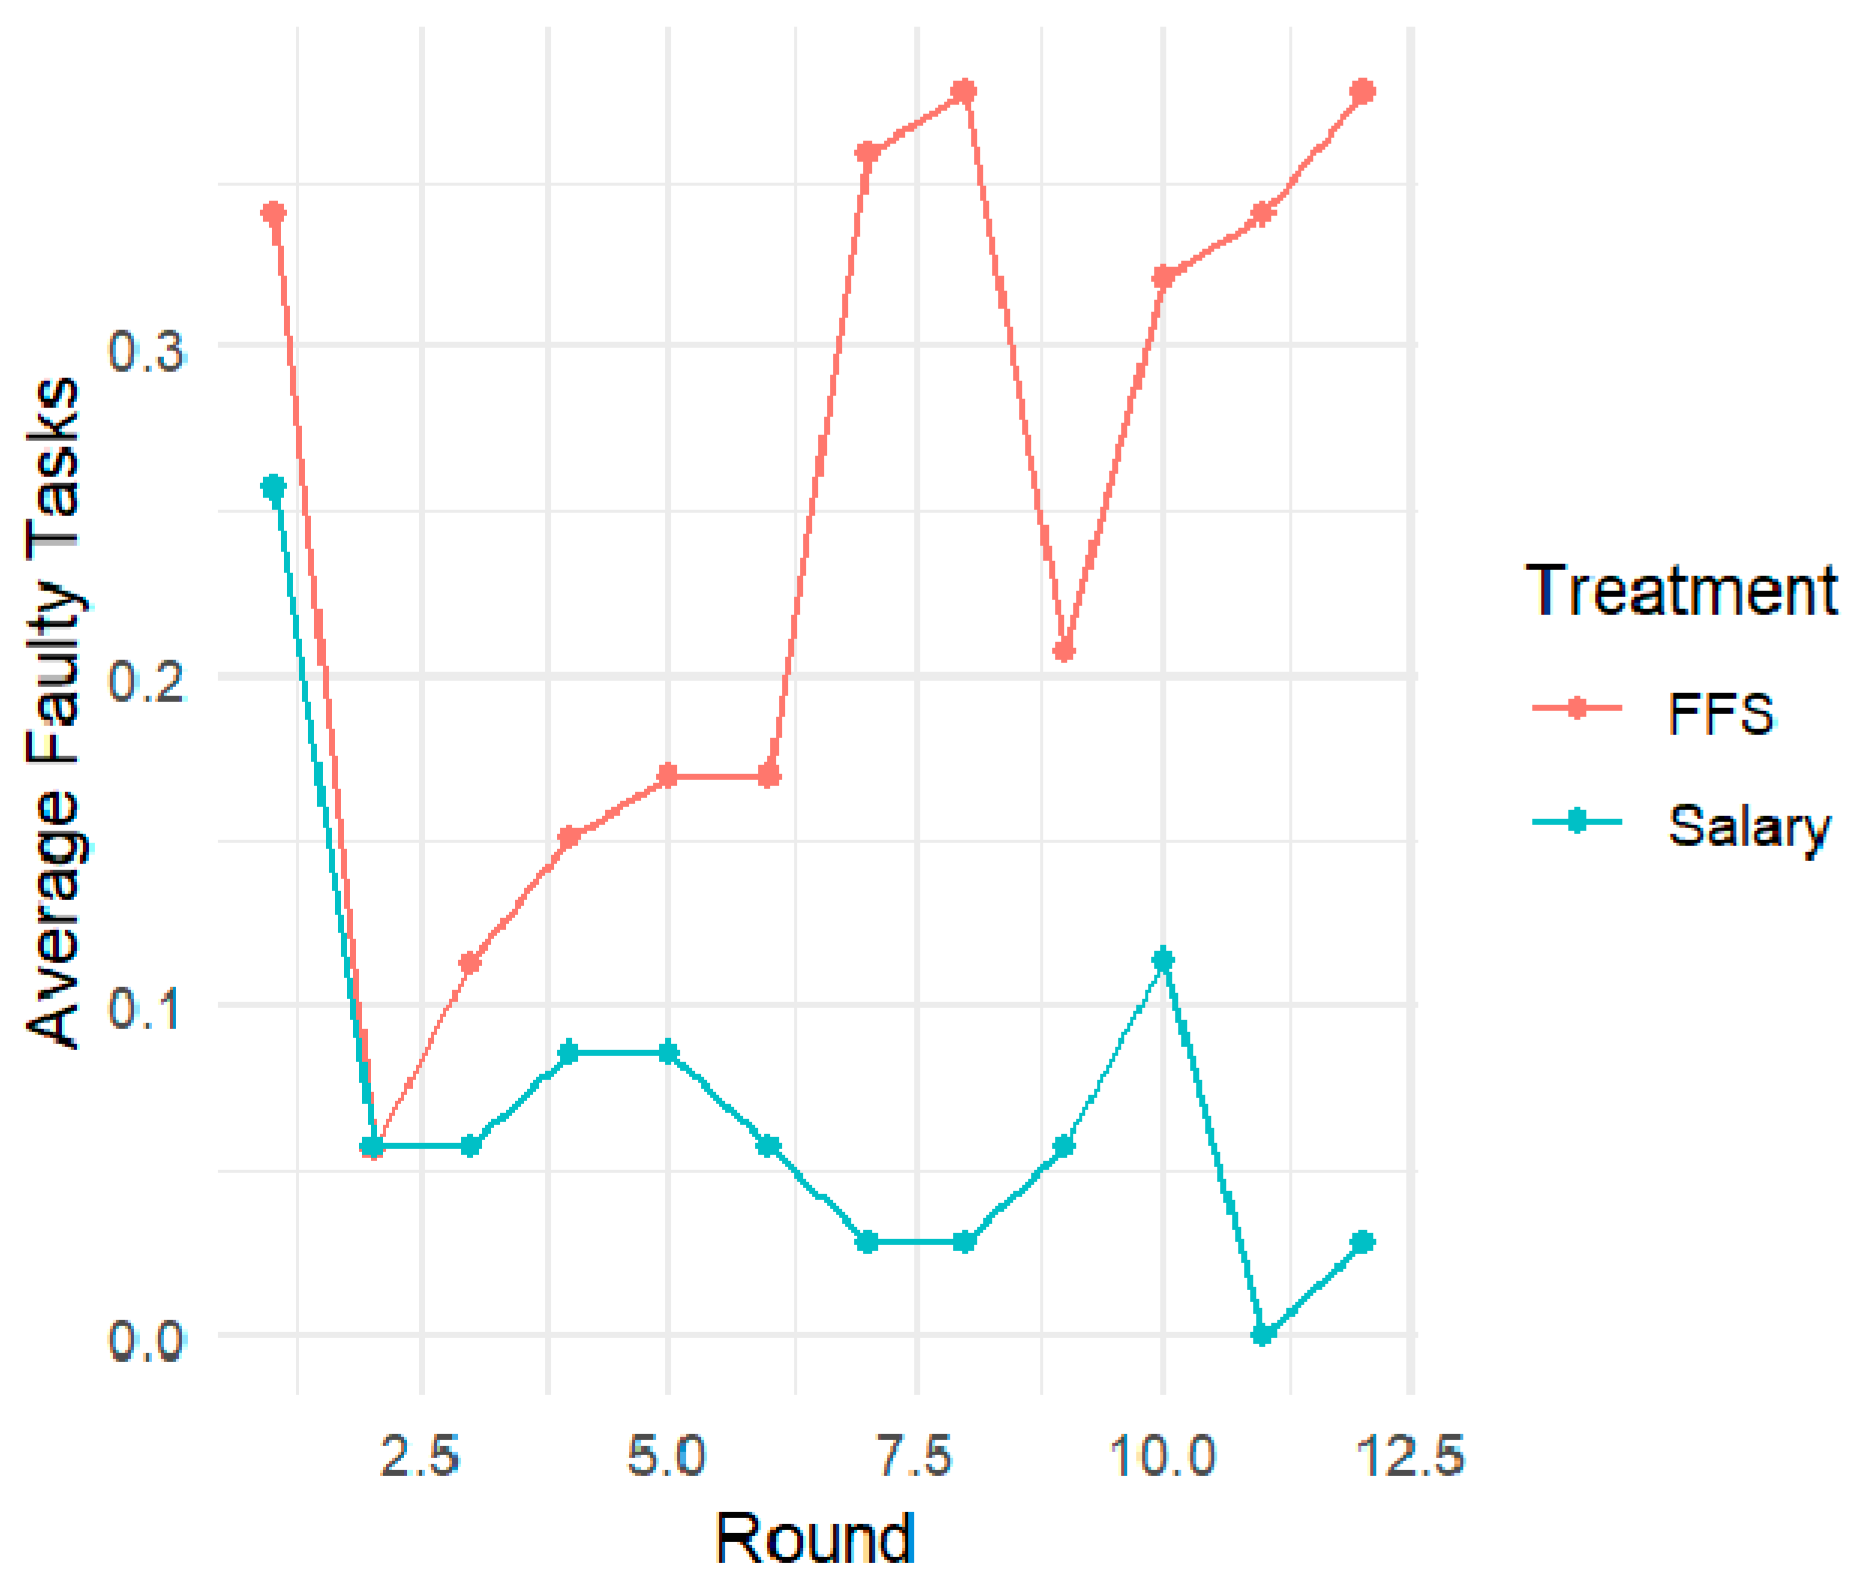
| Dependent Variables | ||||
|---|---|---|---|---|
| Actual Tasks ǂ | Faulty Tasks ǂ | Deviation from the Ideal Number of Tasks | Welfare Loss | |
| (1) | (2) | (3) | (4) | |
| FFS | 2.277 *** | 2.95 ** | 1 ** | 2.78 *** |
| (2.101, 2.453) | (2.092, 3.803) | (0.33) | (0.50) | |
| Patient T2 | 0.834 *** | 0.71 * | 0.19 | −0.48 ** |
| (0.772, 0.896) | (0.359, 1.059) | (0.12 | (0.18) | |
| Patient T3 | 1.096 *** | 0.67 ** | −0.23 * | 0.17 |
| (1.038, 1.154) | (0.315, 1.027) | (0.12) | (0.18) | |
| Constant | 3.334 *** | 0.02 *** | 2.26 *** | 2.09 ** |
| (3.098, 3.570) | (−1.192, 1.231) | (0.45) | (0.68) | |
| Observations | 1056 | 1056 | 1056 | 1056 |
| Individual controls | Yes | Yes | Yes | Yes |
| Dependent Variables | ||||
|---|---|---|---|---|
| Actual Tasks ǂ | Faulty Tasks ǂ | Deviation from the Ideal Number of Tasks | Welfare Loss | |
| (1) | (2) | (3) | (4) | |
| Insurance | 1.059 ** | 1.324 * | 0.24 * | 0.76 *** |
| (1.002, 1.115) | (1.009, 1.638) | (0.12) | (0.21) | |
| Patient T2 | 0.877 *** | 0.806 | 0.67 *** | −0.42 |
| (0.805, 0.948) | (0.434, 1.179) | (0.15) | (0.26) | |
| Patient T3 | 1.113 *** | 0.742 | −1.23 *** | −0.58 ** |
| (1.045, 1.180) | (0.361, 1.123) | (0.15) | (0.26) | |
| Constant | 7.159 *** | 0.048 *** | 2.81 *** | 4.22 *** |
| (7.025, 7.294) | (−1.102, 1.198) | (0.48) | (0.86) | |
| Observations | 636 | 636 | 636 | 636 |
| Individual controls | Yes | Yes | Yes | Yes |
Disclaimer/Publisher’s Note: The statements, opinions and data contained in all publications are solely those of the individual author(s) and contributor(s) and not of MDPI and/or the editor(s). MDPI and/or the editor(s) disclaim responsibility for any injury to people or property resulting from any ideas, methods, instructions or products referred to in the content. |
© 2024 by the authors. Licensee MDPI, Basel, Switzerland. This article is an open access article distributed under the terms and conditions of the Creative Commons Attribution (CC BY) license (https://creativecommons.org/licenses/by/4.0/).
Share and Cite
Karunadasa, M.; Sieberg, K.K. Payment Systems, Insurance, and Agency Problems in Healthcare: A Medically Framed Real-Effort Experiment. Games 2024, 15, 23. https://doi.org/10.3390/g15040023
Karunadasa M, Sieberg KK. Payment Systems, Insurance, and Agency Problems in Healthcare: A Medically Framed Real-Effort Experiment. Games. 2024; 15(4):23. https://doi.org/10.3390/g15040023
Chicago/Turabian StyleKarunadasa, Manela, and Katri K. Sieberg. 2024. "Payment Systems, Insurance, and Agency Problems in Healthcare: A Medically Framed Real-Effort Experiment" Games 15, no. 4: 23. https://doi.org/10.3390/g15040023
APA StyleKarunadasa, M., & Sieberg, K. K. (2024). Payment Systems, Insurance, and Agency Problems in Healthcare: A Medically Framed Real-Effort Experiment. Games, 15(4), 23. https://doi.org/10.3390/g15040023


