1. Introduction
Social contracts can be defined as systems of commonly understood conventions that coordinate behavior [
1,
2]. For example, social contracts contain informal rules that regulate the conduct of the citizens of a society, rules codified as laws, moral codes, and even fashion. The members of a society are always envisioning better social contracts. However, it is not easy to change the social contract. Not following the rules can lead to unwanted costs, and trying to change society’s practices is subjected to the risk of coordination failure [
3,
4]. Thus, how do better social contracts emerge?
The social contract theory has a long tradition that can be divided into two distinct phases [
5]. The first phase dates back to Rousseau’s influential book “
The Social Contract” [
6]. The primary focus was to formulate a theory that would employ the notion of a contract to legitimize or restrict political power. The second phase, which emerged later, coincided with the works of John Rawls and other contemporary scholars. This phase incorporated aspects of modern rational choice theory and Rawls’ interest in social justice [
7]. Generally, the social contract theory assumes that the contract is voluntary and that consensus can be achieved because individuals are rational agents.
The individualistic approach adopted in social contract theory is a natural framework for the ideas of evolutionary game theory. In the 1990s, two works stepped in that direction: Brian Skyrms’s
Evolution of the Social Contract [
8] and Ken Binmore’s
Just Playing [
2]. These works were praised for their authors’ extensive knowledge of game theory and moral philosophy, ability to extract essential issues from complex literature, and creativity [
9].The evolutionary game approach aims to understand how social contracts evolve. Rather than advocating for a specific social contract, the theory represents the social contracts as the equilibria of games and explains how they can arise and persist.
The crucial link between social contract and evolutionary game theory is the map between social contracts and the equilibria of a game. The social contract can be modeled as a stag-hunt game [
10]. As proposed by Rousseau in A Discourse on Inequality, “If it was a matter of hunting a deer, everyone well realized that he must remain faithful to their post; but if a hare happened to pass within reach of one of them, we cannot doubt that he would have gone off in pursuit of it without scruple” [
11]. The situation where everyone hunts hare represents the current social contract, and everyone hunting stag represents a better social contract that has not yet been adopted. The social contract solution, no matter which one, is an equilibrium solution: no one has a unilateral incentive to deviate (Nash equilibrium) [
12,
13]. Although the individuals may want to move to a better equilibrium, such movement requires coordination (risky Pareto improvement). Thus, the problem of how the optimal social contract emerges is translated to how the population shifts from one equilibrium to the other.
Some authors have modeled the social contract as a prisoner’s dilemma game [
13,
14,
15,
16,
17]. The state where all individuals adopt defection is interpreted as the “state of nature”, as in Hobbes’ view of “the war of all against all”. Cooperation is interpreted as the social contract bringing order to society [
18,
19,
20,
21]. However, the prisoner’s dilemma fails to explain how individuals adhere to the rule of the social contract because the scenario in which all parties defect is the only state of equilibrium. The social contract has also been modeled as a hawk-dove game [
1]. The state of nature is represented by the mixed equilibrium where two strategies are randomly played, with the randomness mimicking the chaos of the state of nature. The social contract is interpreted as one of the two pure equilibria where each individual has their role in society: one is a the dove and the other is the hawk. In these equilibria, everyone is better off if they adopt the opposite strategy of their partner. Interestingly, behavior diversity is sustained because the hawk-dove game operates as a non-polarizing game. Although different games can be used to model social contracts, it has been argued that the stag hunt is more appropriate [
1,
10].
The payoff structure of the stag-hunt game does not answer how a society can jump from the local equilibrium with a low payoff to a better one. The analysis of the replicator dynamics shows that the two equilibria are local attractors, and the population cannot easily escape from them [
12]. Additional mechanisms must work to allow the jump. For example, the optimal equilibrium is facilitated if the agents exchange costly signals [
22,
23]. More specifically, if the game is the stag hunt, with strategies
A and
B, and the agents can send signals (arbitrary ones, denoted as 1 and 2), the individuals can take action according to a rule (if the signal is 1 they adopt
A, otherwise they adopt
B). Although no individual has previous information about the sign’s meaning, the communication introduces some correlations that facilitate the emergence of a better but riskier equilibrium [
22]. The social structure can also modify the nature of the game. If the agents control their interactions, individuals with the same strategy can interact preferentially and promote the new norm [
24].
To comprehend how equilibrium solutions are sustained, we must include one more element: social norms are the set of mutual expectations that uphold the equilibria of the social contract [
2]. Social norms have been used to explain human cooperation where monetary-based social preferences cannot explain empirically observed behavior [
25,
26]. In the social preference framework, cooperative behavior is explained by assuming that the individuals seek to maximize a utility function that takes into account everyone being paid off. However, social preference cannot explain some experiments. For example, in the ultimatum game, the responders reject the same proposal at different rates depending on the available options to the proposer [
27]. This result suggests that responders follow their personal norms instead of exclusively looking at the monetary reward [
28]. The reader can find a comprehensive review of moral preferences in [
25]. In these works, the focus is on using social norms to explain unselfishness in economic games. The evolutionary aspects of social norm evolution can be found in [
29,
30,
31,
32,
33].
Adopting a behavior that deviates from the prevailing norm can be challenging since individuals belong to social groups that exert pressure on them [
34]. However, some groups may give individuals more freedom to express novel behaviors and conform to their beliefs. Promoting diversity has been demonstrated to offer an exit from the trap of a negative equilibrium [
35,
36,
37,
38,
39,
40,
41,
42,
43,
44]. The encouragement of diversity can be modeled as a snowdrift game, where deviating from the partner’s strategy is the equilibrium solution. The game derives its name from a metaphorical scenario where two drivers are stuck in a snowstorm, and if neither shovels the snow, they cannot get home, but if both shovel the snow, they can go home quickly. However, if one shovels, the other can stay in the car, waiting for the job to be done. In the Nash equilibrium solution, one person shovels and the other stays in the car. To avoid any implication of antagonistic interaction, we will use the snowdrift game instead of the hawk and dove metaphor (both metaphors represent the same game). The snowdrift game introduces incentives that allow the coexistence of strategies in well-mixed populations and in structured populations [
45,
46,
47]. Thus, suppose that individuals play the stag-hunt game, which represents the social contract, and the snowdrift game, which represents incentives for diversity. In that case, we can ask to what extent promoting diversity (the snowdrift incentives) can shift the population towards an optimal social contract. Adopting these incentives may help individuals feel more comfortable in displaying new behaviors and conforming to their beliefs, breaking away from the pressure exerted by their social groups.
Here, we investigate how the dynamics of social contracts are influenced by incentives promoting diversity. Specifically, we use a stag-hunt game to model the social contract and a snowdrift game to model the diversity incentive. The population is partitioned into groups, and each individual belongs to a subset of groups where the stag-hunt game is played. We assume that there is one group where individuals are encouraged to adopt a strategy that deviates from the majority. In this group, the individuals play a snowdrift game. The strategies evolve through imitation dynamics, where those yielding higher payoffs spread at higher rates. Our results show that moderate snowdrift incentives are sufficient to shift the equilibrium towards the optimal social norm, which becomes stable even after the diversity incentives are turned off. However, if individuals interact with many others in different groups, more significant snowdrift incentives may be necessary due to overall social pressure. We also demonstrate that similar outcomes can be observed in populations structured in square lattices, where the stag-hunt and snowdrift games are played within a range of neighbors. Our analysis is supported by computer simulations and analytical approximations that allow us to explain the results using simple game theory concepts.
2. Model
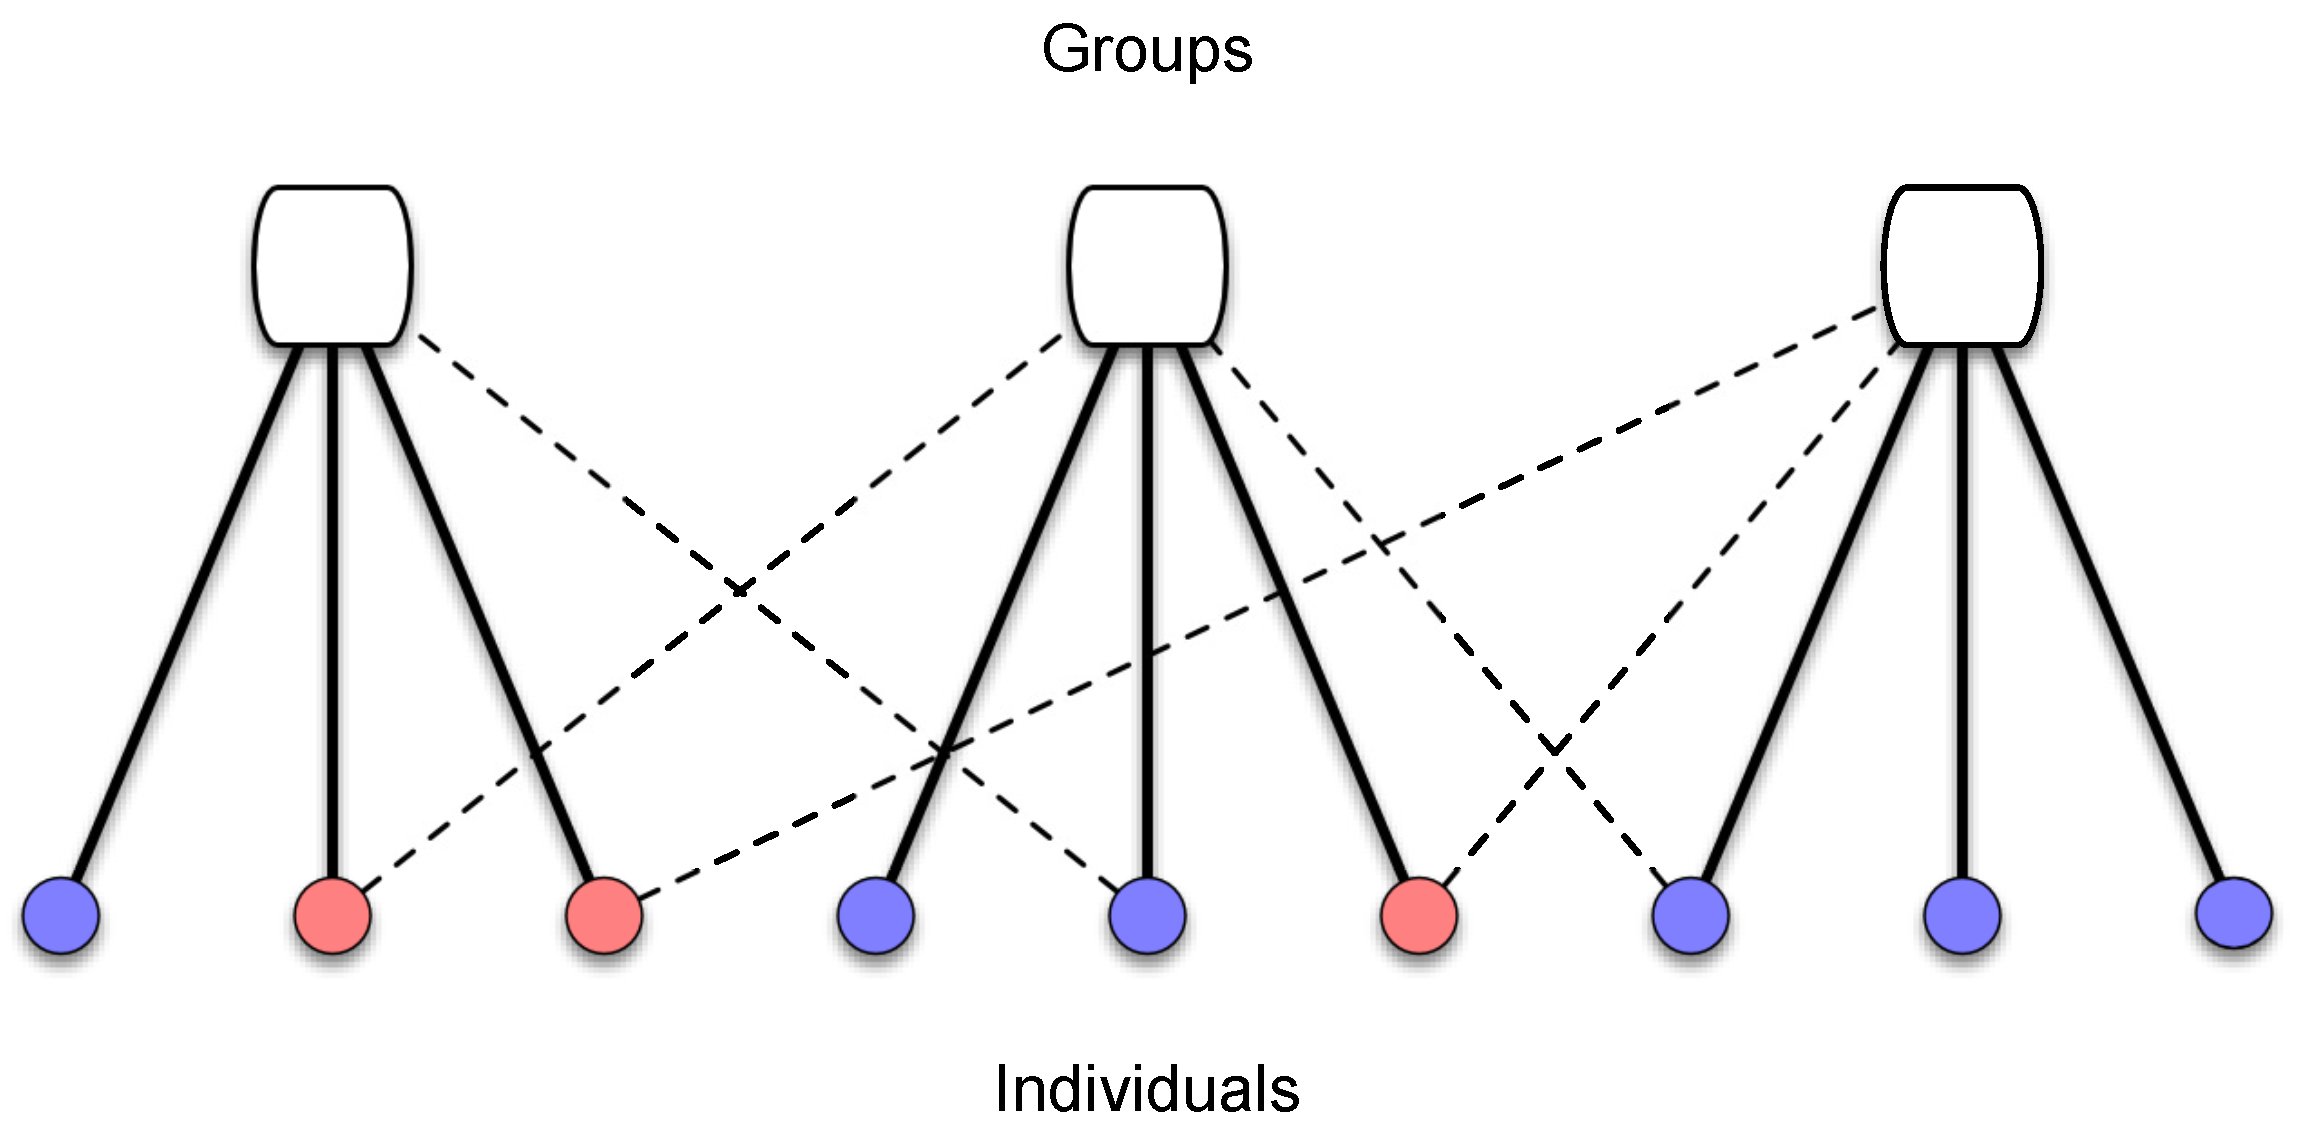
The population is structured in groups, and the individuals can have multiple group affiliations. More specifically, there are
n groups in a population of size
N. Each individual pertains to one group, which we call the focus group, and to a fraction
q of the other non-focal groups. An illustration of such a structure is shown in
Figure 1. The focus groups are defined by initially setting
individuals to each group.
The social norms are modeled as strategies in a stag-hunt game, which is played in all groups. The norm that yields the social optima is represented by
A and the other one by
B. Interactions of type
A-
A yield a payoff equal to 1, while
B-
B yields 0. If individuals with different norms interact,
A receives
(
) and
B receives
(
). The game is specified by the parameter set
and is represented by the following payoff matrix:
The best solution is to adopt the same strategy as the partner. Because , the norm A is the social optimum. However, if everyone is adopting B and a single individual moves to the social optimum A, this individual faces the risk of receiving , which is worse than 0.
The diversity incentive is modeled as a snowdrift game, which is played only in the focus group of each individual. The payoffs from snowdrift are parameterized by
, with
and
, and the snowdrift is represented by the payoff matrix:
The best solution is to adopt the opposite strategy to your partner. Notice that if strategy A interacts with strategy B, the individual adopting B receives , which is larger than the payoff that A receives, which is . That is, the diversity incentive is not benefiting the social contract A. As a last remark, the payoff obtained when both players adopt A is larger than that obtained when both players adopt B. However, this is not an issue because the diversity incentive is most important when strategy A is the minority.
The cumulative payoff of player
f is equal to the gains obtained in all stag-hunt interactions,
, plus the gains from all snowdrift interactions,
, with the latter weighted by the incentive strength
:
Notice that the parameter q determines the extent to which the stag-hunt payoff affects the cumulative payoff, which increases with the number of groups that an individual is connected to.
The strategies’ evolution is determined by imitation dynamics. A random player
f is selected to compare their payoff with a random player
z, which is connected to them. If they have different strategies, the first player imitates the strategy of the second one with a probability given by the Fermi rule:
where
K is the selection intensity representing the population level of irrationality. We set
to allow some level of irrationality but still maintain the effective selection of the most successful strategies. Our results are robust to variations of
K. However, if
K is too large, the payoff difference has a low impact on the outcome and the evolution become close to neutral evolution. Each generation consists of
N repetitions of the imitation step.
3. Results
The imitation dynamics can be analyzed using a mean-field approximation. For the simple case of one group (
), the mean-field equation becomes
where
x is the fraction of individuals adopting
A, while
and
are the average payoffs of individuals adopting
A and
B, respectively (see
Appendix A). For
, there is a single well-mixed group where all individuals play the two games. Thus, the cumulative payoffs are effectively determined by the sum of the matrices of the two games:
The analysis of Equation (
5) shows that there is an unstable equilibrium
, which is the solution of
, and is given by:
Let us first recall the main results for the stag-hunt dynamics by setting . If the fraction of A at time t is such that , because for x in that range, the population goes to the state (all B). If , the population goes to state (all A). Thus, if a small amount of A (a fraction ) invades a population initially at , as long as , the invader has no chance. The invasion must be large enough to overcome the invasion barrier determined by the unstable equilibrium .
On the other side, in the dynamics of a snowdrift game, new strategies can always invade. The analysis of Equation (
5) for a very large
, when the game is a pure snowdrift, shows that there is a stable equilibrium state, where
A and
B coexist, which is also given by Equation (
7). In this case, a small amount of
A invaders have the incentive to maintain their strategies and will spread in the population until the coexistence equilibrium is reached.
In the combination of both the stag hunt and snowdrift, the effect of increasing the incentive provided by the snowdrift game, which is parameterized by
, is to change the dynamics from that of the stag hunt to that of the snowdrift. If
is low, the weight of the stag-hunt payoff is larger, and the optimum strategy
A cannot invade. If
is too large, the dynamics change completely, being determined by the snowdrift payoff, where both strategies coexist. However, if
is moderate, more specifically, if
then, not only can
A invade, but it will certainly dominate the population. Equation (
8) is obtained by a simple Nash equilibrium analysis of the payoff matrix in Equation (
6), which coincides with the fixed point analysis of the replicator Equation [
48]. For
in this interval given by Equation (
8), the payoff structure becomes equivalent to that of a Harmony game, where
A is a global attractor of the dynamics. If the goal of the snowdrift incentive is to shift the population to the social optimum without ending at a coexistence equilibrium, then the moderate
solution is the best. Thus, if the incentive provided by the snowdrift is moderate, the optimal social contract can invade the population and persists even if the snowdrift incentive is turned off.
Still in the
case, the unstable equilibrium of the stag hunt determines the invasion barrier for the norm
A: the higher the value of
, the harder it is for
A to invade.
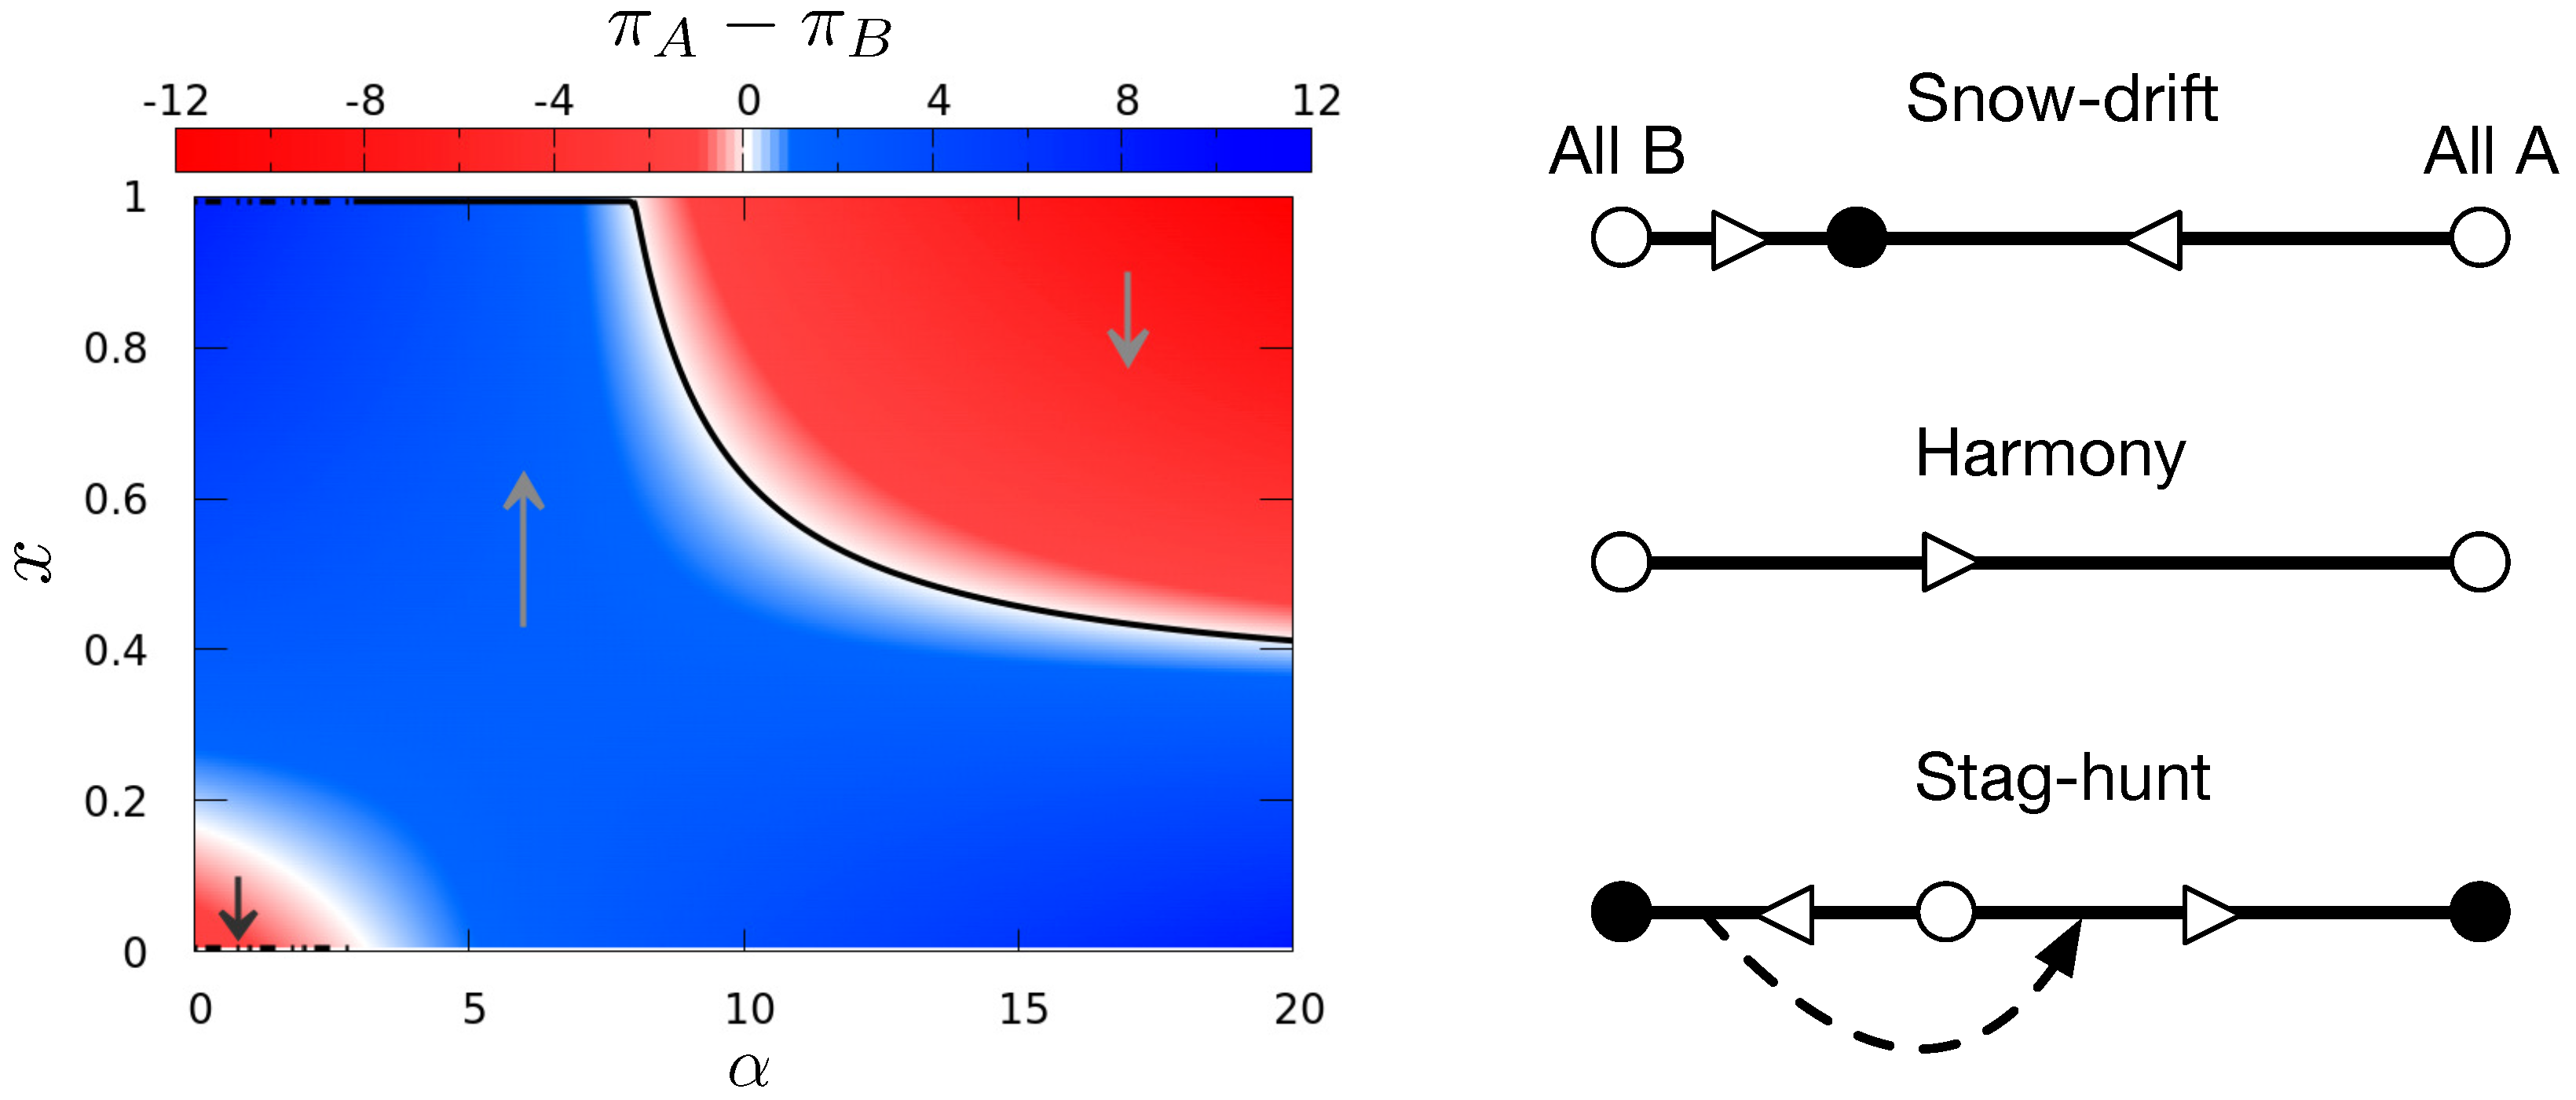
Figure 2 shows how the payoff difference
changes as the fraction
x of
A and the incentive
vary. If there is no snowdrift incentive (
), only a massive conversion of
A will drive the population to the norm
B. However, if a moderate incentive is provided, any initial fraction of
A will convert the population. As expected, if
is excessively large, the dynamics change and coexistence will be the final state, independently of the initial conditions.
In the general case, where the population is split into groups, a close look at the general mean field approximation (discussed in the
Appendix A) shows that the fraction of
A in each group tends to be near to each other. Thus, because all groups have roughly the same fraction of
A at any time, the analysis can be simplified to the analysis of a single group, the
case, with the average payoff matrix given by
where
is the number of groups where the stag hunt is played. The dynamics are now determined by the impact of the stag-hunt payoff relative to the snowdrift payoff, which is controlled by the parameters
and
q.
First, if the group structure does not change, that is, if
q is fixed, we would like to find the moderate values of the incentive
that turns the stag-hunt payoff into a harmony game payoff. The condition is given by
On the other side, if
is fixed, then the effect of the snowdrift incentive depends on the group structure. If the individuals play stag hunt in many groups (high
q), then the social pressure overcomes the snowdrift incentive and it is nearly impossible for
A to invade. More specifically, let us fix
, with
, so that if
, the snowdrift is dominant. In this case, increasing
means that more stag-hunt games are played. Thus, if
is too large, then the stag-hunt dynamics are dominant. However, if
then the effective game is the harmony game and the strategy
A can invade and dominate. In other words, only if the number of groups is moderate can the new social contract invade and dominate.
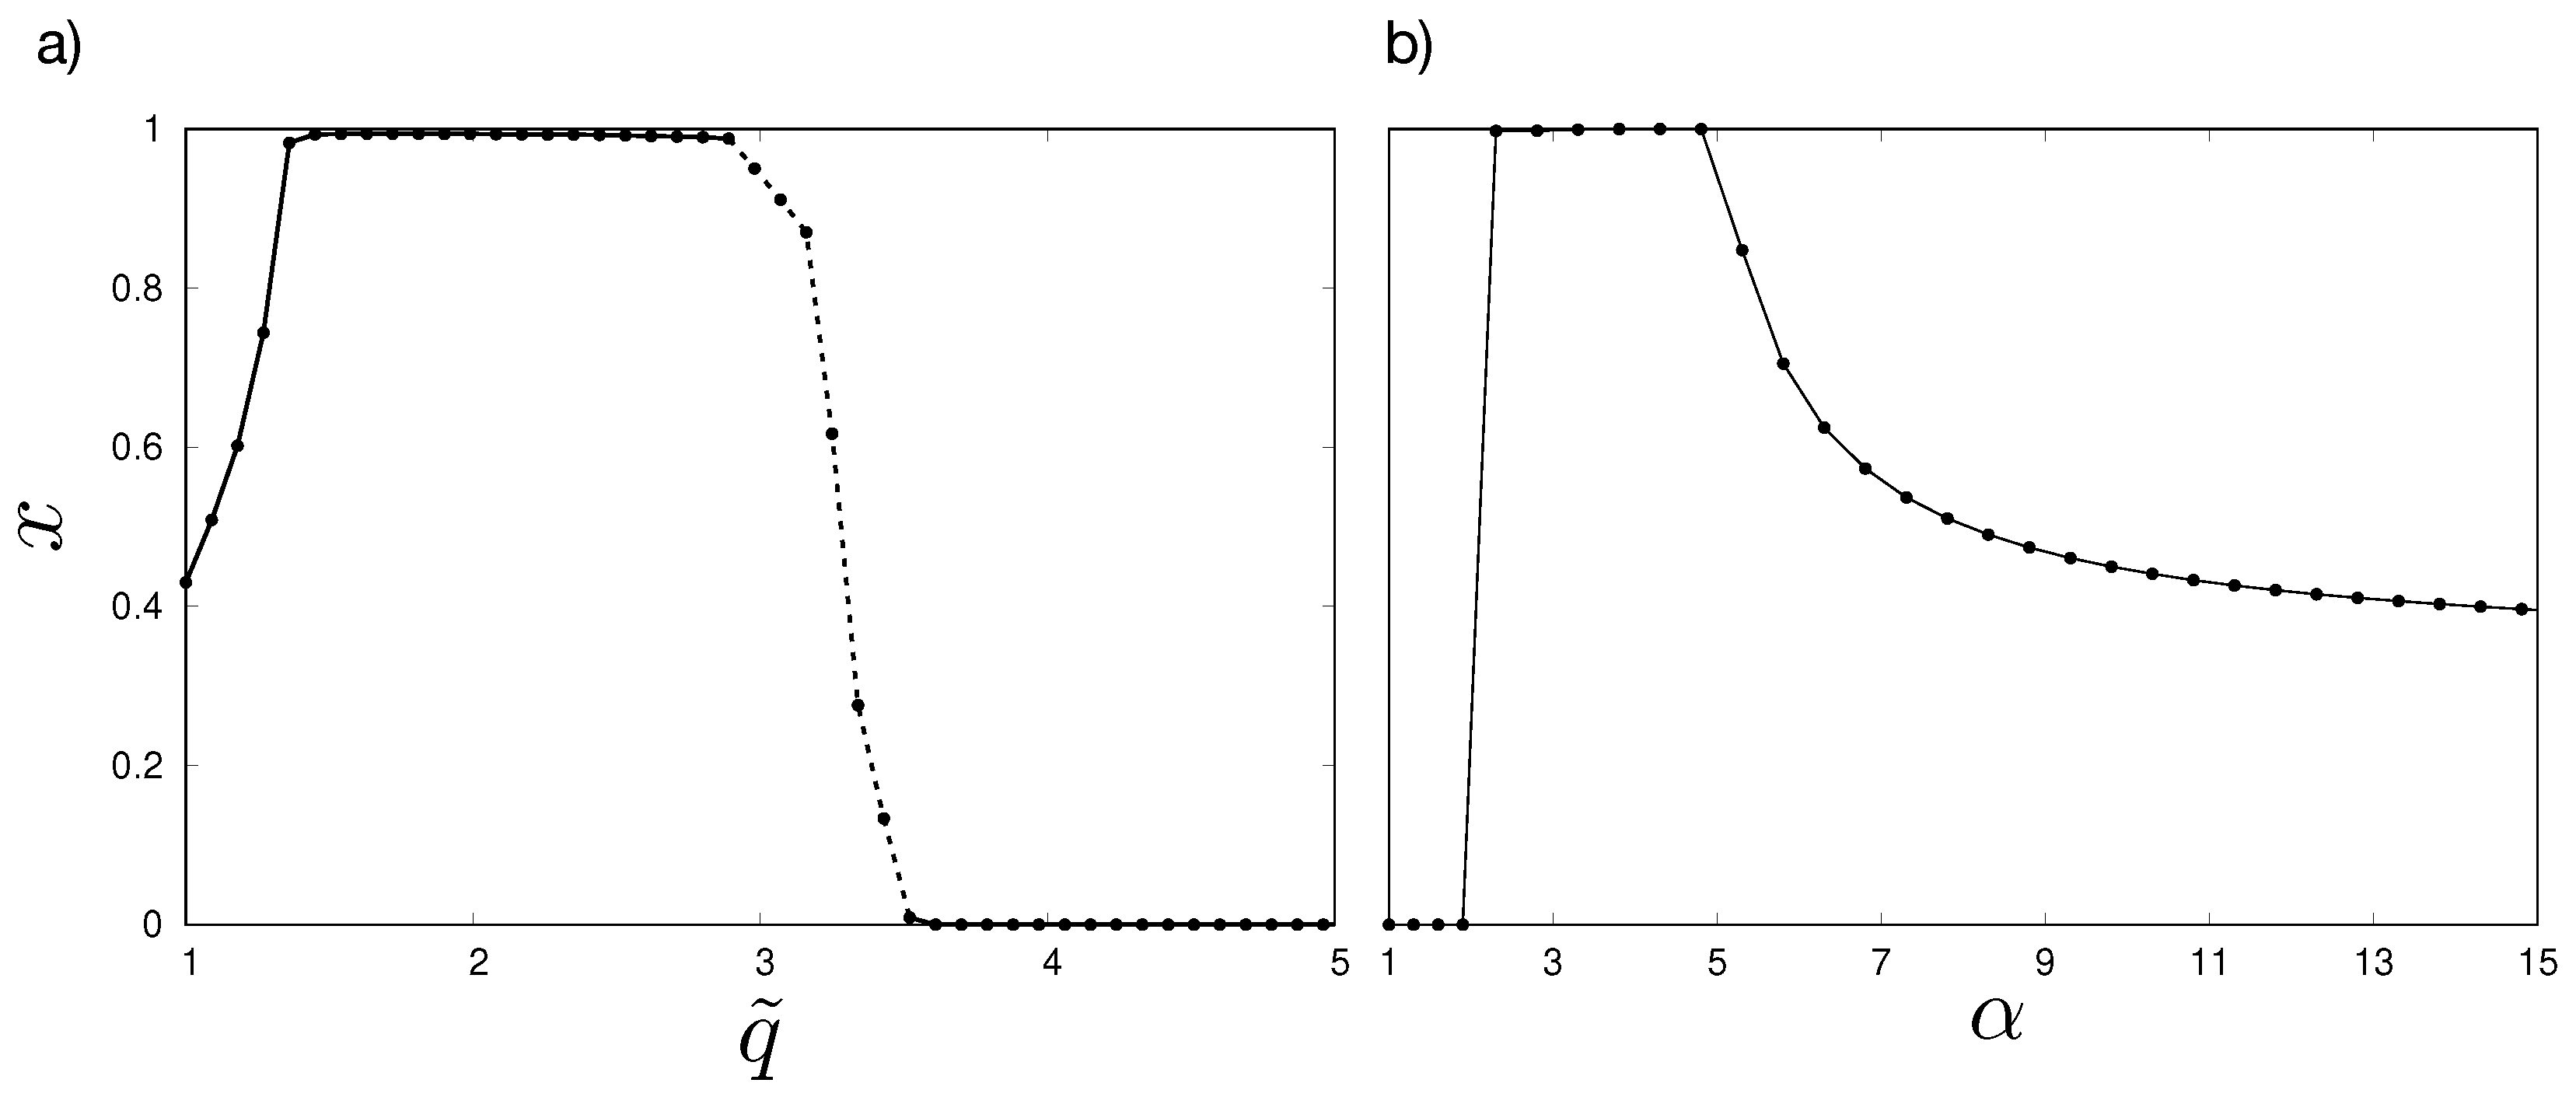
The simulations corroborate the mean-field analysis, as shown in
Figure 3a,b.
Figure 3a shows the equilibrium fraction of
A (the globally optimal social norm) as a function of the number of groups connected to each agent,
, while in
Figure 3b, the fraction of
A is shown as a function of the snowdrift incentive
. The optimum influence of the incentive
over the success of
A is felt for a moderate number of groups since
x is at its maximum value for intermediate
(see
Figure 3a). If the system is highly connected, then stag hunt dominates, and the social norm
A disappears when
is low. Notice that the incentive
has to be low to keep snowdrift from dominating the dynamics, as shown in
Figure 3b.
The effect of the initial fraction of
A,
, is shown in
Figure 4a,b. One can see that the initial condition
affects the equilibrium fraction of
A when the dynamics are dominated by stag hunt, which happens if the number of groups,
, is high enough (
Figure 4a), and if the snowdrift coefficient
is sufficiently low (
Figure 4b). Additionally, the minimum value of
necessary for preventing
A from being extinguished increases with the number of connections
, especially when the system goes from being poorly connected (
) to being moderately connected (
). This effect comes from the majority’s strategy strongly influencing agents’ strategies in stag hunt. Thus, when an agent plays stag hunt with most of its connections, they are more susceptible to adopting the majority’s strategy. However, the influence of
for the persistence of
A weakens as the snowdrift incentive
increases, i.e., when the local interactions that encourage different opinions become more important, as can be seen in
Figure 4b.
The mean-field approximation is valid only if the size of the groups is large. If small, fluctuations play a major role and the mean-field approach is not precise. Even so, we see that strategy
A is facilitated for moderate values of
q, as shown in
Figure 5, for all population sizes. Notice that, for small population sizes, the average values in
Figure 5 represent fixation probabilities and not stationary values. The reason is that for small sizes, the states where all individuals are either
A or
B are reached with a probability of one, independently of the game being played. The coexistence stationary solution is meta-stable even if only the snowdrift game is played. The mean-field behavior is recovered for the large groups.
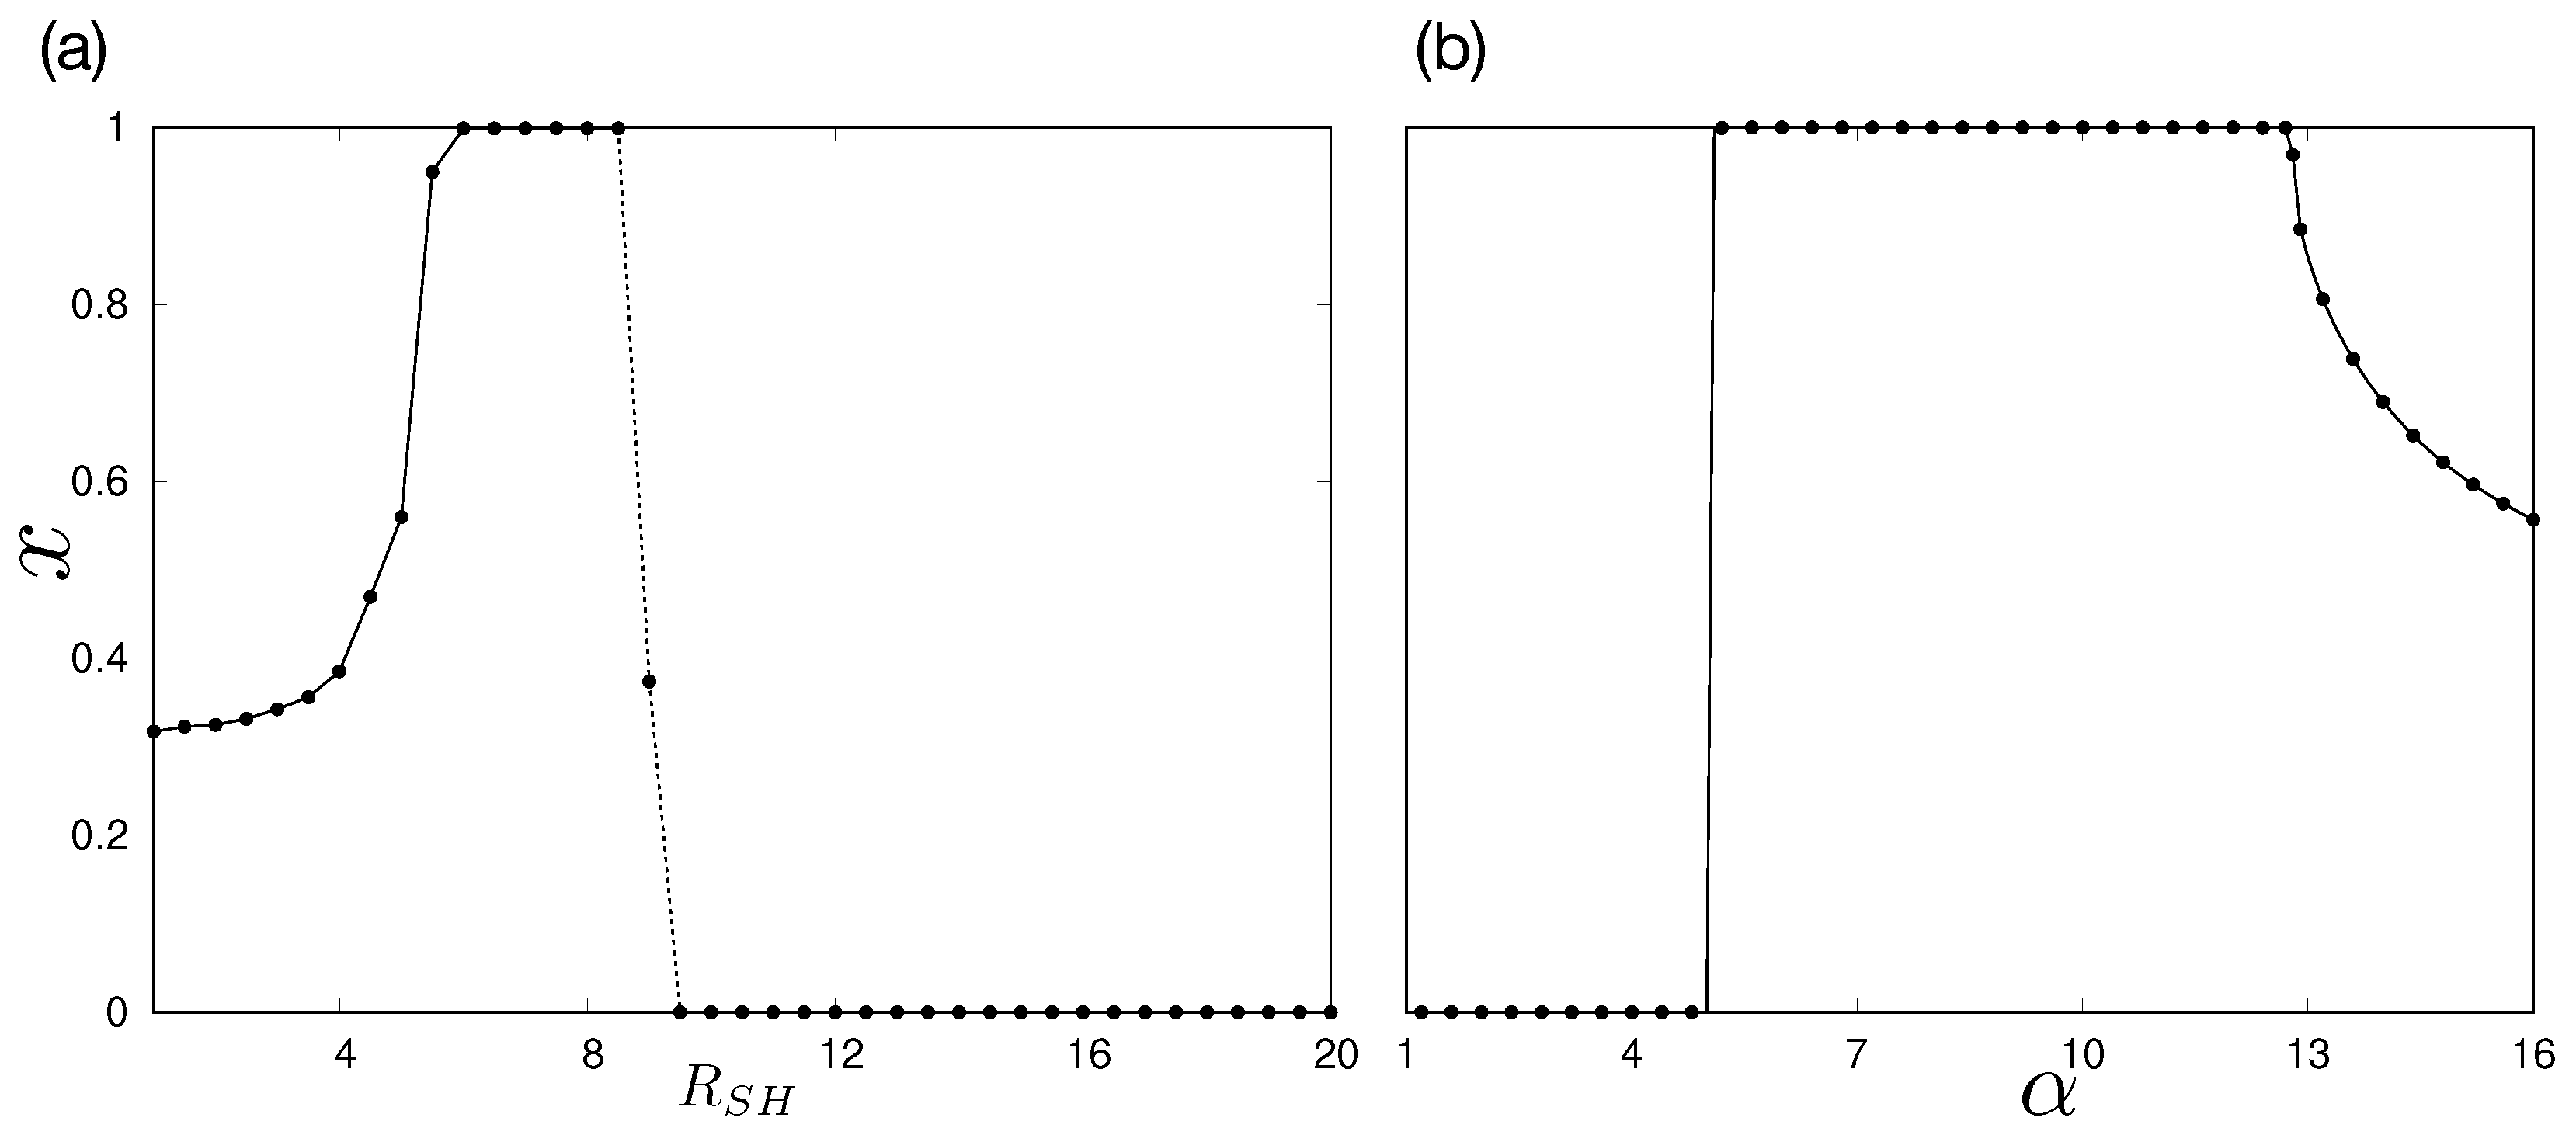
To further investigate the robustness of our results, we also consider a square lattice version of our model. Each agent occupies a site in a square lattice and plays stag hunt and snowdrift with all the sites within a range of for stag hunt and for snowdrift, with . The distance between two neighboring sites is set to be 1. The interaction ranges delimit groups and play a similar role to the parameter q in the previous version of the model.
In the square lattice version, the agents have weaker connections, since the clustering coefficient is always lower for this network than in the group-structured population. This difference could impact the results since the network clustering affects the spreading ability of the social norms. Despite such differences, the results for both settings are very similar.
Figure 6a,b show, respectively, the fraction of
A as a function of the stag hunt influence radius
and the fraction of
A as a function of the snowdrift incentive
. Similarly to the results for the group simulation (see
Figure 3), the incentive
most benefits the norm
A when the stag-hunt influence is limited but relevant. If
is way larger than the snowdrift influence radius
, then stag hunt dominates, and
A disappears for a low
. Additionally, the incentive
most benefits
A when it is not too large, and the system is not dominated by snowdrift.
In the analysis so far, the incentive
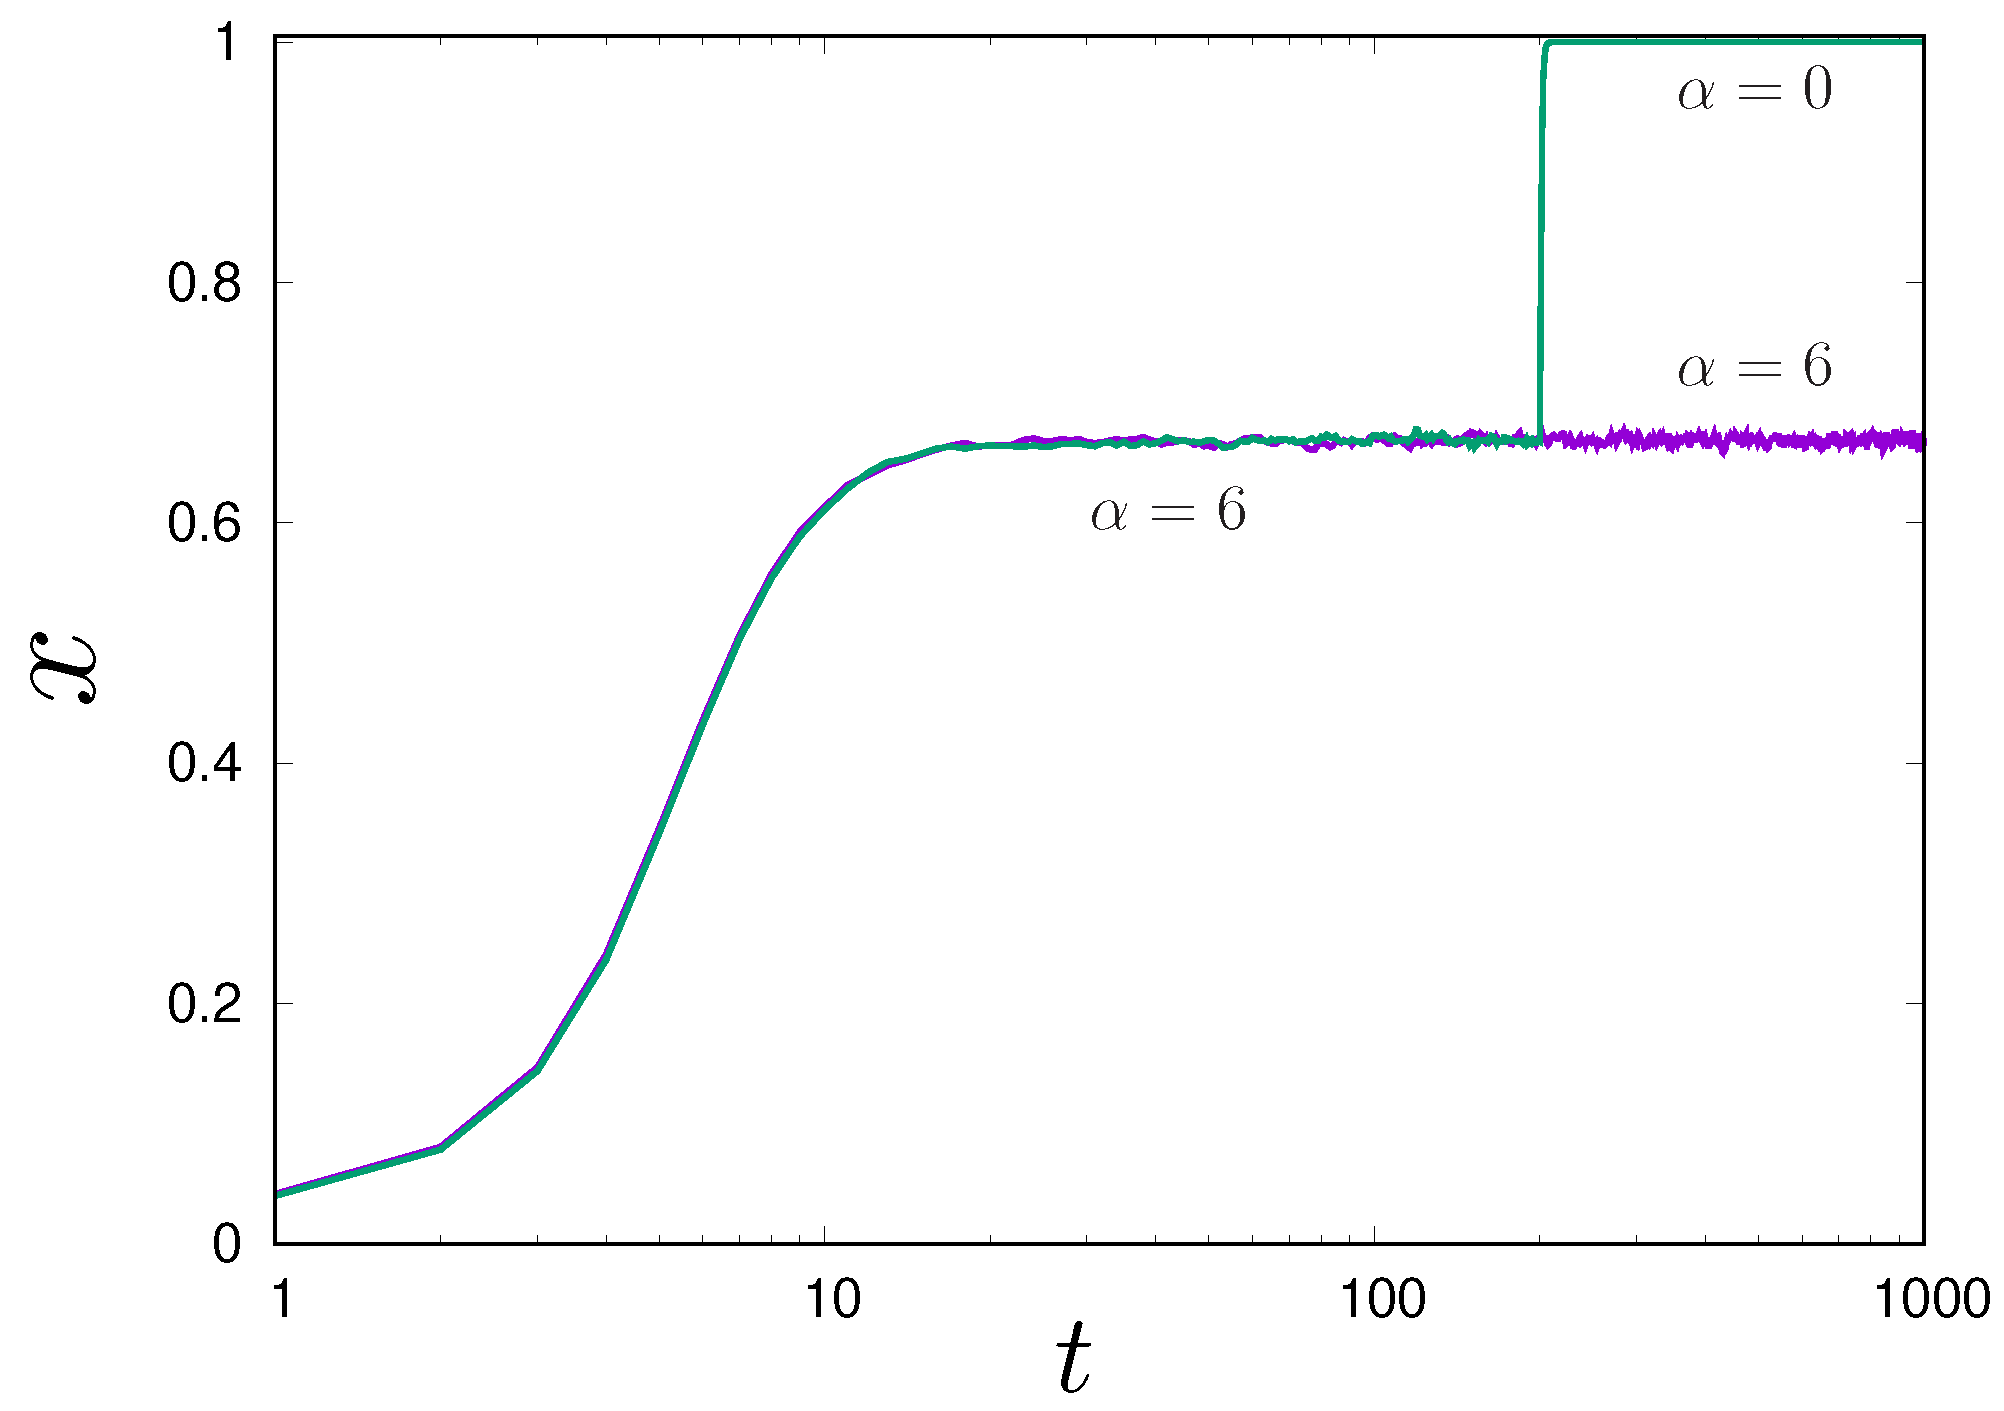
is kept constant throughout the evolutionary process. After the system reaches the new equilibrium, we may ask what happens if the incentive is turned off. Let us analyze a group-structured population with
. The dynamics of Equation (
5) for
are determined by the payoff from the stag-hunt game only, which has an unstable fixed-point given by Equation (
7), namely
. Let
be the fraction of
A at equilibrium for a non-zero
. If
is set to zero after the system reaches equilibrium, the population moves to
if
because, in this case, the population is in the basin of attraction of
A. In the limit of infinite
, the condition
for
is given by
A similar analysis yields the same conclusions for the
case and for the square lattice version of the model.
Figure 7 illustrates a typical result for the group-structured population.
4. Discussion and Conclusions
The persistence of social contracts can be attributed to the fact that it is typically disadvantageous to deviate from established norms, thus making it difficult for a new state of equilibrium to emerge, even if it offers greater payoffs. However, our findings indicate that introducing an incentive for diversity facilitates establishing a new equilibrium.
We use the stag-hunt game to model the social contract and the snowdrift game to model the incentives. Our model assumes that individuals have a close group of friends and trusted contacts, where they are more likely to adopt new norms. Our findings demonstrate that if the snowdrift incentive is more moderate, then the population is driven to the optimum social contract, which is an equilibrium even without the incentive. However, if the incentive is large, the population is trapped in a mixed equilibrium where the old and new social contracts coexist. In this case, if the population successfully overcomes the stag-hunt invasion barrier, the incentive can be turned off, and the stag-hunt dynamics drives the population towards the best social contract.
The coexistence equilibrium that is reached for a large
can be viewed as a new social contract where diversity is more valuable than the homogeneous situation where everyone adopts the optimum social norm. This is a fascinating aspect of how social contracts evolve. Equilibria are reached by the voluntary actions of individuals seeking the best possible payoff, and unexpected equilibria may be found in the path towards better social contracts. In Binmore’s theory, the author suggests the existence of a “Game of Life”, which is anticipated to have numerous equilibria [
2], making the path to socially optimum social contracts even more complex.
Our model does not account for social contracts that are group-specific. Instead, we assume that all individuals, regardless of their group affiliation, have equal options and obtain payoffs from the same stag-hunt game. Furthermore, as many societies regard diversity and inclusion as important moral values, we should stress that our model does not advocate against these values when we turn off the snowdrift incentive after achieving the new social optimum. We assume that moving to the new equilibrium is advantageous for all individuals involved. Consequently, the lesson is that policies promoting diversity can aid in coordinating actions toward new equilibria.
The method of evolutionary game theory is very abstract, as it reduces the complexity of social phenomena into a payoff matrix that governs the strategies’ reproductive rates. Further work is needed to extend the theory connecting evolutionary games and social contracts. Vanderschraaf [
9] provides a critical review of the connection between the evolutionary game theory approach to social contracts and other specialized domains such as moral and political philosophy. Our study contributes to this area by examining diversity as a mechanism to shift the population to better equilibria. In the context of evolutionary game theory, we examined the circumstances under which the payoffs from snowdrift games played in a single group alter the fixed points of the population dynamics determined by the stag-hunt game.
Our work is based only on theoretical analysis. We do not conduct economic experiments with humans. The hypothesis that social contracts are equilibria of games can be investigated using economic experiments reproducing social contract contexts. However, it is well known that human behavior in experiments does not always conform to the predictions of rational choice theory. For instance, in public goods games, the predicted Nash equilibrium outcome is that participants would contribute nothing [
49]. Nonetheless, numerous experiments indicate that participants tend to initially contribute about half of their endowment, decreasing their contribution over time before ultimately settling it on a non-zero amount in the final rounds [
50,
51]. Contributions may increase in the presence of mechanisms such as communication [
52], punishment [
53], and reward [
54]. Therefore, the claim that social contracts are equilibria is based on theoretical expectations that may not reflect actual human behavior. Moreover, the issue of external validity in experiments raises questions about the extent to which behavior observed in experiments reflects the actual behavior observed in natural conditions [
50]. As a result, additional research examining the empirical foundations of the evolutionary game theory approach to social contracts is still necessary.
Our findings have important implications. Scholars have suggested that contemporary society is transitioning from a social world marked by stable, long-term relationships to one defined by brief, temporary connections that alter the social contract [
55]. There has been a shift in the collective social understanding concerning family values and job security, among other things. This shift may indicate that the social contract is eroding and that individuals are stuck in unwanted equilibria. However, our research implies that, if people are encouraged to play differently, at least in one group, society could progress towards better social contracts.
Norms can be maintained through internalization, meaning that individuals follow the norms without even being aware of them [
56]. For example, feelings of shame and guilt can guide individuals to align their actions with social norms, even if they are not consciously aware of those norms. Suppose that there is one group in which individuals feel comfortable being different. In that case, they may be less likely to feel ashamed for not conforming, and diversity may be more likely to emerge. Norms can also be enforced by authority figures such as politicians or religious leaders recognized by group members [
56]. If these figures have an agenda to shift the social contract, they can incentivize diversity within their influence group. In both examples, our model shows that, if individuals have incentives not to conform, at least in one group, it can shift society towards a better social contract.
Changing social norms is a complicated matter, and we acknowledge that numerous factors likely influence the evolution of social contracts. Our research aims to illuminate one fundamental incentive structure: social norms do not encourage deviant behavior and policies that promote diversity and inclusion facilitate the emergence of different norms. When a block rests on an inclined plane held in place by static friction, gravity acts on it even if it remains stationary. Likewise, although there may be several other social forces, incentives for diversity and inclusion are forces pushing the population towards the desired social optimum.
