Abstract
Subscription decision in the telecom market is quite complex and cumbersome, invoking decision inertia in consumers and resulting in suboptimal choices. We implemented choice inertia and consumer interaction as an agent-based model to better understand the process. The model illustrates that with adequate peer interactions with active consumers, inactive consumers could overcome their inertia significantly and switch to a better alternative. Furthermore, the newly converted active consumers influenced their inert neighbors as a ripple effect. Active consumers contribute to firm profits and healthy market competition. Moreover, in environments with low neighborhood effects and a stronger inertia threshold, firms are able to maintain profits by retaining inert consumers. We show that apart from the attractiveness of market offerings, firms can benefit from understanding consumer inertia and devising means to reduce it.
1. Introduction
The subscription choice with mobile network operators (MNOs) relies heavily on choosing the best quality at the lowest prices. With advanced technologies in the postprivatization era of telecom, the quality of offerings across operators is now more or less homogeneous, and services are widely available across the national (and sometimes international) landscape. As a result, firms face pressure to reduce prices to maintain their market share of consumers. Therefore, the game-theoretic market competition models suggest that consumers switch to the better or cheaper alternative at any given time. Though many consumers exhibit this expected behavior, in reality, a good proportion of the market deviates from the ideal scenario. Studies on different markets have shown that consumers often fail to switch to a cheaper alternative, or, in general, they fail to select the best option available to them [1,2,3].
The Behavioral Economics literature attributes this departure from classical rationality assumptions to behavioral biases [4], often manifested as consumer inertia. In the context of telecom, the inertia is not only behavioral but also due to the complexity of the array of service offerings which are difficult to compare [5]. Research on telecom subscription decisions reported the deviation from standard expectations such as resistance to switching MNOs [6], bill shocks [7], and selection of sub-optimal options [8,9,10,11,12].
The deterrence or the inertia [13,14] to consider alternatives and switching to a better option is a combination of behavioral biases and associated switching costs [15]—the reluctance to switch arises from the perceived notion of a cumbersome switching process. Nevertheless, with improved technology and features such as mobile number portability (MNP), the switching process has been made very efficient [16,17,18,19]. This is readily agreed upon by the consumers who have switched their operators [5].
Nevertheless, even then, consumers often deter from seeking out the better option and stick with the suboptimal choice. Such reluctant consumers may benefit from additional information regarding available offerings, targeted messages, or word of mouth from peers. The former two options are under the discretion of firms’ marketing and advertising expenditure. However, the third, word of mouth or informal information propagation, may occur without any explicit influence from firms.
It is known that, in complex decision choices, consumers often consider their peer decisions or might require a certain amount of stimulus before taking action [20]. Telecom is a network industry that drives on the volume of subscribers. Furthermore, paired with its complex choice problem, it is not uncommon for the consumers to resort to the opinion leaders [21] in their network for a solution. The opinion leaders, in this context, are the active consumers in one’s peer network who can influence others’ decisions. Alternatively, the opinion leaders could also urge these consumers to overcome their inertia and avail the benefits that come with switching their operators. Several studies in different economic contexts have cited the influence of peer effects on an individual, for example, dietary behavior and obesity [22], academic grades [23], and distributed energy resources adoption [24].
In this study, we explore the extent of information propagation within consumer peer networks. The objective of the simulation is to experimentally investigate the pattern of neighborhood interaction and its potential effects on firm benefits. We implement a parsimonious, duopolistic-price competition setting for the telecom industry. The agent-based model (ABM) contains two types of agents: firms and consumers.
The two firms face the demand of the same consumer base in each time period. Assuming the homogeneity of the services, the firms strictly compete in attractive price packages.
On the other hand, the consumers join the market with an existing subscription to either firm. Their subscription decisions in subsequent time periods are based on the price difference of the offerings and their inherent inertia. The consumers respond to the option yielding them the highest utility. Consumer inertia is not static, and the influence of other active consumers can reduce it in the peer network.
We experiment with the price competition model by varying the inertia and strength of influence in the social network. Under this setting, we obtain interesting results. First, the firm or the industry greatly benefits from active consumers in terms of profit by volume. At low social interactions among the consumers, firms are able to retain profits through inert consumers. Second, homophily contributes significantly to a consumer to overcome inertia. Third, the strength of peer influence also should be considered besides the number of influencers in the network. This can be easily translated as the strength of the stimulus required for making a decision depending on its complexity and implications (purchasing candy vs. purchasing insurance). Our simulations conform to the findings of prior literature investigating the impact of peer effect on individual decisions. It is challenging to evaluate consumer inertia numerically. We contribute by replicating the interaction as an ABM and providing evidence of the behavior.
In the following section, we build on the theoretical background. The third section elaborates on the framework and the formulation of the ABM. In the fourth section, we present our results of the simulation and statistical analysis. The final section draws the outcomes and general conclusions with future research directions.
2. Related Literature
A network industry such as telecom poses complex decision choices for its consumers. The consumers need to consider multiple factors such as pricing of the services, whether the mobile–handset contract is more profitable than purchasing them separately, the device-to-connection compatibility (3G/4G device with 3G/4G-enabled SIM cards), comparing service providers and their tariff structures, and postpurchase customer service. The concerns are valid for both first-time consumers and existing consumers. With innovation in telecommunications technology, the services have been extensively upgraded since their inception. The market offerings have also evolved in tandem. The consumers process and analyze this information to varying degrees and associate certain psychological and physical switching costs with it. Sophisticated consumers, analogous to the early adopters in the diffusion model, would take the initiative to analyze the offerings and find the best fit meticulously. This is not necessarily the case for the naïve consumers or the imitators. Due to the cognitive overload and the combination of the behavioral biases mentioned in the previous section, these consumers would maintain a status quo with the suboptimal choice. The opinion leaders or influencers in a social network are able to provide the stimulus to others to overcome their choice inertia. In fact, homophily (the tendency of people to connect with others similar to them) plays a role in seeking out the opinion leaders or influencers in one’s social network. In this paper, the interaction in the social network of a consumer is determined by its spatial neighborhood in the ABM environment. The literature on social interaction provides evidence of neighborhood effects (neighborhoods can be residential, geographical, spatial, or peer group) on microeconomic phenomena [25,26,27].
Agent-based modelling is a popular technique for studying microeconomic models of social phenomena through simulation procedures [27,28]. The ABM literature has contributed to studying socio-economic subjects such as voting behaviors [29], epidemics [30], spatial settlement patterns [31], trade networks [32], and customer behavior [33,34], among others. In our paper, we are interested in studying the effects of social interaction on consumer switching behavior. The ABM captures the outcome of numerous individual-level decisions of consumers as the overall firm and industry profits. It accounts for the dynamic individual-level heterogeneity throughout the time horizon of the price competition.
The results of the simulations provide evidence to support the effect of neighborhood influence over individual purchase decisions and how it contributes to firms. We discuss the model and results in detail in the following sections.
3. Proposed Model
To illustrate the effect of peer influence on consumer decisions, we propose an agent-based model that studies consumer decision patterns in response to an exogenously set price competition. The agents’ decisions evolve over time based on neighborhood interactions.
3.1. Analytical Framework of Price Competition under Consumer Inertia
We implement the price competition model of Spiegler, 2011 [35], including the consumer inertia (modification of Stahl, 1989 and Varian, 1981 [36,37]) in our ABM. The model assumes a duopoly of MNOs with the homogeneous product. The interaction between firms is expected to continue for a finite time horizon until . For any consumer belonging to , the decision functions are given by:
and , where = cumulative representation of neighborhood influence
denotes consumer inertia
= threshold to overcome inertia
If, , consumers stay with Firm i
, consumers switch to Firm j
consumers are indifferent between choices and stay with their existing service providers.
From the classical Bertrand duopoly price competition model, the profit earned by a firm is given by . Consumers hold a preference for the cheaper offering.
When , , thereby rendering (assuming the firms operate at zero cost, ) and Firm j accumulates the entire market share.
Now, with the introduction of consumer inertia, the model modifies into,
when . Unlike the classical model, is able to maintain some of its original consumers. The existence of introduces the difference in consumer behavior from the Bertrand price competition. For , a consumer will not switch at the prospect of the availability of a cheaper alternative, contrary to the assumption of the neoclassical model.
At β = 1, the model converges to the Bertrand price competition. In the ABM, β is inherent to each agent or consumer, and they are unaffected by any external factor at the initiation of the price competition.
3.2. Agent-Based Model
The agent-based model reflects the duopoly price competition stated in the previous section. The model assumes competition between two existing mobile network operators with similar services. Therefore, each of the MNOs already holds a certain number of consumers with similar prices, since the firm i = 1, 2 offerings are homogeneous, and the consumers differentiate between them only by the price packages offered. Consumers prefer the lower price as the better alternative. We followed the guidelines of Rand and Rust, 2011 and Twomey and Cadman, 2002 [38,39] in designing the agent-based model. The ABM caters to two types of agents: the two firms and the individual consumers.
3.3. Firm Behavior
Mobile telecom offerings became exceedingly complex for comparison. The tariff rates no longer specify the charges only for calling, but they entail a bundle of calling, messaging, and data services with different validity periods. Consumers face decision inertia due to the cognitive load perceived from the task of comparing service bundles. With improved technology, the offerings across MNOs are of similar quality. Therefore, the market is left to compete on prices and intangible offerings (free extended subscription to OTT services and customization options). For simplicity, we restrict the firm-side action to replicate price competition as long as active consumers are present in the market. Our focus is on the consumer decision in the presence of social interaction, where the price competition acts as the trigger for the decision task.
In each time period, the firms are designed to engage in price competition. They respond to their competitor by reducing their price p by a small amount , i.e., where t is the time period. At time t + 1, the entire competitive process repeats. The firms continue the price competition until either firm reaches . For simplicity, we assume a fixed cost . The telecommunications industry is an infrastructure-heavy entity. It requires ample investment in infrastructural support and continuous R&D. The game-theoretic model assumes that each firm has sufficient bandwidth to serve the whole market independently, without a competitor. Therefore, fixed cost aids firms in deciding whether it is profitable to operate in the market or not. The firms are expected to face a volume–margin trade-off with price reduction in each iteration. The flowchart of the price competition is shown in Figure 1.
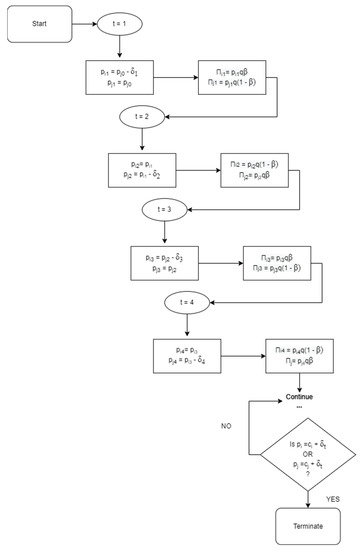
Figure 1.
Flowchart of the ABM process.
The total number of consumers q remains constant throughout the price competition game. The consumer base is split between two firms in each price-competitive iteration depending on the price set by them, individual inertia, and the resultant decision of each consumer. With the aforementioned competitive setting, the consumers are expected to flock toward the cheaper offering in each iteration. In reality, with the manifestation of inertia due to the reasons mentioned in Section 2, consumers often deter from rampant switching. We simulate the same behavior in our model by providing the consumer agents with inherent inertia. For simplicity, we do not explicitly account for the collusion scenario in modelling firms’ action space. The consumer decision function already accounts for the collusion case (both firms at a stalemate with the same price) with no reaction (i.e., they continue with their choice in the previous period).
3.4. Consumer Social Network
In the NetLogo environment [40], the consumers are represented by a finite set of agents . The agents have varying degrees of connections or neighbors. For this study, the connections are strictly determined by the Moore neighborhood, referring to the cellular automata literature. The Moore neighborhood surrounding a given cell, say is given by,
[41].
For Moore neighborhood range r = 0, 1, 2, 3, … the number of cells in the neighborhood is given by . In our study, we consider r = 1, such that each cell can have a maximum of 9 – 1 = 8 neighbors, and they can interact with each other.
The diagram above (Figure 2a) illustrates the neighborhood schema (r = 1) used in the ABM. The surrounding 8 white cells (or agents) are the neighbors of the blue cell (or agent) in the middle. Consumers with β ≥ threshold are capable of influencing consumers with β < threshold within their network. For a visual representation (Figure 2b), we use the dotted lines to show the active consumers in a neighborhood. The weight of the dotted lines directly translates into their lack of inertia or propensity to switch in the presence of a better alternative. Among all the neighbors, the agents with similar subscriptions strongly influence the inert peer. This setup is to induce homophily among the agents. Moreover, the interaction is unidirectional, i.e., only the active agents can influence the inert agents.
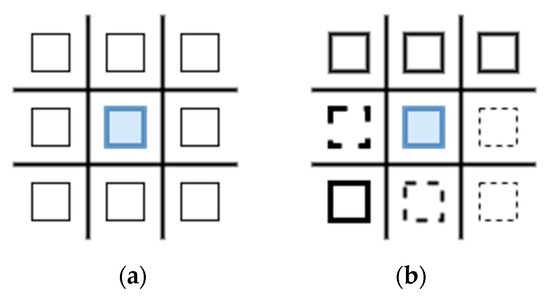
Figure 2.
(a) Normal neighborhood structure. (b) Neighborhood of agents with varying degrees of inertia.
3.5. Decision Rule
Individual inertia is not static in nature. Therefore, consumer behavior may change over time in response to exogenous factors. Peer influence, word of mouth [42], advertisement, and communication play a role in modifying consumer decisions. In our case, this modification is basically the agents overcoming their inertia to seek a better alternative. We consider the effect of peer behavior or word of mouth of the peer group to influence the inert consumers over time until they overcome their inertia.
The decision of an inert consumer to switch is determined by the strength of the peer influence and the number of peers who have switched to the better alternative. The role of the inerts and influencers are analogous to the imitators and adopters in the diffusion model, respectively [43,44]. The model assumes that only the influencers can affect the inertia of the inert consumers. Additionally, the decision rule also dictates that, once the inert consumers overcome their inertia, they will not revert to their inert selves again. The process continues until the price competition terminates. This design incorporates the information propagation or peer effect in a social network [45,46].
Figure 3 illustrates the interaction and change in inertia. Figure 3a shows the basic Moore neighborhood setup used in this study. In Figure 3b, the two colors indicate the individual subscriptions of the consumers to two MNOs. The individual-level inertia of the consumers is presented in Figure 3c. The weight of the solid lines is proportional to the strength of inertia, and the same logic holds for the active consumers identified by dotted lines. At , the initial setup in Figure 3d transforms into 3 out of 5 consumers of switching to as in Figure 3e. The inertia of the rest of the 2 consumers is reduced but not sufficient for the switch. The exact conditions continue for both firms until the price competition terminates. The same process is followed in the ABM.
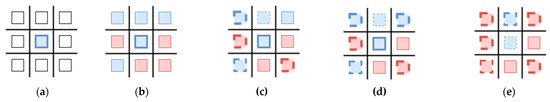
Figure 3.
(a) General setup, (b) Blue and red cells represent subscription to firms i and j, respectively. (c) Different types of cell borders denote varying degrees of inertia (details below). (d) Price competition at and (e) resulting changes in consumer inertia and subscription due to neighborhood interaction effect.
4. Results
4.1. Simulation
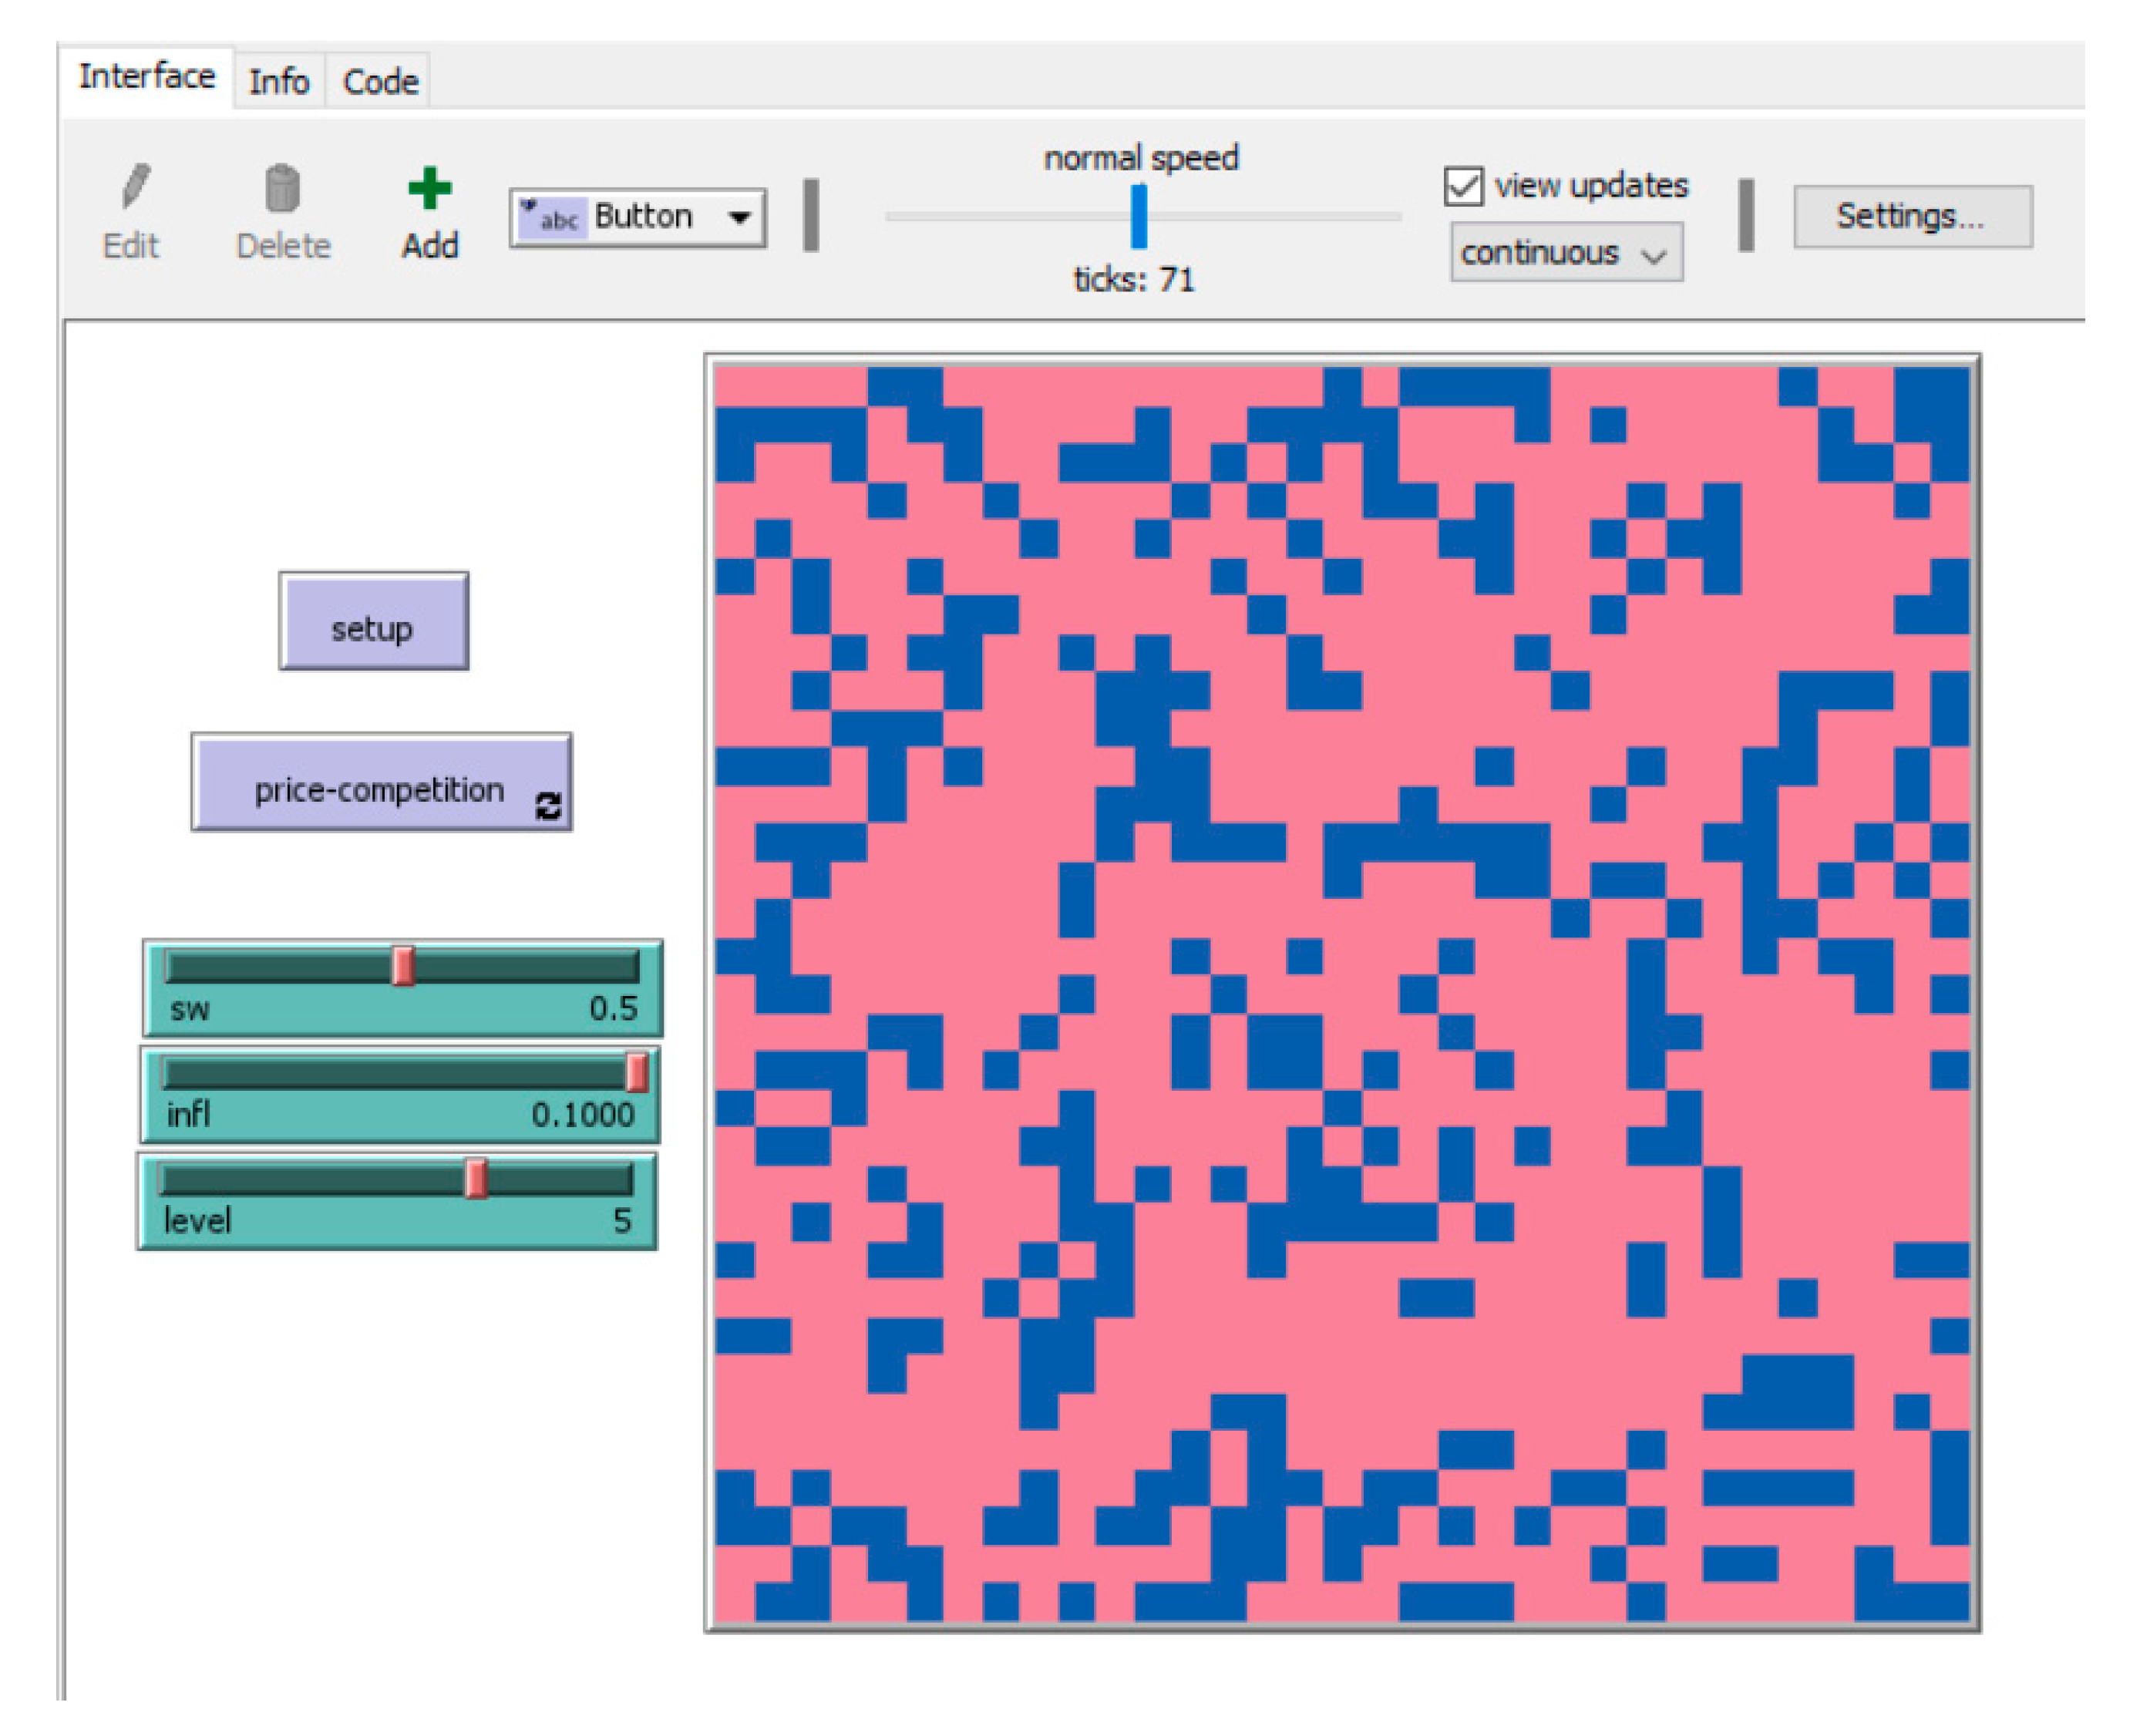
The agent-based model is set to simulate the price competition under dynamic consumer inertia. We experimented with the neighborhood effects by manipulating the three model parameters: (a) neighborhood influence, (b) the number of noninert peers, and (c) inertia. For simplicity, we mention them as the ‘neighborhood interaction’ parameters. Consumers compare the alternatives based on their decision functions. They can either switch in the presence of a better alternative or maintain the status quo if their current choice yields maximum output. We conducted regular code walkthroughs with a professional programmer to review the ABM program. The model is examined across several test cases to ensure the validity, reliability, and efficiency of the coding process and also to scan for any potential bugs. A sample of the NetLogo program instance is shown in the following 2 figures.
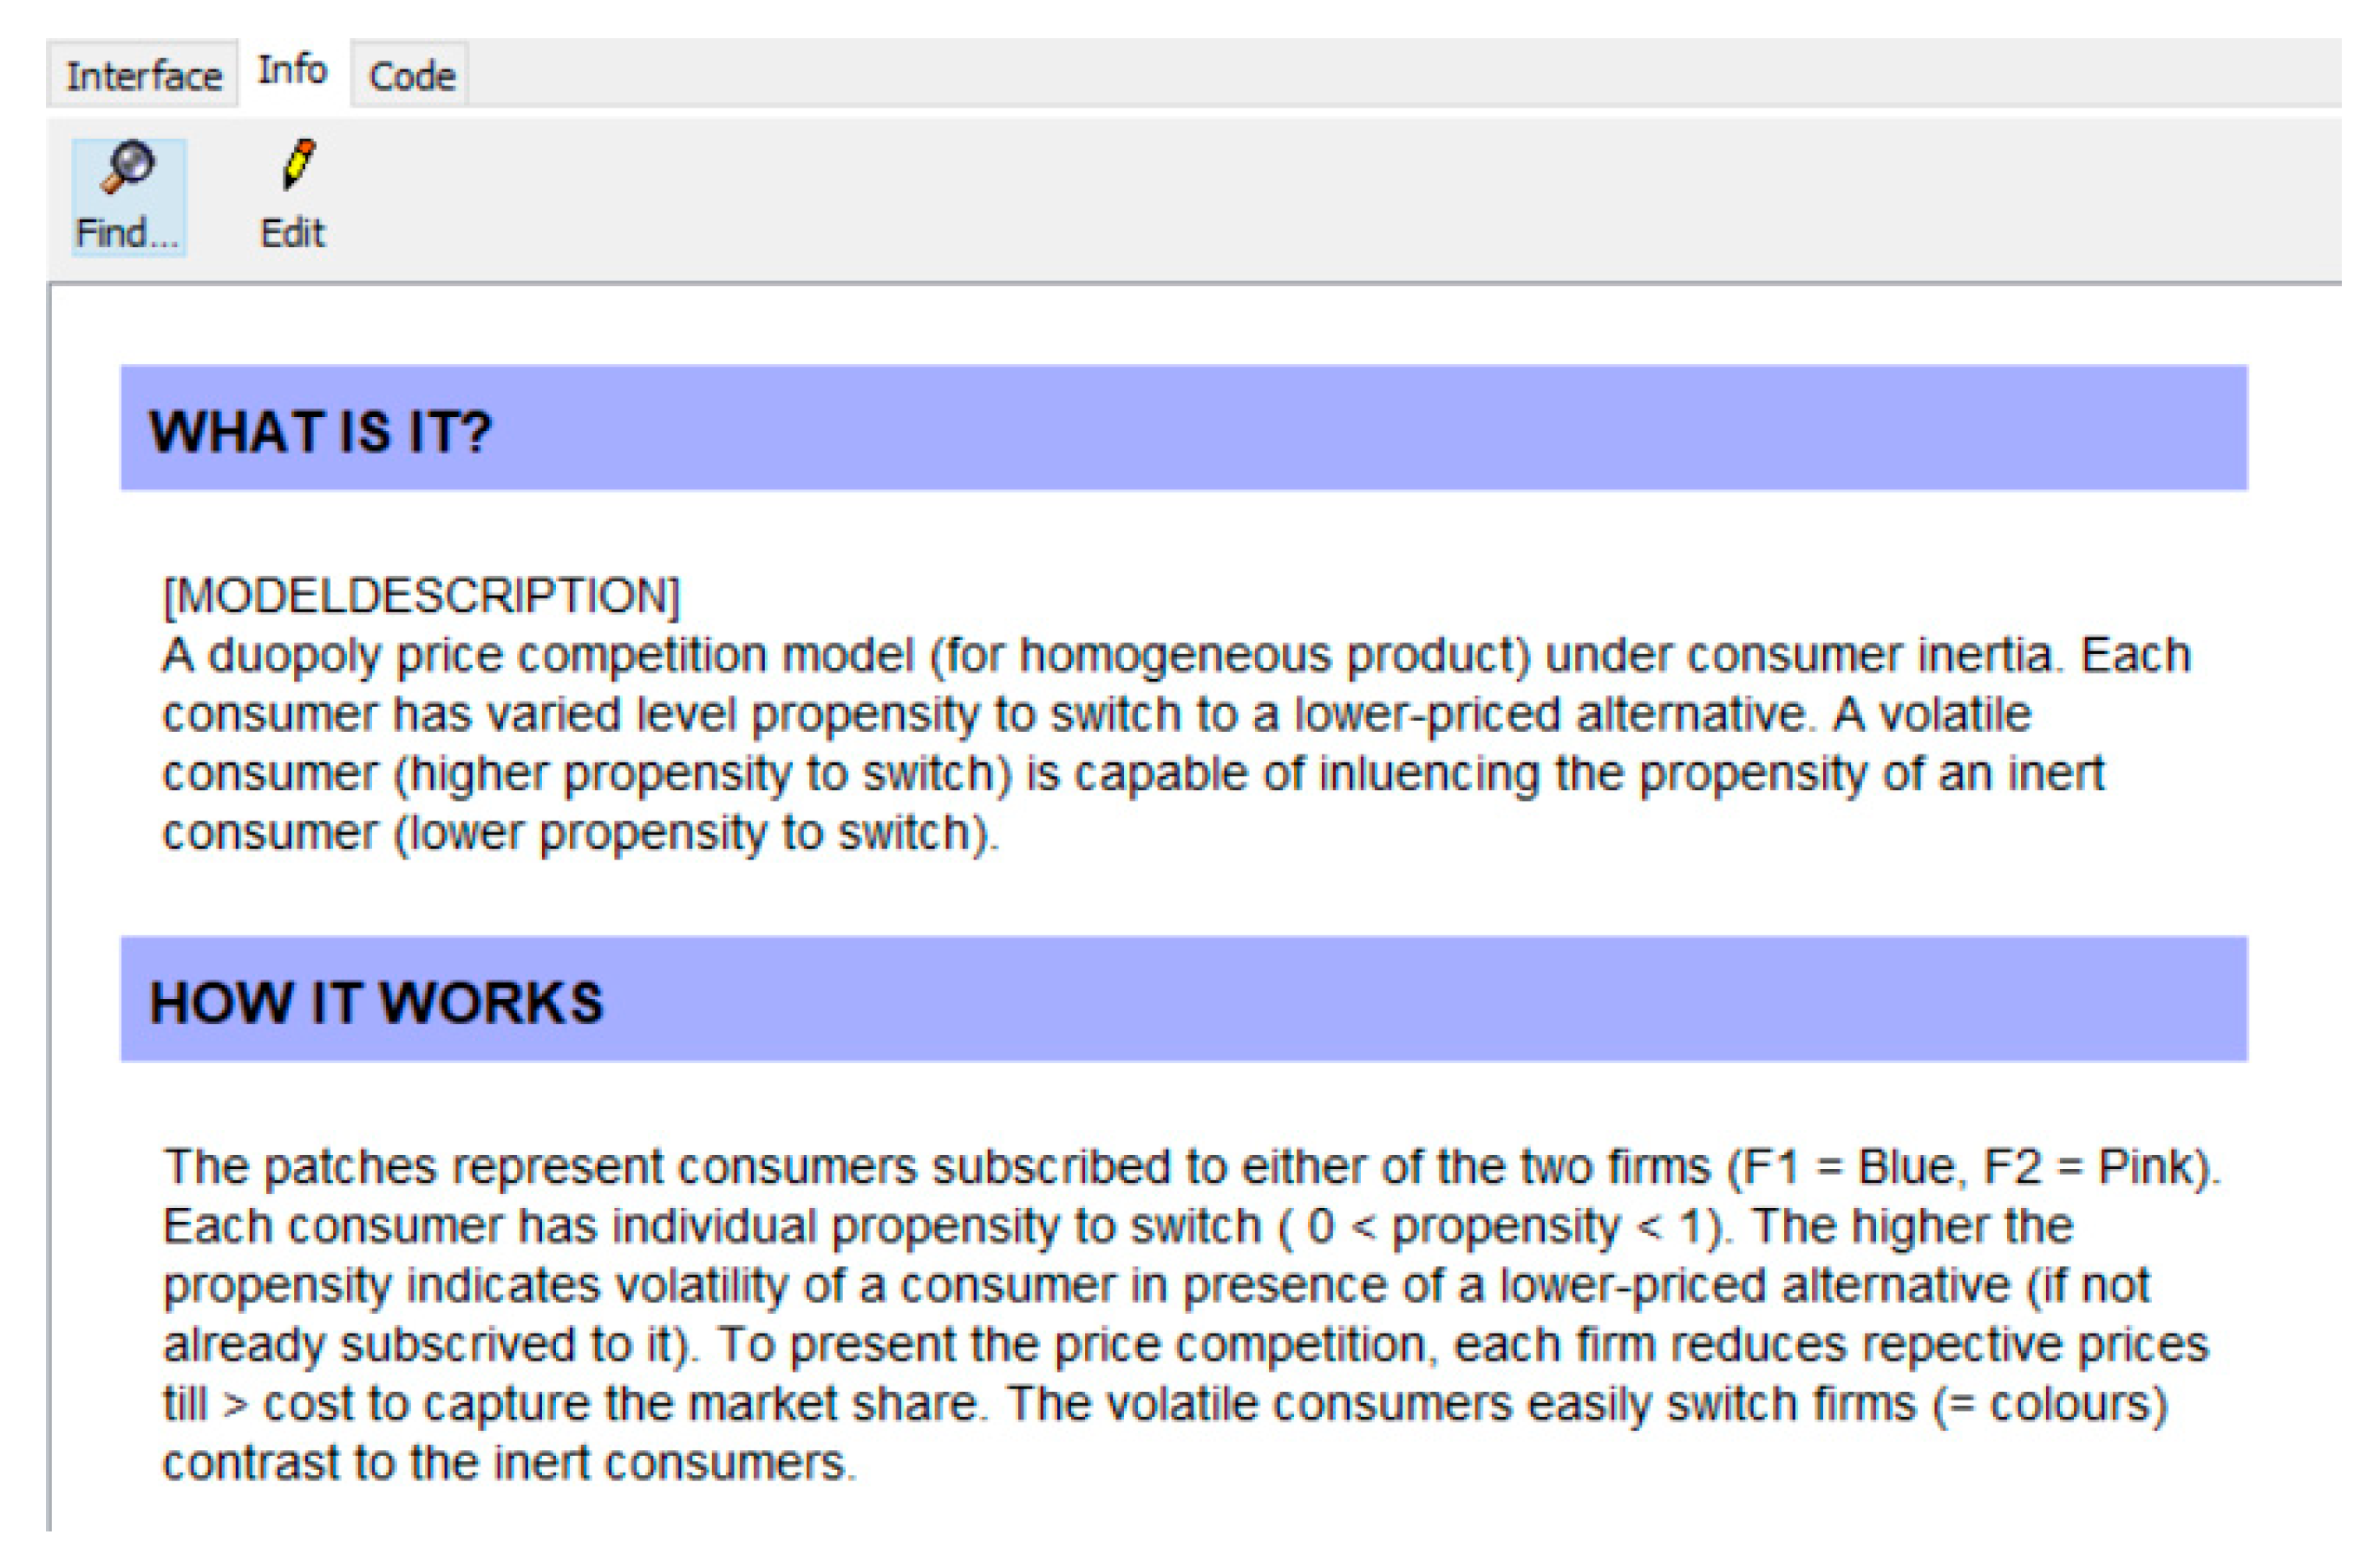
Figure 4 shows the visual representation of the ABM on its graphical interface. It provides interactive buttons and sliders for dynamic control of the simulations (as opposed to the hard-coding of parameters). Figure 5 captures a snap of the Info window, which allows programmers to maintain the documentation for the program in brief.

Figure 4.
NetLogo window of the ABM program.
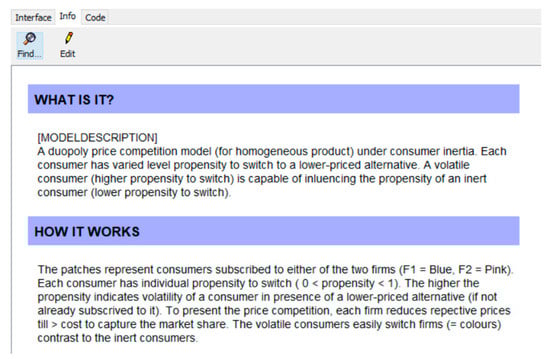
Figure 5.
NetLogo Info window.
The models were tested for low, medium, and high levels of neighborhood influence with seven levels of influencer group in the Moore neighborhood setup. The inherent inertia is simulated in nine distinct levels (low–high). The combined effect of the variables determines the peer effect to reduce the inertia of inert consumers located around the active consumers. We used the BehaviorSpace tool in NetLogo to conduct the simulations 10 times for each combination of input parameters.
Table 1 shows the individual variable level manipulation and the resultant number of combinations of the simulation experiment. The experimental runs totaled 1890. The results are extracted and tabulated for further statistical analysis.

Table 1.
ABM experimentation parameters.
4.2. Model Output
We tested our models in two aspects. First, to test for the inertia dynamics, and second, the changing response to the price competition game.
The inertia dynamics were tested by analyzing the influence of the neighborhood interaction parameters on the resultant number of active consumers at the end of the game. The number of total active consumers denotes the sum of the inherently active consumers and those who overcame inertia throughout the game. The regression equation is given by:
The relationship was found to be statistically significant with a satisfactory R-squared value (Table 2). The result indicates that the number of active consumers participating in the price competition is determined by the interplay of the independent variables.
Table 2.
Consumer inertia dynamics.
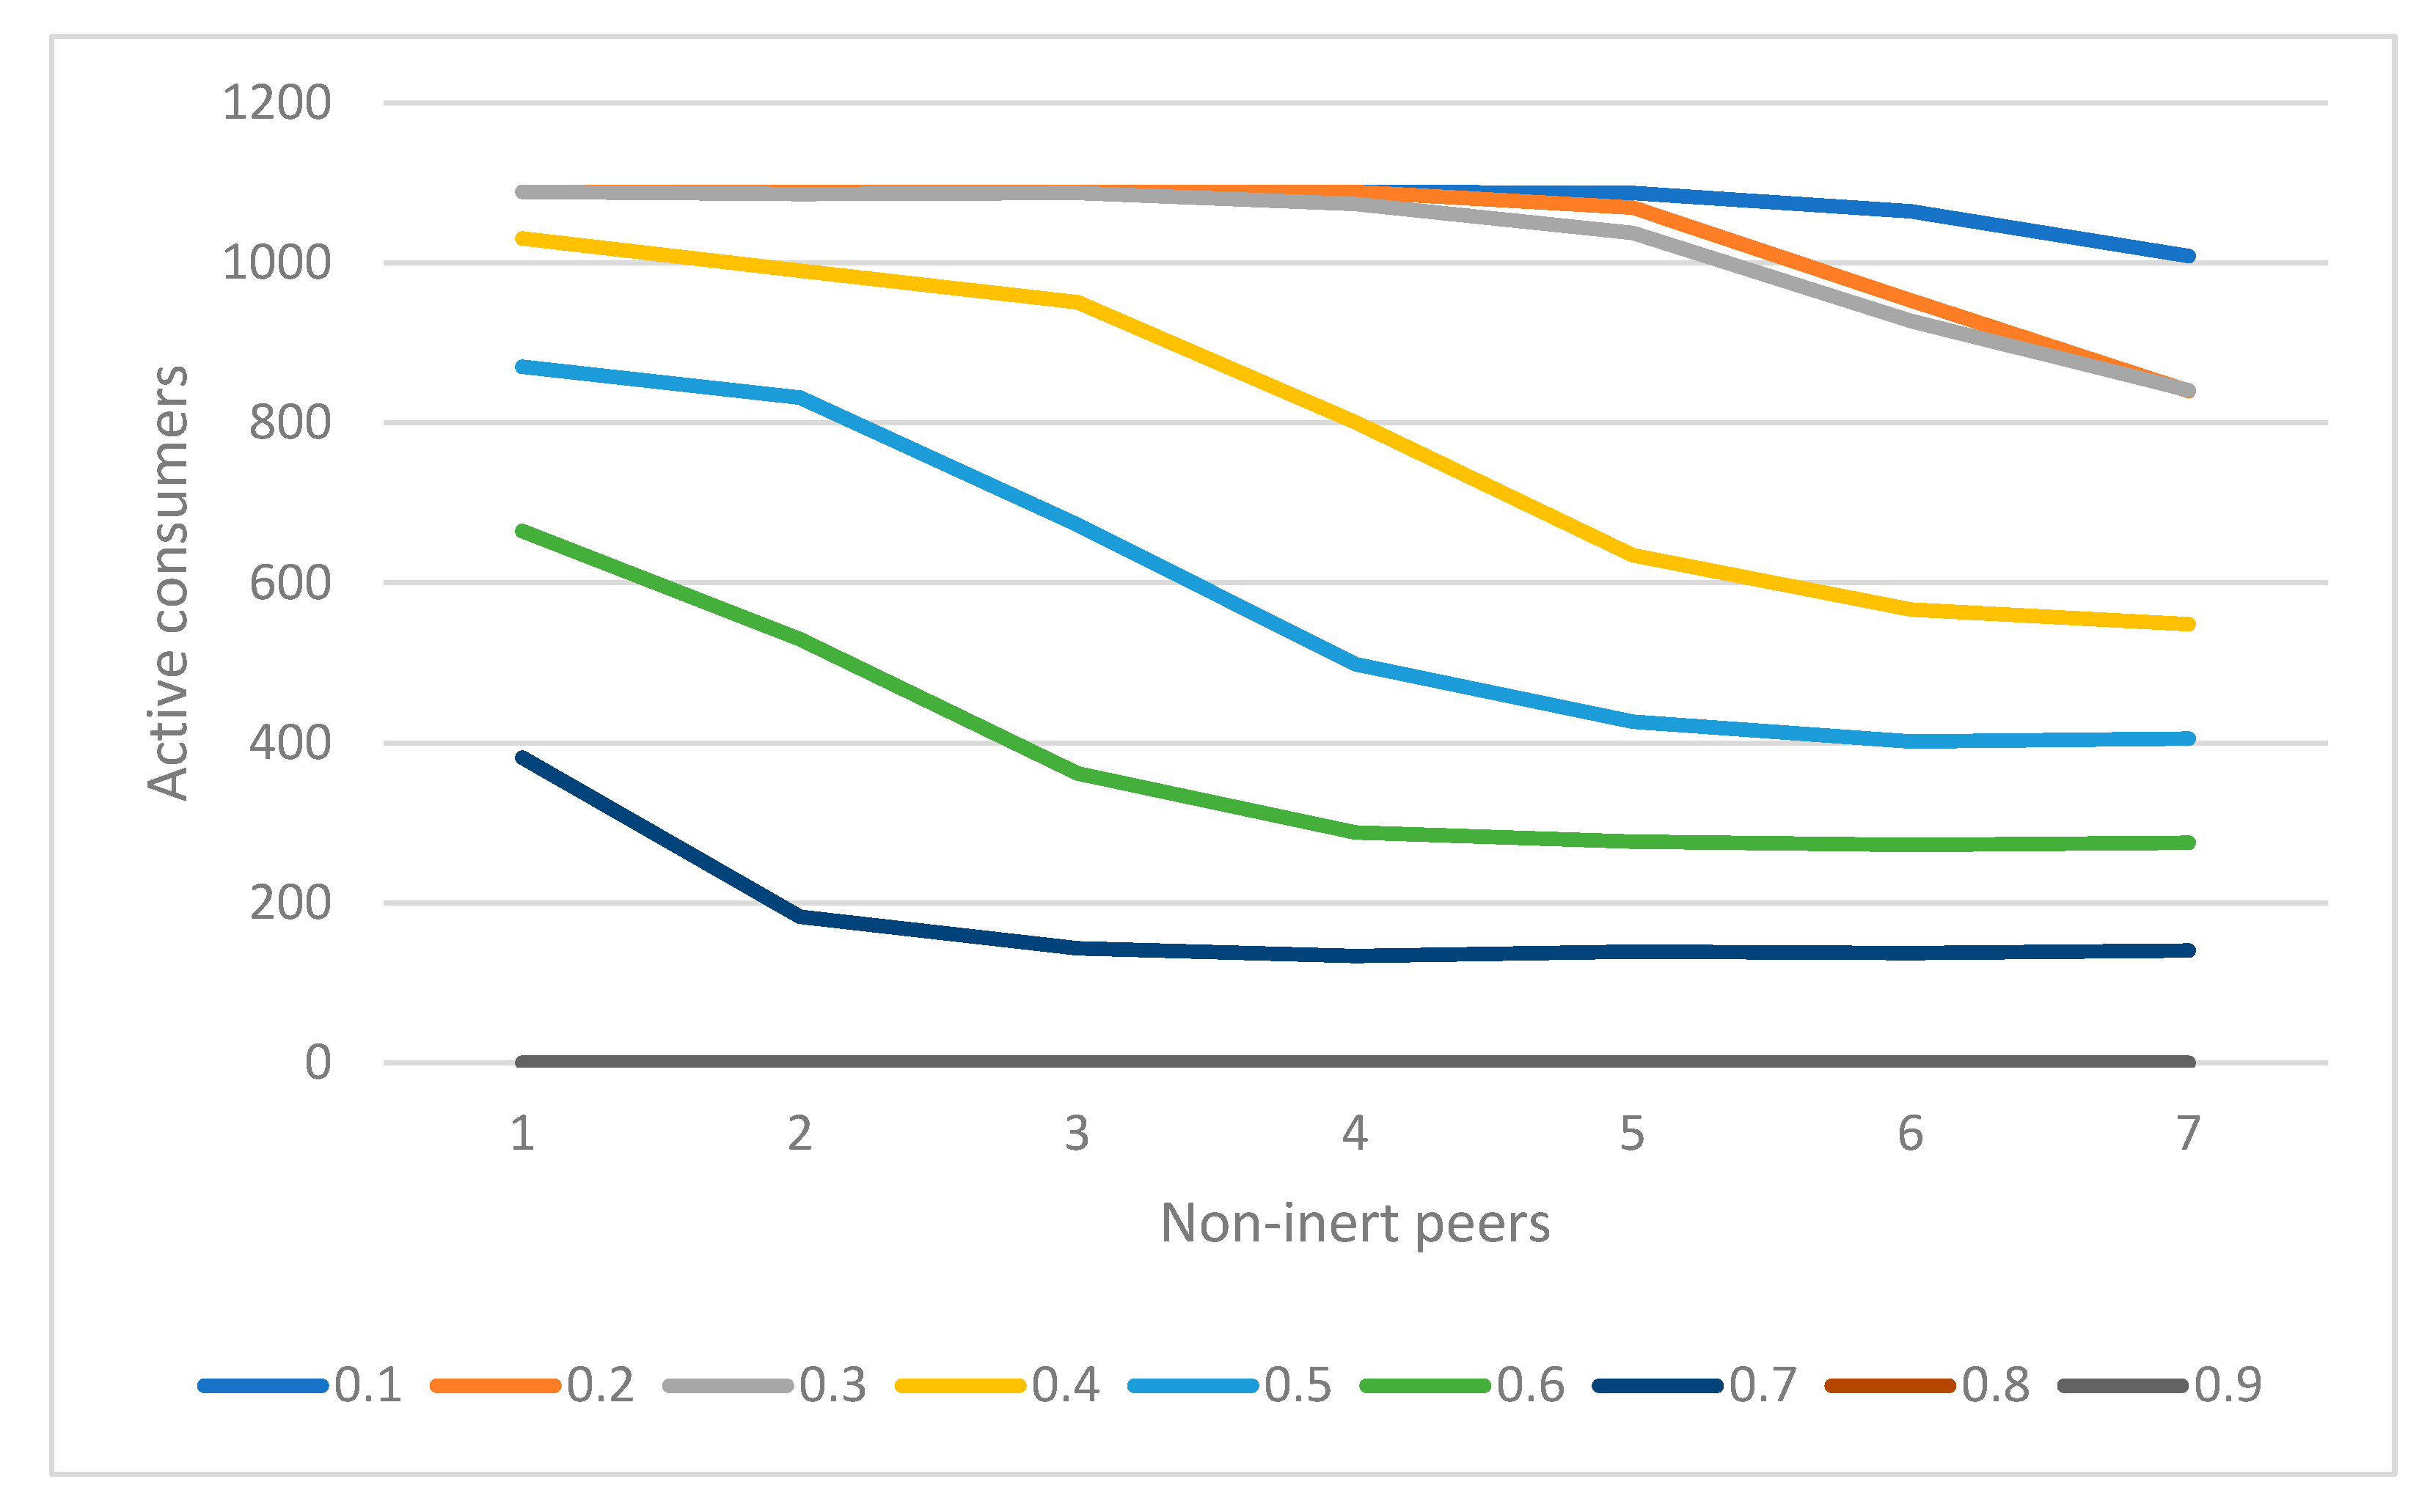
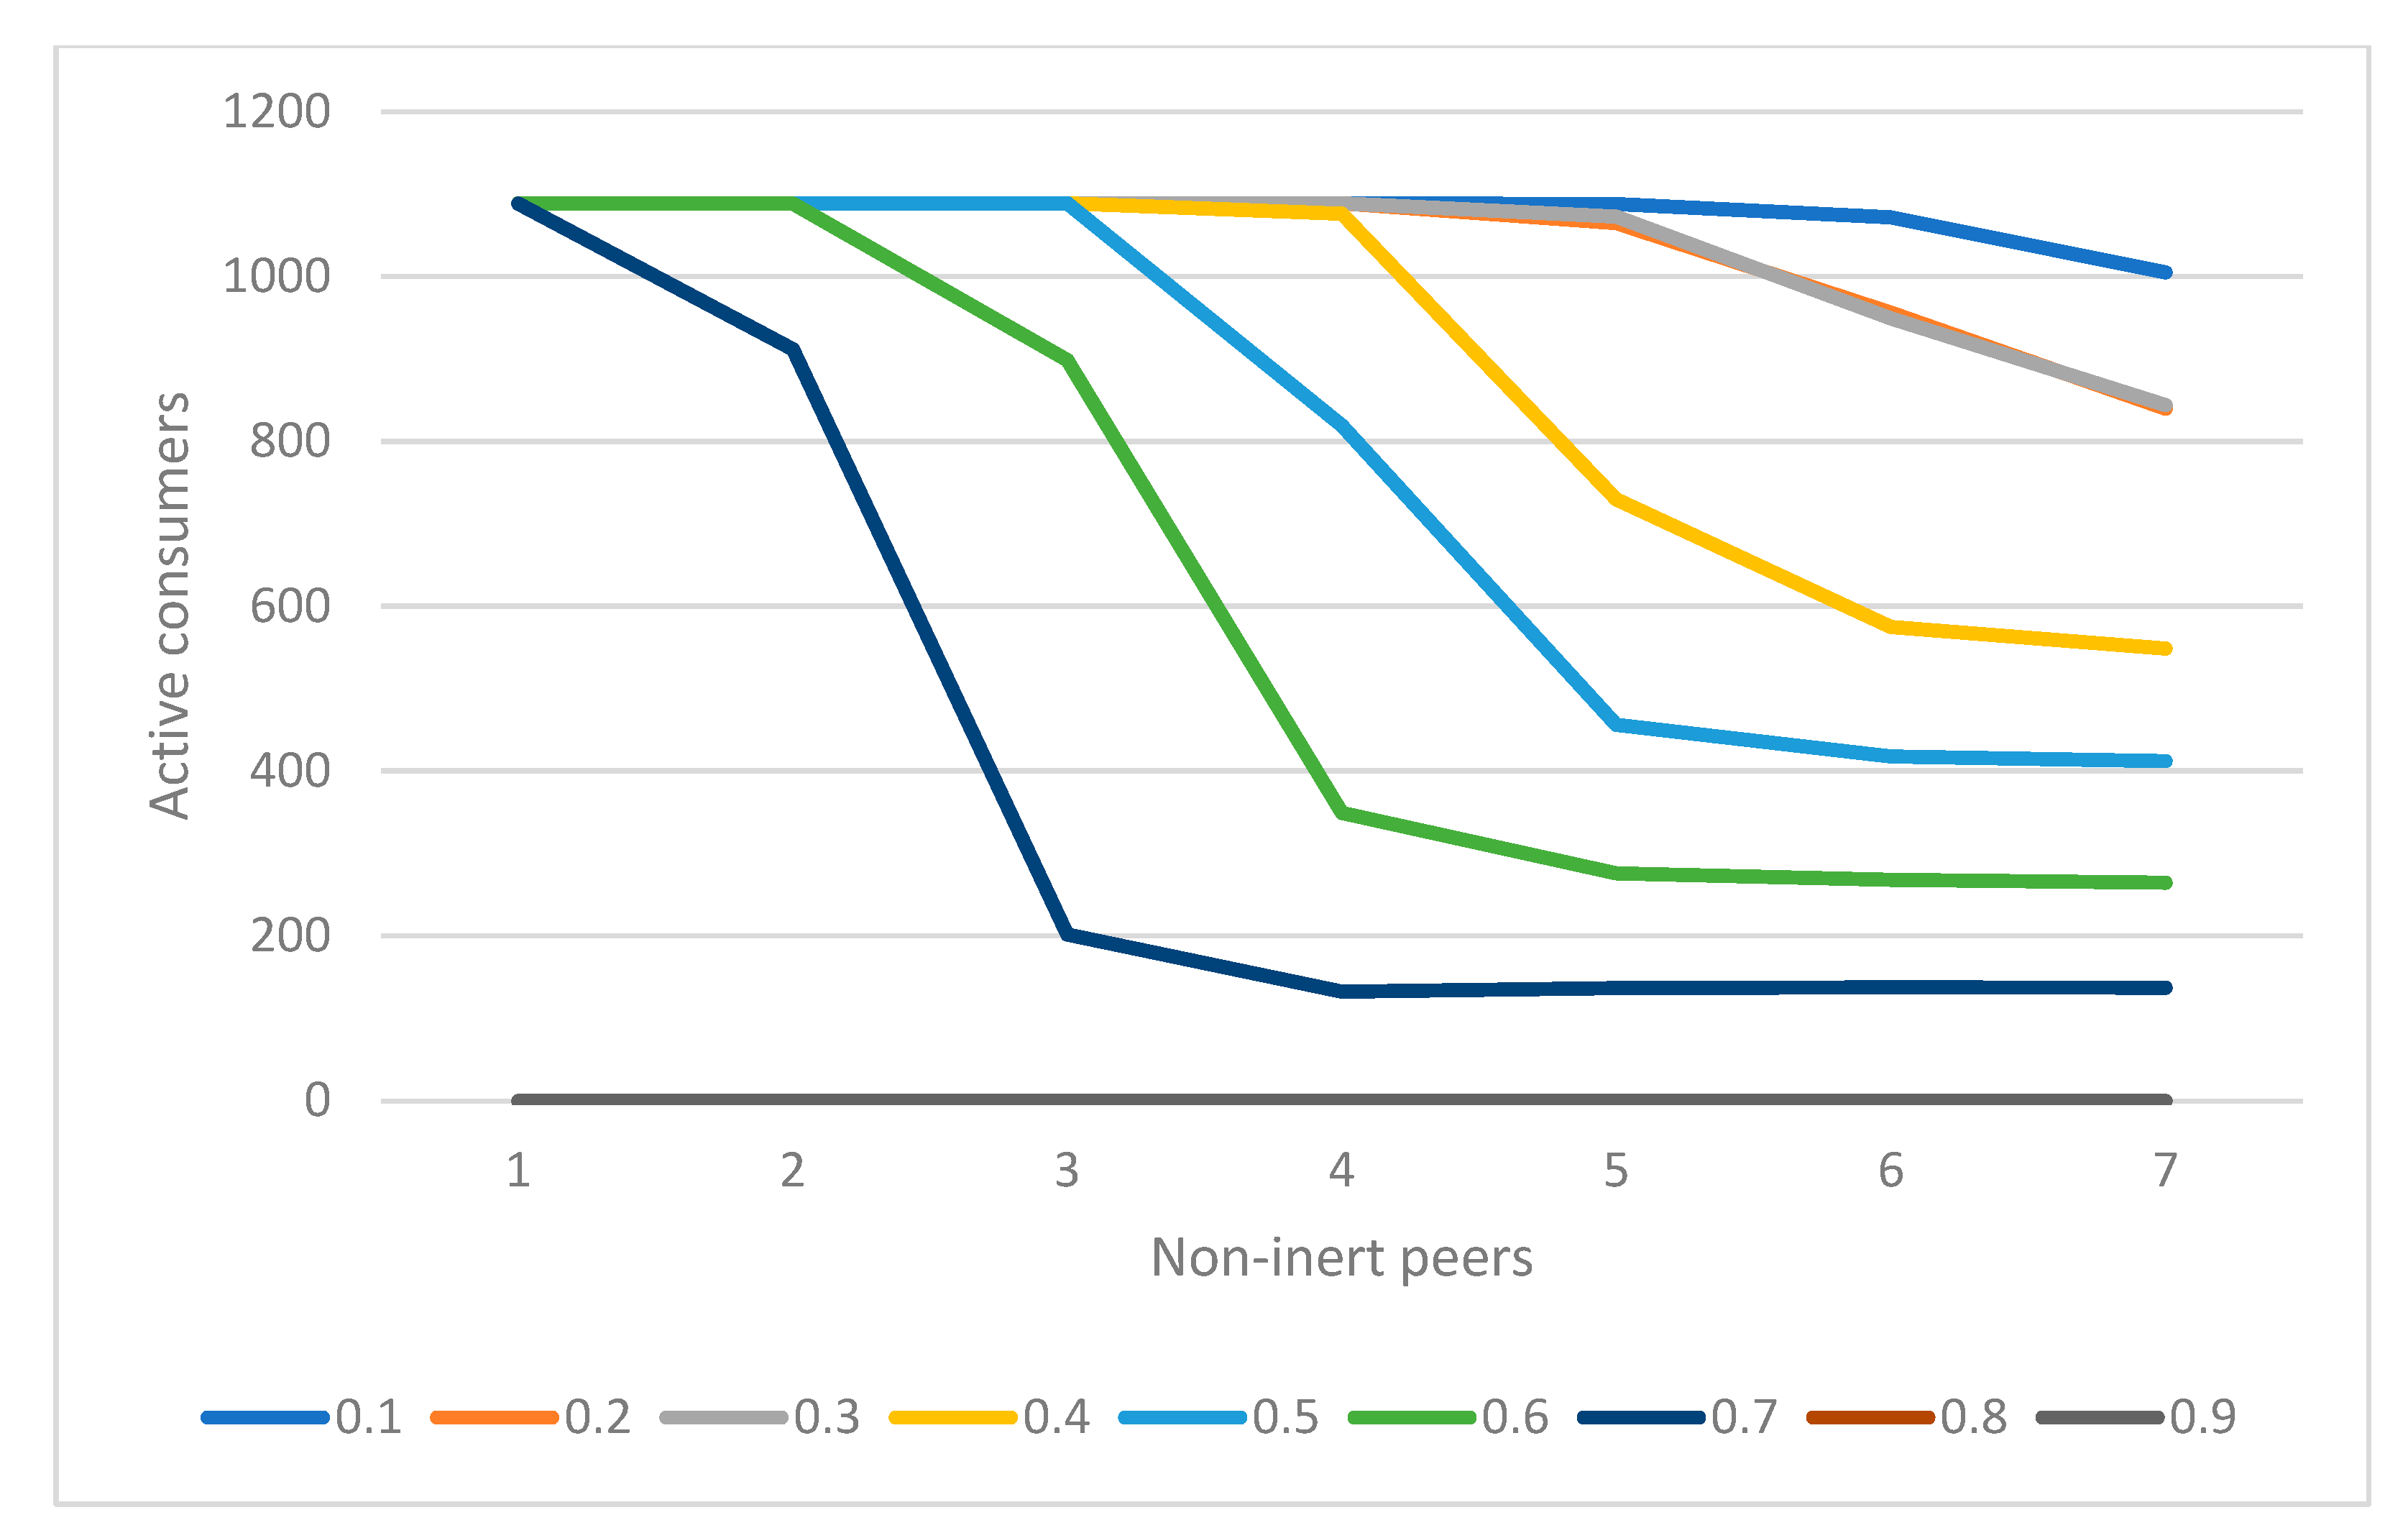
The number of active consumers at the end of the price competition game is plotted according to the influence level, the number of noninert consumers in the peer network, and the threshold of inertia to overcome. The three graphs show the rate of conversion of inert consumers in the presence of the neighborhood parameters.
The output of the BehaviorSpace experiments was then further analyzed with an ordinary least square (OLS) estimate to study the firm side of the model behavior. The linear regression studies the effect of the interplay between consumer inertia and peer influence on overall price competition. The dependent variable here is the industry profit, which is the sum of individual firm profits. Intuitively, firm prices are significant contributors to industry profit. However, the quantity variable or number of consumers itself was not significant in our model. The reason for this discrepancy is purely methodological. In this ABM environment, the total number of consumers (irrespective of their subscription choice) remained constant. The price competition in this study is not about market expansion or exit but rather about capturing market share by competing in price, i.e., the volume–margin trade-off scenario. Therefore, the suitable variable, in this case, is the number of consumers who are naturally willing to switch to a lower-priced alternative and the agents who overcame their inertia.
As stated in the previous regression model, the consumers parameter can be replaced by the neighborhood variables. At the end of each price competition, the final number of consumers without inertia depends on the initial number of influencers and the three neighborhood parameters.
The regression parameters are given as follows:
The output from Table 3 shows that the propensity to switch is the reverse of inertia, and it holds a positive relationship in the regression equation. As the inertia reduces, consumers become more willing to switch to a cheaper alternative, thereby adding on to firm profits. On the other hand, in the presence of strong inertia and minimum interaction, the consumers continue to pay a higher price. In such myopic circumstances, firms are able to withhold a portion of their profits from the inert consumers. The neighborhood inertia variable holds a slightly significant negative relationship since it takes a stronger influence to convert these inert consumers. For the third neighborhood interaction variable, the number of active consumers is proportional to the strength of the influence and hence shows a positive effect. The varying range of consumer ‘activity’ is due to the introduction of the inertia factor in the model. Going by the classical design of price competition, the consumer response in each period of competition would have been when and vice versa.
Table 3.
Industry outcome.
5. Discussion and Conclusions
5.1. Neighborhood Effects
The study focuses on the effects of individual inertia from peer interaction. The peer network in the ABM environment is established by considering the spatially adjacent Moore neighborhood. We utilize the Moore neighborhood instead of the von Neumann neighborhood to maximize the number of peers available in the two-dimensional (2D) setting (). The consumers respond to homophily, i.e., they are influenced by their peers that are ‘similar’ to them. The program is designed to create an ABM world at random without the programmer’s involvement. Having the von Neumann setup restricts the number of peers to only four. It may result in groups of agents that cannot interact or take too long to join the interaction. The focus of the study is to show the effect of neighborhood effects, and the Moore set up is an efficient option for the given model. From a purely operational perspective, having other neighborhood models affects the performance of the program (time and CPU resource utilization).
The NetLogo provides several sample ABMs from different areas of research. The sample models of voting decisions utilize the concept of the Moore neighborhood. This model converges satisfactorily under the given setup, considering the execution time and efficiency. This model served as a reference for a robust 2D model of economic interaction for our study.
The interaction between consumer–agents is established in terms of the peer subscription decision. For simplicity, we consider that active consumers influence their inert peers unilaterally. Subjected to peer influence, these inert consumers may overcome their inertia through multiple social interactions. If they overcome their inertia, they act as active consumers in their network and influence the remaining inert consumers.
Our model illustrates the interactions using three modelling variables: inertia, noninert or active consumers in a peer network, and strength of influence. These variables are relevant in understanding real-world choice problems. Consumers perceive each purchase decision differently, depending upon the cognitive effort expended, price (e.g., mental accounting), and associated risk (purchasing candy vs. insurance). The level of inertia can directly relate to the cognitive effort or complexity of the problem that manifests as procrastination and inertia [14,47]. Telecom subscription decision is also perceived as a complex task with risk (loss of telecom subscription is equivalent to losing connection with the personal and professional network). Most consumers are reluctant to switch or search for a better price for their service unless there is a major concern with the existing subscription. Therefore, to incentivize a switch, peer influence (word of mouth) can play a role along with marketing efforts by MNOs. In this context, the neighborhood effect can be read as how easily a choice can be modified under peer influence. In our ABM, the influence is measured as the number of active consumers required to push an inert consumer to be active and the strength of the influence itself. As the complexity of a task increases, the strength should also increase to transform the inert consumers. In a low-inertia and high peer influence setup, consumers would easily convert from inert to active and participate in the market competition. Alternatively, a difficult choice problem paired with low influence power drives the market based on inert consumers. Firms, in this case, would have less incentive to engage in a price war, as they can comfortably maintain a loyal consumer base.
5.2. Consumer Inertia
Inertia, in our context, is not simply a behavioral response but the manifestation of several behavioral biases and operational deterrents. We assume that consumers can overcome their choice inertia under suitable conditions. The ABM derives the combination of the conditions. We implemented the consumer decision function not only in terms of price preference but also including the inherent individual inertia. Decisions of each agent at each time period are analyzed as a maximization problem. The active consumers influence the inert neighbors in the social network. Figure 6, Figure 7 and Figure 8 show the dynamics of consumer inertia in terms of active consumers at the end of the price competition. Except for the two highest levels of inertia, the consumers were able to overcome their status quo. It is essential for firms, marketers, and regulatory bodies to keep the consumers active in their subscription decision. In the absence of consumer involvement (as in the highest level of inertia), firms undoubtedly are able to maintain a loyal customer base and reap profits. The inert consumers do not seek their optimal choice and are disadvantaged compared with active consumers. From a behavioral industrial organization perspective, firms may exploit this inertia, resulting in inefficient market equilibrium [48,49]. Especially in telecom, the overwhelming number of plans offered by MNOs and multiple tariff subscriptions within an MNO pose a high cognitive load on consumers. Therefore, the inert consumers maintain the status quo. Even when they overcome inertia and switch, they imitate peer behavior. The firms can curate targeted advertisements to these active hubs in social networks, such that they can propagate the information via (electronic) word of mouth. As an effect of homophily, the information from an active peer would aid in reducing the perceived risk associated with switching to an alternative network or tariff plan.

Figure 6.
Consumer activity at low influence.
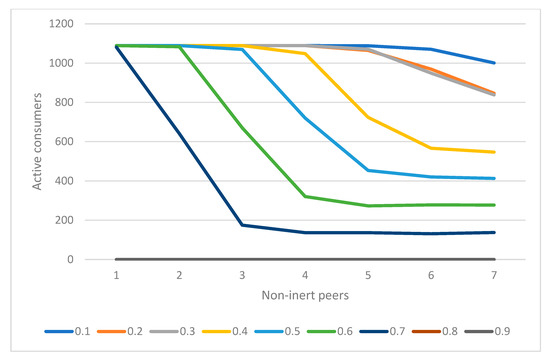
Figure 7.
Consumer activity at moderate (medium) influence.
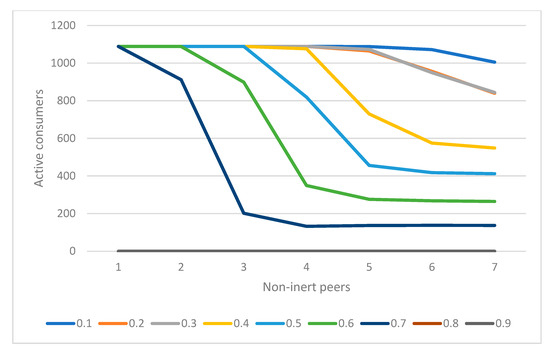
Figure 8.
Consumer activity at high influence.
5.3. Insights into Firm Behavior for Telecom
This study presents a parsimonious duopolistic price competition model between two existing MNOs. In the current telecom market, capacity constraints have been eased a lot by technological innovations. Most of the global markets have attained oligopoly after liberalization from state-owned monopolies. Though this study simplifies the model by restricting the comparison of firm offerings only by price, in reality, MNOs have now included different streaming service subscriptions to differentiate their products and attract consumers. Our model shows that a noninert consumer actively seeks the cheaper alternative from two homogeneous offerings. A simplified and readily available switching mechanism adds to reducing consumer inertia. Due to the nature of telecom offerings, it is in the best interest of the consumers to maintain a working connection and avoid any risky switch to alternatives. In these cases, consumers often refer to peer network decisions. Here, the decision of the active consumers could greatly influence others’ choices. Through network effects, firms would be able to retain consumers. In a market with many active consumers and under iterative price reductions, the overall industry profit will reduce. Under collusion, if the consumers are indifferent between the offerings, they will continue with their previous choice, and inertia remains unchanged.
5.4. ABM
The past ABM literature on socio-economic phenomena provided evidence for the interdependence of peer behavior on individual decisions (e.g., voting choice and competitive strategies). Recently, the ABM has been used in the marketing literature [38,50,51] to study distinct market phenomena. Our model provides a unique amalgamation of consumer behavior and firm response. It analyzes the spill-over effects of network interaction and resultant market dynamics. Though this model illustrates the case of mobile telecom subscription choice under inertia, the results can be generalized for: (a) any industry that poses a complex choice problem to consumers or (b) peer-dependent decision making of individuals. We illustrate the potential of the ABM as a rigorous methodology to study market interaction between more than one type of agent. In most theoretical market models, the agents or consumers are assumed to be strictly rational (in a game-theoretic sense). In the ABM environment, we implemented market competition under consumer inertia. The statistical analysis of the cumulative behavior of agents provided insights into market dynamics. It also provides the validity for the microworld representation of our ABM [30]. From a regulatory perspective, we present the need for the in-depth study of consumer behavior for robust competitive regulations to ensure consumer welfare, market efficiency, and stability.
5.5. Implications
This study undertakes a novel approach of modelling bounded rational consumers in a choice problem setting. The choice problem is derived by pricing decisions of MNOs. The objective of firms is to maximize profit while for consumers it is to maximize their utility. Compared with existing models of consumer interaction and network propagation, this study contributes to the literature by accommodating the concept of inertia in an analytical model. The present study extends the literature by adding the bounded rationality aspect into the decision process (a reflection of real-world behavior). For practitioners, however, the results indicate that consumer inertia allows firms to retain their customer base. These inactive consumers end up paying more, which becomes a concern from the social welfare perspective. On the other hand, our model also shows that with active peers in a social network, inactive consumers were able to overcome their inertia threshold and actively participate in market search. For MNOs and regulators, it is essential to understand consumer mobility to ascertain suitable pricing levels and offerings.
5.6. Limitations and Scope for Research
We thoroughly analyzed consumer behavior and its dynamics under peer influence. The ABM connects consumer choice to firm competition. The effect of the neighborhood variables is reflected in terms of consumer activity and resultant firm profits. For simplicity, our parsimonious model includes price as the only comparative factor and considers a simple duopoly of homogenous firms. However, MNOs nowadays differentiate their offerings by various other means (reduced tariff rate between same MNO calls, OTT subscriptions, and freebies) and they generally operate as oligopolies. The current model is set for firms to engage in price competition exogenously. The model can be expanded to accommodate other competitive action states for the firms (e.g., collusion, market entry, and exit). The model could also be extended by introducing more stakeholders (for example, government entities or regulatory bodies) and their complex action space. Here, the consumer decision was solely focused on selecting between subscribers. The decision process could be further studied in depth based on the combination of tariff plan–MNO selections. The participating firms in this duopoly model are assumed to be profit maximizers, but in reality, as Cyert and March (1992) [52] suggest, firms are ‘optimizers’. The firms try to balance between different organizational goals on a priority basis. With robust software support such as NetLogo, more complex market settings can be easily designed. In this study, the consumer-bounded rationality received more attention. As an extension of this work, the optimization strategy of firm objectives can also be studied in tandem with the consumer choice problem.
Our work provides a baseline competition model for the telecom industry. The empirical validation of the same is beyond the scope of our paper. A prime reason is the unavailability of reliable pricing information across MNOs. Moreover, the consumer-centric information required for this model can be collected via targeted surveys, experiments, or field studies. The competitive model can be empirically validated with relevant pricing data and consumer interaction information.
This study can further be extended for firms to consider utilizing information propagation across social networks. It can be an additional communication channel to promote firm offerings through their trusted peer network. The active consumers or the opinion leaders thus can help in reducing the consumer inertia of their peers. Our study illustrates that it is beneficial for firms to invest in understanding potential reasons for consumer choice inertia and the means to reduce it, such that consumers actively respond to the offerings of MNOs.
Author Contributions
Conceptualization, B.S. and M.M.-G.; methodology, B.S. and M.M.-G.; software, B.S.; writing—original draft preparation, B.S.; writing—review and editing, S.N.B. and R.J.; visualization, B.S. and M.M.-G. All authors have read and agreed to the published version of the manuscript.
Funding
This research received no external funding.
Institutional Review Board Statement
Not applicable.
Informed Consent Statement
Not applicable.
Data Availability Statement
Not applicable.
Conflicts of Interest
The authors declare no conflict of interest.
References
- Brennan, T. Consumer preference not to choose: Methodological and policy implications. Energy Policy 2007, 35, 1616–1627. Available online: https://econpapers.repec.org/RePEc:eee:enepol:v:35:y:2007:i:3:p:1616-1627 (accessed on 15 May 2022). [CrossRef] [Green Version]
- Giulietti, M.; Price, C.W.; Waterson, M. Consumer Choice and Competition Policy: A Study of UK Energy Markets. Econ. J. 2005, 115, 949–968. Available online: https://econpapers.repec.org/RePEc:ecj:econjl:v:115:y:2005:i:506:p:949-968 (accessed on 15 May 2022). [CrossRef]
- Wilson, C.M.; Price, C.W. Do consumers switch to the best supplier? Oxf. Econ. Pap. 2010, 62, 647–668. [Google Scholar] [CrossRef] [Green Version]
- Della Vigna, S. Psychology and Economics: Evidence from the Field. J. Econ. Lit. 2009, 47, 315–372. [Google Scholar] [CrossRef] [Green Version]
- Lunn, P.D. Telecommunications Consumers: A Behavioral Economic Analysis. J. Consum. Aff. 2013, 47, 167–189. [Google Scholar] [CrossRef]
- Xavier, P.; Ypsilanti, D. Switching costs and consumer behaviour: Implications for telecommunications regulation. Info 2008, 10, 13–29. [Google Scholar] [CrossRef]
- Xavier, P. Behavioral Economics and Customer Complaints in Communications Markets; Australian Communications and Media Authority: Melbourne, Australia, 2011.
- Bar-Gill, O.; Stone, R. Mobile Misperceptions. Harv. J. Law Technol. 2009, 23, 49–118. [Google Scholar]
- Gerpott, T.J. Biased choice of a mobile telephony tariff type:: Exploring usage boundary perceptions as a cognitive cause in choosing between a use-based or a flat rate plan. Telemat. Inform. 2009, 26, 167–179. [Google Scholar] [CrossRef]
- Grubb, M.D. Selling to Overconfident Consumers. Am. Econ. Rev. 2009, 99, 1770–1807. [Google Scholar] [CrossRef] [Green Version]
- Lambrecht, A.; Skiera, B. Paying Too Much and Being Happy about It: Existence, Causes, and Consequences of Tariff-Choice Biases. J. Mark. Res. 2006, 43, 212–223. [Google Scholar] [CrossRef] [Green Version]
- Gerpott, T.J.; Meinert, P. Choosing a wrong mobile communication price plan: An empirical analysis of predictors of the degree of tariff misfit among flat rate subscribers in Germany. Telemat. Inform. 2017, 34, 303–313. [Google Scholar] [CrossRef]
- Polites, G.L.; Karahanna, E. Shackled to the Status Quo: The Inhibiting Effects of Incumbent System Habit, Switching Costs, and Inertia on New System Acceptance. MIS Q. 2012, 36, 21–42. [Google Scholar] [CrossRef] [Green Version]
- Samuelson, W.; Zeckhauser, R. Status quo bias in decision making. J. Risk Uncertain. 1988, 1, 7–59. [Google Scholar] [CrossRef]
- García-Mariñoso, B.; Suárez, D. Switching mobile operators: Evidence about consumers’ behavior from a longitudinal survey. Telecommun. Policy 2019, 43, 426–433. [Google Scholar] [CrossRef]
- Lunn, P.D.; Lyons, S. Consumer switching intentions for telecoms services: Evidence from Ireland. Heliyon 2018, 4, e00618. [Google Scholar] [CrossRef] [Green Version]
- Lyons, S. Measuring the Effects of Mobile Number Portability on Service Prices. J. Telecommun. Manag. 2010, 1, 2. Available online: http://henrystewart.metapress.com/link.asp?id=f5v3gw5528262u51 (accessed on 15 May 2022).
- Usero Sánchez, B.; Asimakopoulos, G. Regulation and competition in the European mobile communications industry: An examination of the implementation of mobile number portability. Telecommun. Policy 2012, 36, 187–196. [Google Scholar] [CrossRef]
- Uner, M.M.; Guven, F.; Cavusgil, S.T. Churn and loyalty behavior of Turkish digital natives: Empirical insights and managerial implications. Telecommun. Policy 2020, 44, 101901. [Google Scholar] [CrossRef]
- Jackson, M.O.; Yariv, L. Chapter 14—Diffusion, Strategic Interaction, and Social Structure. In Handbook of Social Economics; Benhabib, J., Bisin, A., Jackson, M.O., Eds.; North-Holland: Amsterdam, The Netherlands, 2011; Volume 1, pp. 645–678. [Google Scholar] [CrossRef] [Green Version]
- Katz, E.; Lazarsfeld, P.F. Personal Influence: The Part Played by People in the Flow of Mass Communications; Free Press: New York, NY, USA, 1955. [Google Scholar]
- Gwozdz, W.; Nie, P.; Sousa-Poza, A.; DeHenauw, S.; Felső, R.; Hebestreit, A.; Iguacel, I.; Lissner, L.; Lauria, F.; Page, A.; et al. Peer Effects on Weight Status, Dietary Behaviour and Physical Activity among Adolescents in Europe: Findings from the I.Family Study. Kyklos 2019, 72, 270–296. [Google Scholar] [CrossRef] [Green Version]
- Goldsmith-Pinkham, P.; Imbens, G.W. Social Networks and the Identification of Peer Effects. J. Bus. Econ. Stat. 2013, 31, 253–264. [Google Scholar] [CrossRef]
- Moncada, J.A.; Tao, Z.; Valkering, P.; Meinke-Hubeny, F.; Delarue, E. Influence of distribution tariff structures and peer effects on the adoption of distributed energy resources. Appl. Energy 2021, 298, 117086. [Google Scholar] [CrossRef]
- Blume, L.; Durlauf, S. The Interactions-Based Approach to Socio-Economic Behavior; (Working Papers, Issue 1); Wisconsin Madison—Social Systems: Madison, WI, USA, 2000; Available online: https://econpapers.repec.org/RePEc:att:wimass:20001 (accessed on 15 May 2022).
- Brock, W.A.; Durlauf, S.N. Discrete Choice with Social Interactions. Rev. Econ. Stud. 2001, 68, 235–260. [Google Scholar] [CrossRef]
- Manski, C.F. Economic Analysis of Social Interactions. J. Econ. Perspect. 2000, 14, 115–136. [Google Scholar] [CrossRef] [Green Version]
- Akerlof, G.A. Social Distance and Social Decisions. Econometrica 1997, 65, 1005–1027. [Google Scholar] [CrossRef]
- Kollman, K.; Miller, J.H.; Page, S.E. Adaptive Parties in Spatial Elections. Am. Political Sci. Rev. 1992, 86, 929–937. [Google Scholar] [CrossRef]
- Epstein, J.M.; Axtell, R. Growing artificial societies: Social science from the bottom up. In Growing Artificial Societies: Social Science from the Bottom Up; The MIT Press: Cambridge, MA, USA, 1996. [Google Scholar]
- Dean, J.; Gumerman, G.; Epstein, J.; Axtell, R.; Swedlund, A.; Parker, M.; Mccarroll, S. Understanding Anasazi Culture Change through Agent-Based Modeling; Working Papers; Santa Fe Institute: Santa Fe, NM, USA, 1998. [Google Scholar]
- Tesfatsion, L. A Trade Network Game with Endogenous Partner Selection. In Computational Approaches to Economic Problems; Springer: Boston, MA, USA; New York, NY, USA, 1997; pp. 249–269. [Google Scholar] [CrossRef] [Green Version]
- England, R.; Owadally, I.; Wright, D. An Agent-Based Model of Motor Insurance Customer Behaviour in the UK with Word of Mouth. J. Artif. Soc. Soc. Simul. 2022, 25, 2. [Google Scholar] [CrossRef]
- Gibson, M.; Portugal Pereira, J.; Slade, R.; Rogelj, J. Agent-Based Modelling of Future Dairy and Plant-Based Milk Consumption for UK Climate Targets. J. Artif. Soc. Soc. Simul. 2022, 25, 1–3. [Google Scholar] [CrossRef]
- Spiegler, R. Bounded Rationality and Industrial Organization; Oxford University Press: Oxford, UK, 2011. [Google Scholar]
- Stahl, D.O. Oligopolistic Pricing with Sequential Consumer Search. Am. Econ. Rev. 1989, 79, 700–712. [Google Scholar]
- Varian, H. A Model of Sales. Am. Econ. Rev. 1981, 71, 517. [Google Scholar] [CrossRef]
- Rand, W.; Rust, R.T. Agent-based modeling in marketing: Guidelines for rigor. Int. J. Res. Mark. 2011, 28, 181–193. [Google Scholar] [CrossRef]
- Twomey, P.; Cadman, R. Agent-based modelling of customer behaviour in the telecoms and media markets. Info 2002, 4, 56–63. [Google Scholar] [CrossRef] [Green Version]
- Wilensky, U.; Rand, W. An Introduction to Agent-Based Modeling: Modeling Natural, Social, and Engineered Complex Systems with NetLogo; MIT Press: Cambridge, MA, USA, 2015. [Google Scholar]
- Weisstein, E.W. Moore Neighborhood; MathWorld—A Wolfram Web Resource. 2021. Available online: https://mathworld.wolfram.com/MooreNeighborhood.html (accessed on 15 May 2022).
- Farrow, K.; Grolleau, G.; Mzoughi, N. What in the Word! The Scope for the Effect of Word Choice on Economic Behavior. Kyklos 2018, 71, 557–580. [Google Scholar] [CrossRef]
- Bass, F.M. A New Product Growth for Model Consumer Durables. Manag. Sci. 1969, 15, 215–227. [Google Scholar] [CrossRef]
- Rogers, E. Diffusion of Innovations; Free Press: New York, NY, USA, 2003. [Google Scholar]
- Durlauf, S. Neighborhood effects. Handb. Reg. Urban Econ. 2004, 4, 2173–2242. [Google Scholar] [CrossRef]
- Epstein, J.M. Agent-based computational models and generative social science. In Generative Social Science; Princeton University Press: Princeton, NJ, USA, 2012; pp. 4–46. [Google Scholar] [CrossRef]
- O’Donoghue, T.; Rabin, M. Choice and Procrastination. Q. J. Econ. 2001, 116, 121–160. Available online: http://www.jstor.org/stable/2696445 (accessed on 15 May 2022). [CrossRef]
- Gabaix, X.; Laibson, D. Shrouded Attributes, Consumer Myopia, and Information Suppression in Competitive Markets. Q. J. Econ. 2006, 121, 505–540. [Google Scholar] [CrossRef]
- Grubb, M.D. Failing to Choose the Best Price: Theory, Evidence, and Policy. Rev. Ind. Organ. 2015, 47, 303–340. [Google Scholar] [CrossRef] [Green Version]
- Delre, S.A.; Panico, C.; Wierenga, B. Competitive strategies in the motion picture industry: An ABM to study investment decisions. Int. J. Res. Mark. 2017, 34, 69–99. [Google Scholar] [CrossRef] [Green Version]
- Rand, W.; Herrmann, J.; Schein, B.; Vodopivec, N. An Agent-Based Model of Urgent Diffusion in Social Media. J. Artif. Soc. Soc. Simul. 2015, 18, 1. [Google Scholar] [CrossRef]
- Cyert, R.; March, J. Behavioral Theory of the Firm; Wiley-Blackwell: Hoboken, NJ, USA, 1992. [Google Scholar]


Publisher’s Note: MDPI stays neutral with regard to jurisdictional claims in published maps and institutional affiliations. |
© 2022 by the authors. Licensee MDPI, Basel, Switzerland. This article is an open access article distributed under the terms and conditions of the Creative Commons Attribution (CC BY) license (https://creativecommons.org/licenses/by/4.0/).