Abstract
Empirical investigation suggests that conflict is path-dependent, i.e., current conflict leads to more conflict in the future. However, there is very little formal theory for why conflict path dependence exists. We propose a mathematical model to explore one possible pathway to explain the persistence of conflict once it starts. In this model, there are three types of cultures in two boundedly rational populations. The two populations are State Actors and Insurgents. The three cultures are Peaceable, Warring, or Bargainers. The distribution of these types is different in each population. Evolutionary dynamics determine which of these three cultures might predominate. Our simulations suggest that it is rational for people to learn to be warlike even in environments where State Actors are willing to give large side payments to “buy” peace to avoid bargaining failure. War can also be learned when State Actors and Insurgents are extremely patient and, therefore, potentially committed to Pareto improving peace deals. The outcomes of these simulations suggest that cultural learning can be a hitherto ignored explanation for why conflict is path dependent. If culture is indeed a possible cause for conflict, the best intentions of technocratic peacemakers trying to build frameworks for resource sharing and/or institutional building may fail, simply because such structures are not suited to local conditions. On the flip side, our model also provides theoretical reasoning for the observation that conflict is not a deterministic outcome of bargaining and commitment failures.
1. Introduction
Collier and Sambanis [1], Murdoch and Sandler [2], and Blomberg and Hess [3] formally acknowledge path dependence’s role in civil conflict in a symposium collection of articles on civil war published in the Journal of Conflict Resolution. They note that, empirically, conflict is persistent. This strand of literature acknowledges and explores conflict as one consequence of perturbations in the opportunity cost of conflict consistent with the rational choice approach. It does not, however, model the causal pathways that make conflict linger. Basuchoudhary et al. [4] suggest that there needs to be a sustained investigation into understanding the path dependence of conflict because of the predictive salience of past conflict. More recently, Jetter et al. [5] made this same point. Thus, conflict path dependence is well established empirically.
There has been a lot written in the literature about bargaining failure and commitment failure as ways to model state conflict (see, e.g., [6,7]. Rubinstein’s [8] seminal work on the bargaining problem, as outlined in Powell [9], led to research that now uses a more-or-less standard framework where bargaining failure is the cause of war. Powell (2002) extends the existing work to look at bargaining failure because of asymmetric information, bargaining indivisibilities, or commitment problems. Powell [10] argues that bargaining indivisibilities (like religious differences or ethnic identity) are really commitment problems, and whatever the specific circumstances causing the conflict, whether it be preventive war, preemptive attacks, or conflict from bargaining over future bargaining power, large and sudden shifts in power can lead to persistent war. Nevertheless, Cederman and Vogt [11] note that quantitative mesolevel studies of civil conflict are limited.
Microtheoretic studies that delve into case studies, archival data, and anthropological methodologies offer an intriguing insight into the persistence of civil conflict. The seminal work of Kalyvas [12] shifts attention from the structural causes of war to local wartime dynamics. This refocusing sheds light on the endogenous nature of war. The civil war itself offers opportunities for stealing, rent-seeking, and settling old scores. These factors make conflict path-dependent.
Fearon [7] among others, develops a theoretical model explaining how commitment failures can deter a bargained peace. Basuchoudhary et al. [4] further note that if one ignores conflict path dependence, theoretical models of bargaining and commitment failures are indeed empirically among the most predictive theoretical models. However, the predictive salience of conflict path dependence relative to bargaining and commitment failures leaves a gap in our understanding of why conflict is persistent. Jetter et al. [5] point to an intriguing missing factor in economic models of civil conflict, the role of culture. They note the predictive salience of colonial history and religion consistent with [4].
In other words, conflict creates opportunities for more conflict. Why? Bargaining and commitment failures may provide some, but not all, of the explanatory heft. We develop a theoretical model in a ‘politics of spoils’ scenario. This model incorporates the possibility of bargaining and commitment failures since these remain part of the explanation for conflict. I use an evolutionary modeling approach for two reasons. First, I do not have to make heroic assumptions about rationality; humans often use heuristics to make decisions and then adjust these decisions depending on context. Such processes do not guarantee optimal outcomes. Thus, conflict—hitherto puzzling in a neo classical world economics world where gains from exchange are a possibility—can be a possible outcome given the appropriate context even though it is sub-optimal. Second, evolutionary models allow people to learn from their environment. At one level this is how humans behave rather than performing like rational self-contained machines in perfectly informed settings. At another level such models can predict how situations change as people learn new things. Thus, such models are very useful in thinking about culture. The theory of evolutionary models has been around for a while [13]. These models are experiencing a resurgence because they can be applied to understand social behavior in realistic settings [14]. Critically, predictive outcomes of these models may be particularly amenable to testing by AI based techniques like partial dependence plots. Bang et al. [15], for example, show how such techniques can help validate game theoretic models of terrorism. Our model shows that even if bargaining and commitment failures are unlikely, culture may still make conflict path-dependent.
2. An Evolutionary Model of Conflict
The existence of a conflict or a peace equilibrium is often modeled quite simply in game theory as a simultaneous coordination game where two players have a strategy space for war and peace [16] (pp. 53–66).
Here we attempt to bring together two strands from the existing literature: the role of bargaining failure and commitment problems as sources of civil conflict [6,17]. The ‘spoils of war’ approach is a legal framework in thinking about what kinds of resources are up for grabs during conflict (see, e.g., https://sites.duke.edu/lawfire/2016/09/25/dont-conflate-illegal-pillage-with-spoils-of-war-and-other-lawful-takings/, accessed on 2 December 2021). We adopt this framework of Insurgency or Spoils of War to model a situation where the State and Insurgents are intent on legally sharing the economic pie as a way of avoiding violence.
We apply a standard evolutionary game theory model [18] to study how culture or learned behavior may help explain conflict path dependence. This is the added layer to the model to show that bargaining or commitment failures are insufficient to explain conflict path dependence. Further, these models can also be used to connect psychological models to learned behavior [19]. Thus, such models can be very useful in understanding how individual level psychological characteristics affect the social dynamics of immigration or conflict. This connection from individual characteristics need not be those of Homo Economicus, thus expanding the universe of axioms of social science and exposing these axioms to experimental testing.
Our basic model has two populations of players. Individuals in these populations are boundedly rational. Each player belongs to a particular culture. A particular proportion of players in each population belong to each culture. The cultures interact, the likelihood of interaction is determined by the proportions. These interactions result in payoffs. Cultures with higher payoffs are more likely to be emulated, thus changing the distribution of cultures in each population. This dynamic continues until the evolutionary stable equilibrium is reached (see pp. 229–246 in [20]). There is no guarantee that an equilibrium will be achieved; for example, the Rock Paper Scissors game is not evolutionary stable. Nevertheless, the replicator dynamic drives the evolutionary (in)stability. In Section 3 we present several cases to show how this dynamic suggests that culture may drive conflict even when bargaining and commitment failures are unlikely.
In this model, there are two large populations of players: State Actors and Insurgents. We assume, as is usual in evolutionary games, that in each population, there is a distribution of cultures or phenotypes. Individuals inherit or learn to mimic the most successful culture. In the model here, these are Bargain, Peace, and War. Individuals in each population randomly interact in pairs with members of the other population, and such interaction determines the fitness of each culture or phenotype. The individuals then observe their fitness and the fitness of those from different phenotypes and learn to emulate fitter cultures. The seminal game theory literature in this area thinks of fitness as the rate of reproduction of each phenotype, though it may just as well be a signal for the relative benefits from learned behaviors (see [18] p. 38, for example).
We model bargaining by allowing differing division of resources between the Insurgents and the State Actors and seeing how this changes the fitness across cultures. Here, r is the parameter for bargaining. In the conflict setting, patience plays an important role in enforcing credible commitment mechanisms. Powell’s [10] model, for example, suggests that loyalists may be willing to buy peace from rebels. However, if rebels believe that this peace will also buy time for loyalists to become stronger, they may be less likely to accept peace. Patient rebels, however, may be willing to forego the large current gains through conflict only if they are willing to wait for the future stream of peaceful benefits. Of course, the same sort of argument holds true for loyalists. Patient rebels and loyalists may therefore be more likely to commit to peace where their impatient counterparts do not in a direct application of the Folk Theorem [21]. Thus, δ, the patience variable, captures the commitment element we suggest should be included explicitly in causal theories of conflict. In our model both r and δ are parameters. Below, we analyze several cases, each with a different value of r and δ, to illustrate the point of this paper.
Table 1 below shows the fitness from the evolutionary stage game for paired interactions between an Insurgent (rows) and a State Actor (columns). Peace phenotypes cooperate, no matter what. War phenotypes never want peace, and so renege, and Bargainers follow a Grim strategy in that they meet Peace with Peace, but if the other player reneges, the Bargain type is at war forever. Here, c is the cost of war, r is the fraction of economic resources that go to the Insurgents and therefore our measure of bargaining, and p is the probability that Insurgents prevail in the civil conflict. The likelihood that the game will continue into the future is δ. Thus, if the individual expects to interact indefinitely, δ is 1. Therefore, the fitness from each interaction is discounted by (1 − δ). Note that in this sense, δ is a measure of the incentive to commit. If the individual intends on committing and ‘playing on,’ δ will be closer to 1.

Table 1.
Fitness Matrix.
If an Insurgent of Peace phenotype meets a State Actor of the same phenotype, the Insurgent gets r fraction of the resources, and the State Actors get (1 − r), and these are discounted at (1 – δ). Similarly, if two Bargain types interact, or if a State Actor of Peace phenotype interacts with an Insurgent Bargain phenotype, the same fitness results (four corners of Table 1).
If one of the individuals, whether a State Actor or an Insurgent, is from the Peace culture, but the other one from the other population is War, then the former gets nothing while the latter gets all the spoils. Thus, the War phenotype’s fitness is (1 – c), and the Peace phenotype’s fitness is 0. Thus, for instance, if the Insurgent is a War type and the State Actor is a Peace type, the former gets and the latter gets 0. These fitnesses are seen in Row 1, Column 2 and Row 2, Column 1.
What happens if two War phenotypes interact? In that case, the Insurgent gets (p – c) while the State Actor gets (1 – c – p) after some algebraic simplification. This is indicated in Row 2, Column 2.
Finally, we look at the interesting scenario of the interaction of the Bargain type with the War type. In the first interaction, War gets all (1 − c), and Bargain gets nothing, 0, no matter which population they are from. However, remember that Bargain acts’ grim’. Thus, in future interactions, the Bargain type will act as if she or he was War type. If the Bargain type is from the Insurgent population, she gets from the second and subsequent interactions. This means that her total fitness is (since she gets 0 from the first interaction). On the other hand, if the Bargain type is a State Actor, his fitness is from the second and subsequent interactions. His total fitness is therefore (since he gets 0 from the first interaction). On the other hand, if the War type is an Insurgent, he gets in all future interactions, so that his total fitness is If the War type is a State Actor, her fitness from all future interactions is , so that her total fitness is . These fitnesses are seen in Row 3 Column 2, and Row 2, Column 3 of Table 1.
Next, we use replicator dynamics to find the evolutionary stability strategy (ESS) of each culture or phenotype. As established by Gintis [20], a cultural form is an ESS if, when adopted by a population, it cannot be overturned, or ‘invaded,’ by a group of individuals from a different cultural form. In our case, for example, an ESS will occur if, when the entire population adopts Peace, a smaller group that adopts War cannot ‘out-fit’ or replace Peace. Replicator dynamics is based on the notion that a culture that is more fit will grow within the population. As individuals are randomly matched and interact, replicator dynamics predict the evolution of play as a function of the relative average fitness of each culture in the population ([22] pp. 613–614).
Given the initial distribution of each phenotype in each population, some cultures will be fitter than others. The next step is then to calculate the average fitness of the different types. Let xp be the proportion of Insurgents of Peace phenotype, xw be the proportion of War phenotype, and the rest (1 – xp – xw) be the proportion of Bargain phenotypes. Similarly, yp, yw, and 1 – yp – yw are the proportions of State Actors who are of War phenotype, Peace phenotype, and Bargain phenotype, respectively. The expected fitness from Peace phenotypes to State Actors is
The expected fitness from War phenotypes to State Actors is
and, the expected fitness from Bargaining to State Actors is
The expected fitness from Peace phenotypes to Insurgents is
The expected fitness from War phenotypes to Insurgents is
and, the expected fitness from Bargaining to Insurgents is
3. Case Specific Dynamics
The replicator dynamic process is perhaps best understood with some simulations of Equations (1) through (6). We present and discuss these simulations below across four cases and eight figures.
In all these cases, the cost of war, c, and the likelihood of the Insurgents winning the war, p, is constant. Thus, in all cases, c = 0.2, and p = 0.5. This allows us to focus on the parameters of interest for bargaining (r) and commitment (δ) while making a case for the cultural transmission of conflict. Second, by setting p = 0.5, we allow the Insurgents and the state to be equally powerful. Finally, as long as p > c, it turns out that the expected fitness of the Bargain culture always exceeds the expected fitness of peace to both State Actors and Insurgents. Thus, the analysis and discussion below focus on the relative expected fitness of War and Bargaining. Nevertheless, we retain p and c as features of the model for later investigations into the dynamic between power, culture, and resource sharing.
Each case has two figures that show the average fitness for each population from War and Bargain. The vertical axis measures the proportion of War types and the horizontal axis measures the proportion of Peace types for each population. Therefore, by default, the rest captures the proportion of Bargain types. The blue shaded regions show where War is the fittest strategy for one population, given the proportions of the Peace culture, the War culture, and residually, the Bargain culture of the other population. That is the region in which the parameter values are such the average expected fitness from War is greater than the average fitness from Bargain: E(W)S > E(B)S for State Actors and E(W)I > E(B)I for Insurgents. Please note that this means that the results or expected fitnesses of the populations are determined simultaneously across both figures. Section 3.1 describes the mechanics of the dynamic process while Section 3.2 summarizes the main findings.
3.1. The Cases
Case 1: In Case 1, we change the share of the resources going to the Insurgent population to see how that affects the fitnesses of war/bargain for both populations, keeping constant their level of commitment. In other words, r is increased while keeping δ constant. One way to think of this is to ask, ceteris paribus, can the State buy peace by paying off Insurgents. Thus, in Case 1, for both State Actors and Insurgents, we change r from 0.3 to 0.9 while keeping the other parameters constant, i.e., δ = 0.1, c = 0.2, and p = 0.5.
The simulations from Case 1 are in Figure 1, Figure 2, Figure 3 and Figure 4. In all these figures the proportion of State Actors, yw who are War type changes along the vertical axis, and the proportion of State Actors who are Peace type, yp changes along the horizontal axis. The shaded region in Figure 1 and Figure 3 shows the proportions of peaceful and warlike State Actors that make war fitter for Insurgents. The shaded region in Figure 2 and Figure 4 shows the proportions of peaceful and warlike Insurgents that make war fitter for State Actors. In Figure 1 and Figure 2, r = 0.3, δ = 0.1, c = 0.2, and p = 0.5. In Figure 3 and Figure 4, r = 0.9, δ = 0.1, c = 0.2, and p = 0.5.
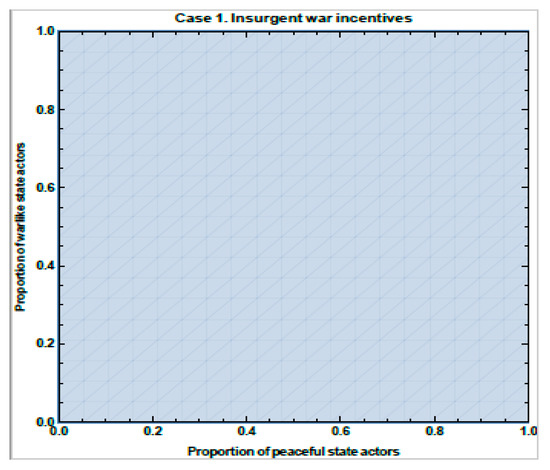
Figure 1.
Fitness for Insurgents when for r = 0.3, δ = 0.1, c = 0.2, and p = 0.5.
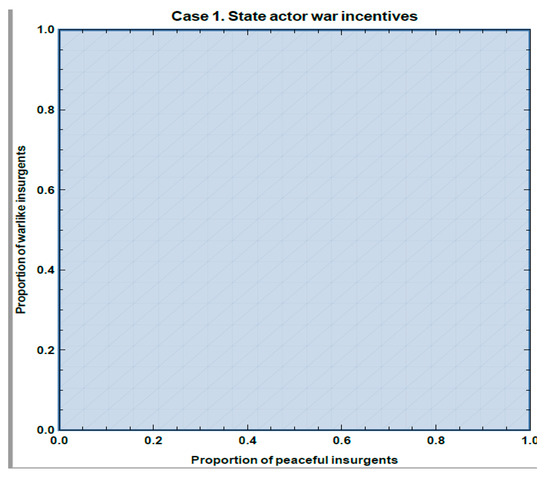
Figure 2.
Fitness for state when r = 0.3, δ = 0.1, c = 0.2, and p = 0.5.
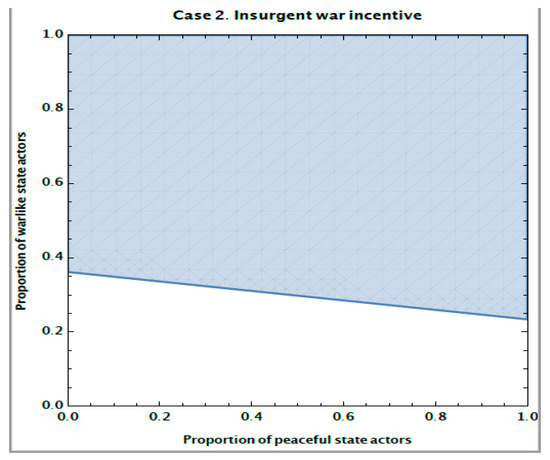
Figure 3.
Fitness for Insurgents when r = 0.9, δ = 0.1, c = 0.2, and p = 0.5.
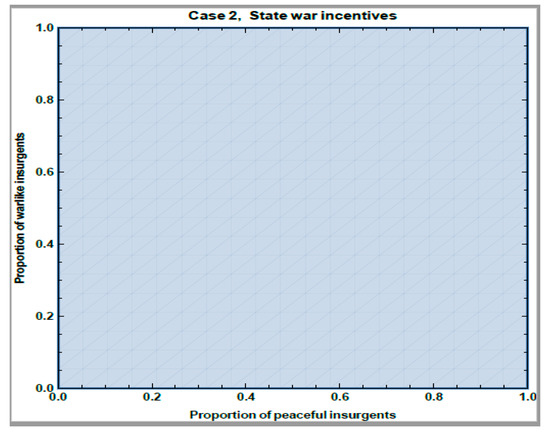
Figure 4.
Fitness for state when r = 0.9, δ = 0.1, c = 0.2, and p = 0.5.
If we pick a point in the space, say (0.2, 0.4), in Figure 1, that point represents a population of State Actors, 20% of whom are War type, 40% are Peace type, and by default, 40 % are Bargain type. The shading represents the proportions of State Actors that make war the fittest strategy for Insurgents. Correspondingly, xw changes along the vertical axis, and xp changes along the horizontal axis of Figure 2. Thus, a point such as (0.2, 0.4) represents a population of Insurgents, 20% of whom are War type, 40% are Peace type, and by default, 40 % are Bargain type.
The shading shows the proportions of Insurgents that make war the fittest culture for State Actors. Since the entire area is shaded in both figures, we conclude that Bargaining and Peace are not plausible cultures in this scenario. Thus, whatever the initial distribution of cultures in the populations, both the State Actors and the Insurgent population will learn to be warlike under these conditions. War is rationally learned from period to period—conflict becomes path-dependent.
Can giving a larger share of resources to Insurgents change this path? Figure 3 and Figure 4 capture this scenario where now r is 0.9; that is, r = 0.9, δ = 0.1, c = 0.2, and p = 0.5.
Let us now consider the phases of cultural change for the proportion of warlike State Actors and Insurgents. Say, for example, we are at (0.2, 0.2) in Figure 3. That is, State Actors are evenly distributed among the War and Peace cultures at 20% each. Thus, the remaining 60% are of the Bargain type. Since we are in the unshaded part, the expected fitness from Bargaining to Insurgents is greater than the expected fitness from War. This means that the proportion of Insurgents who are war type is going to fall. In this scenario, it seems that increasing the resource share to the Insurgents (from r = 0.3 to r = 0.9) has succeeded in reducing the warlike culture among the Insurgents.
However, this increase in the fitness of the Bargaining culture and consequent increase in the proportion of Insurgents who want to bargain does not affect the fitness from war among the State Actors (Figure 4). War is always fitter for State Actors, no matter what the distribution of types in the Insurgent population. All of Figure 4 is shaded. Thus, State Actors will increasingly learn war. As bargaining and peaceful State Actors learn war, at some point, the proportion of warlike State Actors will increase to the point where now Insurgents are incentivized for war. In other words, as the proportion of State Actors who are War type increases because War is the fitter culture (Figure 4), the system will move into the shaded area in Figure 3. This will happen, for example, around 0.36 on the vertical axis of Figure 3. Now the entire system will move to war. The people within the state who want to bargain will fail even though their culture appears to have a clear majority.
Thus, a larger share of resources to the Insurgents, paying them to buy peace, may fail when cultural learning is possible. However, perhaps the problem lies in commitment failure. The bargaining deal could fail because agents would rather get current gains from war over future gains from a bargained resolution. Such a focus on current gains should diminish if actors become more committed, that is, δ rises. Does it? This brings us to Case 2.
Case 2: In Case 2, we analyze the replicator dynamic when populations are more committed to a bargained peace. That is, we increase the value of δ and keep r the same. Here we compare the situation described in Figure 1 and Figure 2, where r = 0.3, δ = 0.1, c = 0.2, and p = 0.5. The meanings of the figures remain the same as in Case 1. However, in Figure 5 and Figure 6, r = 0.3, δ = 0.99, c = 0.2, and p = 0.5. Thus, in this case we go back to the original distribution of resources in Figure 1 and Figure 2 as the baseline but increase the incentive to commit. Individuals in the population now view this as a long game, i.e., they will repeatedly interact with individuals in the other population. Thus, they are more committed. To capture this, we increase δ from 0.1 to 0.99 keeping all the other parameters constant.
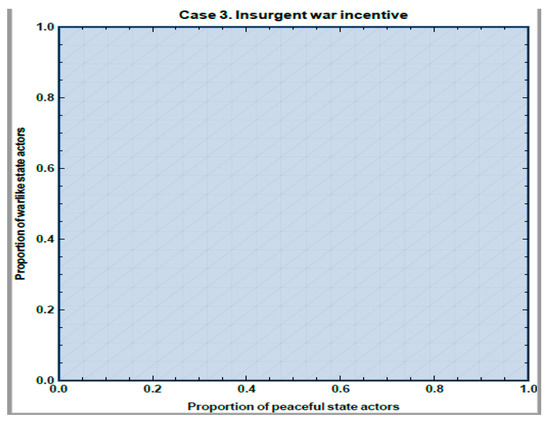
Figure 5.
Fitness for Insurgents when r = 0.3, δ = 0.99, c = 0.2, p = 0.5.
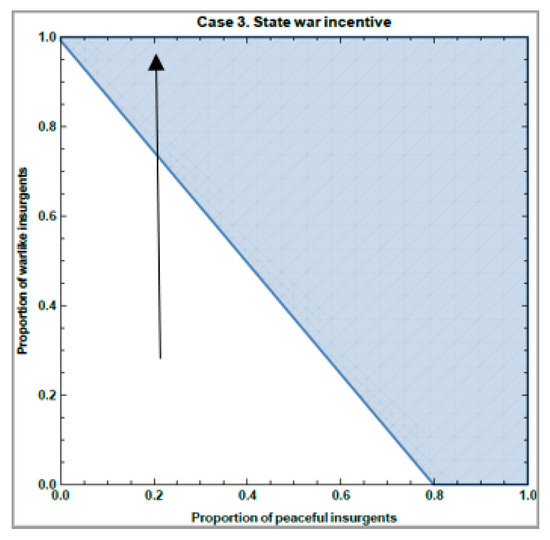
Figure 6.
Fitness for State when r = 0.3, δ = 0.99, c = 0.2, and p = 0.5.
This time let us first look at the State’s fitness in Figure 6. Let us start with the Insurgent population evenly distributed between the war and peace cultures, 20% each, and thus 60% of Insurgents are Bargain types. Now it is the State Actors that experience a higher fitness from bargaining. Thus, more and more State Actors will learn to become Bargain type so that the proportion of Bargain types in the State will increase.
What does this mean for the fitness that Insurgents experience (Figure 5)? Unfortunately, this increase will have no effect on Insurgents. No matter what the initial and changing distribution of types of State Actors, War is always fittest. Figure 5 is completely shaded. Thus, even the initial preponderance (60%) of Bargain types among Insurgents in Figure 6 does not make Bargaining a fitter culture for Insurgents. Insurgents will learn war, and as the proportion of warlike Insurgents approaches 1, State Actors will find war a fitter option and will learn war as well (see arrow for a possible pathway in Figure 6). The system will devolve into conflict. Even when actors are close to being perfectly committed, the culture of war is inescapable. Once again, conflict is learned until the conflagration consumes all.
Case 3: The reader will note that we have extreme values for r. Could a fairer sharing of resources have an impact on the path dependence of conflict? A 50% split is the fairest of them all. Therefore, here we analyze a scenario where r = 0.5 and agents are very committed. That is, r = 0.5, δ = 0.99, c = 0.2, and p = 0.5. Figure 7 and Figure 8 below illustrate the outcomes.
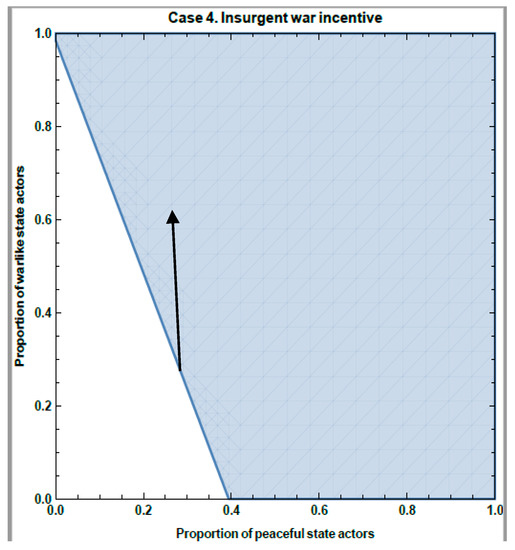
Figure 7.
Fitness for Insurgents when r = 0.5, δ = 0.99, c = 0.2, p = 0.5.
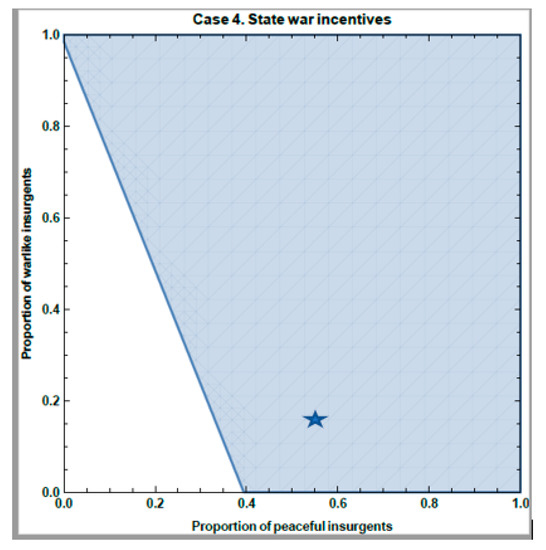
Figure 8.
Fitness for State when r = 0.5, δ = 0.99, c = 0.2, and p = 0.5.
Once again, let us start with 20% of each population being War type, 20% being Peace type, leaving 60% as Bargain type (Figure 7 and Figure 8 above, ignoring the arrow and star for now). In this system, and with this initial distribution of cultures, Bargain is the fitter culture. We are in the unshaded region in both figures. Thus, the proportion of War type in both populations will fall as more and more individuals learn that bargaining is a fitter strategy. Since bargaining is always a fitter strategy than peace (by the p > c assumption), this process, by definition, would increase the proportion of bargainers at the expense of both the war and peaceful cultures until both populations are fully of the bargaining type. Peace is definite in this scenario. However, it arises from the preponderance of the Bargain type agents—the ones who are willing to punish warlike transgressors. This reflects the well-known result that strong reciprocators can maintain cooperation because of their willingness to punish violators [23]. Further, this result suggests that peace is a function of the initial distribution of the population.
For example, say initially, the State’s fitness for War was higher, so that more and more State Actors learned War, making War the fittest culture for Insurgents as well. For example, suppose that 20% of Insurgents are War type, 60% are Peace type, and 20% are Bargain type so that the system is initially at the ‘star’ in the shaded region in Figure 8. For the State then, War is the fittest culture. This means that more and more State Actors will learn War. This will increase the proportion of War types in the system, moving the system into the shaded region of Figure 7, ultimately making War the fittest type among Insurgents as well. Thus, for instance, if the increase in War type State Actors comes only at the expense of Bargaining State Actors, with no change in the proportion of Peace type State Actors (see arrow in Figure 7), the threshold where enough Insurgents learn war to make War their fittest strategy is around 60% (top of the arrow). Once this happens, both populations will move toward war.
3.2. Case Summary
Recall that the shaded region in Figure 1, Figure 3, Figure 5, and Figure 7 shows where War is the fittest strategy for Insurgents given the proportions of War type and Peace type of State Actors. Similarly, the shaded area in Figure 2 and Figure 4, and Figure 6 shows where War is the fittest strategy for the State Actors given the proportions of the War culture and the Peace culture of Insurgents. These regions are determined via the replicator dynamic thresholds delineated in Equations (1) through (6). In cases 1 and 2 we show that the existence of a cultural learning process, i.e., the replicator dynamic in our model, completely negates the possibility of peace even when people are willing to come to the bargaining table, give up large shares of resources, and are very patient (committed) to peace. In case 3, when we model a very fair distribution of resources and very patient populations, peace is possible, but only for some, not all, initial distribution of cultures. That is, even when conditions favor fair bargains and a patient populace the existence of war as a possible learned behavior, i.e., a culture of war, can negate the possibility of peace.
4. Discussion
The cases illustrated here suggest that the theory of civil conflict should include culture or learned behavior as a proximate cause of civil conflict. The reader will note that when boundedly rational agents can learn behavior, neither paying off Insurgents nor close to perfect commitment to bargained deals is sufficient to ensure peace. In fact, even when peace is possible through an equal (fairer) division of resources and highly committed individuals, really, the initial distribution of culture matters. This, therefore, continues to highlight just how important culture is for initiating and continuing war. Moreover, our framework also captures how once war is initiated or even if war is only one among other options, more and more people rationally choose war. This highlights how war can be path-dependent, i.e., how conflict can cause conflict.
Theoretical models of conflict are not the truth. However, this model highlights that culture may be an internally consistent reason that makes conflict path-dependent even when the parties involved have a reason to be committed to peace and can gain a larger share of resources through bargaining. At one level, this result may be depressing. At another, it seems to fit the reality that sometimes conflict does start and persist even when attempts are made to redistribute resources (in northern Nigeria or post US invasion Iraq) or create institutions that have the appearance of promoting stability and patience (constitutional, democratic, and military reforms in Afghanistan for example). Moreover, our model has a flip side. It suggests that even without fair distribution of resources or institutions that do not facilitate patience, conflict may not happen. This, too, fits with the reality that the mere presence of horizontal/vertical inequality or bad institutions/weak states does not mean that conflict is inevitable.
Our theoretical model, therefore, is useful to generate further testable hypotheses. For example, to the extent that our model does explain conflict, at least under some circumstances, the path to conflict can end with a fairer distribution of resources. Moreover, our model suggests that as long as war is an option, even when the majority of a population is willing to negotiate, learning war is rational. This puts the emphasis of policy on both cultural learning and making the idea of war itself abhorrent so that it is not even an option. These changes are integral to societal institutions and how these institutions evolve as a matter of public choice. The cases of post-war Japan and Germany among powerful states and the case of Bhutan among less powerful states may be instructive.
5. Conclusions
Evolutionary dynamics may provide a theoretical framework for analyzing conflict path dependence. Such models can help us analyze scenarios where conflict may be learned by boundedly rational individuals suggesting that culture may be an important mechanism through which war can rationally persist. We thus add to the neo-classical concerns about opportunity costs and strategic concerns that include bargaining and commitment failure. This opens up a new modeling front in our understanding of conflict that can generate testable hypotheses about how culture might matter for conflict.
Funding
No Funding.
Institutional Review Board Statement
Not applicable.
Informed Consent Statement
Not applicable.
Conflicts of Interest
The authors declare no conflict of interest.
References
- Collier, P.; Sambanis, N. Understanding Civil War. J. Confl. Resolut. 2002, 46, 3–12. [Google Scholar] [CrossRef]
- Murdoch, J.C.; Sandler, T. Economic Growth, Civil Wars, and Spatial Spillovers. J. Confl. Resolut. 2002, 46, 91–110. [Google Scholar] [CrossRef] [Green Version]
- Blomberg, S.B.; Hess, G.D. The Temporal Links between Conflict and Economic Activity. J. Confl. Resolut. 2002, 46, 74–90. [Google Scholar] [CrossRef] [Green Version]
- Basuchoudhary, A.; Bang, J.; Sen, T.; David, J. Predicting Hotspots: Using Machine Learning to Understand Civil Conflict; Lexington Books; An Imprint of Rowman and Littlefield: Lanham, MD, USA, 2018. [Google Scholar]
- Jetter, M.; Mahmood, R.; Parmeter, C.; Ramirez Hassan, A. Explaining Post-Cold-War Civil Conflict among 17 Billion Models. The Importance of History and Religion. 2020. Available online: https://www.iza.org/publications/dp/13511/explaining-post-cold-war-civil-conflict-among-17-billion-models-the-importance-of-history-and-religion (accessed on 3 December 2021).
- Fearon, J.D. Rationalist explanations for war. Int. Organ. 1995, 49, 379–414. [Google Scholar] [CrossRef] [Green Version]
- Fearon, J.D. Why Do Some Civil Wars Last So Much Longer than Others? J. Peace Res. 2004, 41, 275–301. [Google Scholar] [CrossRef] [Green Version]
- Rubinstein, A. Perfect Equilibrium in a Bargaining Model. Econometrica 1982, 50, 97. [Google Scholar] [CrossRef] [Green Version]
- Powell, R. Bargaining theory and international conflict. Annu. Rev. Political Sci. 2002, 5, 1–30. [Google Scholar] [CrossRef]
- Powell, R. War as a Commitment Problem. Int. Organ. 2006, 60, 169–203. [Google Scholar] [CrossRef] [Green Version]
- Cederman, L.-E.; Vogt, M. Dynamics and Logics of Civil War. J. Confl. Resolut. 2017, 61, 1992–2016. [Google Scholar] [CrossRef] [Green Version]
- Kalyvas, S.N. The Logic of Violence in Civil War; Cambridge University Press: Cambridge, UK, 2006. [Google Scholar]
- Smith, E.A.; Mulder, M.B.; Hill, K. Controversies in the evolutionary social sciences: A guide for the perplexed. Trends Ecol. Evol. 2001, 16, 128–135. [Google Scholar] [CrossRef]
- Newton, J. Evolutionary Game Theory: A Renaissance. Games 2018, 9, 31. [Google Scholar] [CrossRef] [Green Version]
- Bang, J.T.; Basuchoudhary, A.; Mitra, A. Validating Game-Theoretic Models of Terrorism: Insights from Machine Learning. Games 2021, 12, 54. [Google Scholar] [CrossRef]
- Anderton, C.H.; John, R.C. Principles of Conflict Economics: A Primer for Social Scientists; Cambridge University Press: Cambridge, UK, 2009. [Google Scholar]
- Skaperdas, S. An economic approach to analyzing civil wars. Econ. Gov. 2007, 9, 25–44. [Google Scholar] [CrossRef]
- McElreath, R.; Boyd, R. Mathematical Models of Social Evolution: A Guide for the Perplexed; University of Chicago Press: Chicago, IL, USA, 2008. [Google Scholar]
- Basuchoudhary, A.; Cotting, D. Cultural assimilation: The political economy of psychology as an evolutionary game theoretic dynamic. Evol. Behav. Sci. 2014, 8, 209–222. [Google Scholar] [CrossRef]
- Gintis, H. Game Theory Evolving; Princeton University Press: Princeton, NJ, USA, 2009. [Google Scholar]
- Fudenberg, D.; Maskin, E. The Folk Theorem in Repeated Games with Discounting or with Incomplete Information. Econometrica 1986, 54, 533. [Google Scholar] [CrossRef] [Green Version]
- Harrington, J.E. Games, Strategies, and Decision Making; Worth Publishers: New York, NY, USA, 2014. [Google Scholar]
- Bowles, S.; Gintis, H. The evolution of strong reciprocity: Cooperation in heterogeneous populations. Theor. Popul. Biol. 2004, 65, 17–28. [Google Scholar] [CrossRef] [PubMed]
Publisher’s Note: MDPI stays neutral with regard to jurisdictional claims in published maps and institutional affiliations. |
© 2021 by the author. Licensee MDPI, Basel, Switzerland. This article is an open access article distributed under the terms and conditions of the Creative Commons Attribution (CC BY) license (https://creativecommons.org/licenses/by/4.0/).