Abstract
In the present day, unmanned aerial vehicles become seemingly more popular every year, but, without regulation of the increasing number of these vehicles, the air space could become chaotic and uncontrollable. In this work, a framework is proposed to combine self-aware computing with multirotor formations to address this problem. The self-awareness is envisioned to improve the dynamic behavior of multirotors. The formation scheme that is implemented is called platooning, which arranges vehicles in a string behind the lead vehicle and is proposed to bring order into chaotic air space. Since multirotors define a general category of unmanned aerial vehicles, the focus of this thesis are quadcopters, platforms with four rotors. A modification for the LRA-M self-awareness loop is proposed and named Platooning Awareness. The implemented framework is able to offer two flight modes that enable waypoint following and the self-awareness module to find a path through scenarios, where obstacles are present on the way, onto a goal position. The evaluation of this work shows that the proposed framework is able to use self-awareness to learn about its environment, avoid obstacles, and can successfully move a platoon of drones through multiple scenarios.
1. Introduction
“We’ll have self-flying cars before self-driving cars”
This statement by Sebastian Thrun, who headed Google’s self-driving car initiative for years, at TechCrunch Disrupt SF 2019 (https://techcrunch.com/2019/10/03/self-flying-before-self-driving/) shows that unmanned aerial vehicles (UAV) are the next trend in transportation. Companies such as Volocopter, Boeing (in cooperation with Porsche), and Airbus (in cooperation with Audi) make tremendous progress in the development of self-flying air taxis. DHL already uses drones for packet delivery (https://discover.dhl.com/business/business-ethics/parcelcopter-drone-technology); Amazon plans to do so in the upcoming months (https://www.amazon.com/Amazon-Prime-Air/b?node=8037720011). All those examples show that the presence of self-flying vehicles is no science fiction anymore.
However, as those vehicles also fly within cities between buildings and skyscrapers in a height that is not allowed for civil airplanes, they are traveling in unregulated environments. Without regulation of the increasing numbers of UAVs competing for air space, this could very well lead to chaotic and inefficient use of this limited resource. It can be envisioned that numerous accidents in this environment (to various degrees of severity) are likely to happen in the future. Furthermore, delays in time-critical UAV missions are possible due to the unforeseeable nature of chaos. One approach from the intelligent transportation systems research related to highway traffic that could be transferred to the UAV traffic is platooning: The cooperative driving of automatically steering vehicles in close formation with gaps of three to ten meters enabled through communication [1]. Platooning does not only offer fuel-saving through slipstream effects, but it also helps to organize the traffic through the homogenization of travel velocities and improving the capacity of streets. Usually, platooning is proposed for highways; however, in [2], we propose a hybrid concept for platooning in cities. The platooning concept is envisioned to create virtual air traffic lanes, which are dynamically planned with the help of platooning derived rules and allow the safe coordinated flight of UAVs.
Combining UAVs with platooning may be one part of a solution to bring order to chaos. To achieve this, we rely in this paper on the concept of Self-Aware Computing (SeAC) [3]: Self-aware computing systems are computing systems that:
- learn models capturing knowledge about themselves and their environment (such as their structure, design, state, possible actions, and runtime behavior) on an ongoing basis and
- reason using the models (e.g., predict, analyze, consider, and plan) enabling them to act based on their knowledge and reasoning (e.g., explore, explain, report, suggest, self-adapt, or impact their environment) in accordance with higher-level goals, which may also be subject to change.
SeAC supports the UAVs in learning, reasoning for self-adaptation [4], and acting, which enables them, among other things, to handle exceptional (unforeseen) situations like collision avoidance for (new) fast approaching entities. In addition, it should also improve its control by the input of high-level goals that the SeAC logic breaks down into lower-level goals, which are then implemented by its models and reasoning. Dynamic behavior benefits in the form of collision avoidance for known or slow-moving objects and adaptation to changing conditions (besides the weather) like different failure states of the quadcopter itself. Furthermore, we can integrate platooning capabilities into the reasoning functionality to cope with changes in its platoon formation such as the election of a new leader–follower constellation or new virtual air traffic lane. Accordingly, our contributions are threefold:
- We propose a framework (ToSaMuFo) for the platooning-based organization of UAVs using SeAC.
- We provide an implementation of our framework using the Robot Operating System (ROS).
- We evaluate our approach in various simulation settings and with real quadcopters.
The remaining sections of this work are structured in the following way: Next, Section 2 discusses related work in the context of UAV formation. Section 3 (i) explains assumptions, constraints, and requirements, (ii) presents the combination of SeAC and platooning into one framework, as well as (iii) sketches the implementation of a prototype based on ROS. Afterwards, Section 4 details the evaluation environment, flight scenarios, methodology, and informs about the results of the evaluations. Finally, Section 5 concludes this work with a summary of our results and future work.
2. Related Work
Different types of control methods for quadcopter formations exist. Those can be clustered into (i) flocking based quadcopter formation control, (ii) model predictive control, (iii) feedback linearization, (iv) particle swarm optimization, (v) linear-quadratic regulator, (vi) sliding-mode control, and (vii) self-aware quadcopters. In the following, we review these categories of strategies for controlling quadcopters in general and formation in specific. Furthermore, we delineate the existing work from the approach presented in this paper.
Flocking-based quadcopter formation control relies on three behavioral principles that are transferred from collective motion observed in natural flocks, schools and herds (e.g., birds, fish, and other animals) [5]: collision avoidance, velocity matching, and flock centering. Based on these three rules, Vásárhelyi et al. presented different aspects of the subject on quadcopter formation control over the years. Starting with their work in 2014 [6], two decentralized control algorithms are presented as a realistic simulation framework: a simple self-propelled flocking model (based on the aforementioned principles) and a collective target tracking algorithm. Based on this work, Vásárhelyi et al. described in [7] an approach in which every agent navigates on its own, based on information received from nearby flock-entities and all computation is done on-board. Additionally, Vásárhelyi et al. present an approach for seamless navigation in confined spaces for large flocks of autonomous flying agents [8]. In [9], air-traffic related approaches of flocking were compared in UAV traffic simulation scenarios. With two different self-organized algorithms, one for constant direction and one for constant velocity, which both were optimized by evolutionary optimization. Lastly, Vásárhelyi [10] presented an approach based on anisotropic repulsion, behavior-driven velocity alignment, self-organized queuing, and conflict-avoiding self-driving. This model is also optimized with evolutionary optimization and demonstrated outdoors with 30 quadcopters. Further works focus on flocking-based coordination of land vehicle robots (e.g., [11,12]).
Model Predictive Control (MPC) enables process control using predictions to optimize output(s) for a finite time-horizon while utilizing a dynamic model of the process as well as being able to satisfy a set of constraints [13]. It is considered an advanced method in contrast to, for example, generic proportional–integral–derivative (PID) controllers and is typically used when these controllers can not cope with difficulties like large time delays or high-order dynamics [14]. Therefore, they are often used for the complex dynamics of quadcopter systems. MPCs factor in the full sequence of input steps that are required to optimally move the controlled system from its current state to a future target [15]. After applying the first inputs, additional calculated sequences of inputs are not used, but, instead, new measurements about the system states and external targets are taken. This new information is, again, used to calculate an optimal trajectory. This procedure is repeatedly executed with newly updated measurements of external and internal signals. The computational heavy calculation process limited their application on quadcopter systems in the past, but modern model variations and the latest progress of on-board processing capabilities enable more widespread usage on these systems. Several authors present works based on MPC, e.g., hierarchical MPC controllers [16,17,18,19], leader–follower approaches [20], a distributed MPC based collision avoidance controller [21], local linear time-invariant MPC controllers [22,23], and for decoupling the formation control into horizontal and vertical motions [24]. Furthermore, Kamel et al. gives an overview [25] on different (modern) MPC variations, its design for multirotor systems, and implementation in Robot Operating System (ROS).
Feedback Linearization is used to control nonlinear systems as if they were linear systems. The nonlinear system is to be transformed (not trivial) by ’changing variables and a suitable control input’ [26]. In the case of the highly nonlinear quadcopter system, a linearization in one or more ways is reasonable [26]. By utilizing feedback linearization, Mahmood and Kim simplified quadcopter dynamics to achieve a formation through local information exchange [27]. Using a singularity-free dynamic inversion scheme, the authors later achieved an ’almost linear’ control law [28]. Another formal and more defined refinement of [27] can be seen in [29]. In the authors refined the presented work by changing the control law to a robust feedback linearization and adding a sliding-mode compensator against possible dynamics inversion errors.
Particle Swarm Optimization (PSO) is an optimization method that tries to solve a problem ‘by iteratively trying to improve a candidate solution’ [30]. Particles start at different points and move with a degree of randomness to find a solution while following parameter gradients [30]. Ma’sum et al. presented a modified particle swarm optimization algorithm that tries to find, localize, and track suspicious objects [31]. In case of this PSO for quadcopter formations, every UAV in the formation can be seen as a particle in a swarm that tries to find a solution, e.g., the tracked target. Lazim et al. [32] use PSO for optimizing feedback linearization formation control.
Linear–quadratic regulator (LQR) generally tries to minimize a (quadratic) cost function employing a set of linear differential equations (description of the linear dynamic system). The solution can then be applied as a feedback controller. As one example for a LQR-based controller, Rinaldi et al. [33] adopt a LQR controller which is applied to the full quadcopter dynamics and a comparison of LQR with a neural network based control strategy for the vertical motion is given (model reference control).
Sliding-mode control (SMC) supports the design of a sliding surface (in state space) and the selection of a control law which attracts the system state (of a dynamic system) to the aforementioned surface [34]. Mercado et al. uses an SMC for translational quadcopter dynamics and additionally for follower UAVs to preserve their formation with the leader in [35]. Low-level control for each quadcopter is accomplished by a classical PD (proportional-derivative) controller. Wu et al. [36] adopt the idea of Mercado et al. [35] and use a PID (proportional-integral-derivative) controller for each UAV as well as SMC to solve the formation flying problem through a leader–follower approach.
Self-aware quadcopters try to integrate artificial intelligence for improved quadcopter control. Palossi et al. [37] deploy a deep neural network (DNN) on a 27-g light nano-quadcopter (CrazyFlie 2.0) to add artificial intelligence-based visual navigation capabilities. Implementation of this low-power DNN required extensive and deep onboard computer system modifications (e.g., memory mapping) as well as their own PCB-shield to separate the low-level-flight control of the quadcopter from their visual navigation engine. Kosak et al. [38] introduce a reference architecture for mobile robots. This architecture integrates reconfigurable and self-descriptive hardware which the robot agents (e.g., quadcopters) can use to change their own setup at runtime to adapt to a new task. Their concept of controlling robots with a layered software architecture combined with self-awareness showed that robots can develop heterogeneous specific knowledge at runtime.
Delineation from Related Work: Related work provides several approaches for formation flights of quadcopters as well as how to control the flight behavior of quadcopters autonomously. However, most of the approaches focus on the establishment of the formation, i.e., keeping of distances and coordinating flight activities, rather than the spontaneous establishment of the formations. Present-day centralized air traffic control will not be able to extend its responsibilities to encompass the future amount of UAVs whilst maintaining every safety regulation, safety distance, and govern all their flight paths in a timely manner. Furthermore, the present-day quadcopter software rarely is equipped with an extensive collision avoidance system, which would be able to function in unforeseeable (usually meaning: not programmed) situations, and it is necessary to relieve air traffic control. The learning aspect of SeAC can contribute to this issue. Therefore, we focus in this paper on a completely new type of controlling the formation flights of drones. By implementing principles from SeAC on quadcopters to realize platooning-based formation flights for UAVs, we aim at fostering individual behavior. Through learning, the quadcopters can collaboratively find paths and fly together in a loosely-coupled formation for organizing the air traffic. This can help to alleviate traffic control, bring order to otherwise possibly chaotic air space, as well as advance quadcopter dynamic behavior through this self-awareness.
3. Approach
This section first motivates the approach of this work by discussing constraints and assumptions, and deriving several requirements our proposed framework called ToSaMuFo has to meet in Section 3.1. Afterwards, Section 3.2 presents our system model that modifies a control loop introduced by the SeAC community to combine self-awareness functionalities with platooning capabilities. Section 3.3 and Section 3.4 describe the awareness as well as the platooning modules of the modified LRA-M loop in detail. Finally, we propose a prototype implementation of ToSaMuFo with Virtual Robot Experimentation Platform (V-REP) as a simulator using the Robot Operating System (ROS).
3.1. Constraints, Assumptions, and Requirements
As the fields of quadcopter control and self-aware computing can be considered vast, the scope of this work is only focused on aspects of both fields that merge profitably. To guarantee a flexible and dynamically applicable framework, we define the following constraints and assumptions.
The first assumption we make is the ability of stable hovering the quadcopters in use need. Second, each quadcopter is able to fly to a specified eligible position in a three-dimensional space. We do not specify this ability in more detail as any specific constraint could limit the performance of the platooning or collision avoidance. Third, every quadcopter needs to be equipped with reliable sensors, capable of identifying obstacles repeatedly. Fourth, a communication module for each quadcopter is required that enables the quadcopters to broadcast their knowledge about themselves and the environment to all other quadcopters. Finally, we assume that the environment in which the quadcopters fly remains static during the whole flight, i.e., besides the quadcopters within the platoon, no moving objects are in this scenario and identified obstacles persist.
Based on these constraints and assumptions, we derive the following requirements: First, a quadcopter should learn about itself and the environment on an ongoing base. Second, ToSaMuFo needs to assemble the quadcopters of the given scenario on-the-fly into a platoon. Third, the platoon should reach a goal position by finding a way to this position and avoiding possible obstacles. Fourth, the proposed prototype implementation of the software framework should be designed modularly to enable a flexible exchange of components. Finally, our prototype should support simulated flights as well as real-world scenarios to allow for comprehensive and realistic evaluation.
3.2. System Model
After summarizing constraints and assumptions as well as deriving requirements for our approach, we now give a broad overview on the system model of ToSaMuFo. As learning and reasoning are the main points in SeAC systems and our requirements contain that quadcopters should learn and reason about themselves and their environment, we decided to have a closer look into the mechanisms from this research field.
An elementary model-based learning and reasoning loop that captures “the main activities in a self-aware computing system” ([3] p. 13) is the learn-reason-action loop (LRA-M loop), which can be seen in Figure 1. It illustrates the self, its interfaces, and inner workings of a self-aware system with its empirical observations, as well as its goal-driven actions. The empirical observations are used in the ongoing learning process that analyzes the observations and stores gathered knowledge about the system and its environment using models. The reasoning process employs knowledge from the models and the given goals to determine the next actions the system should execute to achieve these goals. These actions may influence the systems’ behavior and possibly impact the environment.
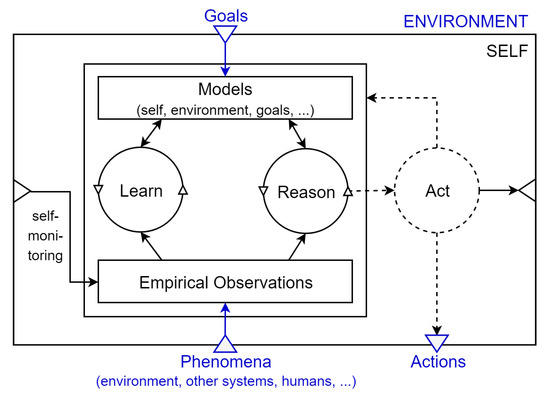
Figure 1.
Self-aware learning and reasoning loop: LRA-M loop [3]. External phenomena about, e.g., the environment are captured inside the empirical observations block. The Reason component provides possible adaptations of the systems after reasoning on information captured in models. The Learn component improves the reasoning part by extending the existing models. Those models capture observations, goals but also information about the system itself, e.g., feasible adaptation actions.
The LRA-M loop seems to perfectly match our requirements, as ongoing learning about the environment is used in combination with reasoning for the next actions of the system. However, we aim at a modular framework that enables quadcopters to find a way through an environment containing obstacles and to fly platoon formations. Therefore, the LRA-M loop is adapted to ensure the modularity of our approach by implementing separate modules for the awareness and the platooning functionality of each quadcopter, i.e., every quadcopter has its own modified LRA-M loop that is responsible for the positioning and obstacle detection. By duplicating and connecting the inner workings of the LRA-M loop into two separate modules, we improve the upgradeability and interchangeability of features, e.g., to allow for changes in the collision detection of the awareness module without modifications of the platooning module. Figure 2 shows the modified LRA-M loop containing separate modules for awareness and platooning. The awareness module is responsible for maintaining a map of the environment, finding a path through this map, and avoiding collisions. The platooning module cares about all platooning-related information and decisions, i.e., assembles the quadcopters on-the-fly, and manages safety distances between the quadcopters.
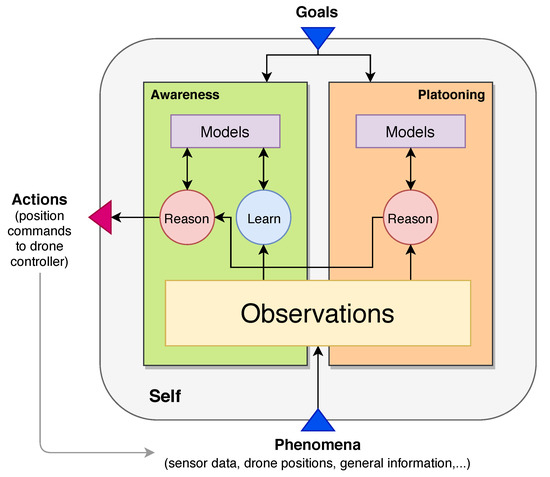
Figure 2.
Self-aware learning and reasoning loop with platooning. Duplicated and modified LRA-M loop to separate the awareness and platooning responsibilities inside modules. The platooning module captures all platooning-related information and makes appropriate decisions. The awareness module maintains all self-aware functionalities and has the final say on decisions.
The loop receives information from the environment via measured phenomena and preset goals from an operator. These phenomena, i.e., sensor data, quadcopter positions, and general information about the map, are collected and stored without alteration in the observations block. This block serves as an information provider of measured environmental data for both modules. External goals such as a final goal position or waypoints are given to both modules. The modified loop can not only sense the environment but affect it by sending decisions using the actions block. These contain position commands that the quadcopter controller uses for moving.
In summary, we take the key principles of the LRA-M loop, i.e., self, goals, phenomena, observations, and actions as granted, but duplicate the inner workings containing learn, reason, and models into two separate modules and connect them. Both modules receive observations and goals. The reason blocks are connected so that a joint plan is forwarded to the actions block. In addition to this system model, we add two flight modes to ToSaMuFo to support the functionality of flying in a platoon as well as detecting and avoiding obstacles: (i) Using waypoint following, the platoon receives a list of positions the leader has to fly to while the other quadcopters follow the leader maintaining predefined safety distances. We assume that there are no obstacles in the environment for this flight mode. (ii) In the pathfinding mode, the quadcopters receive one final goal position they need to reach. They have to find a way to this position, detect obstacles in their way, and avoid them autonomously. The waypoint following is located in the platooning module as the leader only has to follow given coordinates while the pathfinding is located in the awareness as the quadcopters need autonomous capabilities of finding a path and detecting obstacles. In the following, the two modules platooning and awareness are described in more detail and a flowchart is provided in Figure 3 to illustrate the general framework behavior based on our modified loop.
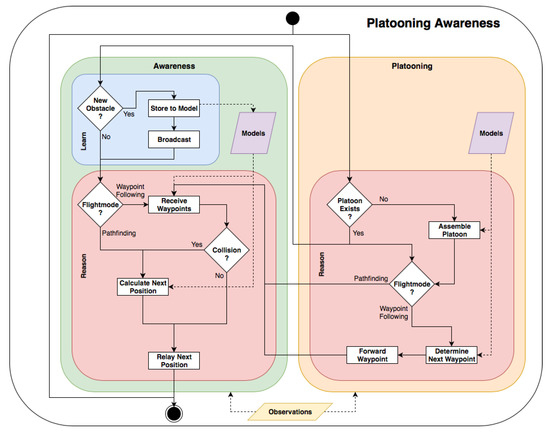
Figure 3.
Platooning awareness flowchart. Inner workings of the learn and reason nodes are shown in the context of the main loop. Colors correspond to the general loop illustration.
3.3. The Platooning Module
The platooning module of the modified LRA-M loop is responsible for all platooning-related parameters and decisions the quadcopters have to manage. Two main functionalities are modeled into this module: (i) It assembles the quadcopters into a platoon on-the-fly, e.g., at the start of a scenario, and (ii) determines new position coordinates for each quadcopter when the leading quadcopter moves. In this subsection, the components of the platooning module, i.e., models and reason blocks, are described in detail, before the functionality of the waypoint following flight mode is presented.
The models block inside the platooning module is used as introduced for the original LRA-M loop. It stores information about the incoming goals, all platooning related parameters, as well as models for decisions of the reason block. The incoming goal comprises the waypoints to be followed, containing a platooning start position, several further coordinates representing the path, and a final goal position. Platooning parameters can be the safety distance and platooning formation distances that need to be maintained during a platooning flight and the desired number of quadcopters that should create a platoon. In addition, a mathematical model is used to determine the position of each quadcopter inside the platoon before assembling into one.
Thereasonblock has two main responsibilities: (i) assembling a platoon on-the-fly and (ii) determining the next position of all quadcopters during flight. Therefore, it receives sensed information about all quadcopters from the observations block and combines them with knowledge requested from the models to find the next position of the quadcopter it manages. This new position is then forwarded to the reason block of the awareness module to determine whether this position can be reached or potential obstacles block the path.
To assemble a platoon on-the-fly, first a position inside the platoon needs to be determined for every quadcopter. Therefore, each quadcopter receives the platooning start position from the models block. This position and the current position of the quadcopter is used to calculate the Euclidean distance between these positions. The distances are then broadcast to all other quadcopters. The position inside the platoon is then determined using the broadcast distances to the start position by ordering them in ascending order, i.e., the quadcopter currently closest to the start position will be the leader, the quadcopter second closest will be the first follower, and so on. After the position inside the platoon is determined, the coordinates of the start position for all quadcopters need to be calculated. The leader uses the given start position from the goal block and moves there. The followers use this start position, the given safety distance, and their positions inside the platoon to calculate their position offset from the leader. For example, the quadcopter in the second formation position uses the safety distance as offset while the third quadcopter multiplies it by two, the fourth quadcopter by three, and so on until all positions are determined and then the quadcopters move to this position. Hereby, the waypoint following flight mode is assumed to be a two-dimensional formation, so the flight level of all quadcopters is the same. After assembly and receiving a start signal, the leader follows predefined waypoints or moves to a single goal position, while the formation follows in its current order.
Thewaypoint followingmode is started when the assembly of the platoon is finished. Therefore, the leader receives the given waypoint path from the goals block and needs to prepare the path to remove breaks and abrupt direction changes. We assume for this flight mode that the environment does not contain any obstacles and thus no collisions with other objects besides the quadcopters need to be detected. In our approach, we provide a circle waypoint path that can be transformed into a spiral if height steps are provided. The path starts in the center of the circle/spiral, extends to its circumference and follows it for one round trip. First, a rudimentary path is created, planning a straight line from the starting position in the center of the given waypoints to the circle that is defined by the waypoints. Using a Bézier algorithm, we smooth the path, especially the connection between the resulting line towards the circle path and the circle. Otherwise, the raw path would cause the quadcopters to abruptly change their direction by 90 degrees and likely induce greater path deviations while turning. After the leader smoothed the waypoint path to avoid unnecessary oscillations of the platoon, it starts moving along this path by forwarding the next position to the awareness module. The followers store every broadcast leader position and use this list to determine a position behind the leader similar to the calculation of the offsets when assembling the platoon.
3.4. The Awareness Module
The awareness module, depicted on the left in Figure 2, is responsible for the self-aware capabilities of the quadcopters. Its main functionalities contain four different aspects: (i) It has the final decision-making power, (ii) maintains a safety distance to obstacles, (iii) resolves conflicts generated by the decisions of the platooning module, and (iv) publishes diverse information about quadcopter positions and identified obstacles. In the following, all components of the awareness module, i.e., learn, models, and reason are explained in detail, followed by the functionality of the pathfinding flight mode.
Themodelsblock contains all relevant information about the environment gathered over time and the goals received at the start-up. It serves as an information provider and maintains a map of the environment in which the positions of the other quadcopters as well as the current flight path and obstacles are stored. For the pathfinding flight mode, it receives the platoon’s final goal position and files it. In addition, the planned path of the quadcopter towards the goal is stored so that the quadcopter solely follows this plan. It serves as a source of information for the reason block of this module that resolves position conflicts of quadcopters and obstacles.
Thelearnblock of the awareness module is responsible for the information interpretation and update of the environmental map. Therefore, it receives information about the environment from the observations block and interprets the detected objects. Hereby, it has to differentiate between other quadcopters in the surrounding and actual obstacles. This gathered knowledge is then used to update the existing map in the models block and store all relevant information into models.
Thereasonblock has the general responsibility of conflict resolution between planned positions of quadcopters and already identified obstacles. Therefore, it needs to distinguish between the two flight modes waypoint following and pathfinding and adapts its decision logic accordingly. In the case of the waypoint following flight mode, it receives the next planned position for the quadcopter. This position is then checked for possible collisions with known obstacles or other quadcopters. If a collision is detected, alternative coordinates are calculated by applying the pathfinding flight mode towards the next waypoint. If the path is clear, the desired position from the platooning module is forwarded to the action block. In the case of the pathfinding flight mode, the leader receives the final goal position and searches a path to this goal using a modified A* algorithm. The followers receive their predecessors’ position as a goal so that a binary leader–follower platoon structure is deployed. However, the initial assemble functionality lies inside the platooning module as well as the information about platoon formation distances. The leaders’ aim, in this case, is to find a path around obstacles, the followers only calculate a path to the quadcopter in front of them while navigating around obstacles and maintaining the given safety and platoon formation distances.
Thepathfindingflight mode is used to move a quadcopter from its current position to a goal position in the presence of obstacles. The leader is moving towards the final goal position, while the followers each have another quadcopter, their platoon forerunner, as the goal. The followers move towards their predecessor until they reach the predefined formation distance. The quadcopters use a modified A* algorithm either for finding the path to the final goal position or the predecessor. Whenever one of the quadcopters detects a new obstacle, the A* algorithm is rerun for all quadcopters in this platooning formation to ensure that all quadcopters recognize the obstacle and avoid it. Additionally, if the followers detect that their predecessor has moved outside the desired formation distance, it triggers the A* algorithm to again plan a path towards the predecessor and follow it.
During this flight mode, all quadcopters only move in straight lines on their unified flight level, either going exclusively in + or − direction on the x-axis, or y-axis respectively, akin to a rook in chess. This is done because the pathfinding algorithm uses an x–y grid map, comprised of small quadratic spaces (herein called boxes) and moves the quadcopters from one box-center to the next resulting in a line movement that can be seen in Figure 4a. Given that the framework should be usable by platoons consisting of different kinds of quadcopters with possibly different sizes, the box dimensions herein are not related to the size of a specific quadcopter. The boxes in combination with a safety distance ensure that a quadcopter flying nearby obstacles does not collide with it. The higher the resolution of the map becomes, i.e., the smaller the boxes become, the closer a quadcopter would get to an obstacle in an adjacent box. To explain this with an example: The quadcopter may have dimensions of 0.35 m × 0.35 m and the general box size may be 0.20 m × 0.20 m. Meaning that a quadcopter in the center of a box would extend 0.075 m over its borders and very likely collide with an obstacle in a box alongside. The general idea behind the safety distance and taking smaller box sizes into account is illustrated in Figure 4b. To counter the negative effects of the higher map resolution, a safety distance (depicted in yellow) around obstacles (depicted in red) is introduced, which is also considered an obstacle, i.e., a quadcopter must not use this box, by the pathfinding algorithm. This ensures that quadcopters extending over box borders into the safety distance do not collide with known obstacles nearby. In the example above, a safety distance of at least 0.075 m makes sure the quadcopter will not come into contact with a known obstacle. In fact, it creates a distance of at least 0.125 m between quadcopter and blocking box as the safety distance is also realized with boxes: the general box size in this example is 20 cm × 20 cm, which is larger than the required 0.075 m, incidentally creating a buffer zone of box size − quadcopter extension over the border = required safety distance, in this example: . This has to be taken into account when choosing box sizes and safety distances as this mechanism could block otherwise passable openings. Furthermore, in Figure 4a, a successful pathfinding flight is shown. The start and goal positions are labeled A and A’, respectively. The red boxes are identified obstacles, yellow represents the boxes within the safety distance, and the blue line shows the flight path of the quadcopter. The grey boxes are still unexplored and no knowledge has been gathered during the flight. In the case that there is not enough physical space behind the leader to fit the whole platoon in a straight line, the platooning line would simply be in the same form as the path it has moved and stay there until the platoon moves again.
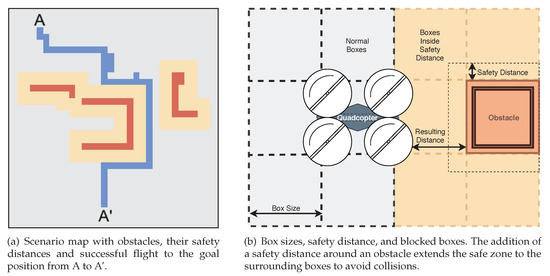
Figure 4.
Operating principles for pathfinding flight mode showing obstacles (red), safety distances (orange), and the found path (blue) through the environment on the grid map (grey).
3.5. Prototype Implementation
According to the requirements from Section 3.1, the framework needs to offer the possibility to test and evaluate flights both in simulation and real-world scenarios. To satisfy this requirement and to be able to thoroughly test the framework’s fulfillment of all other requirements, a simulation environment needs to be selected. Therefore, we set the following requirements: (i) available for free or even an academic license must be provided, (ii) support quadcopters natively, (iii) offer an implemented quadcopter controller, and (iv) offer a well-documented interface, i.e., an application programming interface (API) that works with the Python programming language, which the framework intends to mainly use. V-REP was chosen as the simulator because, additionally to satisfying all simulator requirements, it offers a feature-rich environment, including a quadcopter test-scenario, can be used with ROS, and is expandable with self-programmed add-ons or plugins. Furthermore, open-source components are accessible on Coppelia Robotics GitHub (https://github.com/CoppeliaRobotics), and the simulator can record simulation runs itself. Using this simulator as a basis, we now focus on the prototype implementation of ToSaMuFo. Note: V-REP is now discontinued and replaced with CoppeliaSim, which is not yet tested with our framework but should, according to Coppelia Robotics, still be usable.
We choose ROS as the backbone for ToSaMuFo because of its modular design, which aligns with the assumptions w.r.t. modularity (cf. Section 3.1). Furthermore, ROS is prevalent in the robotics and multirotor simulation sector, V-REP offers a direct interface to ROS and the quadcopters of the real-world flights also support ROS. Generally speaking, the use of ROS allows ToSaMuFo to be distributed as a plug-and-play package and supports swapping out different nodes with varying underlying functionality, as long as the required topics and messages are adapted.
The communication infrastructure of ROS is applied to separate identical nodes into a group for each quadcopter and to emulate a broadcast (publish/subscribe) communication system between them. In our framework, the inter-node communication is mainly utilizing custom messages derived from the ROS standard message types.
Figure 5 depicts the node structure of ToSaMuFo (The code of our prototype implementation is available at http://descartes.tools). This consists of a node to connect with a simulator and one for real hardware, a node that encapsulates the Platooning Awareness functionality of each quadcopter, called “Drone 1” to “Drone N”, and a connector node to connect them. Thus, ToSaMuFo supports an arbitrary number of drones. Position data or other observations are relayed from, e.g., the simulator to its interface, from there to the connector and then to the quadcopter. After the quadcopter chooses its positional response to these inputs, a new position is commanded. This command now traverses from right to left, passing the same nodes, as the inputs before, in reversed order. The Platooning Awareness node is split into two nodes, corresponding to Figure 2 and incidental representing its two-node implementation in ToSaMuFo. The inter-node communication network uses message topics. All nodes that are subscribed to a topic will receive all messages published for this topic. In addition, it is feasible to have multiple publishers at the same time for the same topic. In [39], we provide additional details on the topics and their message types.
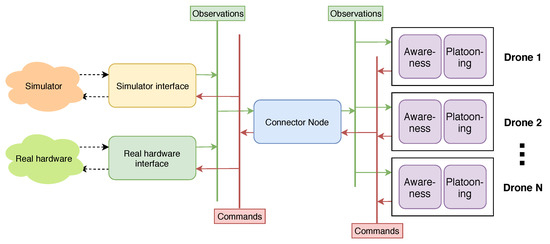
Figure 5.
Abstract node graph of ToSaMuFo for multiple quadcopters with publish/subscribe topics. Observations and data propagates from the simulator or hardware through the node network to the platooning awareness loops of each drone and back, utilizing standard and custom ROS message types.
4. Evaluation
This section describes the evaluation of the performance of ToSaMuFo and presents findings from simulation and real-world flights. First, Section 4.1 introduces the evaluation environment. Then, Section 4.2 explains the scenarios and Section 4.3 describes the evaluation metrics. Afterwards, Section 4.4 presents the evaluation methodology. Next, Section 4.5 discusses the evaluation results for three different flight types: circle waypoint paths, spiral waypoint paths, and pathfinding. Finally, Section 4.6 presents a use case study in which ToSaMuFo runs on real quadcopters.
4.1. Evaluation Environment
In the following, we describe the environment for the evaluation. The setup consists of one physical computer (Windows 10, 8 cores @ 3.5 GHz, Nvidia GTX 1070, 16 GB RAM) serving as host system for a virtual machine (VM)(Kubuntu 18.04, 8 cores, vGPU with 128 MB memory, 8 GB RAM) for evaluating and storing the flight data. The VM runs ToSaMuFo on top of ROS (cf. Section 3.5) and uses the V-REP simulator. After the initial software setup (VBox: 5.2.28, ROS: Melodic Morenia, V-REP PRO EDU: 3.6.1 (rev.3), Python: 2.7 and 3.7.4, IPython: 7.8.0, Jupyter Notebook: 6.0.1, pandas: 0.25.1), ToSaMuFo is integrated into ROS’ catkin workspace as a source package.
Figure 6a shows the virtual drones inside the V-REP simulator. Their body base dimensions are 0.35 m × 0.35 m and they use a simple quadcopter controller, which is already included in V-REP and based on a PID controller. To control the position of such a drone in V-REP, the position of the green sphere is changed. This sphere represents the “target” position that the quadcopter controller aims for and applies the motor thrust according to its control laws to fly there. Because the drones can not be controlled directly by ToSaMuFo, the velocity and behavior of the drones can only be controlled indirectly by setting waypoints/path positions closer together for slower movement or further away to increase speed. In accordance with related work [40], our experiments have shown that it is preferable in our setting to use slower speeds, i.e., put points closer to each other because the PID controller tends to overshoot in acceleration for faraway points. Below this threshold, this behavior still exists but is less prevalent and is similar to other controller schemes. Before the start of a platooning formation flight, the virtual quadcopters are aligned behind the leader drone, and small variations in their z-axis (height) position are applied to visualize the assembly command of the formation in the figures. These height differences are typically in the range of five to ten cm, resulting in z-coordinates of to m.
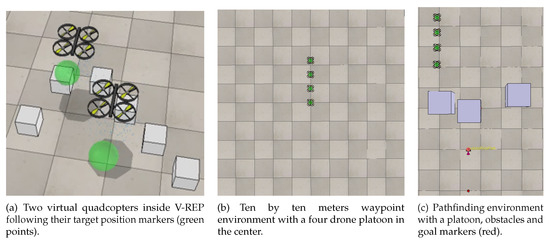
Figure 6.
Usage of the V-REP simulator for evaluating the flight performance of ToSaMuFo.
4.2. Scenarios
In total, we discuss 15 scenarios with three varying evaluation parameters w.r.t. the flight type, the formation distance value, and the box size. Table 1 lists all conducted virtual evaluation scenarios. Every scenario is carried out 30 times to allow for statistically significant conclusions.

Table 1.
Overview on all evaluation scenarios and their parameters.
Given that this framework is a proof-of-concept, only two simple scenario maps are used to evaluate the concept. Furthermore, only four drones are used to keep in line with vehicle platooning literature (3–5 cars and/or trucks) and restrict the computational resource requirements, but still show the scalability of the approach. For future works, more drones and complex maps in a more realistic simulation environment with inter-platoon interactions, coordination, and platoon assignments are envisioned.
Figure 6b,c show the two maps that the scenarios use. To evaluate the two flight modes from Section 3, two environments are prepared, each corresponding to one mode. In the first mode “Waypoint following”, the leading quadcopter moves to given waypoints while the remaining follower quadcopters form a platoon behind it. Because the geometrical form of the possible waypoint paths is a circle or spiral with a given radius, a sufficiently wide square area with the basic dimensions of ten meters by ten meters with the start waypoint is provided inside V-REP; see Figure 6b. The floor panels incidentally are one meter squared, so the center of this environment is easily distinguishable with the platoon leader drone hovering above. In this scenario, no obstacles are considered. In the second flight mode implementing the pathfinding, the leading quadcopter is given a goal position it has to reach, behind some obstacles. The follower drones precede it through the scenario, while each has its forerunner drone as its goal position (cf. Section 3.4). To this end, three obstacles, as well as two goal point markers, for first and last quadcopter, are positioned inside V-REP and the same dimensions as before are used for the map size. In Figure 6c, the obstacles can be seen in the center, with dimensions of one meter by one meter and a height of three meters. A very small red cylinder is used as a goal position marker at the bottom of the figure. In addition, below the obstacles, a small red bubble robot is placed. This indicates the position of the last quadcopter in the platoon if the platoon reaches the goal position with four drones while a distance of m between their positions is kept. Otherwise, it is an approximate end position for the last platooning drone.
Since two flight modes need to be evaluated, the scenarios need to differentiate between these two. In fact, three, so called flight types, are used in ToSaMuFo’s evaluation, namely waypoints (circle), waypoints (spiral), and pathfinding. The first flight mode waypoint following corresponds to the two types waypoints (circle) and waypoints (spiral) in the scenarios, where spiral uses the same waypoints as in circle, but adding continuously height per step. Both types use fixed scenario parameters: 400 waypoints, a radius of 1.5 m and 0.01, respectively 0.00 m for their height step values. After the waypoint generation, the platoon leader drone flies to these locations, while the other quadcopters calculate follow positions behind the leader and try to keep the platooning distances. The last mode pathfinding has the platoon moving to a goal position in the presence of obstacles. The objective is to find a path around the obstructions and get to the target location as a platoon. These three modes are chosen to test the two flight modes individually, without the possibility of conflicts between the platooning and awareness parts of the Platooning Awareness (cf. Section 3.3) as well as to analyze their similarities and differences. In the case of the waypoint following mode, it is split into the two scenario flight modes circle and spiral to evaluate possible differences or similarities, as well as the flight performance in 2D and 3D following scenarios.
Besides the flight mode, the formation distance parameter represents the distance between the center of two drones in formation that ideally should be held constant between every two drones, to keep the overall platooning formation symmetrical. The three values that are chosen to be evaluated stem from the first test flights of the framework, in which m emerged as a relatively stable formation distance for all early tests, as it represents a one drone distance between two virtual drones with their dimensions of 0.35 m × 0.35 m. Additionally, and m are considered as values, to evaluate if these parameters are candidates to supersede the default m in any or all scenario types. Any higher values were not considered because it is assumed that this would elongate the platoon too much and a minimal stable distance is preferred. This characteristic is chosen to evaluate the changes in flight performance of ToSaMuFo with changing distances inside the formation and if one flight mode is more susceptible to distance variations.
The last scenario parameter, box size, only applies to the third flight mode of pathfinding. It describes a box size as a kind of map resolution (cf. Section 3.4). The referenced section also identifies the safety distance parameter as an important one to possibly change the pathfinding behavior, e.g., blocking passages, but, because of the interdependence of this characteristic and the box size, it is fixed to m and only the box size is allowed to vary in the evaluations. Furthermore, box size can be considered the more far-reaching parameter, as it is able to change the map resolution, which significantly influences the flight paths as the drones only move through box center and is assumed to have a bigger impact on computational performance because the whole scenario grid map is represented as a matrix which gets disproportionately bigger with slight increases in the box size. The three values that are used here concentrate around the sweet spot of m. This was found in early tests of the implementation, where larger values, in the range of approximately m, blocked the path between the obstacles. As mentioned in Section 3.4, it is not related to the size of a specific drone and is additionally varied slightly by 5 cm to evaluate its impact. A lower value, such as m, slowed the quadcopter movement noticeable down because the position changes are much smaller. The addition and subtraction of five centimeters aim to evaluate, if these two values, one above, one below, represent a new sweet spot and if they influence the pathfinding flight performance. Overall, this parameter is used as a scenario characteristic to evaluate the influences of the formation distance parameter compared to the box size and to analyze the formation distance inside the platoon through varying box sizes.
4.3. Metrics
To evaluate all scenarios, we rely on two distinctive metrics: position deviation and commanded and observed distances between platooning drones. Because ToSaMuFo uses two flight modes, where the modes aim to evaluate either the normal waypoint platooning or self-aware pathfinding components by flying in a platoon formation, we apply the same distance and positional deviation metrics for both. This additionally allows us to compare and evaluate both modes against each other, as well as concluding an estimation of the combined framework for reference and possible future works. For each scenario flight, we analyze and aggregate both metrics in terms of their minimum, maximum, mean, median, confidence interval of 95%, and standard deviation values.
Position Deviation
The position deviation specifies the deviation on the n-th axis at time t, meaning the difference between the commanded () and observed () flight path. Because the observations do not depend on calculations, but only on simulator getPosition() functions, they are sent out more frequently than commands from the other direction. This means initially that not every observation can be paired with a command to evaluate the position deviation. Therefore, we fill these data set gaps by forward-filling, meaning that a command or observation is repeated in the sets until a new one is calculated or received. This introduces low noise into the data but allows for the evaluation of the position deviation at each recorded time t and for every axis n. The resulting equation is presented in Formula (1):
Distance between Platooning Drones
The distance between platooning drones captures the Euclidean distance between the quadcopter positions and at time t in three-dimensional space, where j identifies one drone of the formation and ranges from 1 to . Formula (2) presents the resulting equation that relates the positions to the Euclidean distance. We categorize this distance into commanded distances and observed distances, taking either only commands or observations for all participating drones into account. Similar to position deviation before, gaps in the data sets are forward-filled to enable distance evaluation at every time t for every two drones in the platoon. Otherwise, no quadcopter positions are coinciding with other drone locations that are recorded at the same time:
4.4. Evaluation Methodology
The following sections present groups of scenarios that form an evaluation set, the related plots, as well as summarizing tables. All values are, if not mentioned otherwise, in meters. The plots use drone identification numbers, where the ID = 1 corresponds to the leader drone, 2 to the second drone in the platooning formation, and so forth. The tables, on the other hand, represent aggregated data sets for one metric each and are used as basis for the evaluation. For distance metrics, these tables also incorporate a percentage that shows how much a particular value is above or below the discussed formation distance parameter. Furthermore, superior values are typed in bold numbers.
4.5. Simulated Flights
This section contains all evaluations regarding the simulated flights that are conducted in V-REP and are ran on the VM, which itself is detailed in Section 4.1. In the following, the evaluations of different groups of scenarios are based on the three main types of scenarios, namely “Waypoints (circle)”, “Waypoints (spiral)”, and “Pathfinding”. Each section groups its scenarios by the formation distance parameter (FDP) that is changed between , , and m. In the case of m, the distance between two virtual quadcopters equals one quadcopter length and is chosen as basis, from which 10 and 20 cm are substracted to evaluate smaller distances. In the case of pathfinding, we present an additional box size evaluation in the corresponding sections. The evaluation metric results are better, if they are, in the case of distances between platooning drones, closer to the set formation distance, or, in the case of position deviations, closer to zero. Given that all scenarios are re-run 30 times because of their slightly different probabilistic dynamical behavior, we calculate the mean, median, standard deviation (SD), 95% confidence interval (CI), minimum (Min), and maximum (Max) over all runs of that scenario. This attenuates the effect of outlier values and spikes in the flight data of single flights that are recorded and enables statistically relevant statements for each scenario.
4.5.1. Circle Waypoint Path
This section evaluates the circle waypoint path flights (Scenarios 1 to 3), where the FDP is changed between , , and m, for a platooning formation of four drones. Starting with an overview over the scenarios commanded (Figure 7a) and observed (Figure 7b) flight paths for an FDP of 0.50 m. It can be seen that the path characteristics do not greatly differ between the initial commands and resulting observations.
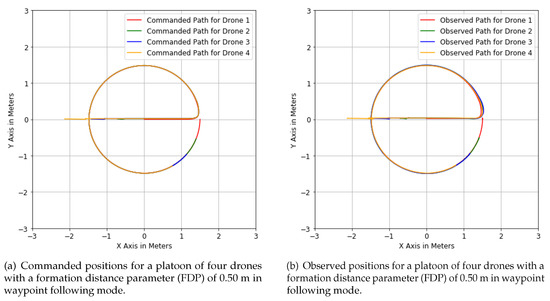
Figure 7.
Scenario 1—Circle waypoint following of four drones.
The drones start in a line, ranging from drone 4, path color yellow, at approximately to drone 1, path color red, located at . In Figure 7a, the formation follows the exact route throughout the scenario, whereas, in Figure 7b, the formation fans out during the left turn for approximately one-eighth of a revolution. Because Figure 7a shows the commanded path and Figure 7b the observed path, it is expected to see some differences in their actual flight paths and the formation fanning-out can be explained with a positional overshoot of the follower drones, where their forward pitch could not be changed fast enough into a to left-turn configuration, to fly exactly on the circle waypoint path.
In the following, Figure 8a,b show the commanded and observed distances between the drones in their platooning formation for the same scenario flight as in Figure 7a,b above.
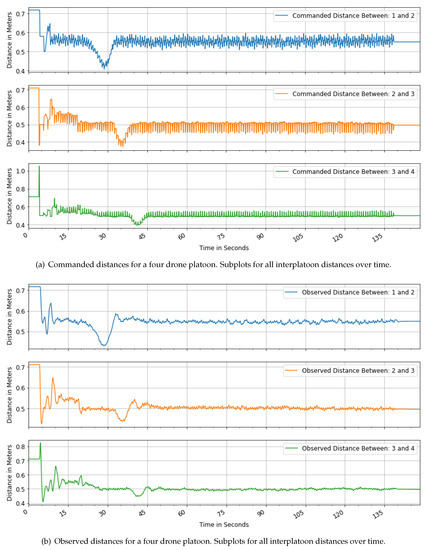
Figure 8.
Scenario 1—Commanded and observed distances between drone pairs for a formation distance paramerter (FDP) of m.
The visible general oscillations do not represent commanded oscillations; otherwise, this would be apparent in Figure 7a from before. These oscillations are the product of the evaluation methodology, as described in Section 4.4, as a byproduct of merging the data sets to evaluate the distances. These artificial oscillations assumed as noise are more prevalent in the commanded distances because these data sets have the most missing values, i.e., time gaps, between two commands. The greater starting distances symbolize the initial positions, which are further apart. In the following 20 s after the scenario starts, the assemble command is given and the platooning formation is formed. After that, the drones move on their waypoint path and dips occur when they are turning onto the circle. Their curved on-path-distance is commanded to stay the same, in this case, m, but the distances that are shown here represent calculated straight-line distances between the drones and therefore exhibit these dips. The distances between the first drone pair are slightly elevated, owing to the fact that the follower drones use the position history of the leader to determine their commanded positions and not the waypoints, which the leader uses as commands for itself. This small offset depends on the flight performance of the leader drone and therefore can not directly be detracted from the evaluation data set. The similarities and uniformity of these distances for the first drone pair, with respect to the other pairs, show the expected behavior.
The first scenario group evaluation concerns the position deviation, i.e., the deviation from the commanded path, and is based on Table 2, which shows values for all FDP settings.

Table 2.
Positional deviation metrics (in meters) for Scenarios 1–3.
The first three value rows (x, y, and z) represent the aggregated flights with FDP = , the next with FDP = , and the last with FDP = . It can be seen that the overall positional deviation does not change significantly with changing FDP values. In many cases, they are even the same. In the x-axis, the deviations show the biggest fluctuations in the minimum, maximum, and standard deviation value, but a nearly perfect median and mean value of zero. The z-axis, however, shows the smallest fluctuations, meaning here: best values for all but the mean and median. These data show that all three FDPs offer similar performance, given that their deviations are barely different from each other and the absolute values are very low in the range of centimeters and millimeters, meaning that they all can be used successfully for four drones in circle waypoint scenarios.
Following up is the commanded distance evaluation of each FDP, based on Table 3. The table shows the distances between drone pairs, calculated from their commanded positions. The presented values, although commanded, do not mirror the FDP exactly because each drone individually and independently commands only its own path and is exposed to small dynamic fluctuations. Additionally, the distance metric is based on Euclidean distances (cf. discussion on Figure 8a above) in contrast to the on-path-distance that is commanded.

Table 3.
Commanded distance metrics (in meters) for Scenarios 1–3.
Notable in this data set is the minimum value of m as well as a maximum value of m for an FDP of m, relating to drones 3 and 4. The most optimal values for the standard deviation, confidence interval, minimum, and maximum are located at the front of the platooning formations, namely in the distances between drones 1 and 2. Inside the formations, the middle drone pair offers the smallest deviations from the set FDP in the mean value, with the exception of a m FDP, where the distance between drones 3 and 4 is considered better. The best median values are universally found in the last or additionally second to last drone pair. Overall, an FDP of m seems to deliver the best results in nearly every value.
The low minimum value of m, as well as the maximum value of m for an FDP of m, are assumed to be erroneous values, which are located right at the start of the flight. These single-spike phenomena can be seen to a lesser extent in Figure 8a and should be disregarded as an assemble-artifact, as the observed distances in Figure 7b show no collisions, which would happen with only a distance of m.
Table 4 summarizes the observed distance metrics for Scenarios 1–3.

Table 4.
Observed distance metrics (in meters) for Scenarios 1–3.
For all standard deviations, confidence intervals, and minimum values, an FDP of m provides the values closest to zero, respectively smallest differences to this FDP in the flight data. The optimal mean values can be seen at an FDP of m for the second and last drone pair. The median, however, exhibits perfect values for drone pairs 3 and 4 (FDP 0.50 m), as well as 2 and 3 (FDP 0.60 m and nearly perfect for FDP 0.70 m). Furthermore, the smallest differences in the maximum values are also located at this FDP. Given that the relative differences between an FDP of and m are quite small, both can be used successfully for these scenarios and offer similar performance. The high value of m in the drone 3 and 4 pair maximum for an FDP of m stems from a small timing issue right at the scenario start in only one flight, where the last two drones start slightly time-delayed from each other, which produces a one value maximum spike.
4.5.2. Spiral Waypoint Path
The spiral waypoint paths herein are based on the same underlying waypoint characteristics as in the preceding section, enhanced with a height increase per waypoint step. Because of this similarity, which can also be seen in Figure 9a,b, displaying the observed paths of both types. Given that only one waypoint parameter, the height, is additionally changing, we compare this scenario to the circle waypoint scenario. Contrary to before, we do not directly evaluate positional deviation, given that the values of this metric are consistently low in their mean, standard deviation, and confidence interval, respectively very close to zero, throughout all scenarios and only min/max spikes from single flights raise above notable levels.
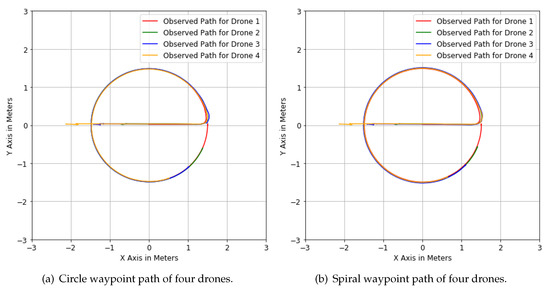
Figure 9.
Comparison between observed circle and spiral waypoint paths for a formation distance parameter (FDP) of m, both depicted from above, i.e., on the x–y coordinate level.
In the following, Table 5 displays all observed distance metrics, for flights relating to the Scenario numbers 5 and 6, which thereby are evaluated.

Table 5.
Observed distance metrics (in meters) for Scenarios 5 and 6.
Directly evident is the missing FDP value of m, e.g., Scenario 4, which is omitted from the table because its scenario flights are failing to finish their waypoint path. In this scenario, the third drone moves partially under the second, while turning and climbing, and is hit with a disturbed mass of air, so that the second quadcopters propellers push down (cf. prop wash (https://www.skybrary.aero/index.php/Prop_Wash)). The resulting push on the third throws it off far from its intended course. This scenario is repeated thirty times and always produces the same result, indicating that special attention needs to be put on spiral waypoint scenarios with small FDP values.
An FDP of m delivers superior values w.r.t. the smallest variation inside the platooning formation. The scenario runs with an FDP of m still enable successful flights and are only marginally different. In comparison to the observed circle waypoint path in Table 4, the spiral seems to provide better standard deviations, confidence intervals, maximum, minimum values, and only slightly worse mean or median values. This may indicate that ToSaMuFo’s flight performance is more smooth while incorporating height changes, given the lower value variations and spikes.
The observed distances over time plots in Figure 10a,b show further similarities between circle and spiral scenarios. The anomalous spike from before, while turning at around 30 to 45 s, can also be seen and only minor data glitches, i.e., one-value-spikes, show special differences between the two. This further indicates that two and three-dimensional platoon flights in ToSaMuFo offer nearly the same flight performance, as long as no drone is subjected to prop wash, which can be excluded with larger FDP values.
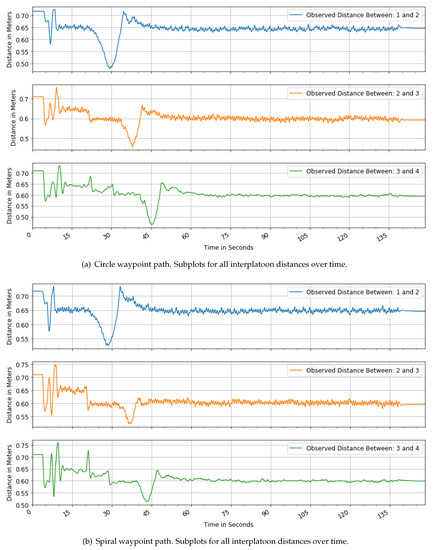
Figure 10.
Similarities between observed distances for spiral and circle waypoint paths for a formation distance parameter (FDP) of m.
In summary, the findings of this section show that the proposed framework is able to successfully perform on the circle and spiral waypoint paths, excluding only an FDP of m that exhibits prop wash with spiraling waypoints. The other two FDPs of and m can be used for either scenario and offer similar performance. The addition of the z-axis that is not used for circle waypoint following seemingly does not increase distance instability, as is shown by the observed distance metrics in the case of spiral waypoint following.
4.5.3. Pathfinding
In the following, ToSaMuFo’s pathfinding abilities are evaluated on the basis of nine scenarios with, again, 30 runs each. Given that the waypoint following scenarios use the same metrics and formation distance parameters as the pathfinding scenarios herein, we broadly compare them to each other. Additionally, three different box size parameters with , , and m are evaluated for every FDP. Therefore, all combinations between FDP and box size can be assessed. This allows for a comparison between the influences of the box size and formation distance parameter, on the observed distances for pathfinding scenarios. Lastly, a summary of all findings in this section is given.
To visualize a typical pathfinding scenario, Figure 11a,b show a 2D, respectively 3D overview plot for (a) all drones of the scenario and (b) one drone compared to its commanded path. In Figure 11a, the platoon starts at the lower left: the lead drone on position A, followers on B to D. They move towards their end positions throughout the pathfinding scenario, denoted A’ to D’. In Figure 11b, the flight also starts at the left, while the lower path represents the commanded and the upper the observed flight path (cf. drone 4 in Figure 11a).
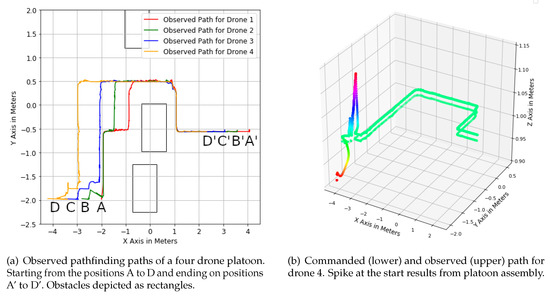
Figure 11.
Visualization of pathfinding paths of one scenario in 2D and 3D.
4.5.4. Scenarios 7–9: Formation Distance Parameter: 0.50–0.70 m, Box Size: 0.15 m
Scenarios 7–9 use a fixed value of m for box size, to evaluate the influence of the formation distance parameter on drone formations of four drones and is based on Table 6.

Table 6.
Observed distance metrics (in meters) for Scenarios 7–9.
In comparison to the two waypoint following scenario types, the pathfinding scenarios produce larger offsets (distance between drone pairs) from the set FDP and larger positional deviations in almost all metrics, which can be seen in comparison with Table 5, where the maximum mean was 8% above the FDP, whereas now the smallest mean value is 34.86% above the FDP, for example. This can be explained with the inherent difference between the two flight modes of ToSaMuFo, in which the leader for waypoint following has a fixed set of waypoints for every scenario to fly to, whereas the leader of a pathfinding platoon always has to find the path itself and can be influenced by the smallest effects, changing the outcome. One such effect could be the initial positions before the scenario start, which are changing slightly around their starting position, even in the simulation because the drones are already hovering. Therefore, they can be different, when the platooning formation assembly method is initiated. These slight variations in positions are countered in waypoint following by fixed waypoints that the lead drone and in return the followers follow in every flight. The seemingly high maximum values (greater than 170% above the set FDP) for all scenarios can be explained through the platoons stop-and-go flight profile, where each drone waits until its immediate goal drone moves a sufficient distance away before following, which happens in an asynchronous manner, opening these interim distance gaps until they are closed again at a later flight time. Depending on the values we focus on, all FDPs provide a category with the best values for the given box size, as for example, an FDP of m offers the best mean and median values overall. In Figure 12a–c, the same data are represented as three sets of box plots. It can be seen that all boxes are located above their set FDP, which shows that all platooning formations are more likely to exceed their FDP and not undercut it. This indicates low collision probabilities that also were not encountered in this setting.
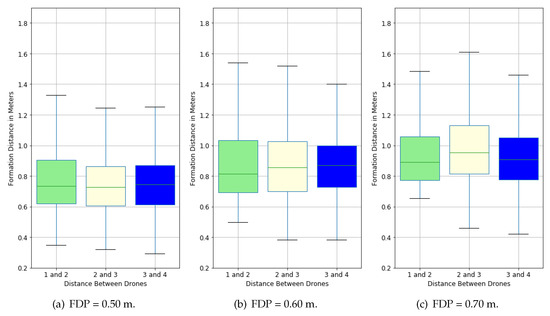
Figure 12.
Observed path boxplots for different formation distance parameters (FDP) with a box size of 0.15 m.
4.5.5. Scenarios 10–12: Formation Distance Parameter: 0.50–0.70 m, Box Size: 0.20 m
This section uses a fixed value of m for box size, to evaluate the influence of the formation distance parameter on drone formations four drones and is based on Table 7.

Table 7.
Observed distance metrics (in meters) for Scenarios 10–12.
In comparison to Table 6, a box size of m seems to indicate a trend, in which a larger FDP value correlates with less spread of nearly all metrics. Nevertheless, all FDPs enable successful pathfinding scenarios with no observed collisions. The lower (−47.6%) and greater (+238.6%) values in the last drone pair for an FDP of m can be traced back to two single flights in which right after the start in one case the drones asynchronous motion caused a greater distance gap (maximum value) and in the other case a smaller distance. In Figure 13a–c, the same data from Table 7 are represented as three sets of box plots. Again, as with a box size of m, all boxes are located well above their FDPs and indicate the low likelihood of collisions.
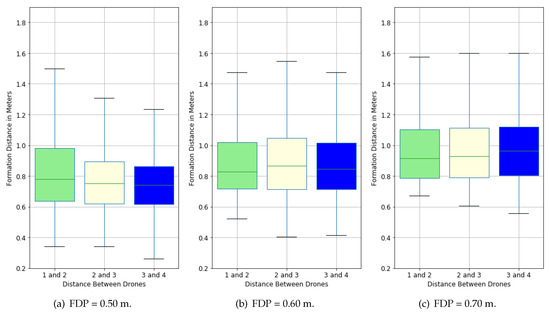
Figure 13.
Observed path boxplots for different formation distance parameters (FDP) with a box size of 0.20 m.
4.5.6. Scenarios 13–15: Formation Distance Parameter: 0.50–0.70 m, Box Size: 0.25 m
This section uses a fixed value of m for box size, to evaluate the influence of the formation distance parameter on drone formations four drones and is based on Table 8.

Table 8.
Observed distance metrics (in meters) for Scenarios 13–15.
The trend from Table 7, which indicates a correlation between the lower spread of the metrics and an increasing FDP, can still be observed for the mean and median values but is less pronounced in the minimum (a contrary trend for the last drone pair) and maximum values. In Figure 14a–c, these data are also represented as three sets of box plots. Following the general trend, all set FDPs are located below the boxes and show the small likelihood of collisions between the drones.
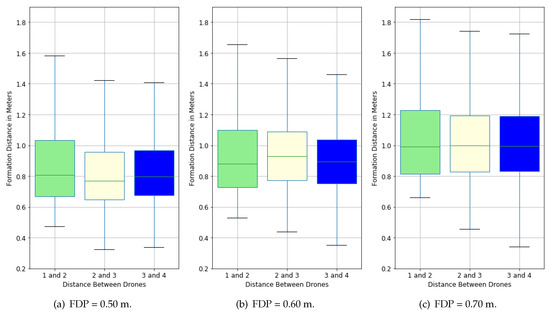
Figure 14.
Observed path boxplots for different formation distance parameters (FDP) with a box size of 0.25 m.
4.5.7. Summary
Collecting the findings of these three FDP scenarios with different box sizes and comparing them, another trend emerges. A smaller box size seems to result in overall better metrics, as can be seen in Table 6, Table 7 and Table 8, and their corresponding box plots. The results show that ToSaMuFo can perform pathfinding and successfully move a whole platoon of quadcopters around obstacles onto a goal position with differing performance metrics, influenced by two main parameters, namely box size and formation distance.
4.6. Real-World Flights
To prove the applicability of ToSaMuFo for real drones, we did a study to analyze that the proposed framework (i) can be used on real hardware with only adapting communication topics and (ii) performs considerably better with real quadcopter controllers. Its modularity allows ToSaMuFo to be agnostic of the drone control scheme. However, the tests only show that ToSaMuFo runs on real drones (A video of a test flight can be found at: https://youtu.be/qqovms3nY5A). In [39], we describe the two flights in more detail. Further tests with more drones, pathfinding in the presence of obstacles, and more detailed evaluations are required.
5. Conclusions
In this work, we propose ToSaMuFo, a framework that combines self-awareness with platooning for small UAVs, i.e., quadcopters or drones. We decided to build on the LRA-M loop a new self-awareness loop named Platooning Awareness. With this loop, the framework is able to control a quadcopter formation through scenarios, while learning about the environment, avoiding obstacles, and moving to the destination. The formation employs a hierarchic leader–follower structure, in which any drone can act as a platooning leader or follower drone. In this paper, we investigated platoons with up to four drones. The implementation of the framework is based on ROS that provides a publish/subscribe communication approach and offers modularity through its node system. This modularity abstracts the platooning awareness from the hardware and enables ToSaMuFo to function within simulations and real quadcopters. We compare two flight modes: the platoon (i) follows given waypoints and (ii) finds a path through an environment in the presence of obstacles. With those modes, we evaluate either the platooning or awareness part of the Platooning Awareness in 15 scenarios with different parameters using the V-REP simulator. In the first setting, employing circle waypoints, we show that ToSaMuFo enables the leader drone to lead a platoon around a circle path. The second setting, employing spiral waypoints leading to a three-dimensional path, delivers consistent results. In the third setting, employing the pathfinding algorithms, the leader quadcopter can guide a platoon around obstacles, which also learns about its environment.
Furthermore, a few limiting assumptions were made. Firstly, only four quadcopters are used for the evaluation to keep in line with vehicle platooning literature and our proof-of-concept approach. In [39], we discuss platoons of two and three quadcopters. Secondly, only three different parameter values are used for FDP and box size herein. Lastly, real quadcopters are only used in two test flights. To prove the reproducibility of the results with real quadcopters, further evaluations are required.
For the future, further evaluations and additional features could be envisioned. First, the evaluation indicates that the 3D flights offer more stable flight performance; however, this is not sufficiently evaluated yet. Second, single nodes of the framework could be expanded in the future on a per-node basis. Multiple experts could collaborate and improve on different nodes at the same time. Third, the obstacle avoidance could be extended to allow drones to additionally fly over them. Finally, the platoon assembly could be extended to enable dynamically changing formations.
Author Contributions
Conceptualization, D.K., V.L., and C.K.; methodology, D.K., V.L., and C.K.; software, D.K. and F.S.; investigation, D.K., J.R., and M.S.; data curation, D.K.; writing—original draft preparation, D.K., V.L., and C.K.; writing—review and editing, D.K., V.L., C.K., F.S., J.R., M.S., S.M., and S.K.; supervision, S.K. and S.M.; project administration, V.L. and C.K. All authors have read and agreed to the published version of the manuscript.
Funding
This research received no external funding.
Conflicts of Interest
The authors declare no conflict of interest.
Abbreviations
The following abbreviations are used in this manuscript:
| UAV | Unmanned Aerial Vehicle |
| SeAC | Self-Aware Computing |
| MPC | Model Predictive Control |
| PID | Proportional-Integral-Derivative |
| ROS | Robot Operating System |
| PSO | Particle Swarm Optimization |
| LQR | Linear-Quadratic Regulator |
| SMC | Sliding-Mode Control |
| DNN | Deep Neural Network |
| LRA-M | Learn-Reason-Action Loop |
| V-REP | Virtual Robot Experimentation Platform |
| API | Application Programming Interface |
| VM | Virtual Machine |
| FDP | Formation Distance Parameter |
| SD | Standard Deviation |
| CI | Confidence Interval |
References
- Bergenhem, C.; Petterson, H.; Coelingh, E.; Englund, C.; Shladover, S.; Tsugawa, S. Overview of Platooning Systems. In Proceedings of the 19th ITS World Congress, Vienna, Austria, 22–26 October 2012; pp. 1393–1407. [Google Scholar]
- Krupitzer, C.; Segata, M.; Breitbach, M.; El-Tawab, S.S.; Tomforde, S.; Becker, C. Towards Infrastructure-Aided Self-Organized Hybrid Platooning. In Proceedings of the Global Conference on Internet of Things, Alexandria, Egypt, 5–7 December 2018. [Google Scholar]
- Kounev, S.; Kephart, J.O.; Milenkoski, A.; Zhu, X. Self-Aware Computing Systems, 1st ed.; Springer: Berlin/Heidelberg, Germany, 2017. [Google Scholar]
- Krupitzer, C.; Roth, F.M.; VanSyckel, S.; Becker, C. A Survey on Engineering Approaches for Self-Adaptive Systems. Pervasive Mob. Comput. J. 2015, 17, 184–206. [Google Scholar] [CrossRef]
- Reynolds, C.W. Flocks, Herds and Schools: A Distributed Behavioral Model. In Proceedings of the 14th Annual Conference on Computer Graphics and Interactive Techniques, Anaheim, CA, USA, 27–31 July 1987; ACM: New York, NY, USA, 1987; pp. 25–34. [Google Scholar] [CrossRef]
- Virágh, C.; Vásárhelyi, G.; Tarcai, N.; Szörényi, T.; Somorjai, G.; Nepusz, T.; Vicsek, T. Flocking Algorithm for Autonomous Flying Robots. Bioinspir. Biomim. 2014, 9, 025012. [Google Scholar] [CrossRef] [PubMed]
- Vásárhelyi, G.; Virágh, C.; Somorjai, G.; Tarcai, N.; Szörényi, T.; Nepusz, T.; Vicsek, T. Outdoor Flocking and Formation Flight with Autonomous Aerial Robots. In Proceedings of the 2014 IEEE/RSJ International Conference on Intelligent Robots and Systems, Chicago, IL, USA, 14–18 September 2014; pp. 3866–3873. [Google Scholar]
- Vásárhelyi, G.; Virágh, C.; Somorjai, G.; Nepusz, T.; Eiben, A.E.; Vicsek, T. Optimized Flocking of Autonomous Drones in Confined Environments. Sci. Robot. 2018, 3, eaat3536. [Google Scholar] [CrossRef]
- Virágh, C.; Nagy, M.; Gershenson, C.; Vásárhelyi, G. Self-Organized UAV Traffic in Realistic Environments. In Proceedings of the International Conference on Intelligent Robots and Systems, Daejeon, Korea, 9–14 October 2016; pp. 1645–1652. [Google Scholar]
- Balázs, B.; Vásárhelyi, G. Coordinated Dense Aerial Traffic with Self-Driving Drones. In Proceedings of the 2018 IEEE International Conference on Robotics and Automation, Brisbane, Australia, 21–25 May 2018; pp. 6365–6372. [Google Scholar]
- Turgut, A.E.; Çelikkanat, H.; Gökçe, F.; Şahin, E. Self-Organized Flocking in Mobile Robot Swarms. Swarm Intell. 2008, 2, 97–120. [Google Scholar] [CrossRef]
- Ferrante, E.; Turgut, A.E.; Huepe, C.; Stranieri, A.; Pinciroli, C.; Dorigo, M. Self-Organized Flocking with a Mobile Robot Swarm: A Novel Motion Control Method. Adapt. Behav. 2012, 20, 460–477. [Google Scholar] [CrossRef]
- Badgwell, T.A.; Qin, S.J. Model-Predictive Control in Practice. In Encyclopedia of Systems and Control; Springer: London, UK, 2015; pp. 756–760. [Google Scholar]
- Kubalčík, M.; Bobal, V. Predictive Control of Higher Order Systems Approximated by Lower Order Time-Delay Models. WSEAS Trans. Syst. 2012, 11, 607–616. [Google Scholar]
- Frank, S.A. Model Predictive Control. In Control Theory Tutorial: Basic Concepts Illustrated by Software Examples; Springer International Publishing: Cham, Switzerland, 2018; pp. 91–94. [Google Scholar] [CrossRef]
- Bemporad, A.; Pascucci, C.A.; Rocchi, C. Hierarchical and Hybrid Model Predictive Control of Quadcopter Air Vehicles. IFAC Proc. Vol. 2009, 42, 14–19. [Google Scholar] [CrossRef]
- Zhao, W.; Go, T.H. Leader Follower Quadrotor Formation Flight Control. In Proceedings of the CEAS Specialist Conference on Guidance, Navigation and Control, Munich, Germany, 13–15 April 2011. [Google Scholar]
- Mao, S.; Tan, W.K.; Low, K.H. Autonomous Formation Flight of Indoor UAVs Based on Model Predictive Control. In AIAA Infotech@Aerospace; American Institute of Aeronautics and Astronautics: Reston, VA, USA, 2016; p. 515. [Google Scholar]
- Dubois, L.; Suzuki, S. Formation Control of Multiple Quadcopters Using Model Predictive Control. Adv. Robot. 2018, 32, 1037–1046. [Google Scholar] [CrossRef]
- Bemporad, A.; Rocchi, C. Decentralized Hybrid Model Predictive Control of a Formation of Unmanned Aerial Vehicles. IFAC Proc. Vol. 2011, 44, 11900–11906. [Google Scholar] [CrossRef]
- Dubay, S.; Pan, Y.J. Distributed MPC Based Collision Avoidance Approach for Consensus of Multiple Quadcopters. In Proceedings of the International Conference on Control and Automation, Anchorage, AK, USA, 12–15 June 2018; pp. 155–160. [Google Scholar]
- Bemporad, A.; Rocchi, C. Decentralized Linear Time-Varying Model Predictive Control of a Formation of Unmanned Aerial Vehicles. In Proceedings of the 2011 50th IEEE Conference on Decision and Control and European Control Conference, Orlando, FL, USA, 12–15 December 2011; pp. 7488–7493. [Google Scholar]
- Zhao, W.; Go, T.H. Quadcopter Formation Flight Control Combining MPC and Robust Feedback Linearization. J. Frankl. Inst. 2014, 351, 1335–1355. [Google Scholar]
- Chang, C.W.; Shiau, J.K. Quadrotor Formation Strategies Based on Distributed Consensus and Model Predictive Controls. Appl. Sci. 2018, 8, 2246. [Google Scholar] [CrossRef]
- Kamel, M.; Stastny, T.; Alexis, K.; Siegwart, R. Model Predictive Control for Trajectory Tracking of Unmanned Aerial Vehicles Using Robot Operating System. In Robot Operating System (ROS); Springer: Berlin/Heidelberg, Germany, 2017; pp. 3–39. [Google Scholar]
- Henson, M.A.; Seborg, D.E. Feedback Linearizing Control. In Nonlinear Process Control; Prentice-Hall: Upper Saddle River, NJ, USA, 1997; Volume 4, pp. 149–231. [Google Scholar]
- Mahmood, A.; Kim, Y. Leader-Following Formation and Heading Control of Networked Quadcopters. In Proceedings of the International Conference on Control, Automation and Systems, Seoul, Korea, 22–25 October 2014; pp. 919–921. [Google Scholar]
- Mahmood, A.; Kim, Y. Decentralized Formation Control of Quadcopters Using Feedback Linearization. In Proceedings of the International Conference on Automation, Robotics and Applications, Queenstown, New Zealand, 17–19 February 2015; pp. 537–541. [Google Scholar]
- Mahmood, A.; Kim, Y. Leader-Following Formation Control of Quadcopters with Heading Synchronization. Aerosp. Sci. Technol. 2015, 47, 68–74. [Google Scholar] [CrossRef]
- Brownlee, J. Clever Algorithms: Nature-Inspired Programming Recipes; Lulu Press: Morrisville, NC, USA, 2011. [Google Scholar]
- Ma’sum, M.A.; Jati, G.; Arrofi, M.K.; Wibowo, A.; Mursanto, P.; Jatmiko, W. Autonomous Quadcopter Swarm Robots for Object Localization and Tracking. In Proceedings of the MHS2013, Nagoya, Japan, 10–13 November 2013; pp. 1–6. [Google Scholar]
- Lazim, I.M.; Husain, A.R.; Subha, N.A.M.; Mohamed, Z.; Basri, M.A.M. Optimal Formation Control of Multiple Quadrotors Based on Particle Swarm Optimization. In Modeling, Design and Simulation of Systems; Springer: Singapore, 2017; pp. 121–135. [Google Scholar]
- Rinaldi, F.; Chiesa, S.; Quagliotti, F. Linear Quadratic Ccontrol for Quadrotors UAVs Dynamics and Formation Flight. J. Intell. Robot. Syst. 2013, 70, 203–220. [Google Scholar] [CrossRef]
- Edwards, C.; Spurgeon, S. Sliding Mode Control: Theory and Applications; CRC Press: Boca Raton, FL, USA, 1998. [Google Scholar]
- Mercado, D.A.; Castro, R.; Lozano, R. Quadrotors Flight Formation Control Using a Leader-Follower Approach. In Proceedings of the European Control Conference, Zurich, Switzerland, 17–19 July 2013; pp. 3858–3863. [Google Scholar]
- Wu, F.; Chen, J.; Liang, Y. Leader-Follower Formation Control for Quadrotors. IOP Conf. Ser. Mater. Sci. Eng. 2017, 187, 012016. [Google Scholar] [CrossRef]
- Palossi, D.; Loquercio, A.; Conti, F.; Flamand, E.; Scaramuzza, D.; Benini, L. Ultra Low Power Deep-Learning-Powered Autonomous Nano Drones. arXiv 2018, arXiv:1805.01831. [Google Scholar]
- Kosak, O.; Wanninger, C.; Hoffmann, A.; Ponsar, H.; Reif, W. Multipotent Systems: Combining Planning, Self-Organization, and Reconfiguration in Modular Robot Ensembles. Sensors 2019, 19, 17. [Google Scholar] [CrossRef] [PubMed]
- Kaiser, D. Towards Self-Aware Multirotor Formations. Master’s Thesis, University of Würzburg, Würzburg, Germany, 2019. [Google Scholar]
- Gageik, N.; Strohmeier, M.; Montenegro, S. Waypoint flight parameter comparison of an autonomous UAV. Int. J. Artif. Intell. Appl. 2013, 4. [Google Scholar] [CrossRef]
© 2020 by the authors. Licensee MDPI, Basel, Switzerland. This article is an open access article distributed under the terms and conditions of the Creative Commons Attribution (CC BY) license (http://creativecommons.org/licenses/by/4.0/).