1. Introduction
Epilepsy is a brain disorder that affects the whole nervous system and is characterized by high-frequency and high-voltage brain waves called seizures. An epileptic seizure is defined as a transient symptom of excessive or synchronous neuronal activity in the brain [
1]. Epileptic seizures have bad effects on the patient, ranging from attention lapses to muscle jerks. According to a World Health Organization [
2] report, there are around 50 million epilepsy patients worldwide. Early diagnosis of epilepsy helps identify suitable precautions.
Epilepsy is assessed similarly to many other brain disorders by electroencephalogram (EEG) [
3,
4]. EEG is a noninvasive, low-cost, well-established, and reliable technique that is used for diagnosing brain-related disorders such as epilepsy, tumors, and depression. EEG captures potential differences in the brain using electrodes that pick up signals and send them to the main EEG machine, which saves the generated signals.
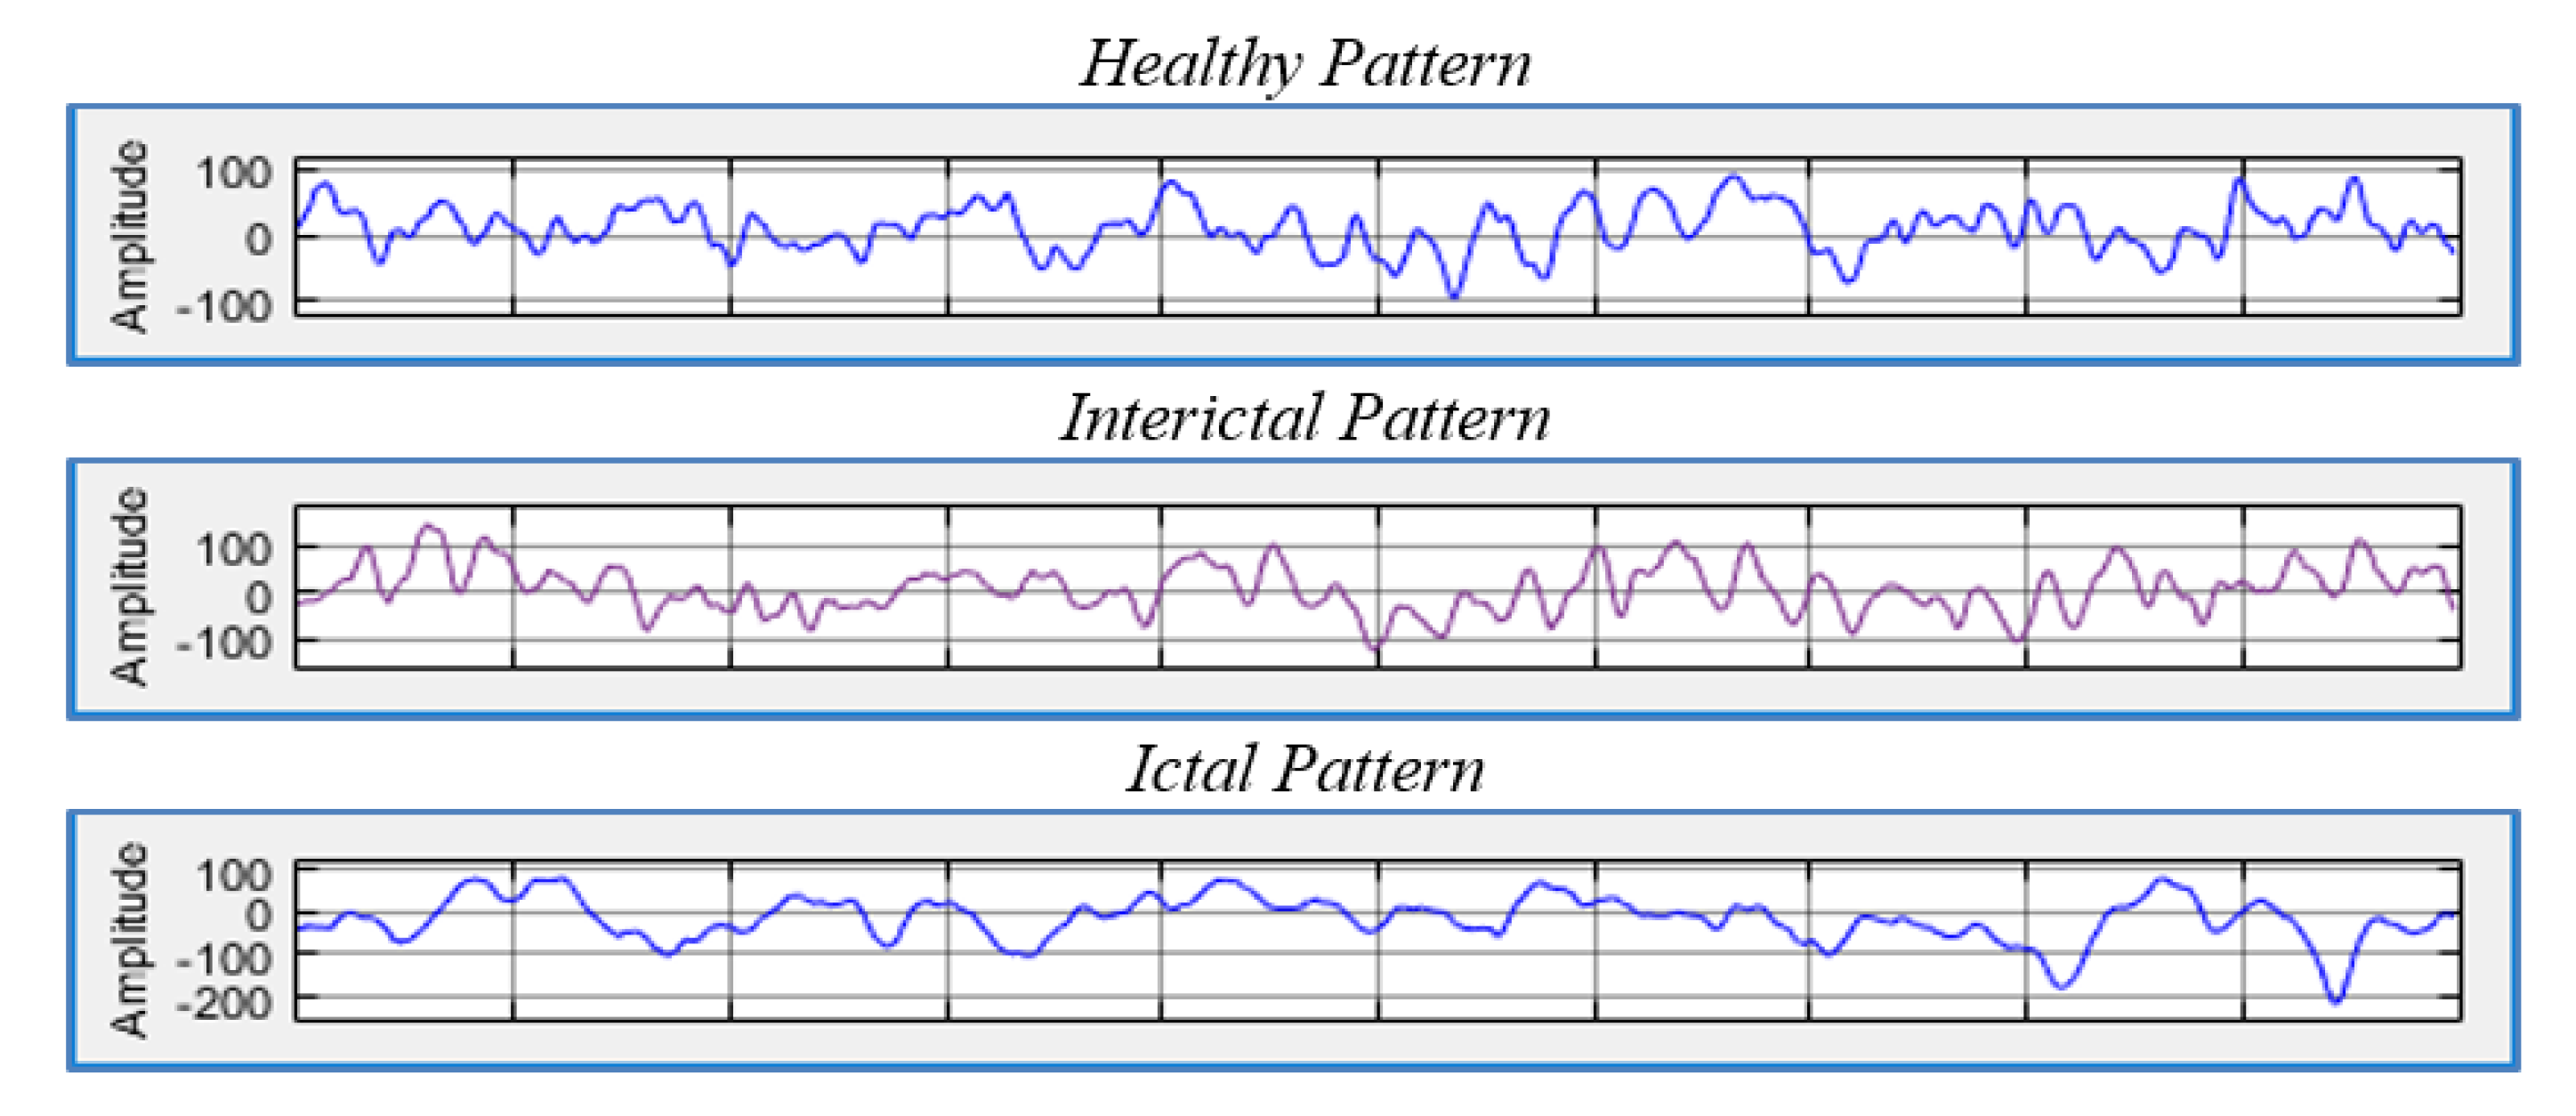
For epilepsy patients, there are two phases that vary in diagnosis and in the signals that are captured by the EEG, namely the ictal and interictal phases. The ictal phase represents the seizure and is characterized by abnormal signals, while the interictal phase is the intermediate phase between seizures that contains different forms of signals. These phases have different characteristics compared to the signals of healthy subjects. Thus, EEG data can be used to detect and classify epilepsy disorders [
3].
Figure 1 illustrates the three different states.
The detection of seizure based on EEG signals can save millions of lives, but the analysis of such nonlinear and nonstationary signals is anything but trivial. EEG signals have different patterns depending on the person and their state (e.g., awake, sleep, and alert). Thus, EEG signal analysis requires consideration of the expected patterns in these signals. To detect seizures, ictal signals need to be identified and differentiated from interictal and healthy subject signals. As the first step in EEG analysis, features are extracted from underlying recorded signals. Features can be any compact representation of the given signal. However, features that are able to characterize epileptic and nonepileptic states should have high discriminative and interassociation abilities. Discriminative ability refers to the ability to give different representation to various classes (e.g., healthy, ictal, and interictal), and different values that do not overlap. Interassociation refers to the ability to give a similar representation for each class with similar or identical values [
5]. The feature extraction time is also critical, given that the signal to be processed is huge, and applications of epilepsy detection, especially for seizure detections, occur in real time. Thus, the complexity of the feature extraction process should be as low as possible.
In this paper, an efficient, accurate, and nonparametric epilepsy detection and classification approach based on EEG signals is proposed. Epilepsy detection and classification is based on two components: extracted features and the used classification algorithm. The use of machine learning and its algorithms is quite promising, where different approaches have not yet been investigated. Furthermore, the accuracy of EEG signal classification and detection of seizure stages mainly depends on the used features. In this paper, selected statistical tests were used as the basis for extracting highly discriminating and time-efficient features, which were then used in epilepsy detection and classification.
2. Related Work
Epilepsy seizure detection, identification, and classification are implemented on the basis of feature extraction methods being applied to EEG signals. Various methods with various features were proposed in the literature, and these can be classified into three categories: nonlinear, Fourier-based, and wavelet-based detection methods.
2.1. Nonlinear Feature-Based Epilepsy Seizure Detection
Kannathal et al. [
6] used spectral (Shannon), Renyi, Kalmogorov–Sinai, and approximate entropies with an adaptive neurofuzzy classifier (AFC) to only differentiate between two classes, namely the epilepsy ictal state and normal EEG signals. Approximate, spectral, and Kalmogorov–Sinai entropies gave higher values for the normal signals compared with the values obtained from epilepsy patients. For Renyi entropy, it was noted that the values of epilepsy patients and normal subjects were identical. Accordingly, the discriminating abilities of these features were ranked from good to bad. According to the experiments conducted using part of the Bonn University dataset, which includes 200 sample signals for the normal class and 100 sample signals for the ictal class, the results of these features were
accurate.
Acharya et al. [
5] used a correlation dimension, a fractal dimension, the Hurst exponent, the largest Lyapunov exponent, and approximate entropy with Support Vector Machine (SVM) and Gaussian Mixture Model (GMM) classifiers. Similarly, Acharya et al. [
7], Yang et al. [
8], S. Vijith et al. [
9], Thilagaraj et al. [
10], and Li et al. [
11] used similar or other features and classifiers and had similar or slightly more accurate results. Overall, the use of nonlinear features for epilepsy detection and classification resulted in an output with an accuracy of up to
using features that required time with a complexity of
or higher, where
n is the length of the acquired signal. This complexity prevents epilepsy detection being implemented in real time.
2.2. Fourier-Based Epilepsy Seizure Detection
Discrete Fourier Transformation (DFT) is used to capture the frequency changes in the time domain and construct the so-called frequency space. The problem with DFT is its inability to capture the sensitivity of nonstationary EEG signals. This is because DFT transfers the signal by summing up the frequency components of infinite duration. Thus, DFT cannot be used to capture the events in the time series, and it is not able to distinguish among different EEG patterns. Accordingly, with EEG-based epilepsy detection, a new extension of Fourier called short-time Fourier transformation (STFT) is used in order to overcome the limitations of Fourier transforms in dealing with sensitive EEG signals [
12].
Nijsen et al. [
12] implemented STFT and extracted STFT coefficients, coefficient range, and normalized coefficients. The sensitivity of these features was statistically analyzed on the basis of real data obtained from seven patients, each with two data samples of at least one seizure state and a duration of five minutes. Experiments showed that the sensitivity of these features ranged from 0.66 to 1. Krishnakumar and Thanushkodi [
13] implemented STFT as a preprocessing step with Independent Component Analysis (ICA). Then, three linear and nonlinear features, standard deviation, correlation dimension, and Lyapunov exponents, were extracted and used with an Artificial Neural Network (ANN) classifier, which had an accuracy of
.
Kovcs et al. [
14] and Samiee et al. [
15] used similar features with an ANN classifier and the Bonn dataset and achieved an accuracy of 98.1%. Szuflitowska and Orlowski [
16] implemented a similar approach and obtained an accuracy of 85%.
Overall, the use of STFT for epilepsy detection and classification either uses measurements of coefficients, such as the maximum, minimum, and average, or STFT, which is used as a preprocessing step followed by nonlinear feature extraction. Similar to other work on epilepsy detection, the results of the reviewed literature showed that STFT gives accurate results with a minimum complexity of .
2.3. Wavelet-Based Epilepsy Seizure Detection
Übeyli et al. [
17] extracted the maximum, minimum, mean, and standard deviation of wavelet output functions after applying fourth-order wavelets. The implemented classification task differentiated between five data classes: the epilepsy ictal state and normal with open and closed eyes and the interictal state from opposite hippocampal locations. The results of the conducted experiments using part of the Bonn University dataset had an accuracy of 98%. Sadati et al. [
18] used the output functions of implementing five levels of wavelet filters with adaptive neurofuzzy and SVM classifiers to only differentiate between two classes, namely the epilepsy ictal state and normal EEG signals. The results of the conducted experiments using the Bonn University dataset, which included 100 sample signals for the normal and ictal states, had an accuracy of 85.9% for the fuzzy classifier and 83.1% for the SVM.
Similarly, Jahankhani et al. [
19], Subasi [
20], Subasi [
21], Costa et al. [
22], Guo et al. [
23], and Orhan et al. [
24] used wavelets for epilepsy detection and classification. Similar to STFT, the wavelet-based approaches either used the coefficients themselves or related measurements such as the maximum, minimum, and average. The results of the reviewed literature showed that the wavelets had accurate results with a minimum complexity of
.
Another study by Khan et al. [
25] proposed a method for the automatic detection of seizure onset, in which detection is based on two statistical features of the signals, skewness and kurtosis, with a wavelet-based feature normalized with a coefficient variation that is extracted from the data. The approach was shown to detect all seizures in the experiment with an average latency period of 3.2 s.
The previously discussed literature shows that there are common and unique issues regarding seizure detection approaches that can be summarized in four points. First, a variety of classifiers were used in the literature. Most of the experiments conducted for epilepsy detection have generally used different classification algorithms. Second, various features were included in the classification process. Third, the dataset provided by Bonn University has commonly been used in experiments because it is the only publicly available dataset for epilepsy. Fourth, the feature extraction step is time-consuming.
Although the accuracy of some approaches reported in the literature was above 98%, not all the implemented approaches based on the the Bonn University dataset as a whole were conducted to differentiate between the three classes of data, namely the ictal, interictal, and normal states. Moreover, the complexity of the state-of-the-art methods is high for real-time processing. Accordingly, there is a need to enhance the accuracy of epilepsy detection and classification and reduce the complexity of the used approaches.
3. Proposed Work
The proposed approach uses a statistical test that refers back to the data distribution of EEG signals. In general, data can be distributed in different ways, such as spread left, spread right, jumbled up, or centralized. Centralized distribution naturally occurs in many situations, including diagnosis signals using EEG. Centralized distribution with a bell shape is called normal distribution. In normal distribution, the probability density is higher in the middle compared to the tails on the right and left of the center. The bell shape of a normal distribution is fixed, but it stretches and shifts on the basis of mean and standard data deviation. Having a normal distribution is important because the Central Limit Theorem (CLT) states that independent random variable sums tend to follow a normal distribution in most cases.
Furthermore, EEG signals for epilepsy diagnosis can be assumed to follow a normal distribution to some extent, given the CLT. However, due to various effects on the data, such as noise, the biological characteristics of the scanned subject, and surrounding effects, it is impossible to have the same distribution even for the same subject in the same state. Nevertheless, as data tend to have specific characteristics in each state, they are assumed to follow specific patterns in terms of diverging from or approaching a normal distribution. This assumption is the motivation of the proposed work. The EEG signals have specific characteristics in each state, and assumed to follow a specific pattern in this paper.
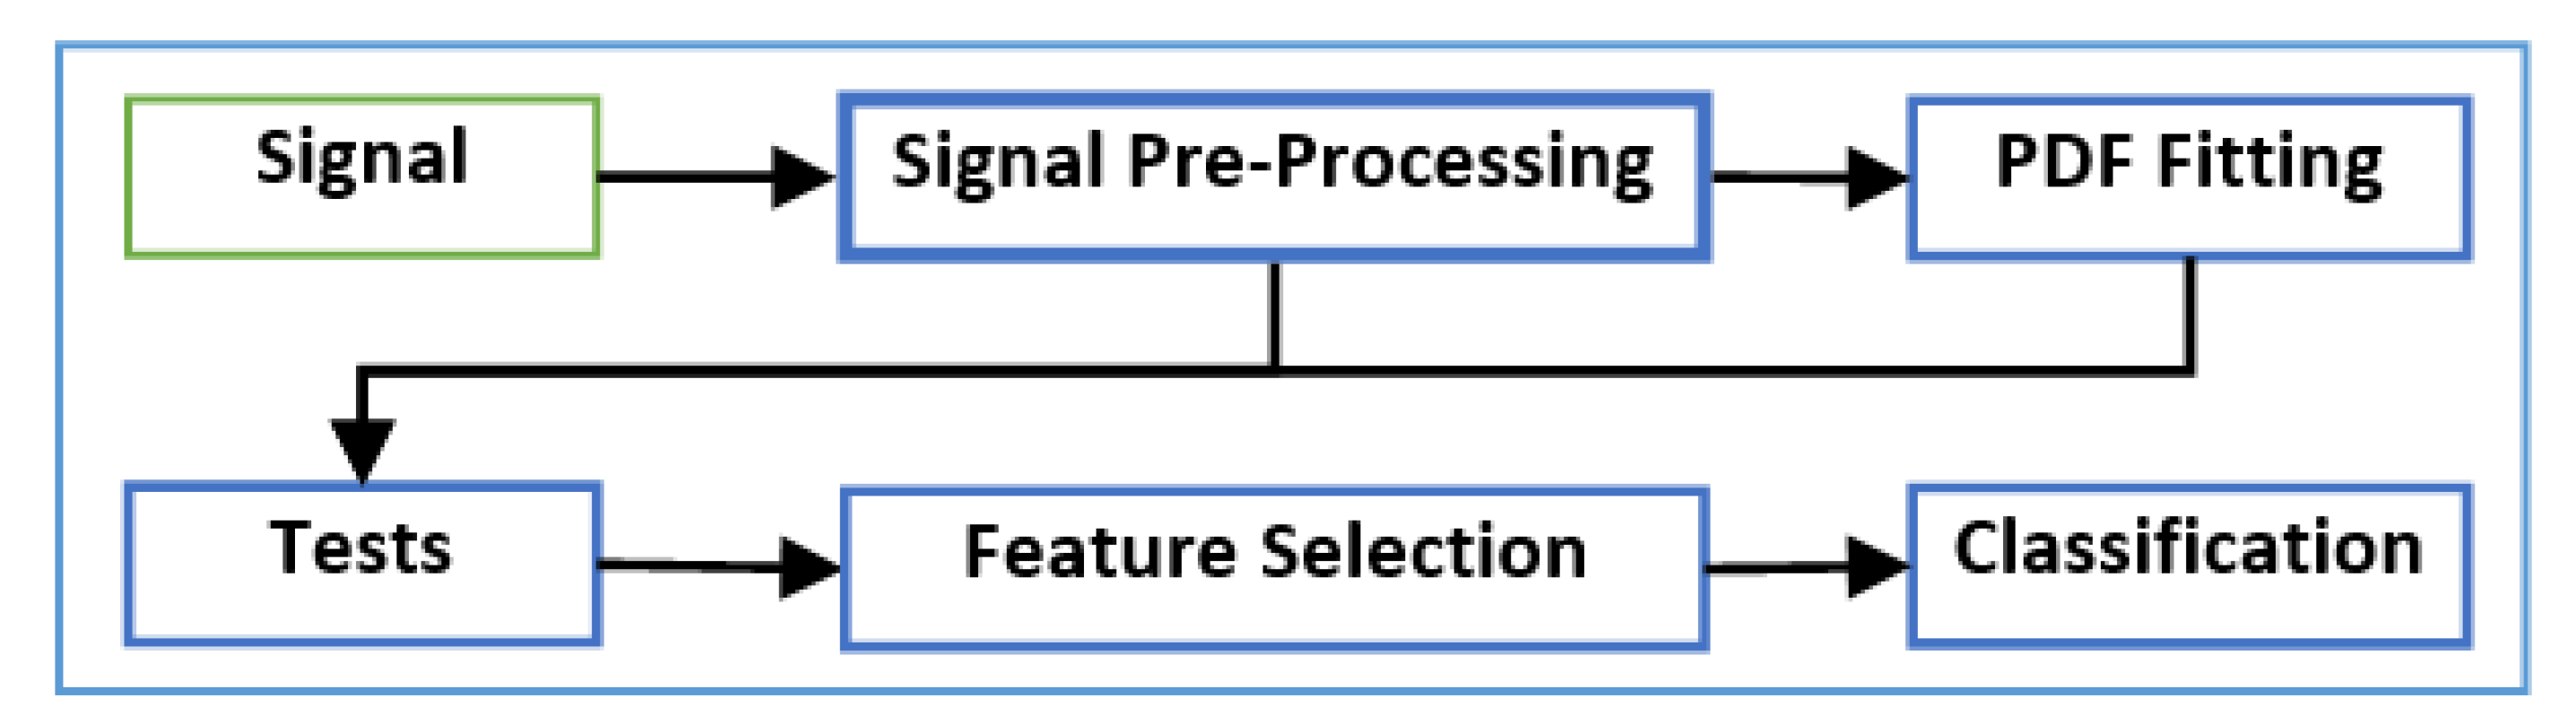
Figure 2 presents a block diagram of the framework proposed in this paper, which can be summarized by the following steps:
Step 1: Signal preprocessing:
The signal is initially preprocessed to remove the effects of any artifacts and noise in the data.
Step 2: Probability Density Function (PDF) fitting:
A PDF fitting method is performed.
Step 3: Hypothesis tests:
The resulting PDF function with the preprocessed data is used as the input to a set of statistical hypothesis tests.
Step 4: Machine-learning methods:
The output of the hypothesis tests forms a structured dataset that is employed in machine-learning algorithms, including feature selection and classification methods.
Furthermore, the implemented work is constructed on the basis of the three following main techniques:
The PDF fitting method, which is responsible for forming an associated normal distribution, is applied;
The divergence between the input data and associated distribution is calculated using statistical (hypothesis) tests; and
The machine-learning algorithm is employed for classification and detection purposes.
In the following subsections, the steps shown in
Figure 2 are discussed in detail.
3.1. Step 1: Signal Preprocessing
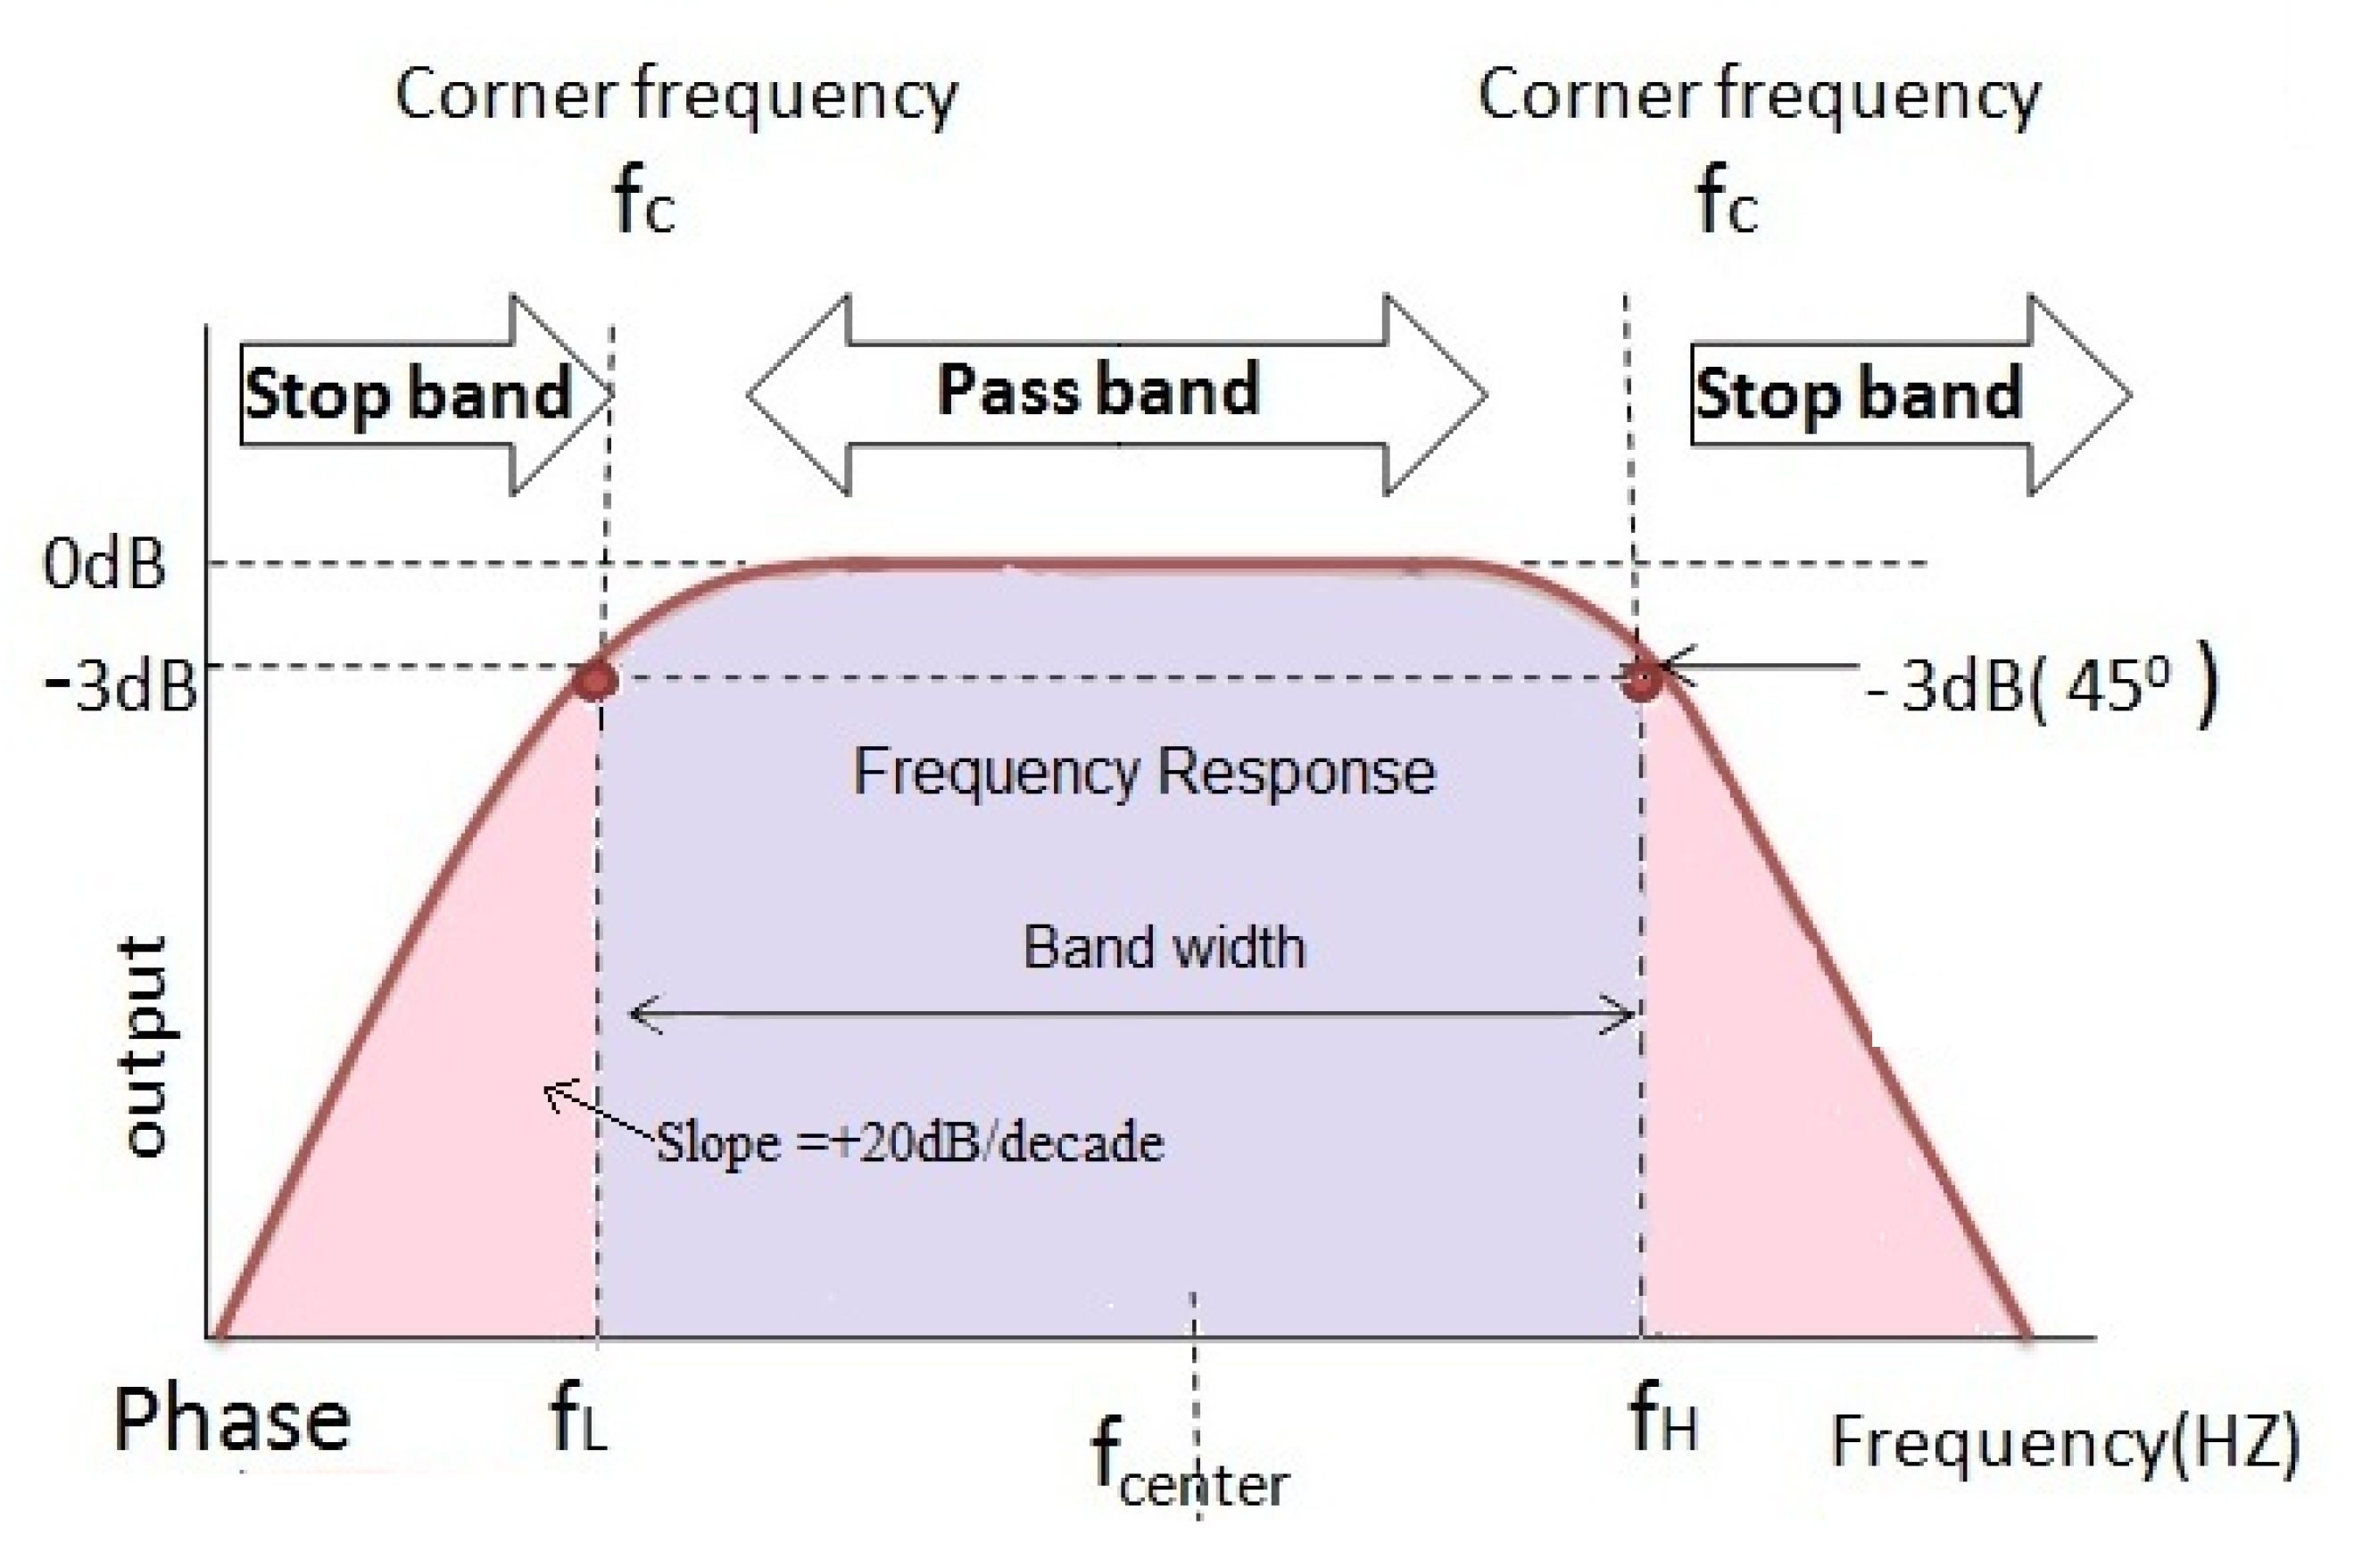
EEG signals are affected by various types of interference and artifacts that modify the original signals generated in the brain. The band-pass filter, which was proven to eliminate noise in EEG signals, is used to remove artifacts and noise in the input signal. The band-pass filter allows signals within a frequency range to pass as is while blocking anything outside that range Rioul and Vetterli [
26], as illustrated in
Figure 3. As the signals are filtered, they are then represented as time-series vectors
, recorded at various time instances from 1 to
n. Finally, the data are represented in a histogram (values and frequencies).
3.2. Step 2: PDF Fitting
The PDF is estimated for each sample datum by calculating the probability of each bin in the histogram and then calculating the statistics that summarize the density. The density estimation process is responsible for constructing the unobserved PDF from the observed data. The first step in density estimation is to determine the type of modeled variable, i.e., continuous vs. discrete, and to select a distribution type that can represent the variable and fit the data characteristics. Because the preprocessed input signals are discrete, they can be represented using binomial and uniform discrete distributions if the data are symmetric (those distributed normally on the side or the central value), while geometric, negative bidirectional, and hygrometric distributions are used if the data are asymmetric. A normal distribution was selected to model the EEG signal. This is because a normal distribution often occurs with any type of data. According to the CLT, for any independent random variable, the normalized sum of the values is distributed according to a normal distribution. This is a key concept in probability theory because it implies that a normal distribution can be applied to any problem including variables generated using other distributions.
In addition to the CLT, there are further reasons that support the selection of a normal distribution in this work.
A normal distribution is characterized by two parameters, the mean and standard deviation . Therefore, the fitting process for such distribution is relatively uncomplicated and does not consume a significant amount of processing time.
A normal distribution is used with data that tend to take a central value. In EEG signals, it is assumed that signal values are centralized at a specific wave type. In other words, a normal distribution is used with data that tend to have equal positive and negative values from the central value, which is the case in EEG signals. Although this assumption might be weak, it is supported by two facts. First, the distribution itself is used to model the data and not the features. Second, the normality assumption is evaluated at each piece of sample data in the next step. Other distributions require harsh assumptions to be made, which cannot be risked in the proposed approach.
The second step of PDF fitting is to generate the distribution function curve using the input data. The normal function is generated by using the value histogram and their frequencies based on the calculation of the mean and standard deviation . After this process, the data are represented by two vectors, the preprocessed data vector , and the normal distribution mode . Finally, in order to check the normality of the data, a Chi-square variance test is used individually with each of the items of sample data to check the normality of the data with .
3.3. Step 3: Hypothesis Tests
After the PDF is estimated for each observed data sample, a set of hypothesis tests are implemented. The purpose of each implemented test depends on the type of the test itself; this includes the quality of fitting between the data and the PDF, the data randomness, and the data correlation. Hypothesis tests are a mechanism for making decisions about the independent random variable that generates the data, which can be a process, a natural measure, etc. Any hypothesis test is implemented to statistically determine whether there is enough evidence to reject the null hypothesis or not. Accordingly, the output of any statistical test is the hypothesis variable h, which is either accepted or rejected. Commonly, an accepted h is indicated by 0 and a rejected h is indicated by 1.
The probability value (p-value) is a measurement of the test accuracy and it is used to determine whether or not to reject the null hypothesis . The larger the p-value is, the more random the results are, which indicates the inability to reject . The p-value is usually mapped from the output of the test with the aid of a table that matches between the output of the test calculation and the p-value. Then, in order to determine whether the p-value is considered large or small, a confidence level or critical value is used to determine the threshold between large and small probabilities. Hence, if the produced p-value is less than , can be rejected with confidence ; on the other hand, if the p-value is equal to or greater than , cannot be rejected.
Accordingly, various tests with a predetermined null hypothesis and alternative hypothesis are used, and they can be categorized into three groups: distribution tests, location tests, and dispersion tests. Of the three groups, selected tests that fit with the processed data and the purpose of the proposed approach are implemented. Some statistical tests, such as the
t-test, are not useful, because they are used to test whether the population mean is equal to a specified value; in our case, the mean is calculated from the data themselves, so it is always true. For each test, the focus of the proposed work is neither to accept nor to reject the null hypothesis but rather to use the tests. Output scalars are features in the proposed epilepsy detection and classification. Overall, five different hypotheses/statistical tests are implemented in the proposed approach, each of which measures different characteristics of the input data.
h and
p-values, which are extracted from each test, and other scalars are calculated and used as features in the proposed approach. The set of parameters that are extracted and used for epilepsy detection and classification are listed in
Table 1.
3.4. Step 4: Machine-Learning Methods
3.4.1. Dimensionality Reduction and Feature Selection
Feature selection is the process of reducing the number of features in the input set. In this context, two concepts are defined: feature selection and dimensionality reduction. In feature selection, the output set of features is a subset of the original set; in dimensionality reduction, the output can be a new synthetic feature set. Thus, feature selection is a special case of dimensionality reduction. In the proposed approach, feature selection and dimensionality reduction are implemented using two approaches: manual and automatic selection.
3.4.2. Classification
In the classification step, a model is constructed in the training phase using the training samples after the feature selection process. The model is then used during the testing phase to evaluate the performance of the epilepsy detection and classification approach. Various classification algorithms are implemented in the proposed approach, as listed in
Table 2.
4. Experiment Tests
4.1. Dataset
A dataset for epilepsy cases that is publicly available online with a description about the acquisition conditions was constructed by Bonn University. Each sample in the Bonn University dataset represents an EEG signal that was recorded for a duration of 23.6 s by 128 channel amplifier systems with a sampling rate of 173.61 Hz and a 12 bit resolution. Each sample was acquired for a subject in a specific state. Accordingly, the data consist of five different categories, A, B, C, D, and E, each containing 100 samples. Sets A and B are for five healthy subjects in a relaxed and awake state with open eyes for Set A and closed eyes for Set B. Sets C, D, and E were obtained from five epilepsy patients in different states. Set C was obtained from epilepsy patients in seizure-free intervals recorded from the hippocampal formation of the nonepileptogenic hemisphere of the brain. Set D was recorded for the same state, but for the epileptogenic hemisphere of the brain. Set E was obtained from epilepsy patients in a seizure state. In total, 500 samples were used in the experiments. For conducting the experiments, Sets A and B were combined to form 200 samples for healthy subjects. Similarly, Sets C and D were combined to form 200 samples of interictal states of epilepsy patients, and Set E has 100 samples of ictal states of epilepsy patients [
27].
4.2. Normality Test
Before data are used for evaluation, they are first checked for normality. The normality of the input samples is checked using a Chi-square test with
. As shown in
Table 3 (Feature No. 1), all samples in the dataset were shown to have a value of zero, which indicates that normality was present for the input data.
4.3. Feature Selection
In the first step of feature selection, features with low or no variation, as determined by the standard deviation, were removed from the dataset. Accordingly, ten features were removed, as shown in
Table 3 (i.e., highlighted features were removed), and only 15 features, representing four tests, were left after the first feature selection step. Thus, the Chi-square variance test was only used for normalization and was not included in the epilepsy classification. In the second step of feature selection, dimensions were reduced using Principal Component Analysis (PCA). PCA generated five new features out of 15 features that were left after the first feature selection step. Statistics on these features are given in
Table 4.
For the experiment, MATLAB R2015a [
28] was used. For the hardware part, a 64–bit Windows 10 laptop with Intel Core i7 Processor (2.60 GH), with DDR4 RAM is used.
5. Results, Discussion, and Comparisons
In the result evaluation step, the classification process was implemented for two tasks: detection and classification. In each of these tasks, the training and testing processes were implemented n-folds, where n was set to 10. At the n-th fold, the data were equally divided by n fold and experiments were conducted for n rounds. In each round, fold were used for training and 1-fold were used for testing. Accordingly, each fold was used in the testing of a round so all available data were used. The results are reported as the results of all time points.
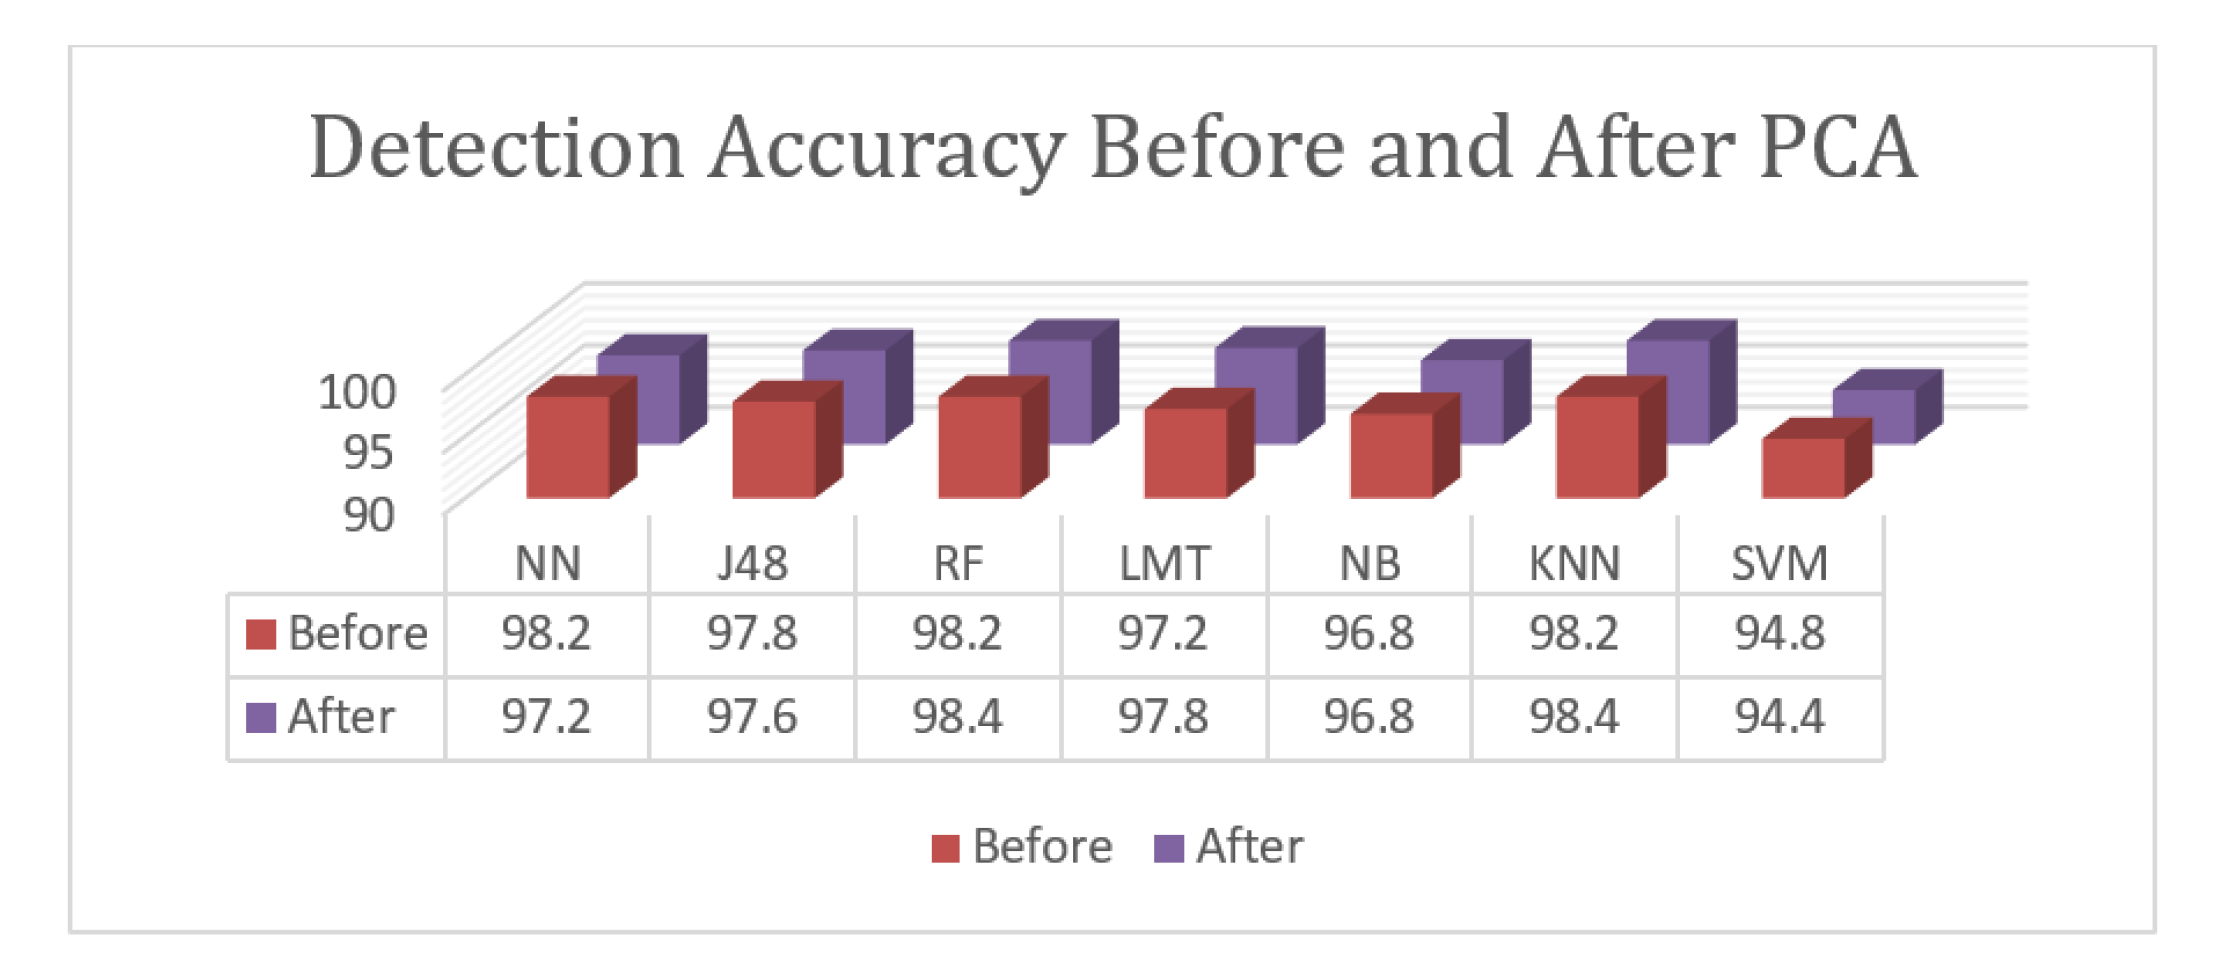
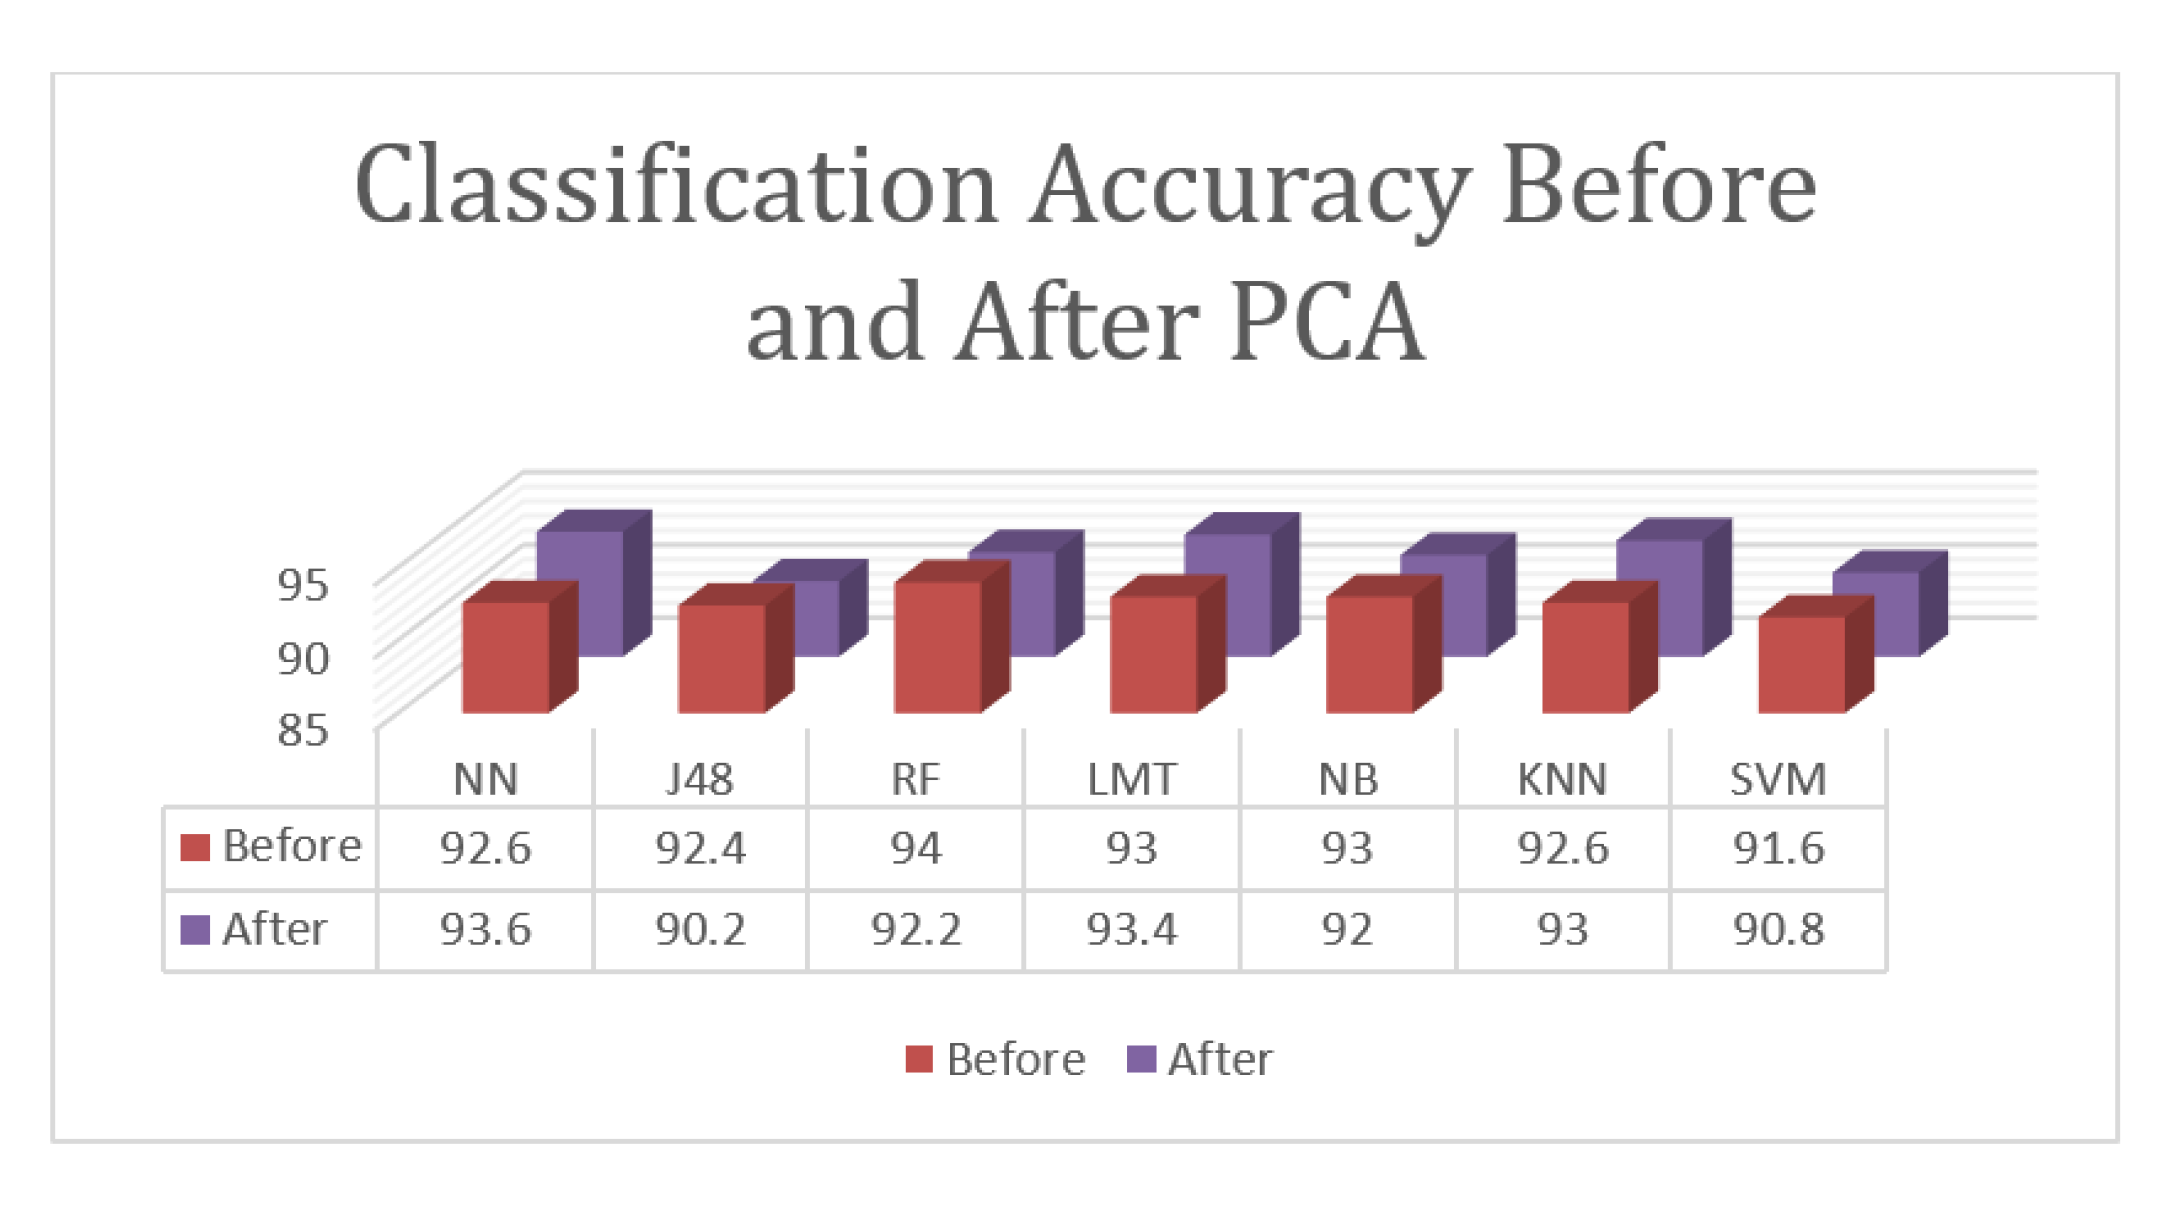
Only two classes are presented for the detection task. A comparison between the used classification algorithms prior to and after PCA is given in
Figure 4. As noted, the implementation of PCA enhanced the results of the best performed algorithms—Random Forest and K-Nearest Neighborhood—in terms of their performance, while the results of the Neural Network significantly decreased. PCA also slightly decreased the results of J48 and SVM and enhanced the results of the Logistic Model Tree. Finally, the results of the Naïve Bayesian algorithm remained as they were before and after PCA. According to the given results, the proposed approach with PCA dimension reduction achieved an accuracy rate of 98.4%. The Random Forest and K-Nearest Neighborhood algorithms achieved the highest accuracy levels. The Logistic Model Tree, J48 Tree, and Neural Network achieved results that were close to the best results with 97.8%, 97.6%, and 97.2%, respectively. The Naïve Bayesian algorithm achieved an accuracy of 96.8%, and SVM achieved an accuracy of 94.4%. Overall, the proposed approach achieved results with an accuracy of 98.4%. In the classification task, three sample classes are presented, and the relative measures shown are an indication of class prediction against the rest of the classes. Another comparison between the algorithms used prior to and after PCA for the classification task is given in
Figure 5.
According to the given results, the proposed approach for the classification tasks of the three involved states with PCA achieved an accuracy rate of 93.6%, which was reported using the Neural Network. The Logistic Model Tree and K-Nearest Neighborhood algorithms achieved results that were close to the top results with 93.4% and 93.0%, respectively. Random Forest achieved an accuracy of 92.2%, Naïve Bayesian achieved an accuracy of 92.0%, SVM achieved an accuracy of 90.8%, and J48 achieved and accuracy of 90.2%. While PCA enhanced the results of some algorithms, it failed to enhance the high accuracy and decreased the best results from 94.0% to 93.6%. PCA enhanced the results of the Neural Network, Logistic Model Tree, and K-Nearest Neighborhood algorithms but decreased the results of the other algorithms.
Overall, the proposed approach achieved an accuracy of 94.0% for the classification task, which is lower than the accuracy of the detection because this task is more complicated than detection as it involves three classes instead of two.
As noted, the proposed approach achieved high results with an accuracy of 94.0% and 98.4% for classification and detection. This indicates that the proposed approach has the ability to be reliably used in the classification of epileptic seizures. The Random Forest algorithm is the best to be used with PCA in the detection and without PCA in the classification. The SVM algorithm gave the worst results overall.
Comparison
This section provides a comparison between the proposed approach and state-of-the-art methods defined in the literature. The comparison was done on the basis of both the classification and detection tasks. The accuracy and time complexity of the proposed method are not discussed in detail.
Table 5 summarizes the results of the proposed and the compared approaches for the detection task. As noted, the proposed approach overperformed when compared with the state-of-the-art methods for epilepsy detection on the Bonn dataset. The rest of the literature could not be compared because the results were computed based on real-data or using only the undetermined part of the Bonn dataset.
Table 6 summarizes the results of the proposed and compared approaches for the classification task. As noted, the proposed approach was fifth out of six; while it ranked low, it still outperformed one of the recent approaches for epilepsy classification.
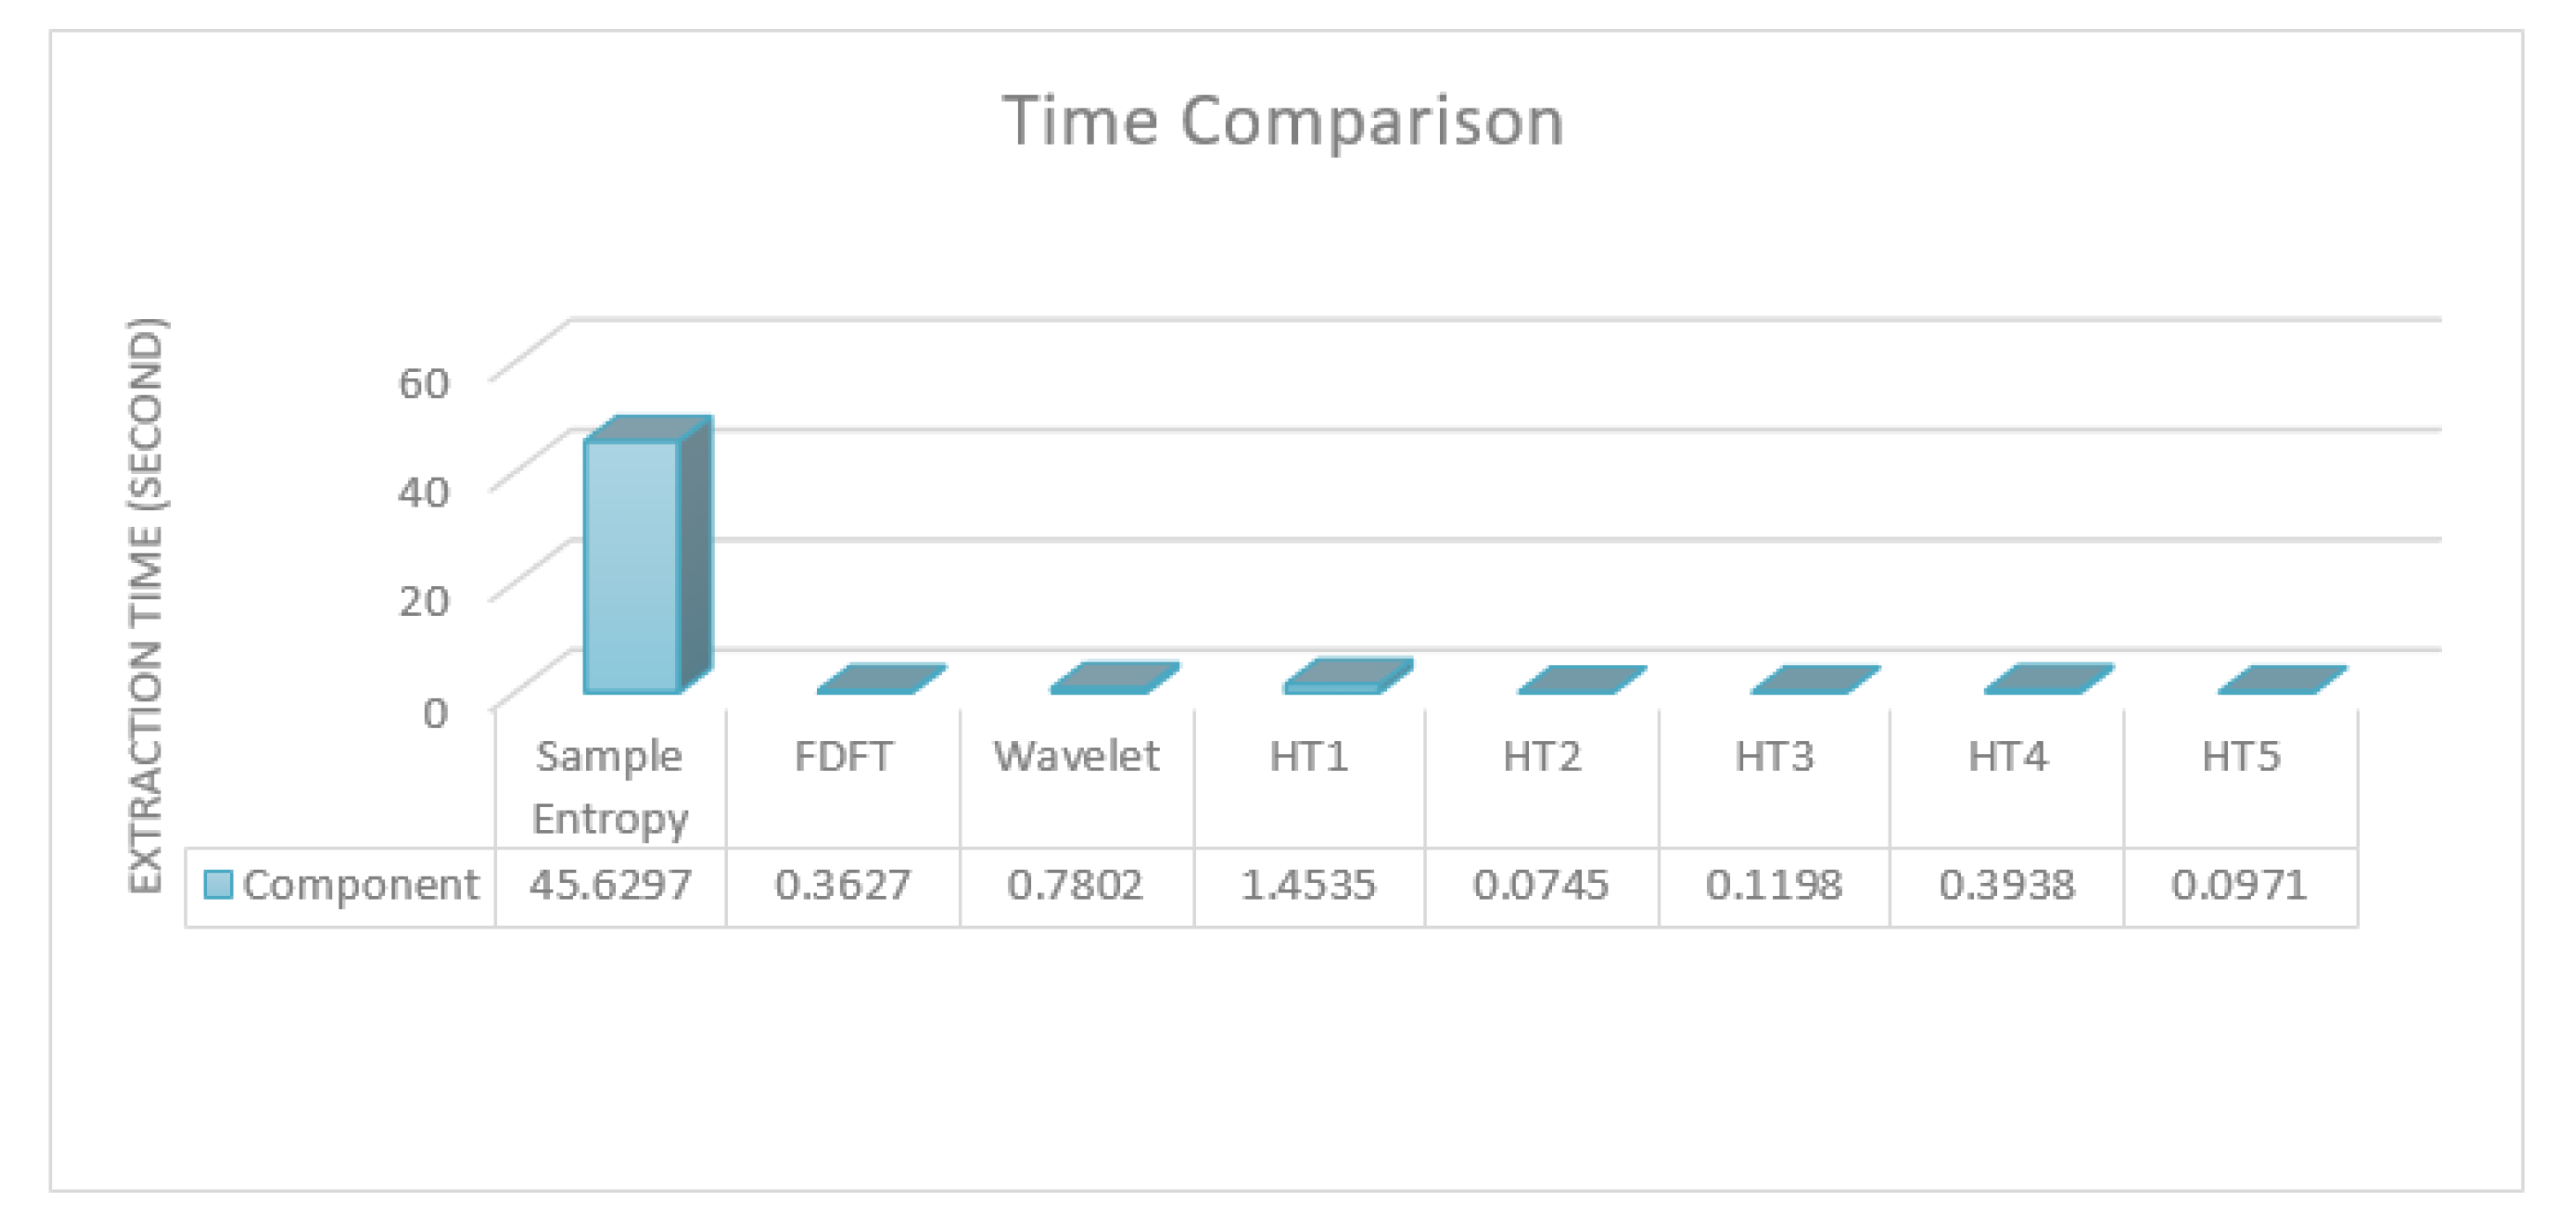
The idea was to compare the performance of the proposed approach against the state-of-the-art ones defined in the literature from different perspectives. One of the samples in the Bonn dataset was used as input to various processing and feature extraction techniques, which are reported in the literature. The time taken to extract entropies, which are the commonly used features, and carry out STFT, wavelet, and each of the hypothesis tests is reported.
Figure 6 illustrates the time taken for the compared and proposed feature extraction.
As noted, all of the used tests, with the exception of the Chi-square variance, which was eliminated in the first feature selection process, consumed less time than the others. Indeed, the four tests that were used in the proposed approach consumed less time compared to wavelet transformation alone, which should usually be followed by the feature extraction step. Sample entropy, which is accurate for epilepsy detection and classification, took over 100 times longer than the worst of the four used tests in the proposed approach. Please note that most of the compared approaches use more than one feature as well as using transformations with features, which significantly increases their time requirement. Thus, in terms of implementing a real-time analysis with reliable results, the proposed approach could be one of the best choices due to its low time consumption and high accuracy. Overall, the proposed approach had very accurate results in the detection task and outperformed the state-of-the-art methods in a similar task on the same dataset. The results also showed that the proposed approach had accurate results in the classification task; however, it did not outperform the state-of-the-art methods even though it consumed less time.
6. Conclusions
In this paper, a new approach that enables the efficient, accurate, and nonparametric detection and classification of epileptic seizures based on EEG signals was proposed. The proposed approach has two components: feature extraction and the use of a classification algorithm. Regarding the features, hypothesis test results were used as input features. Accordingly, PDF was estimated from a particular observed data sample. Then, hypothesis tests of various types were implemented. The purpose of the implemented test depends on the type of the test; this includes quality data fitting with their PDF as well as data randomness and correlation. The proposed approach achieved high results with accuracy levels of 94.0% and 98.4% for classification and detection, respectively. This indicates that the proposed approach could reliably be used in the classification of epileptic seizure cases. All of the used tests, with the exception of the Chi-square variance, which was eliminated in the first feature-selection process, consumed less time than other approaches in the literature.


