1. Introduction
Since the appearance of the Joint Photographic Experts Group (JPEG) standard in the 1990s, image compression has been well-developed [
1,
2,
3,
4,
5,
6]. Lossless image compression algorithms include JPEG [
7] and JPEG2000 [
8]. Some recent algorithms such as X264 (software implementation of H.264/AVC standard) [
9] and X265 (software implementation of H.265/HEVC standard) [
10] also provide lossless compression options. JPEG, X264, and X265 are discrete cosine transform (DCT) based algorithms and JPEG2000 is wavelet based. About 15 years ago, there were some developments in DCT based algorithms, where overlapped blocks known as lapped transforms (LT) were used to further improve the compression [
11]. In the past few years, a group of researchers at Xiph have incorporated LT [
11] into an open source codec known as Daala [
12]. Through several years of rigorous development, Daala has reached a stage where it outperforms X264 and has comparable performance to X265 in terms of a performance metric that mimics human visual system (HVS) [
12,
13].
In this research, our sponsor had specified three requirements on the image codec for maritime and sonar images: (1) 10 to 1 compression ratio; (2) the decompressed image should have 40 dBs or more in HVSm, which may be considered as “near perceptually lossless” performance; and (3) the lost pixels need to be effectively concealed without incurring additional bandwidth. It should be noted that “perceptually lossless” has been defined in digital picture coding since mid-1990s [
14]. One conventional way to handle transmission errors is to adopt error correction coding, which will add redundant bits and reduce the data transmission efficiency. We explored error concealment techniques, which do not incur additional bandwidth usage. It is important to emphasize that perceptual performance requires a suitable metric. Some conventional metrics such as peak signal-to-noise ratio (PSNR) and structural similarity (SSIM) may not match well with human’s subjective evaluations. Two metrics in the literature that have better correlation with human perception in the literature were also compared in our studies.
In the literature, there are excellent papers discussing perceptually lossless coding [
15,
16,
17,
18]. The authors of [
15] provided a survey of various ideas of embedding human perceptual model into the encoding process of various codecs such as JPEG2000, H264, and H265. The concepts of just noticeable difference (JND) and just not noticeable difference (JNND) [
15,
16,
17,
18] were introduced and embedded into some of the codecs. The output bit stream is compliant with the standards. Daala also incorporated perceptual vector quantization (PVQ) into its codec [
12,
13], which resulted in enhanced performance. We would like to emphasize that our paper is not about new developments in the perceptually lossless coding. In our studies, we used the codecs using the default settings and did not change any of the parameters. The only parameters we varied is the quality (or quantization) parameter (qp). The decompressed images were then evaluated using the four metrics, two of which are related to HVS. Similar to some existing papers (e.g., [
15]), our sponsor specified 40 dBs or more in terms of HVSm, which may be considered as “near perceptually lossless”.
It should be noted that this paper is an extension of our conference paper [
19]. There are several key differences. First, we corrected an issue related to the compression ratio computation in our earlier study [
19]. Since the input image formats for different codecs are different, we converted all the raw images to different image formats in our earlier study. For instance, X264 and X265 require the format to be Y4M and JPEG2000 and Daala use other formats. However, one issue is that the converted file sizes are slightly different for different formats. In our earlier study [
19], each codec was using its own set for computing the compression ratios, causing some slight differences in terms of compression ratios. In this study, we consistently used the original image sizes as references instead of the converted ones. Second, when we generated the results presented in [
19], X264 and X265 could only handle YUV420 format. In this study, we used the latest versions of X264 and X265, which can handle YUV444 format. Moreover, Daala has a newer version, which is improved over its previous version. Now, we re-generated all the performance metrics for all the datasets in this study. Third, we added two new sections to this paper containing new maritime and sonar images, and one new section containing images from the Xiph website. This is to demonstrate that the compression algorithms need to be robust to images with different resolutions and modalities. Fourth, we also present new error concealment results for the maritime and sonar images in this paper. Again, our goal was to demonstrate that the error concealment algorithms can handle different image modalities.
Although the compression algorithms are well-known, there was still some customization work in this project. For example, the use of YUV444 format instead of the default YUV420 ensured high quality compression for X264 and X265 for still images. Moreover, the error concealment needed to be tailored to the data that we used. One key contribution of our project was to integrate three components (compression, error concealment, and near perceptually lossless evaluation after decompression) in the compression process into a single system to achieve 10 to 1 near perceptually lossless compression for maritime and sonar images. That is, the novelty of our paper is not in new perceptually lossless compression theory, but rather in the integration of existing compression and error concealment technologies to achieve near or even perceptually lossless image compression at 10 to 1 compression for bandwidth constrained and interference-prone applications.
Our paper is organized as follows.
Section 2 summarizes the technical approach, the various codecs, and the performance metrics.
Section 3 summarizes all the experiments using actual maritime and sonar images that are of interest to our customer. Visual comparisons of different codecs at 10 to 1 compression are also included. Finally, concluding remarks are given in
Section 4.
2. Technical Approach
2.1. Proposed Image Compression and Error Recovery Approach
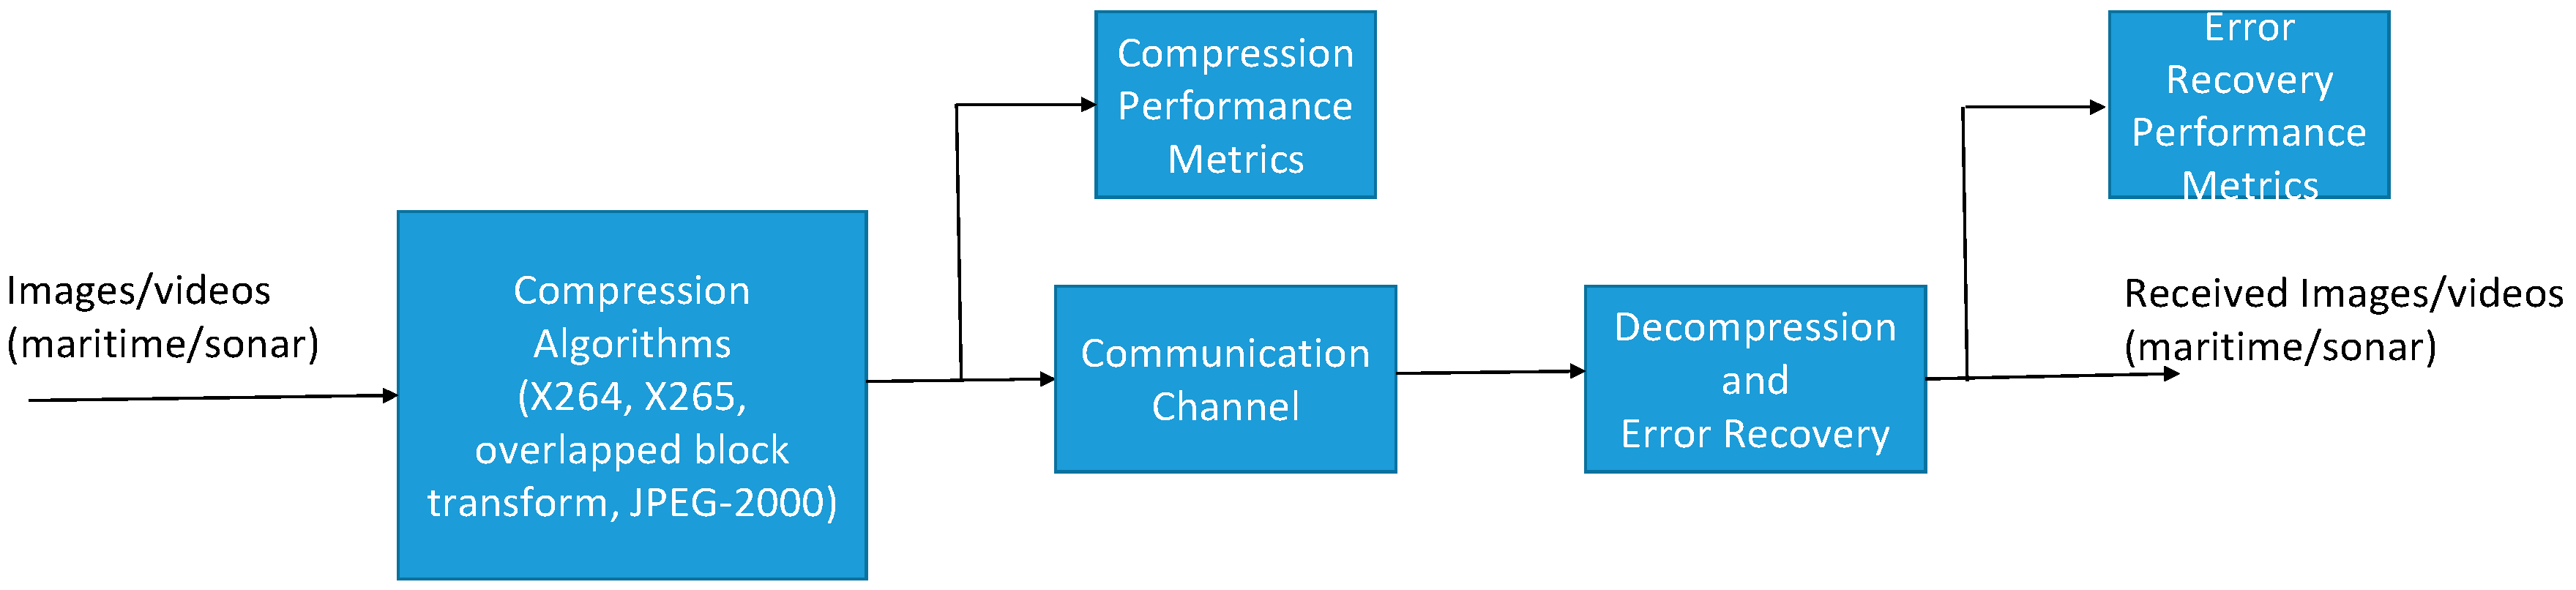
In this study, we focused on objective evaluations using four well-known compression algorithms in the literature. This was to ensure that we delivered the best algorithm to our customer. Our overall technical approach is summarized in
Figure 1. First, we briefly reviewed the state-of-the-art compression algorithms available on the market. At the same time, we described different performance metrics for algorithm evaluation. The focus was on metrics that can better model human perception. We also reviewed the error concealment techniques. Second, we obtained realistic maritime (low and high resolution) and sonar images for algorithm evaluation. Third, we applied the various compression algorithms to the collected images and generated various performance metrics. Finally, we also applied advanced algorithms to deal with the corrupted pixels due to channel errors.
2.2. Short Review of Compression Algorithms
We compared image codecs on the market, objectively evaluated each one using diverse maritime and sonar images, and recommended the best codec to our customer. With that in mind, we performed a brief review of the existing high performance codecs, performance metrics, and error resilient coding.
2.2.1. DCT Based Algorithms
JPEG [
1]: JPEG is the very first image compression standard developed in the 1990s. The video counterparts are the MPEG-1 and MPEG-2 standards. It is efficient and is still being used by NASA in space applications [
4,
5].
JPEG-XR [
20]: It was developed by Microsoft. The performance is comparable to JPEG-2000. It is mainly used for still image compression.
VP8 and VP9 [
21,
22]: These video compression algorithms are owned by Google. The performance is somewhat close to X-264. However, it is not as popular as X264.
X-264 [
9]: X264 is the current state-of-the-art algorithm in video compression. YouTube uses X264. It has good still image compression as well.
X-265 [
10]: This is the next-generation video codec and has excellent still image compression and video compression. However, the computational complexity is much more than that of X264. In general, X265 has the same basic structure as previous standards, but contains many incremental improvements over X264. Several studies conclude that X265 yields the same quality as X264, but with only half the bitrate. It should be noted that X264 and X265 are optimized versions of H264 and H265, respectively.
Daala [
12]: Recently, there is a parallel activity at Xiph.org foundation, which implements a compression codec called Daala [
12]. It is based on DCT. There are pre- and post-filters to increase energy compaction and remove block artifacts. This type of transform is known as lapped transform (LT). Daala borrows ideas from the work in [
11], which was written by one of us (T. D. Tran). The block-coding framework in Daala is illustrated in
Figure 2.
2.2.2. Wavelet Based Algorithms
JPEG2000 is a wavelet [
8] based compression standard. It has better performance than JPEG. However, JPEG2000 requires the use of the whole image for coding and hence is not suitable for real-time applications. In this study, we mainly compressed images using Daala, X264, X265, and JPEG2000.
2.3. Principle of Error Concealment for Still Images
Error resilient coding has some major issues. First, it increases overhead and hence lowers the coding efficiency. Second, error resilient coding can only repair corrupted pixels to a certain extent. In severe channel conditions, some additional post-processing, such as error concealment, is needed to fix the corrupted pixels and recover lost data.
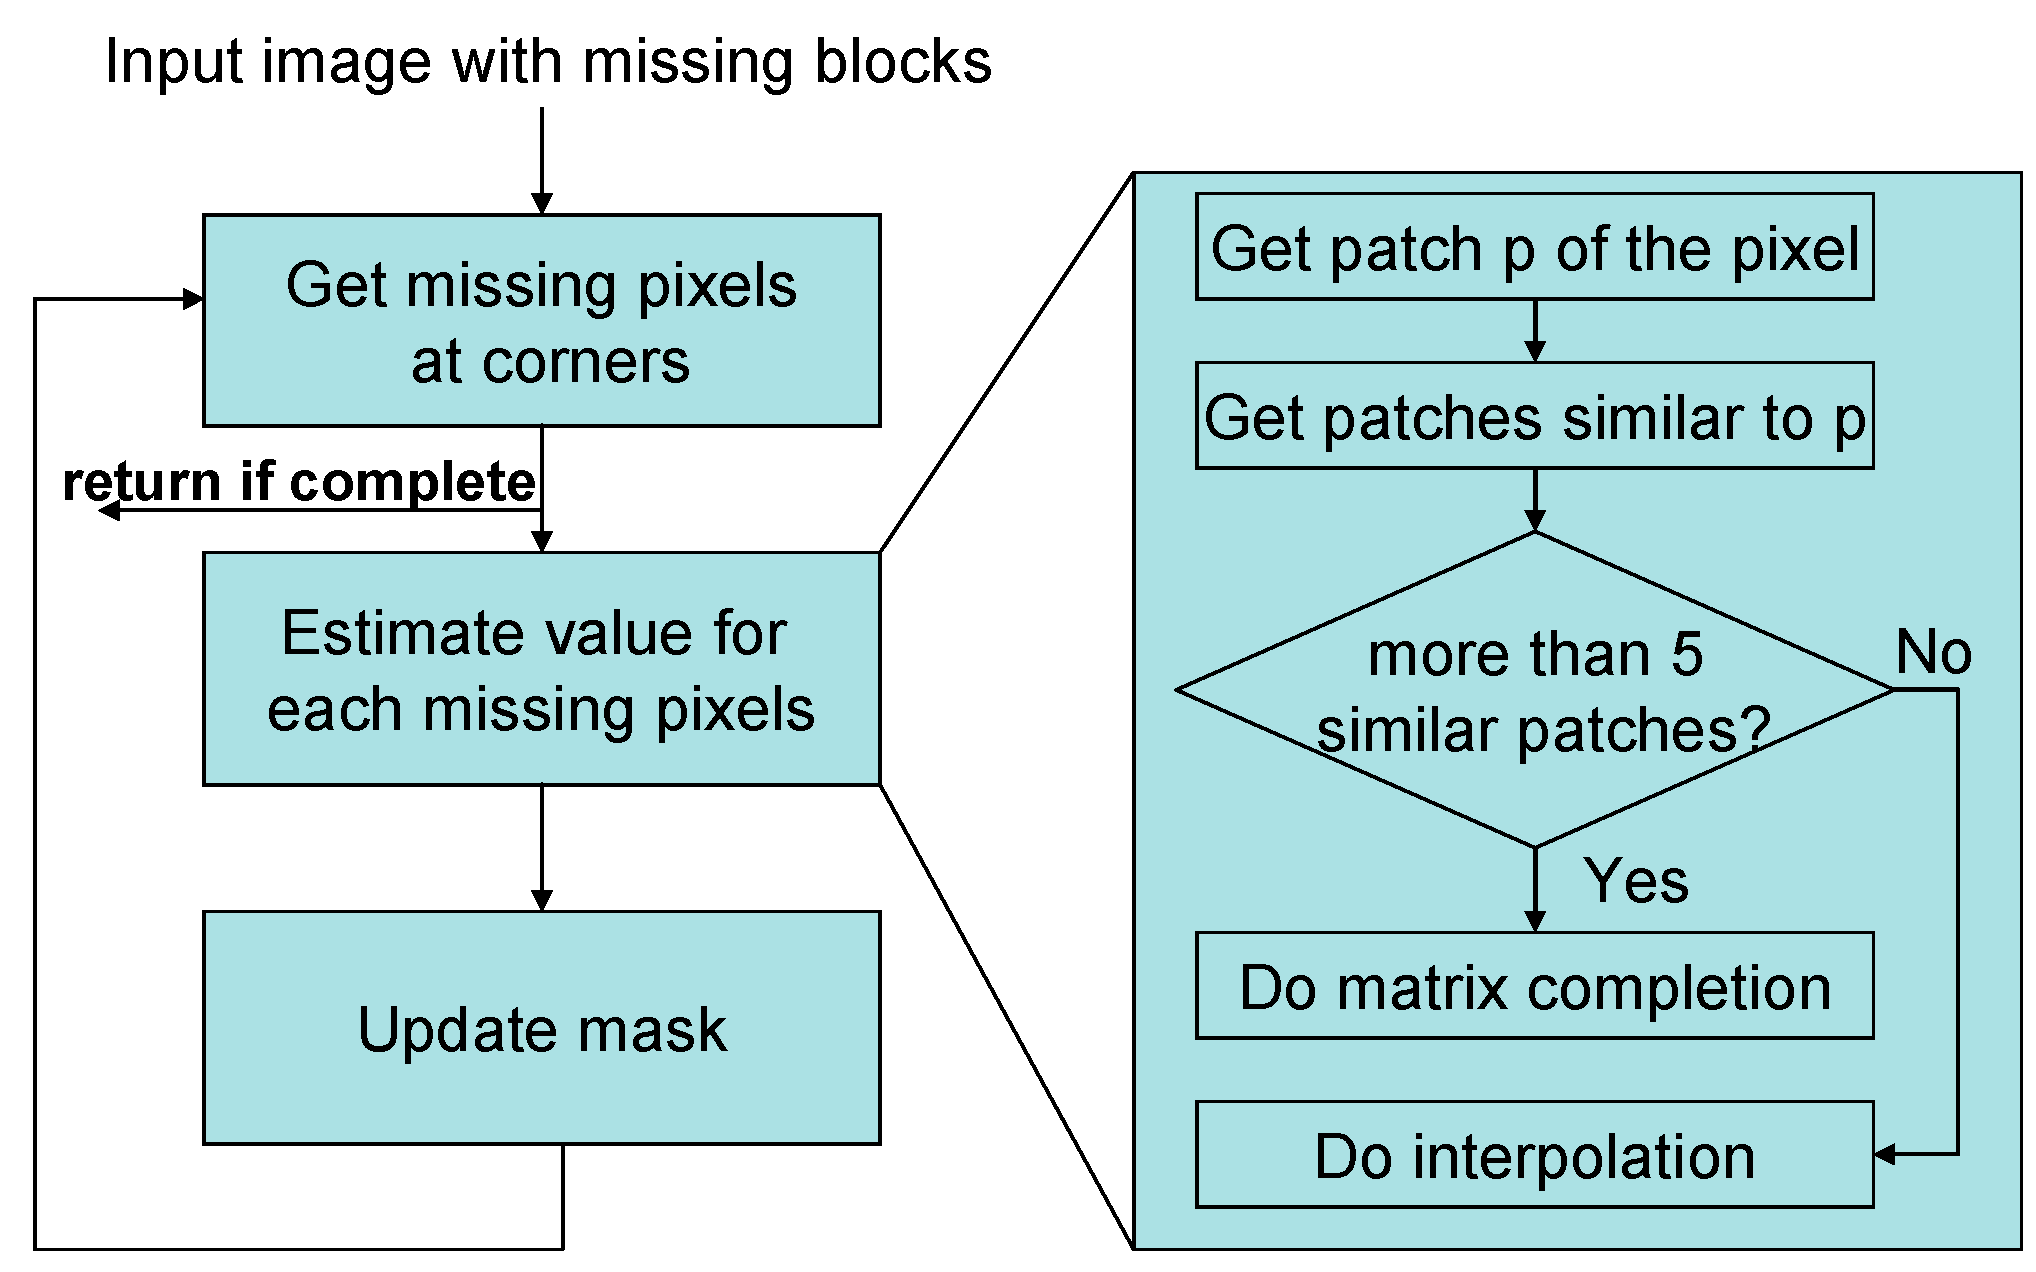
The core idea of the local matrix completion with similar blocks (LMCS) [
23] is that, for a missing pixel, we first extract the corresponding patch and use similar patches in the image to help fill in the missing value based on matrix completion. If there are not enough similar patches, we fill in the pixel with another of our algorithm, known as local patch matrix completion (LPMC) [
24]. A flow chart for the LMCS algorithm is also shown in
Figure 3. More details of our algorithms can be found in [
23,
24]. Researchers have used sparse representation in hyperspectral image processing [
25,
26,
27,
28], denoising [
29], compressive sensing [
30,
31], and target recognition ([
32], and references therein).
2.4. Performance Metrics
In many compression systems, researchers use the peak signal-to-noise ratio (PSNR) or structural similarity (SSIM) to evaluate the compression algorithms. Given a fixed compression ratio, algorithms that yield higher PSNR or SSIM are regarded as better algorithms. However, PSNR and SSIM do not correlate well with human perception. Recently, a group of researchers investigated a number of different performance metrics [
33]. Extensive experiments were performed to investigate the correlation between human perception with various performance metrics. According to the results found in [
33], it was determined that two performance metrics known as human visual system (HVS) and HVS with masking (HVSm) correlate well with human perception.
For completeness, we briefly present the above four metrics.
To generate PNSR, we need to compute the Root Mean Squared Error (RMSE). The RMSE of two vectorized images
(ground truth) and
(prediction) is defined as
where
Z is the number of pixels in each image. The ideal value of RMSE is 0 if the prediction is perfect. The PSNR is related to RMSE defined in Equation (1). If the image pixels are expressed in doubles with values between 0 and 1, then
A higher PSNR means better quality.
• SSIM
This is a metric [
35] to reflect the similarity between two images. The SSIM index is computed on various blocks of an image. The measure between two blocks
x and
y from two images can be defined as
where
and
are the means of blocks
x and
y, respectively;
and
are the variances of blocks
x and
y, respectively;
is the covariance of blocks
x and
y; and
and
are small values (0.01, for instance) to avoid instability. The ideal value of SSIM is 1 for perfect prediction.
• HVS
The HVS metric is defined as
where
I and
J denote image size,
K = 1/[(
I − 7)(
J − 7)64],
are the discrete cosine transform (DCT) [
36] coefficients of 8 × 8 image block for which the coordinates of the its upper left corner are equal to
i and
j,
are the DCT coefficients of the corresponding block in the original image, and
is the matrix of correcting factors [
37].
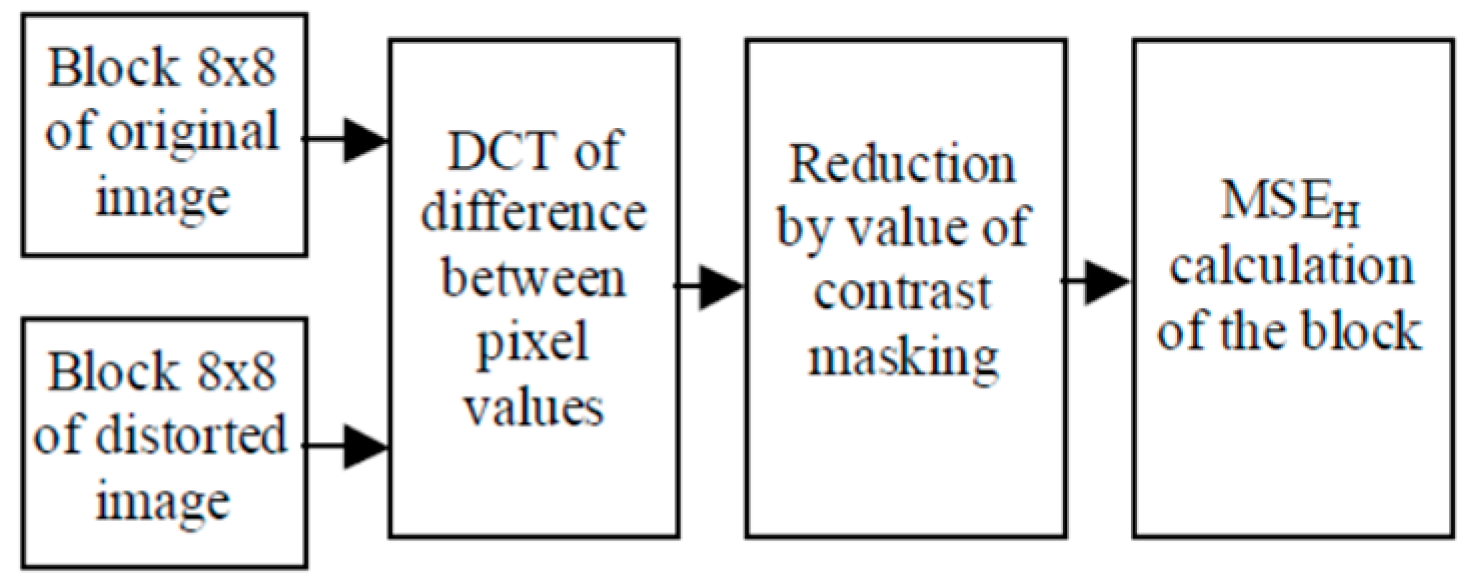
• HVSm
This metric is similar to HVS except that visual masking effects are taken into account. A block diagram is shown in
Figure 4. The inclusion of a block containing contrast masking is the only difference between HVS and HVSm. Details can be found in [
33].
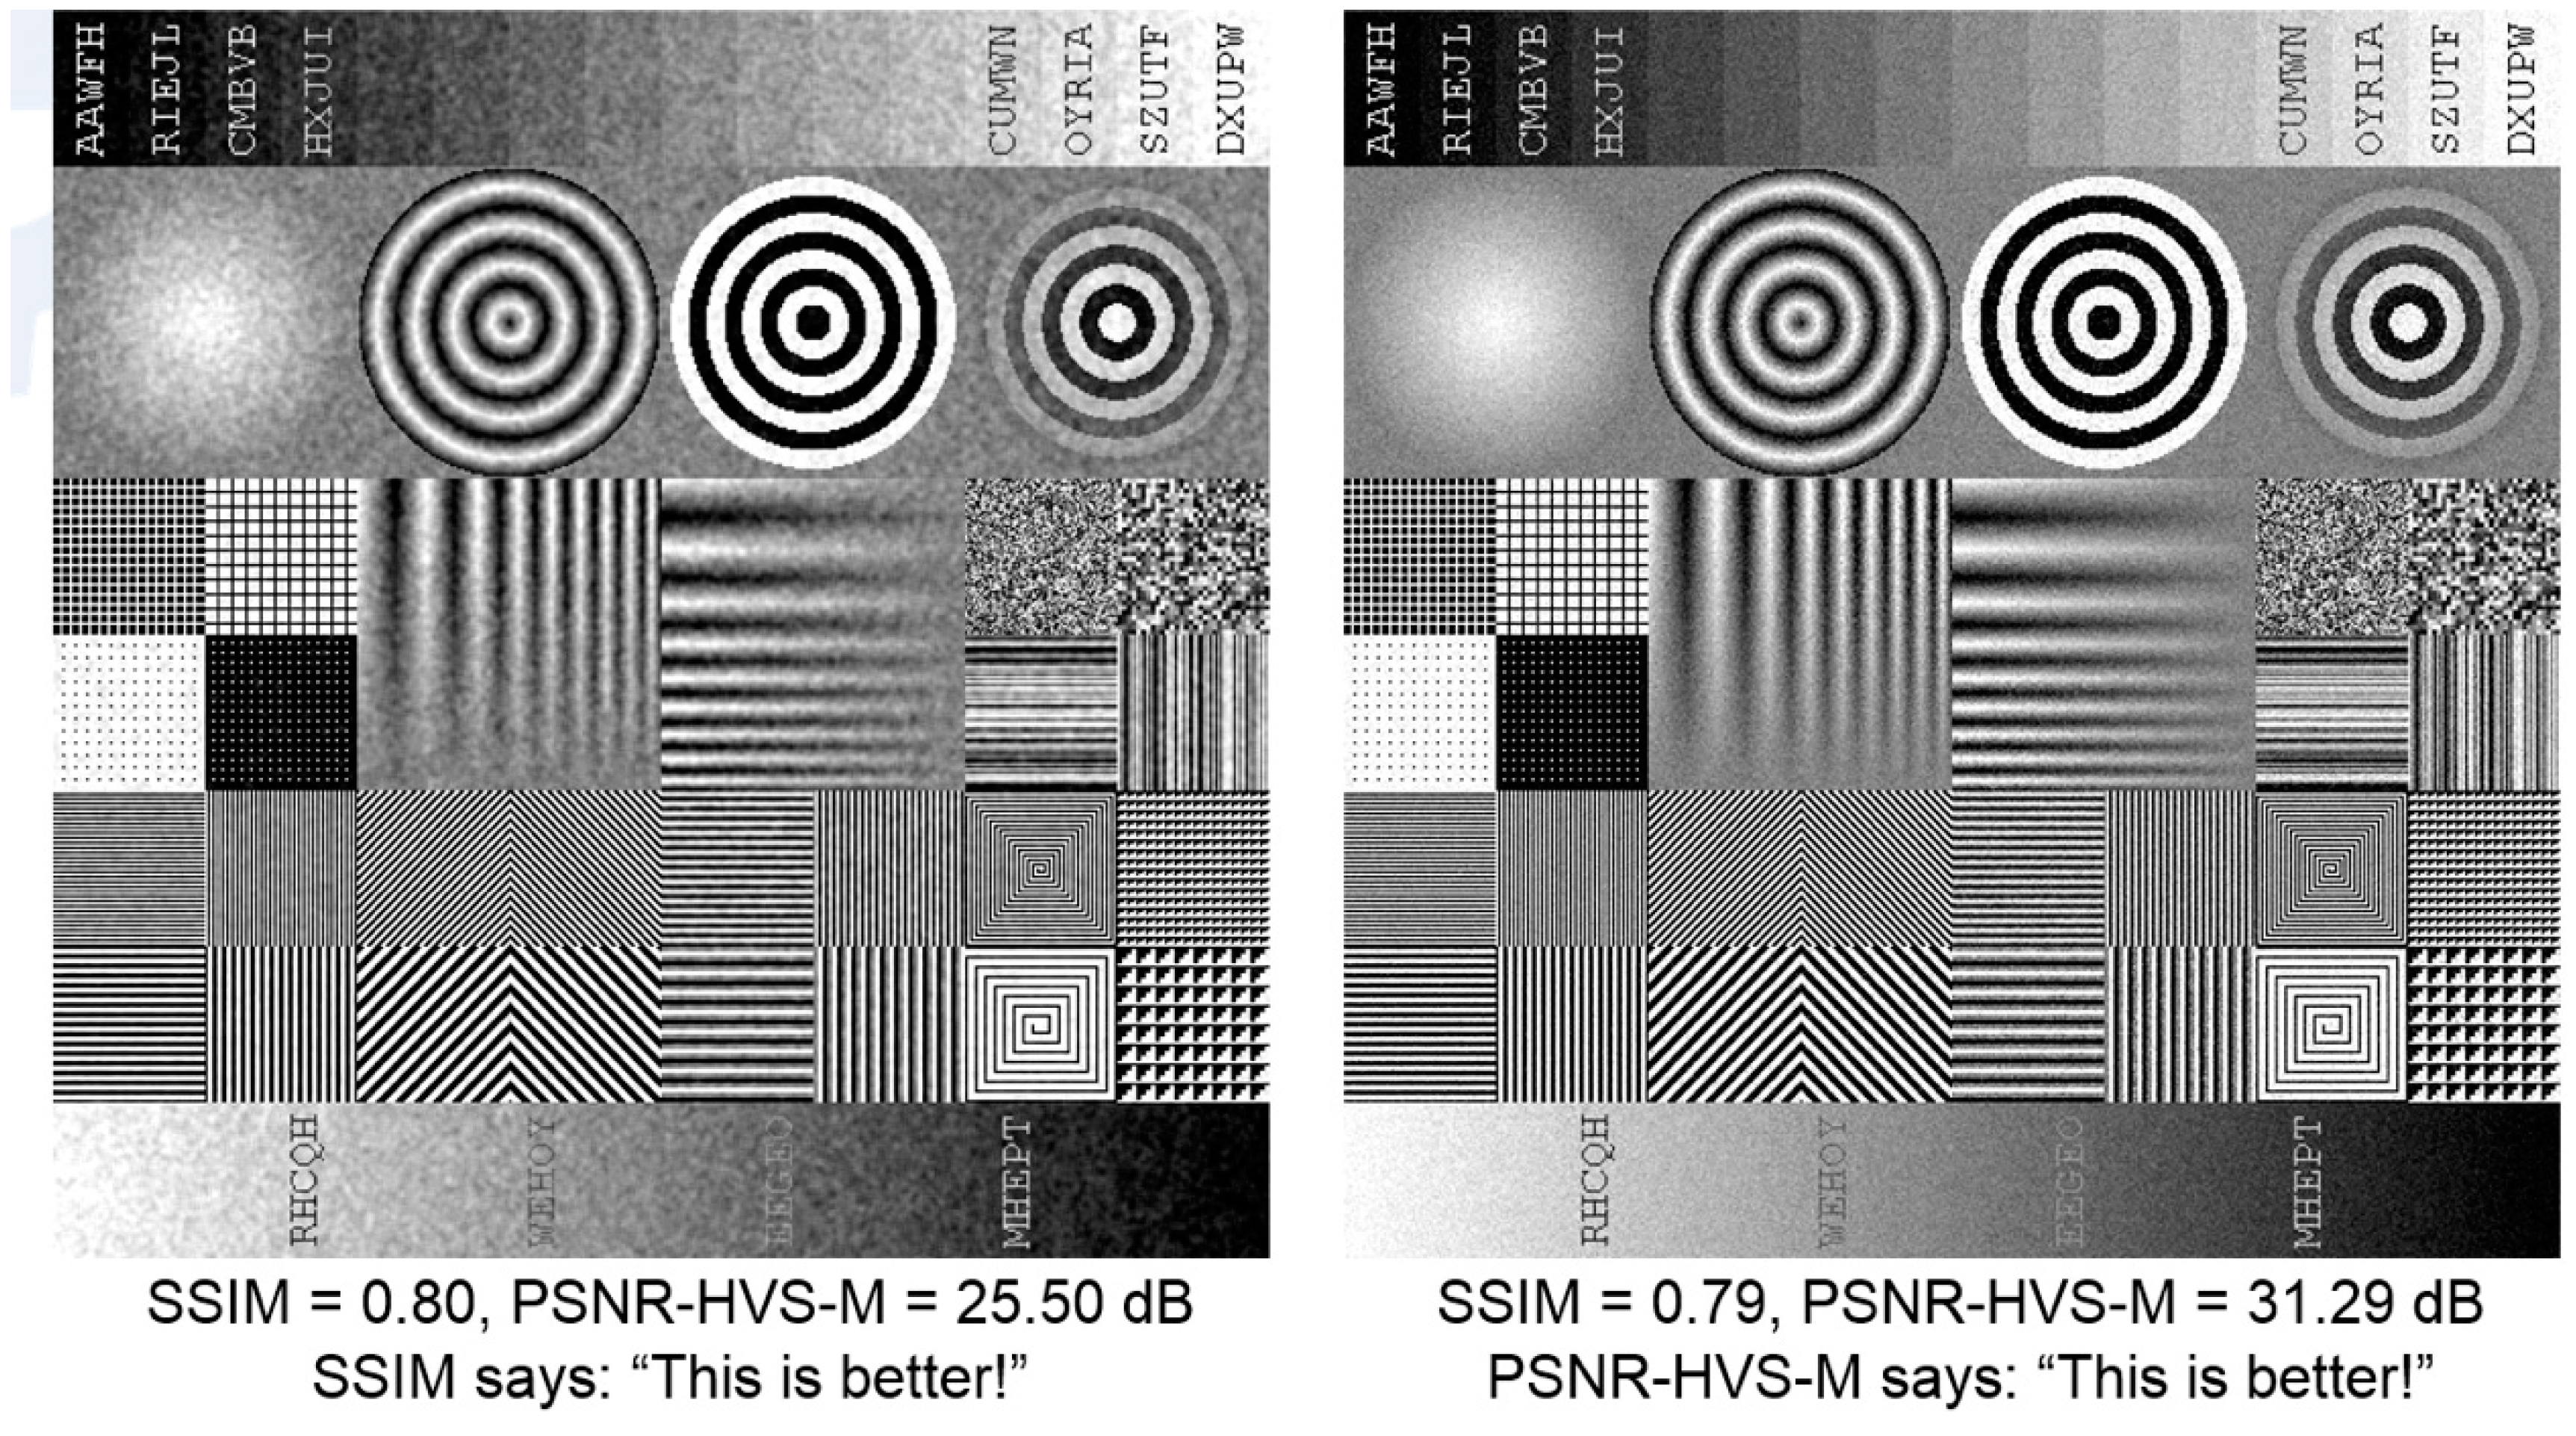
One example shown in
Figure 5 demonstrates that HVSm is closer to human perception than SSIM.
On the website of the authors of [
33], there is a table containing the correlation of different metrics with human perception. For completeness, we include that table below (
Table 1). It can be seen that HVSm and HVS have much higher correlation with human perception than PSNR and SSIM in terms of Spearman and Kendall correlation coefficients.
Hence, in addition to PSNR and SSIM, we also used HVS and HVSm for assessing perceptually lossless compression.
3. Still Image Compression Results
3.1. Data
We searched the Internet and found over 30 low resolution color images, over 10 high resolution maritime images, and over 10 sonar images. Moreover, we also included four high quality images from Xiph’s website. Although these images from Xiph are not related to maritime or sonar images, we included them to demonstrate that the proposed framework can be used for diverse images. These images were used to demonstrate that the compression algorithms need to have consistent performance for images with different resolutions and modalities. We applied four compression algorithms: Daala, X264, X265, and JPEG2000. All of them, except JPEG2000, are DCT based compression algorithms. For each image, we applied these four algorithms to compress the images at different compression ratios. Four performance metrics were applied to evaluate the compression performance.
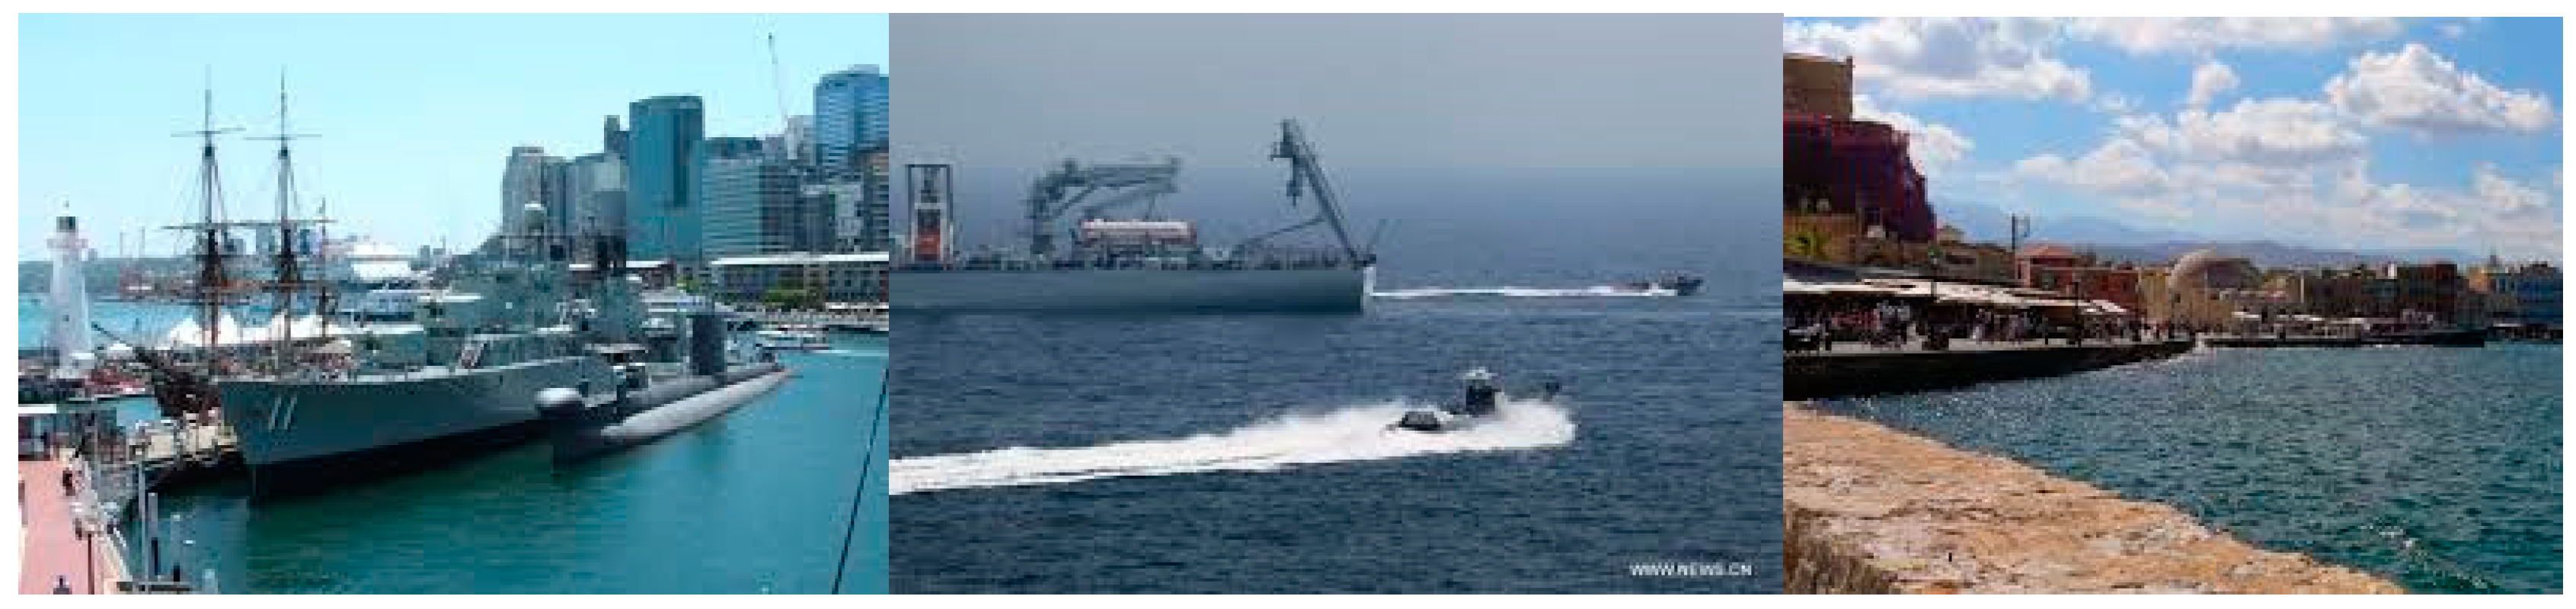
3.1.1. Low Resolution Maritime Images
We found over 30 images, which are of low resolution. If one zooms in to look at the details, one can notice some artifacts. Here, we include a few sample maritime images in
Figure 6.
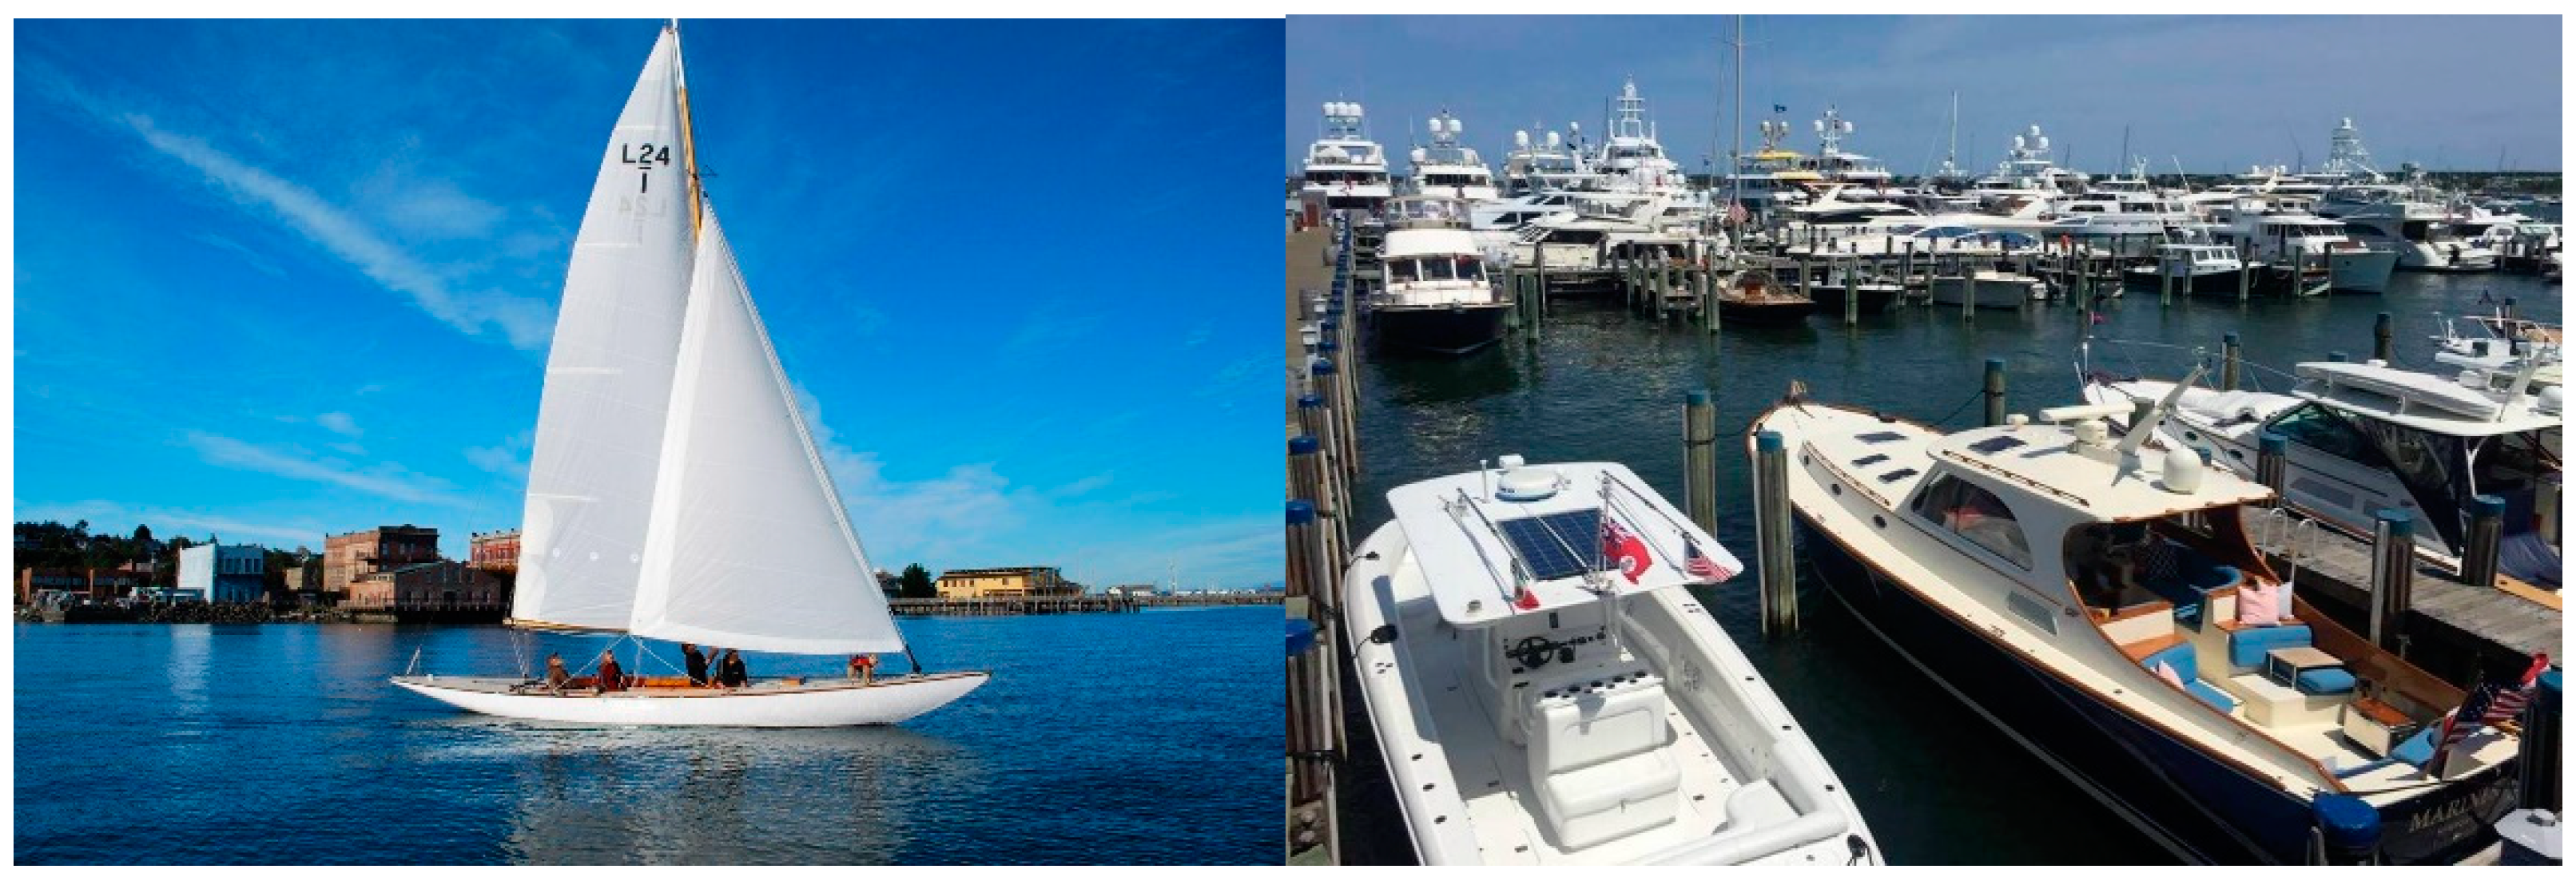
3.1.2. New High Resolution Maritime Images
Those maritime images in
Figure 6 are of low resolution. It was of interest to see whether the compression performance would change with different image resolutions. We found 12 high resolution maritime images. Two of them are shown in
Figure 7.
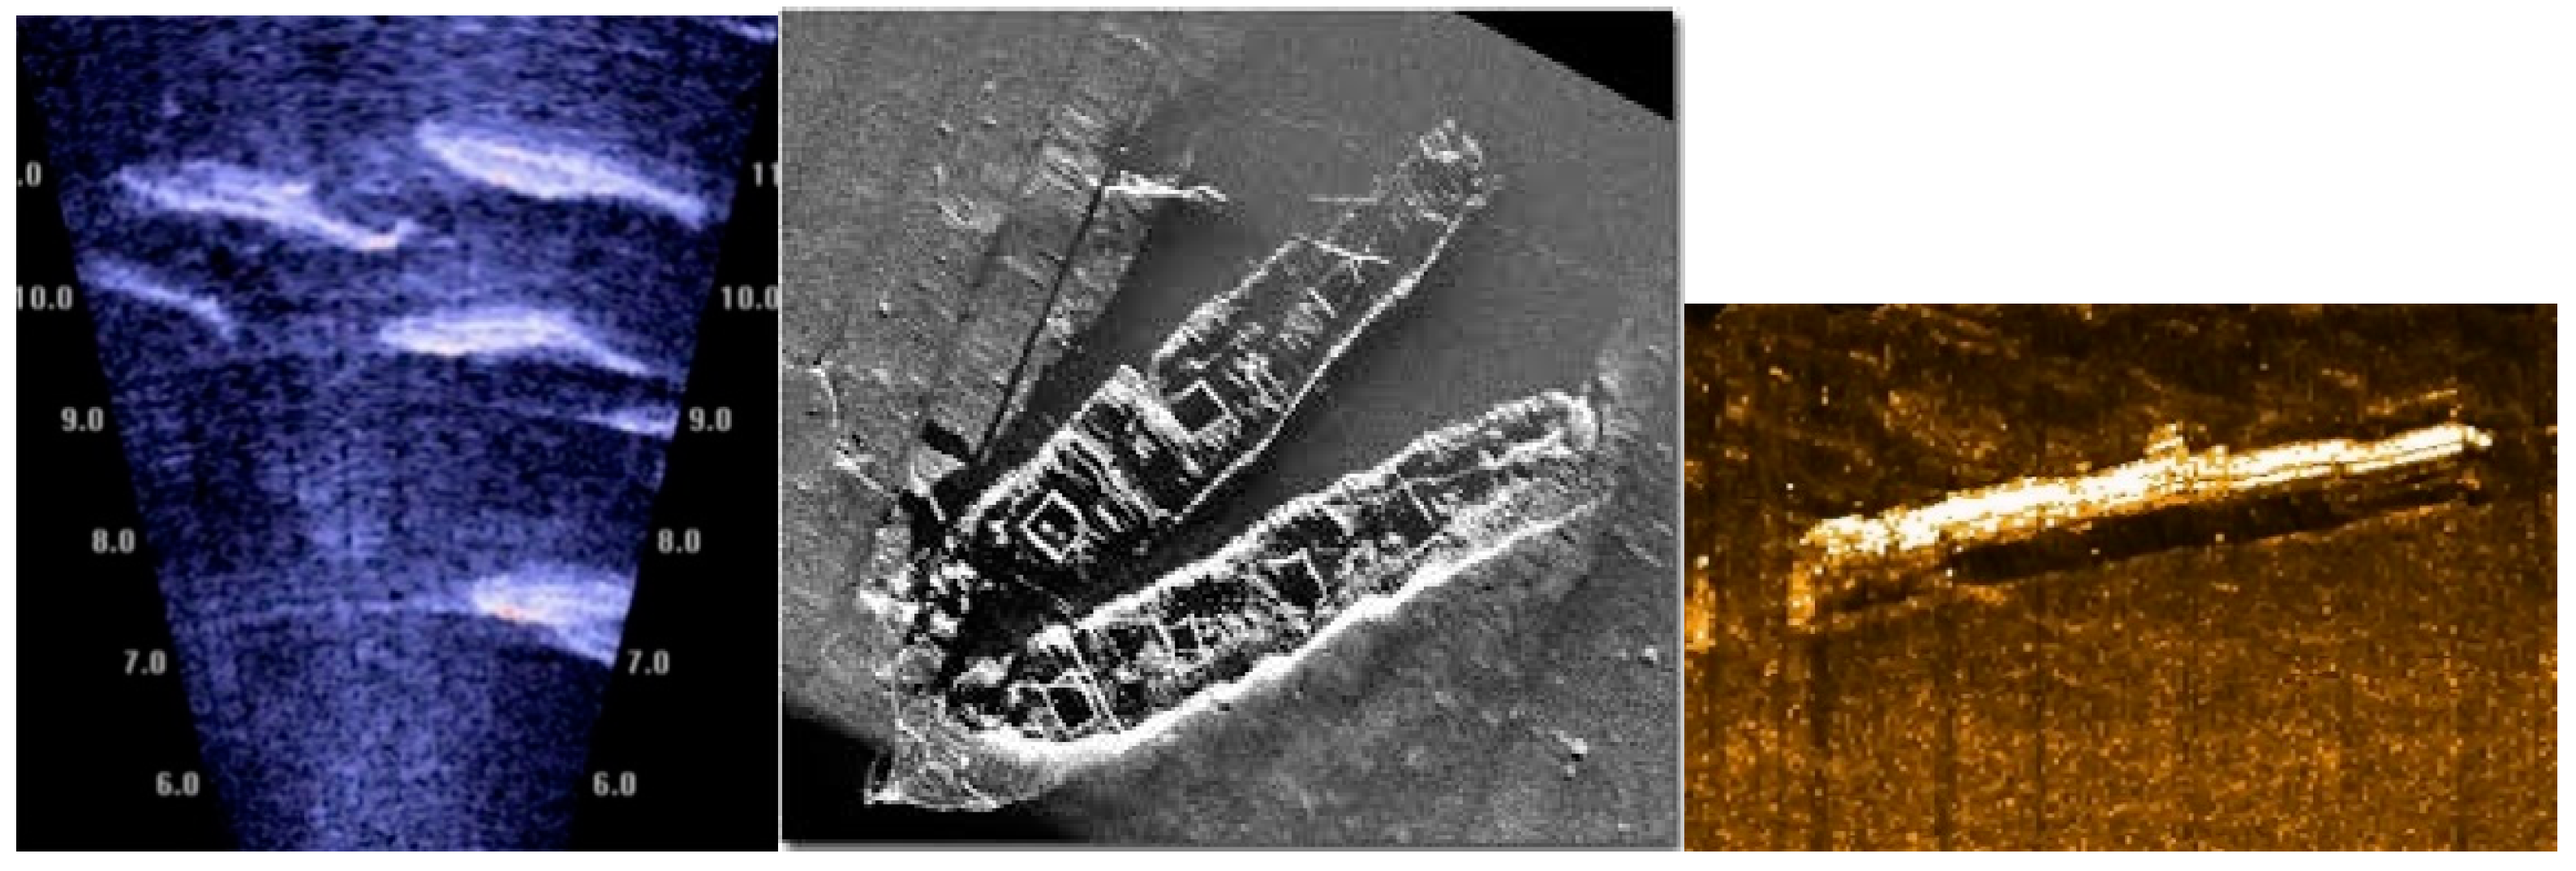
3.1.3. Sonar Images
We found more than 10 images from the Internet. Some of them are shown in
Figure 8.
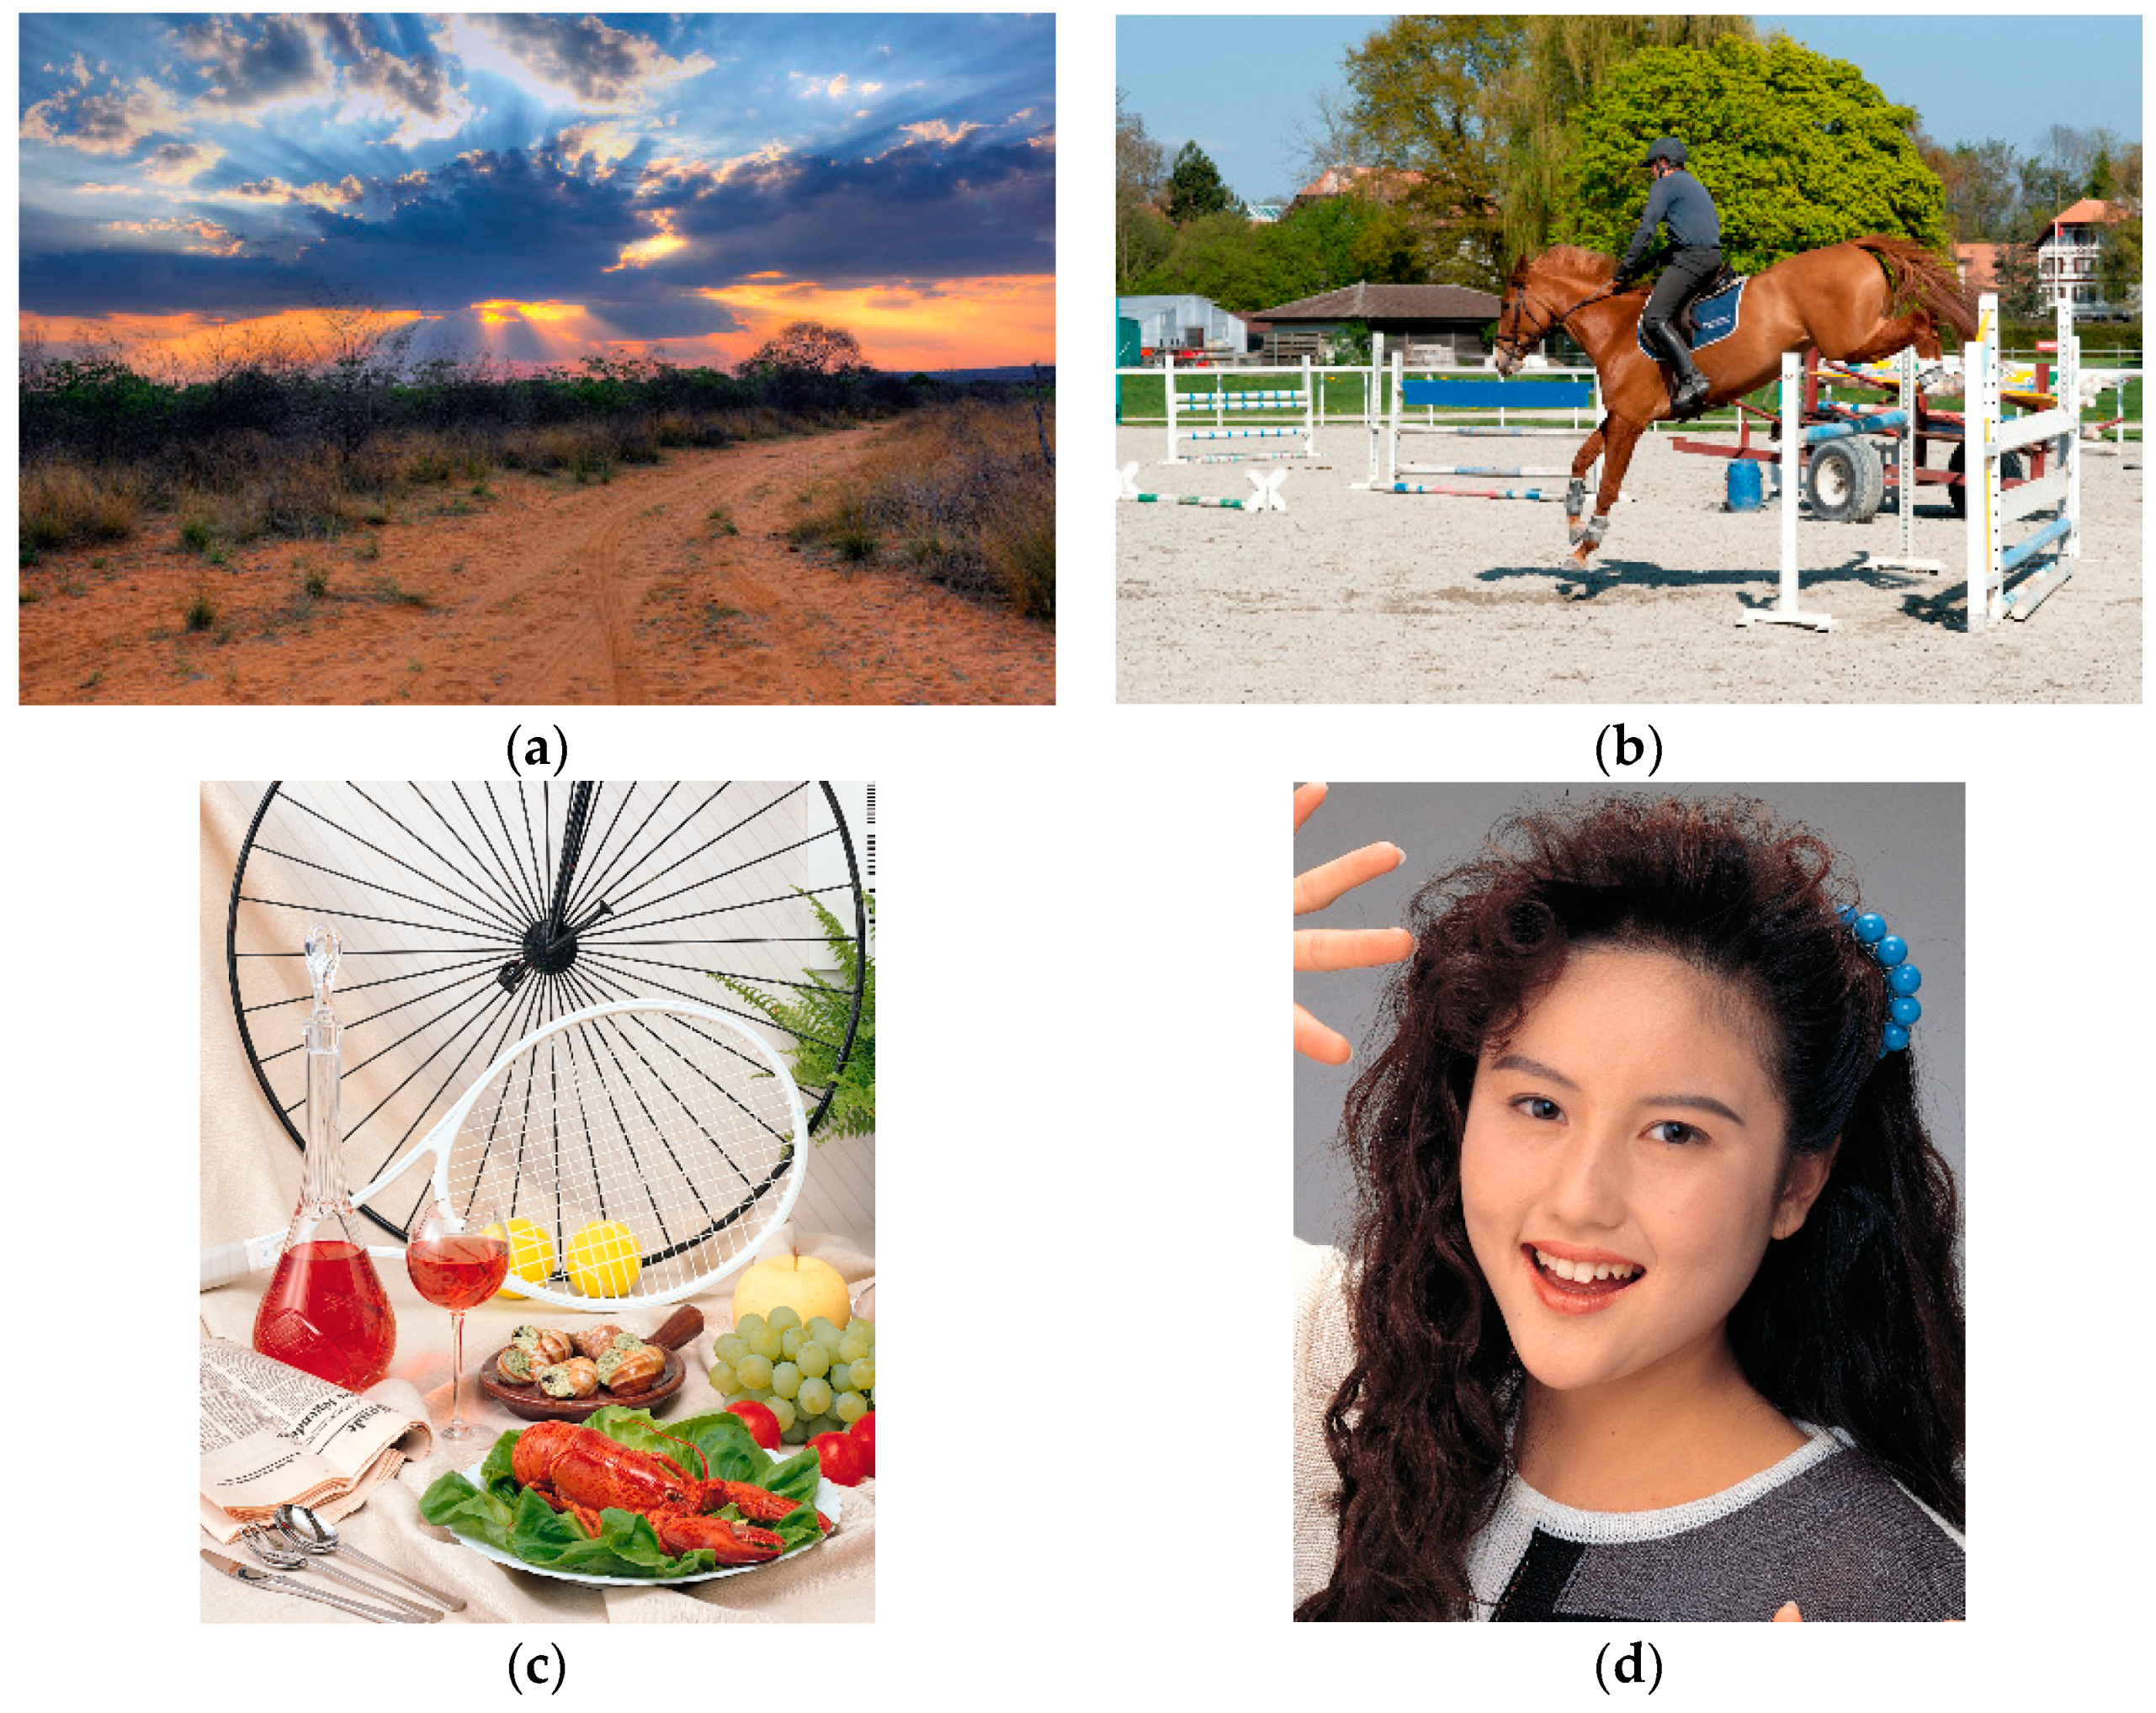
3.1.4. High Quality Color Images
We also used four high quality images from [
12]. As shown in
Figure 9, these images are neither maritime nor sonar images. However, the images have diverse image contents and we would like to demonstrate that our framework can also effectively compress such images at 10 to 1 compression.
3.2. Low Resolution Maritime Image Compression Results
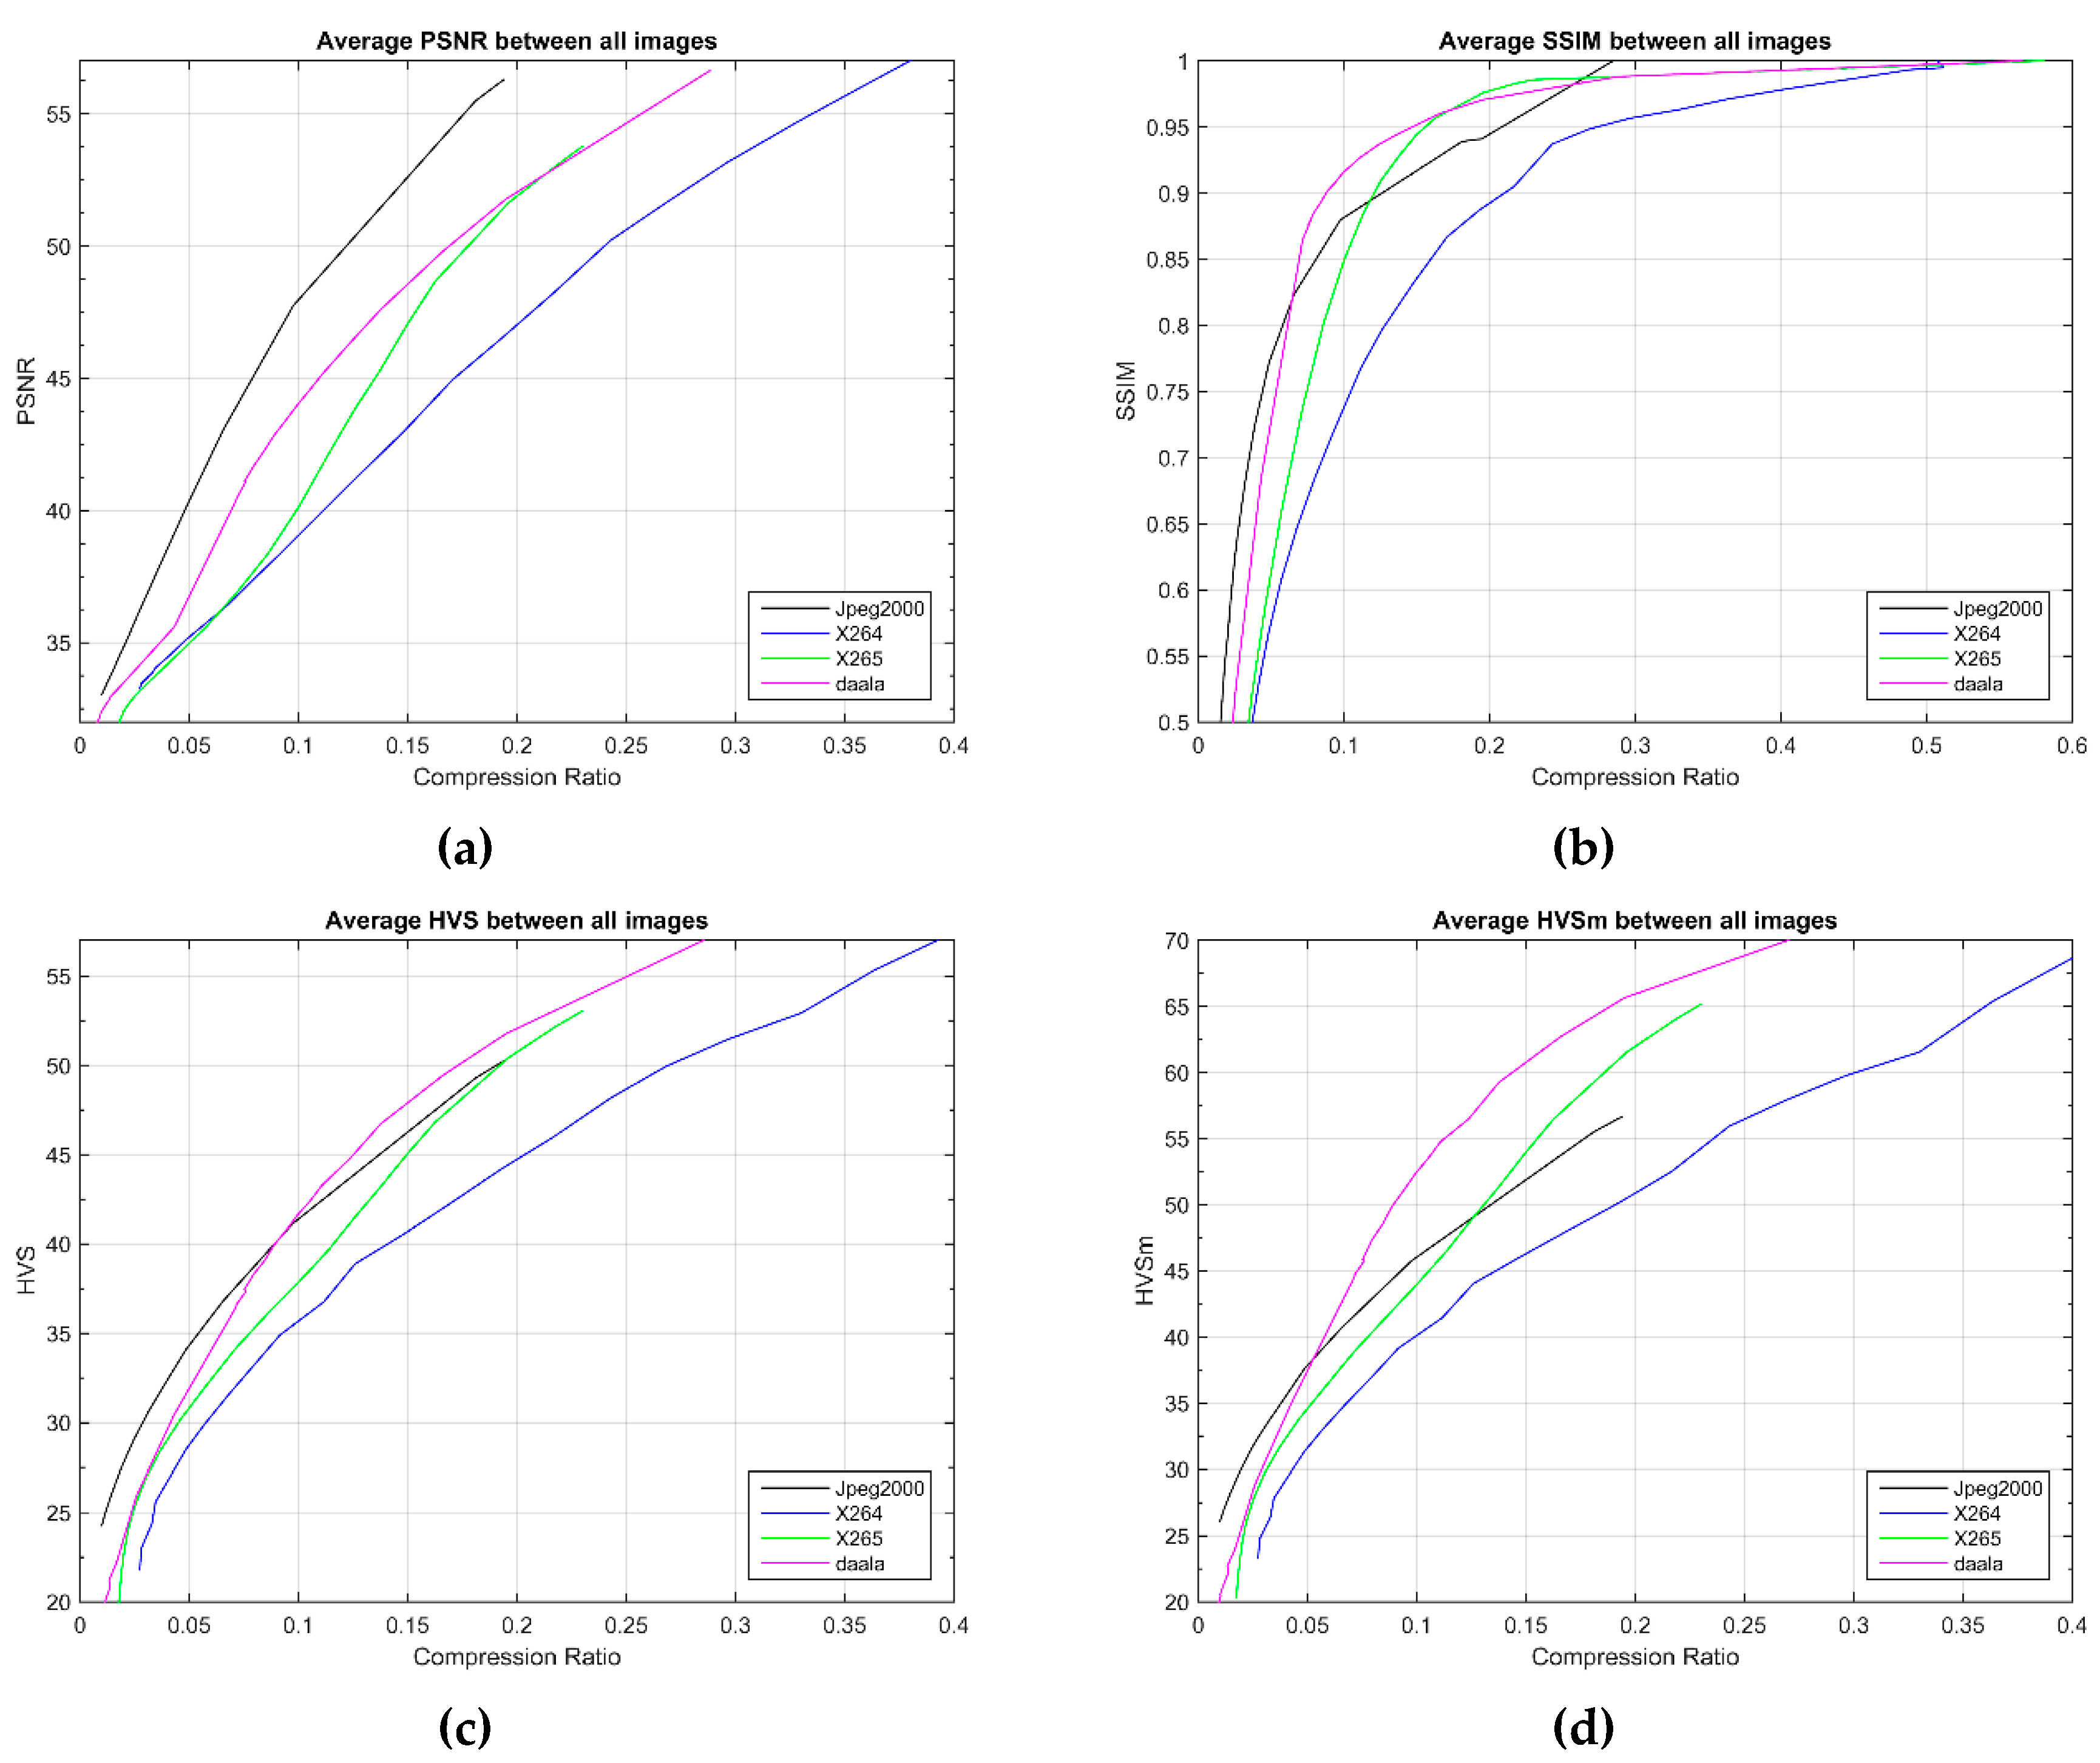
There are cameras with different resolutions onboard naval ships. The objectives of the study were: (1) to compare the performance of four compression algorithms using four performance metrics and determine which algorithm has the best performance; and (2) to investigate the performance at 0.1 compression ratio and see if we could achieve near or even perceptually lossless quality (> 40 dBs in HVSm) in the decompressed images. Let us focus on a region near 0.1 compression ratio in
Figure 10. One can immediately observe some big variations in performance for different algorithms and metrics. For low resolution maritime images, JPEG2000 performed the best, followed by Daala, in terms of PSNR. JPEG2000 had better performance because it uses the whole image, whereas the other codecs use small blocks. However, for SSIM and HVSm, Daala had the highest scores. To our knowledge, the high HVSm values are because the researchers at Xiph have devoted a lot of their effort in fine-tuning and improving the perceptual quality of the decompressed images by removing small artifacts such as blocky artifacts. For HVS, Daala and JPEG2000 had similar performance (see
Figure 10). We also generated a table summarizing the statistical performance of different codecs at 0.1 compression ratio. As shown in
Table 2, JPEG2000 and Daala, except SSIM, yielded more than 40 dBs in PSNR, HVS, and HVSm, meaning that Daala and JPEG2000 could achieve near or even perceptually lossless compression. The SSIM metric for Daala was more than 0.9. For this dataset, we think Daala is the best codec because of its high scores in performance metrics and its parallel processing potential (see block processing in
Figure 2). JPEG2000, on the other hand, requires the whole image and hence is not suitable for parallel processing.
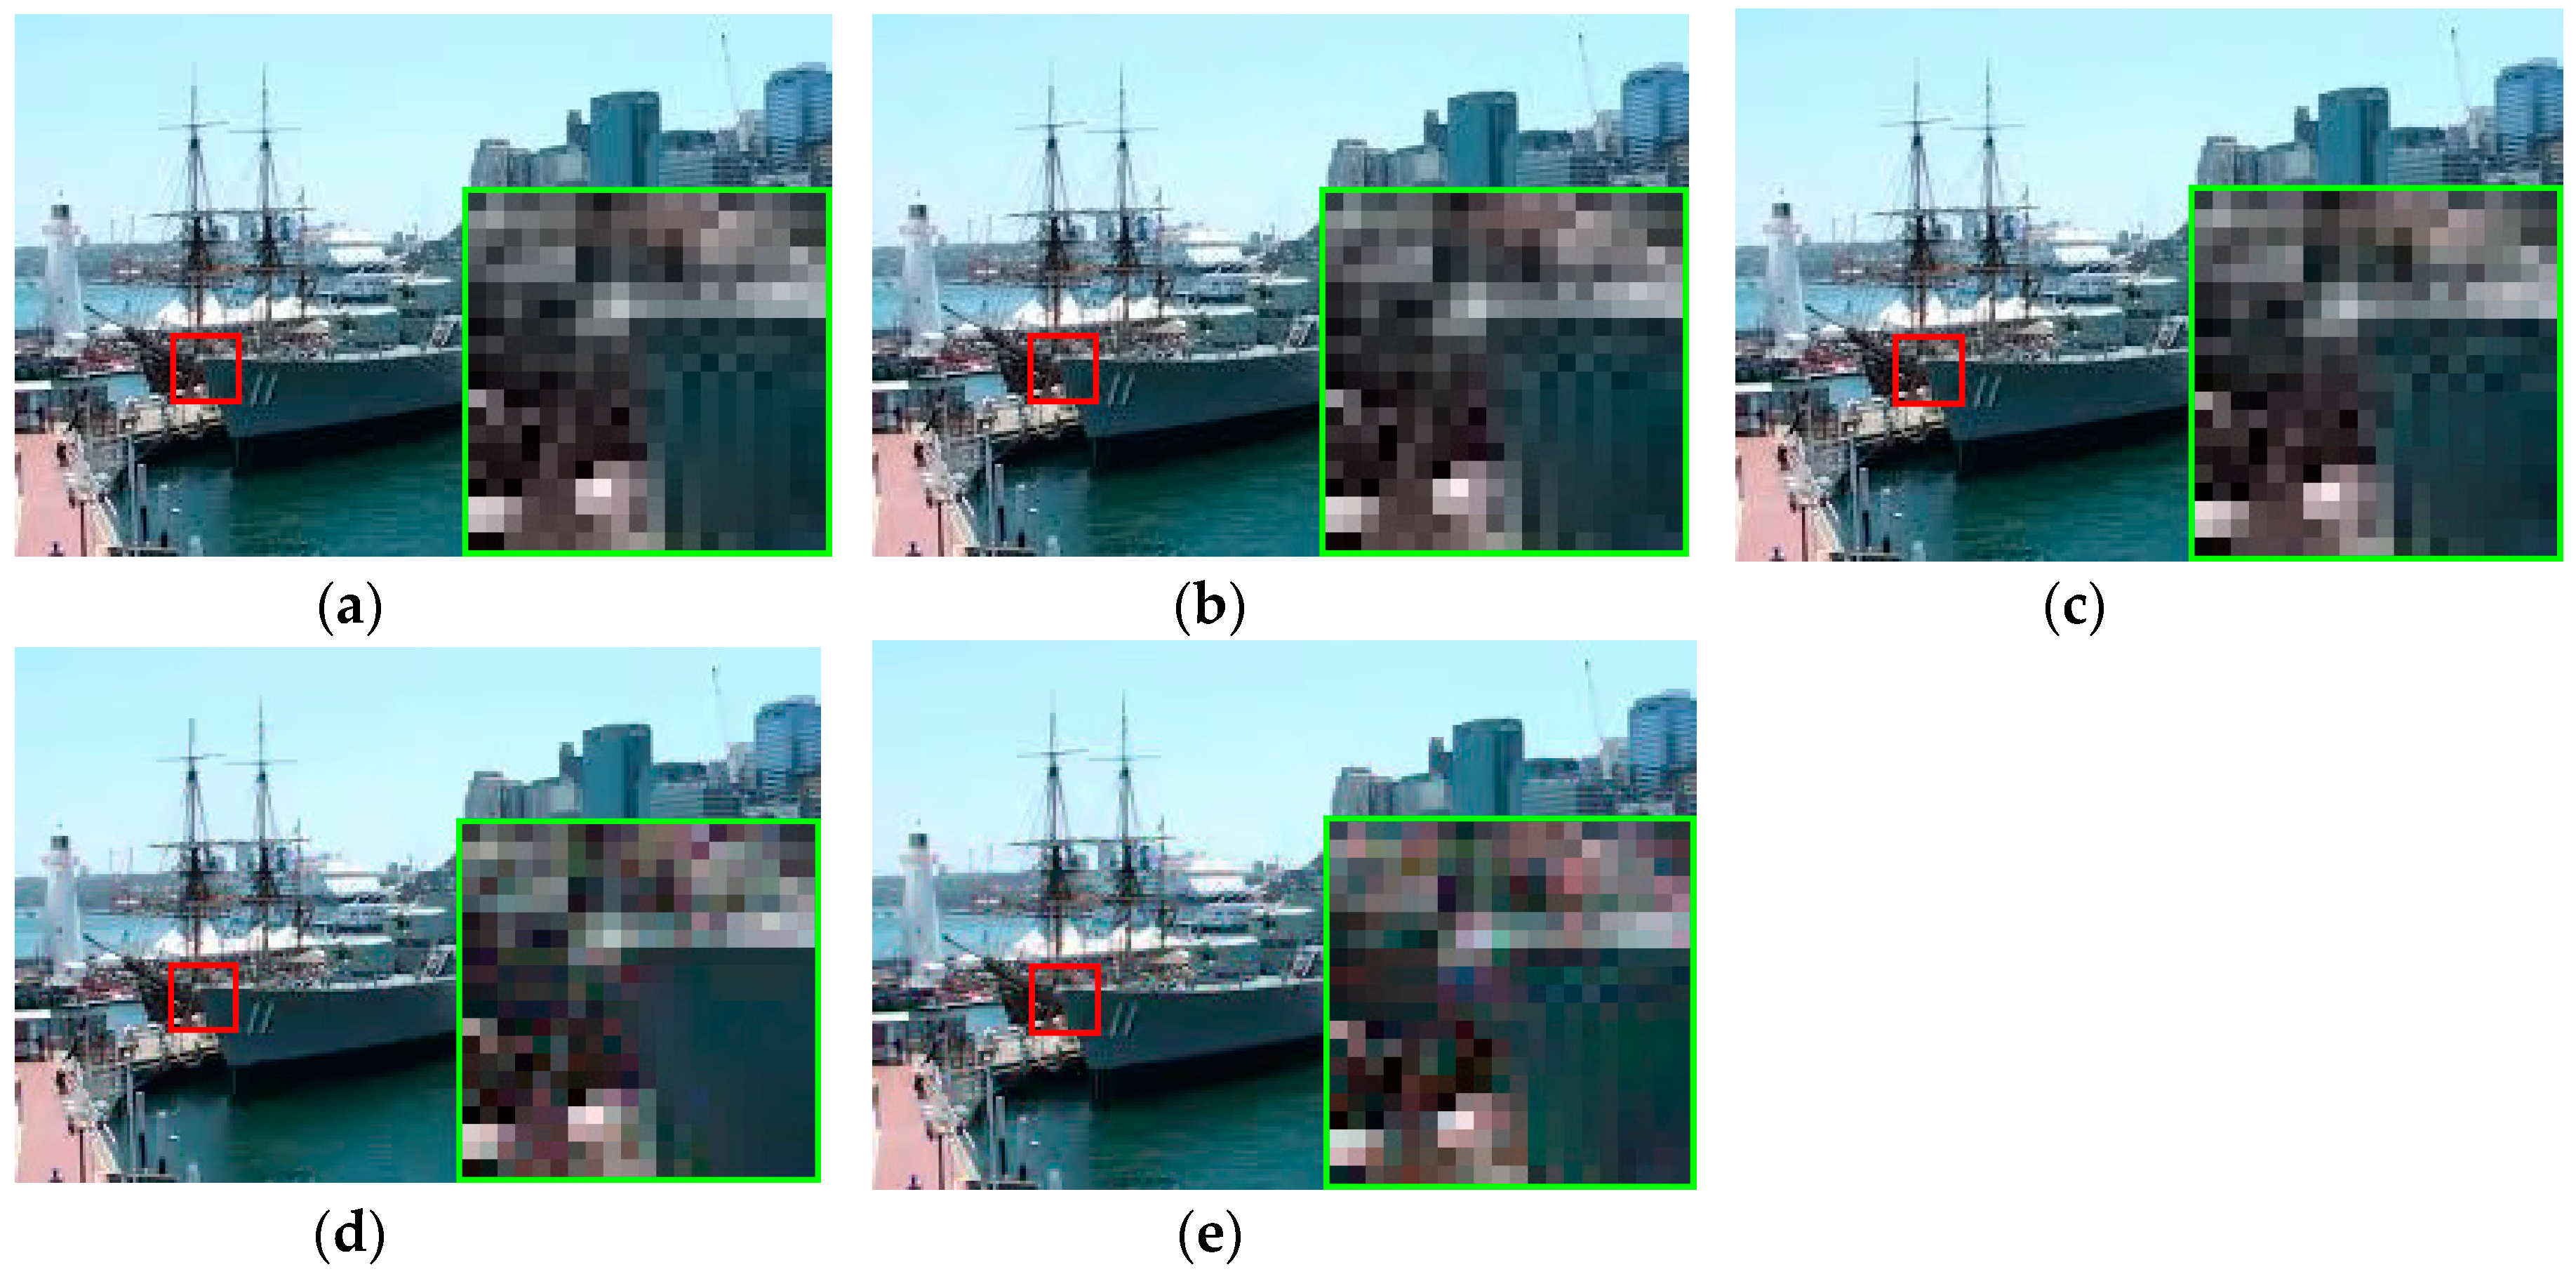
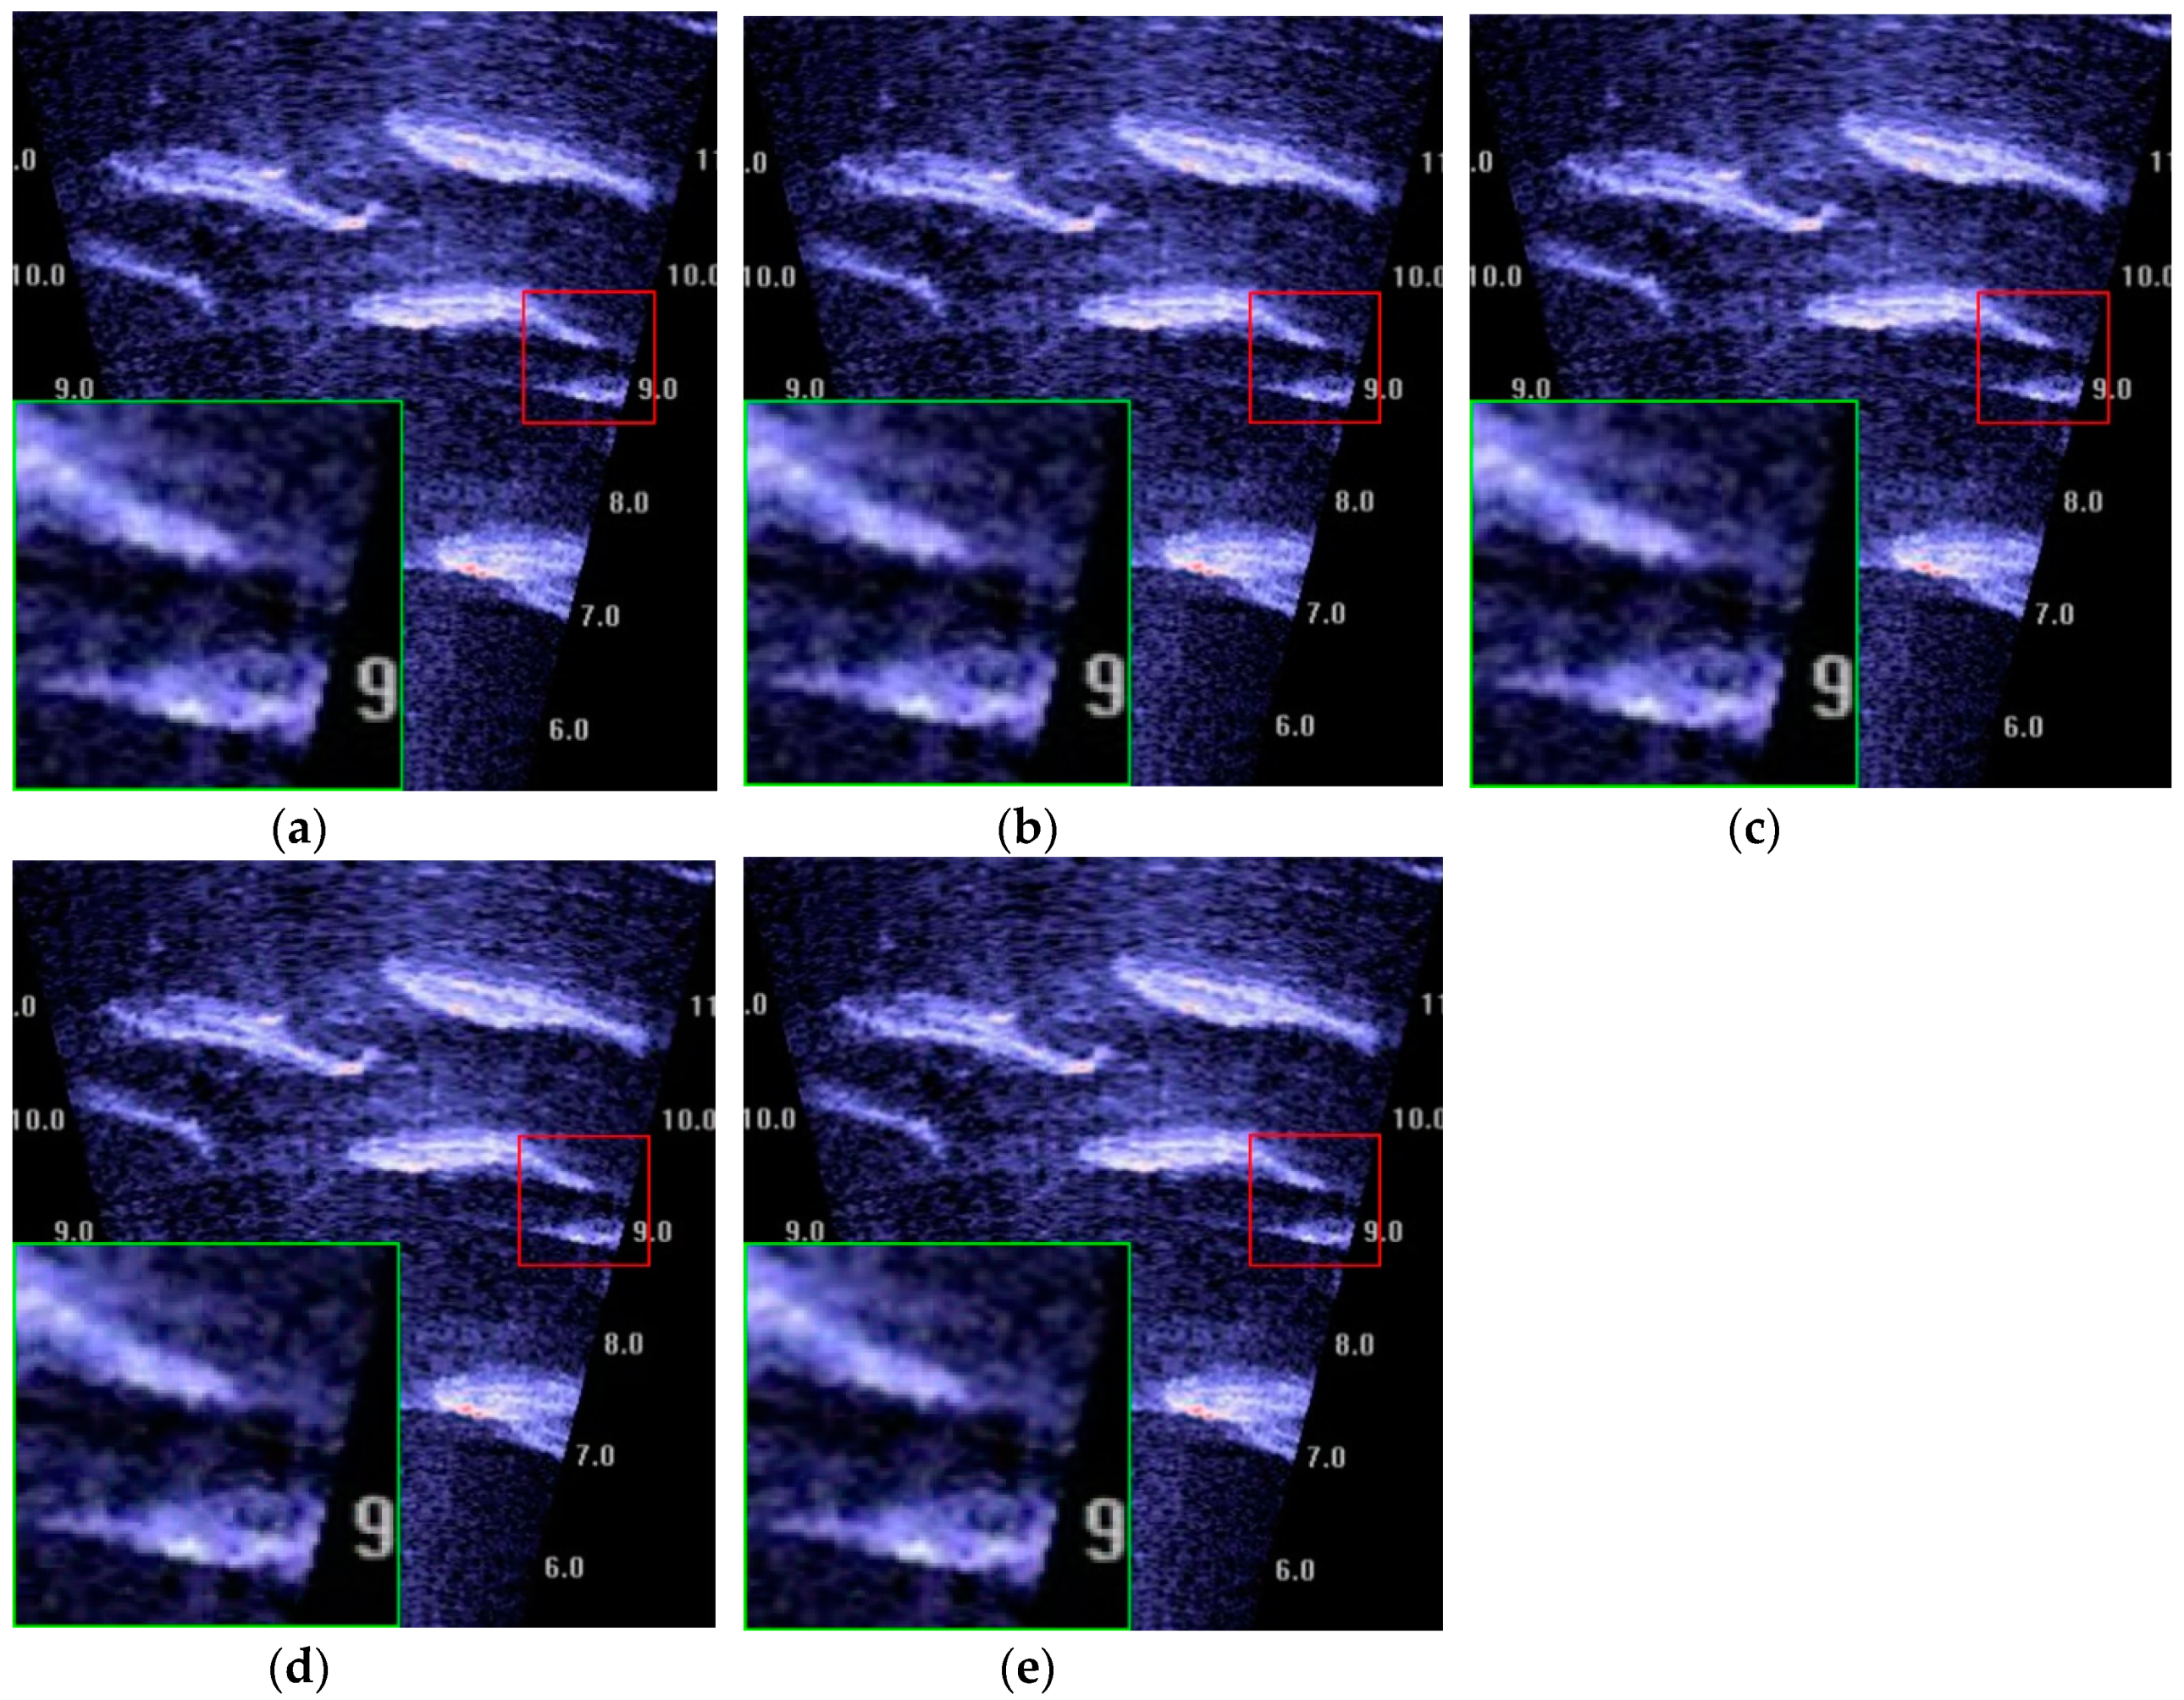
Figure 11 shows a visual comparison of decompressed images using different codecs at 10 to 1 compression ratio. It can be seen that JPEG2000 and Daala had no perceptually loss, whereas X264 had over smooth reconstruction and X265 had some color distortions.
3.3. High Resolution Maritime Image Results
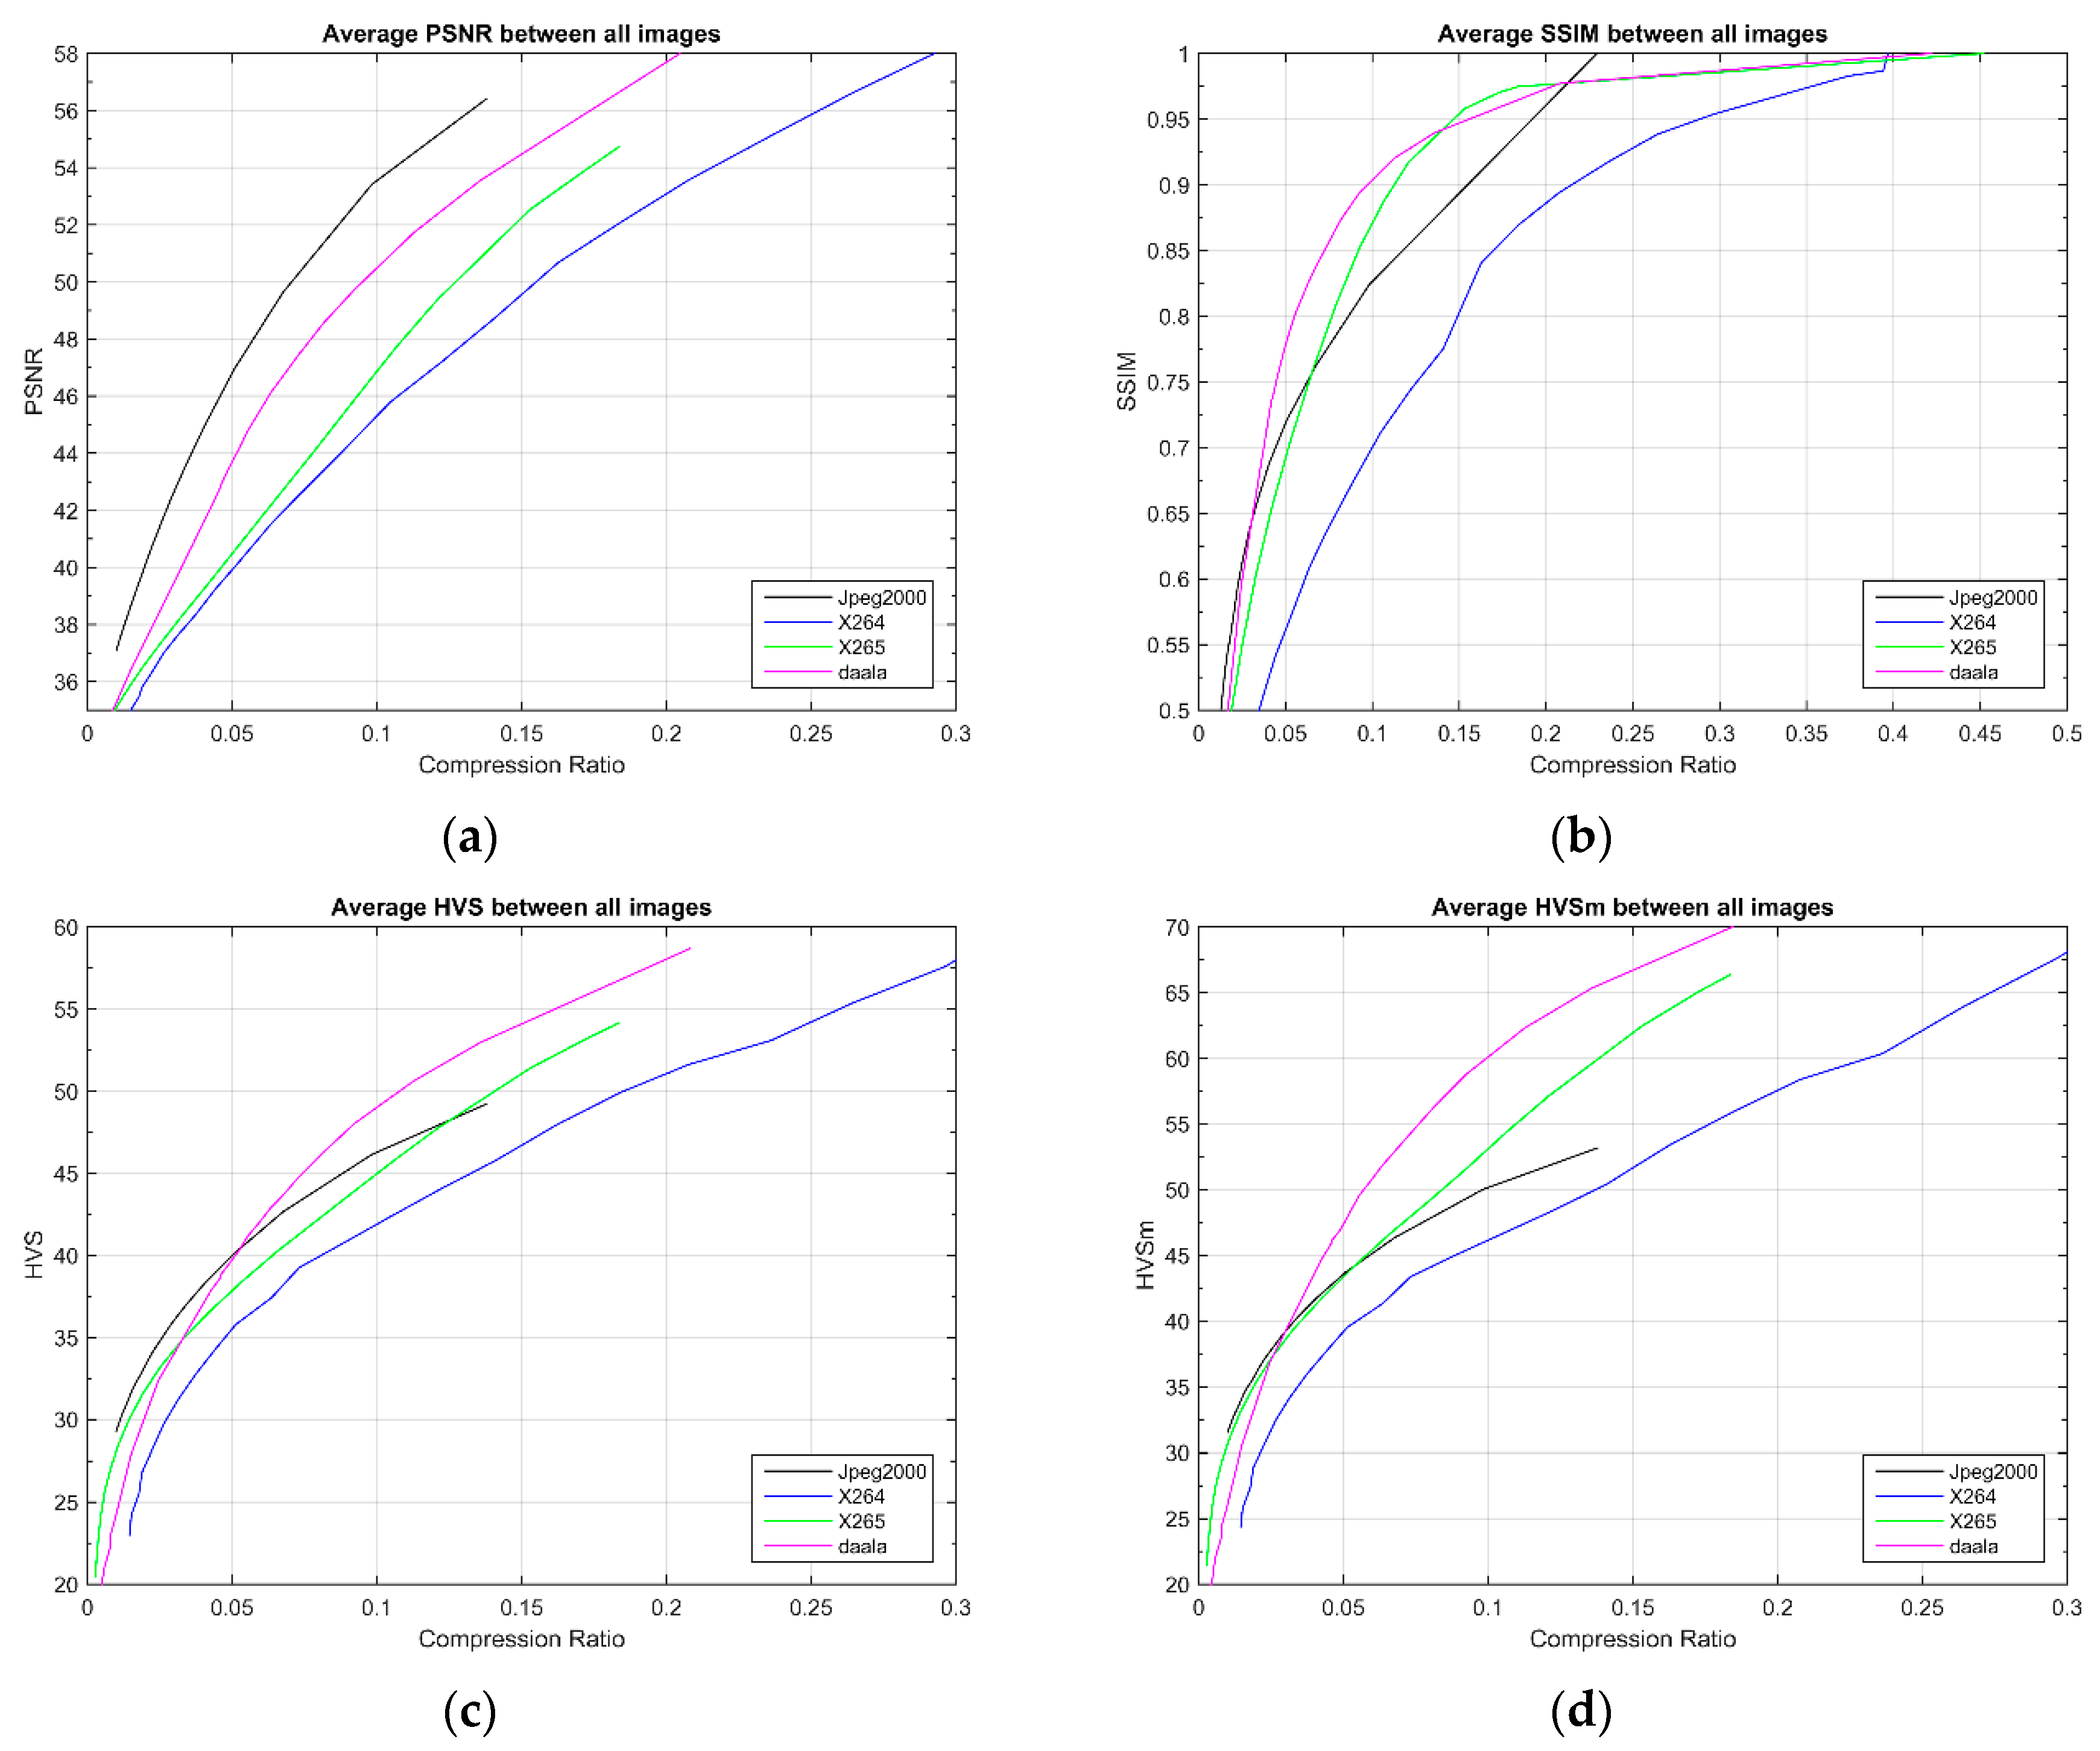
The purpose of this study was to see whether the observations for low resolution images presented in
Section 3.2 were still valid for high resolution images. For this dataset, we also focused on the region around 0.1 compression ratio in
Figure 12. Similar to the results of the lower resolution images, JPEG2000 and Daala were significantly better than the others. JPEG2000 consistently produced a higher PSNR than Daala at 0.1 compression ratio. As explained above, JPEG2000 performs wavelet decomposition on the whole image and hence had better energy compaction. However, Daala tended to have stronger SSIM, HVS, and HVSm because Daala incorporated overlapped blocks that suppressed blocky artifacts. Daala also put more emphasis on perceptual quality by fine-tuning its algorithm. As shown in
Table 3, Daala reached 60 dBs for HVSm at 0.1 compression ratio, which is perceptually lossless. The SSIM of Daala is more than 0.9. The higher resolution images produced slightly higher scores overall as compared to those in
Figure 10.
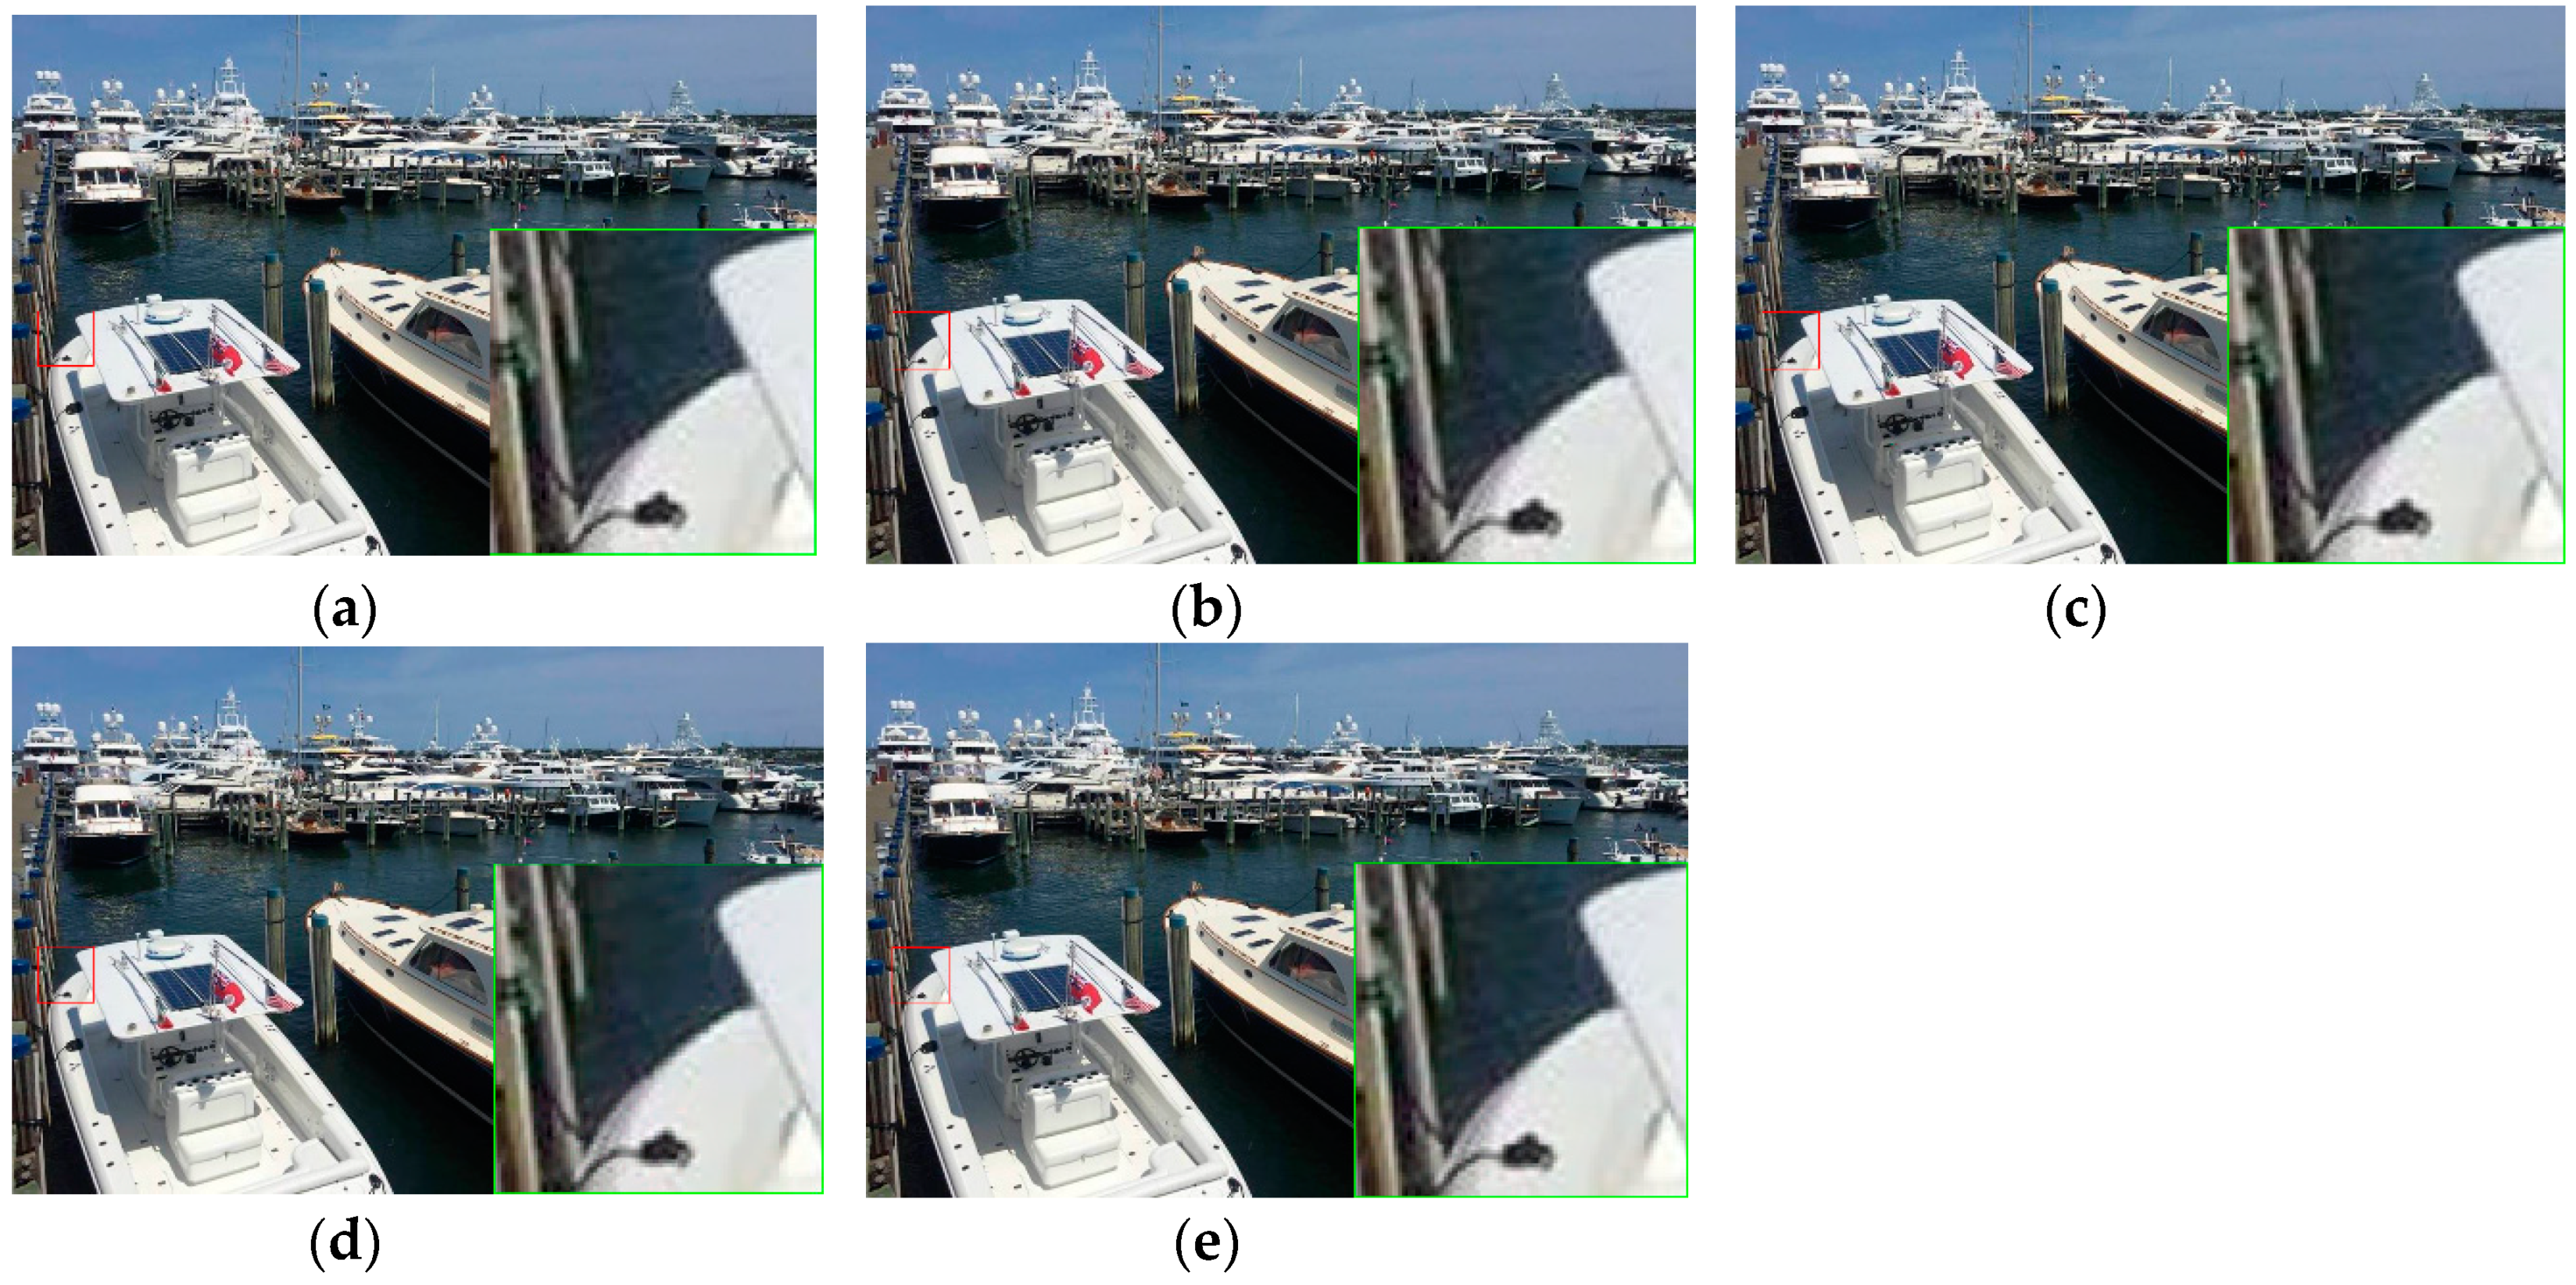
Figure 13 shows the visual comparison results at 10 to 1 compression. It was difficult to spot any differences between the original and the decompressed images.
3.4. High Quality Color Image Compression Results
Here, we present results using the high quality color images in
Section 3.1.4. First, the images presented in
Section 3.1.4 are neither maritime nor sonar images. The purpose of this study was to see whether we could observe similar trends to those presented above. For this dataset, we also focused on the region around 0.1 compression ratio in
Figure 14. JPEG2000 continued to perform well in terms of PSNR and SSIM. However, for HVS and HVSm, Daala and X265 had better performance. In
Table 4, one can clearly see that Daala resulted 48.5 dBs in HVSm. This further corroborated that, at 10 to 1 compression, Daala could achieve near perceptually lossless compression.
Figure 15 compares the various decompressed images at 10 to 1 compression. Again, it was hard to see any perceptual differences between the original and the decompressed images.
3.5. Sonar Image Compression Results
Sonar images are also of interest to our sponsor and hence we included them in our study. Similar to in
Section 3.2,
Section 3.3 and
Section 3.4, we determined which one of the four algorithms was the best in terms of the four performance metrics. Moreover, we attmepted to achieve perpetually lossless compression (>40 dBs) in terms of HVSm at 0.1 compression ratio.
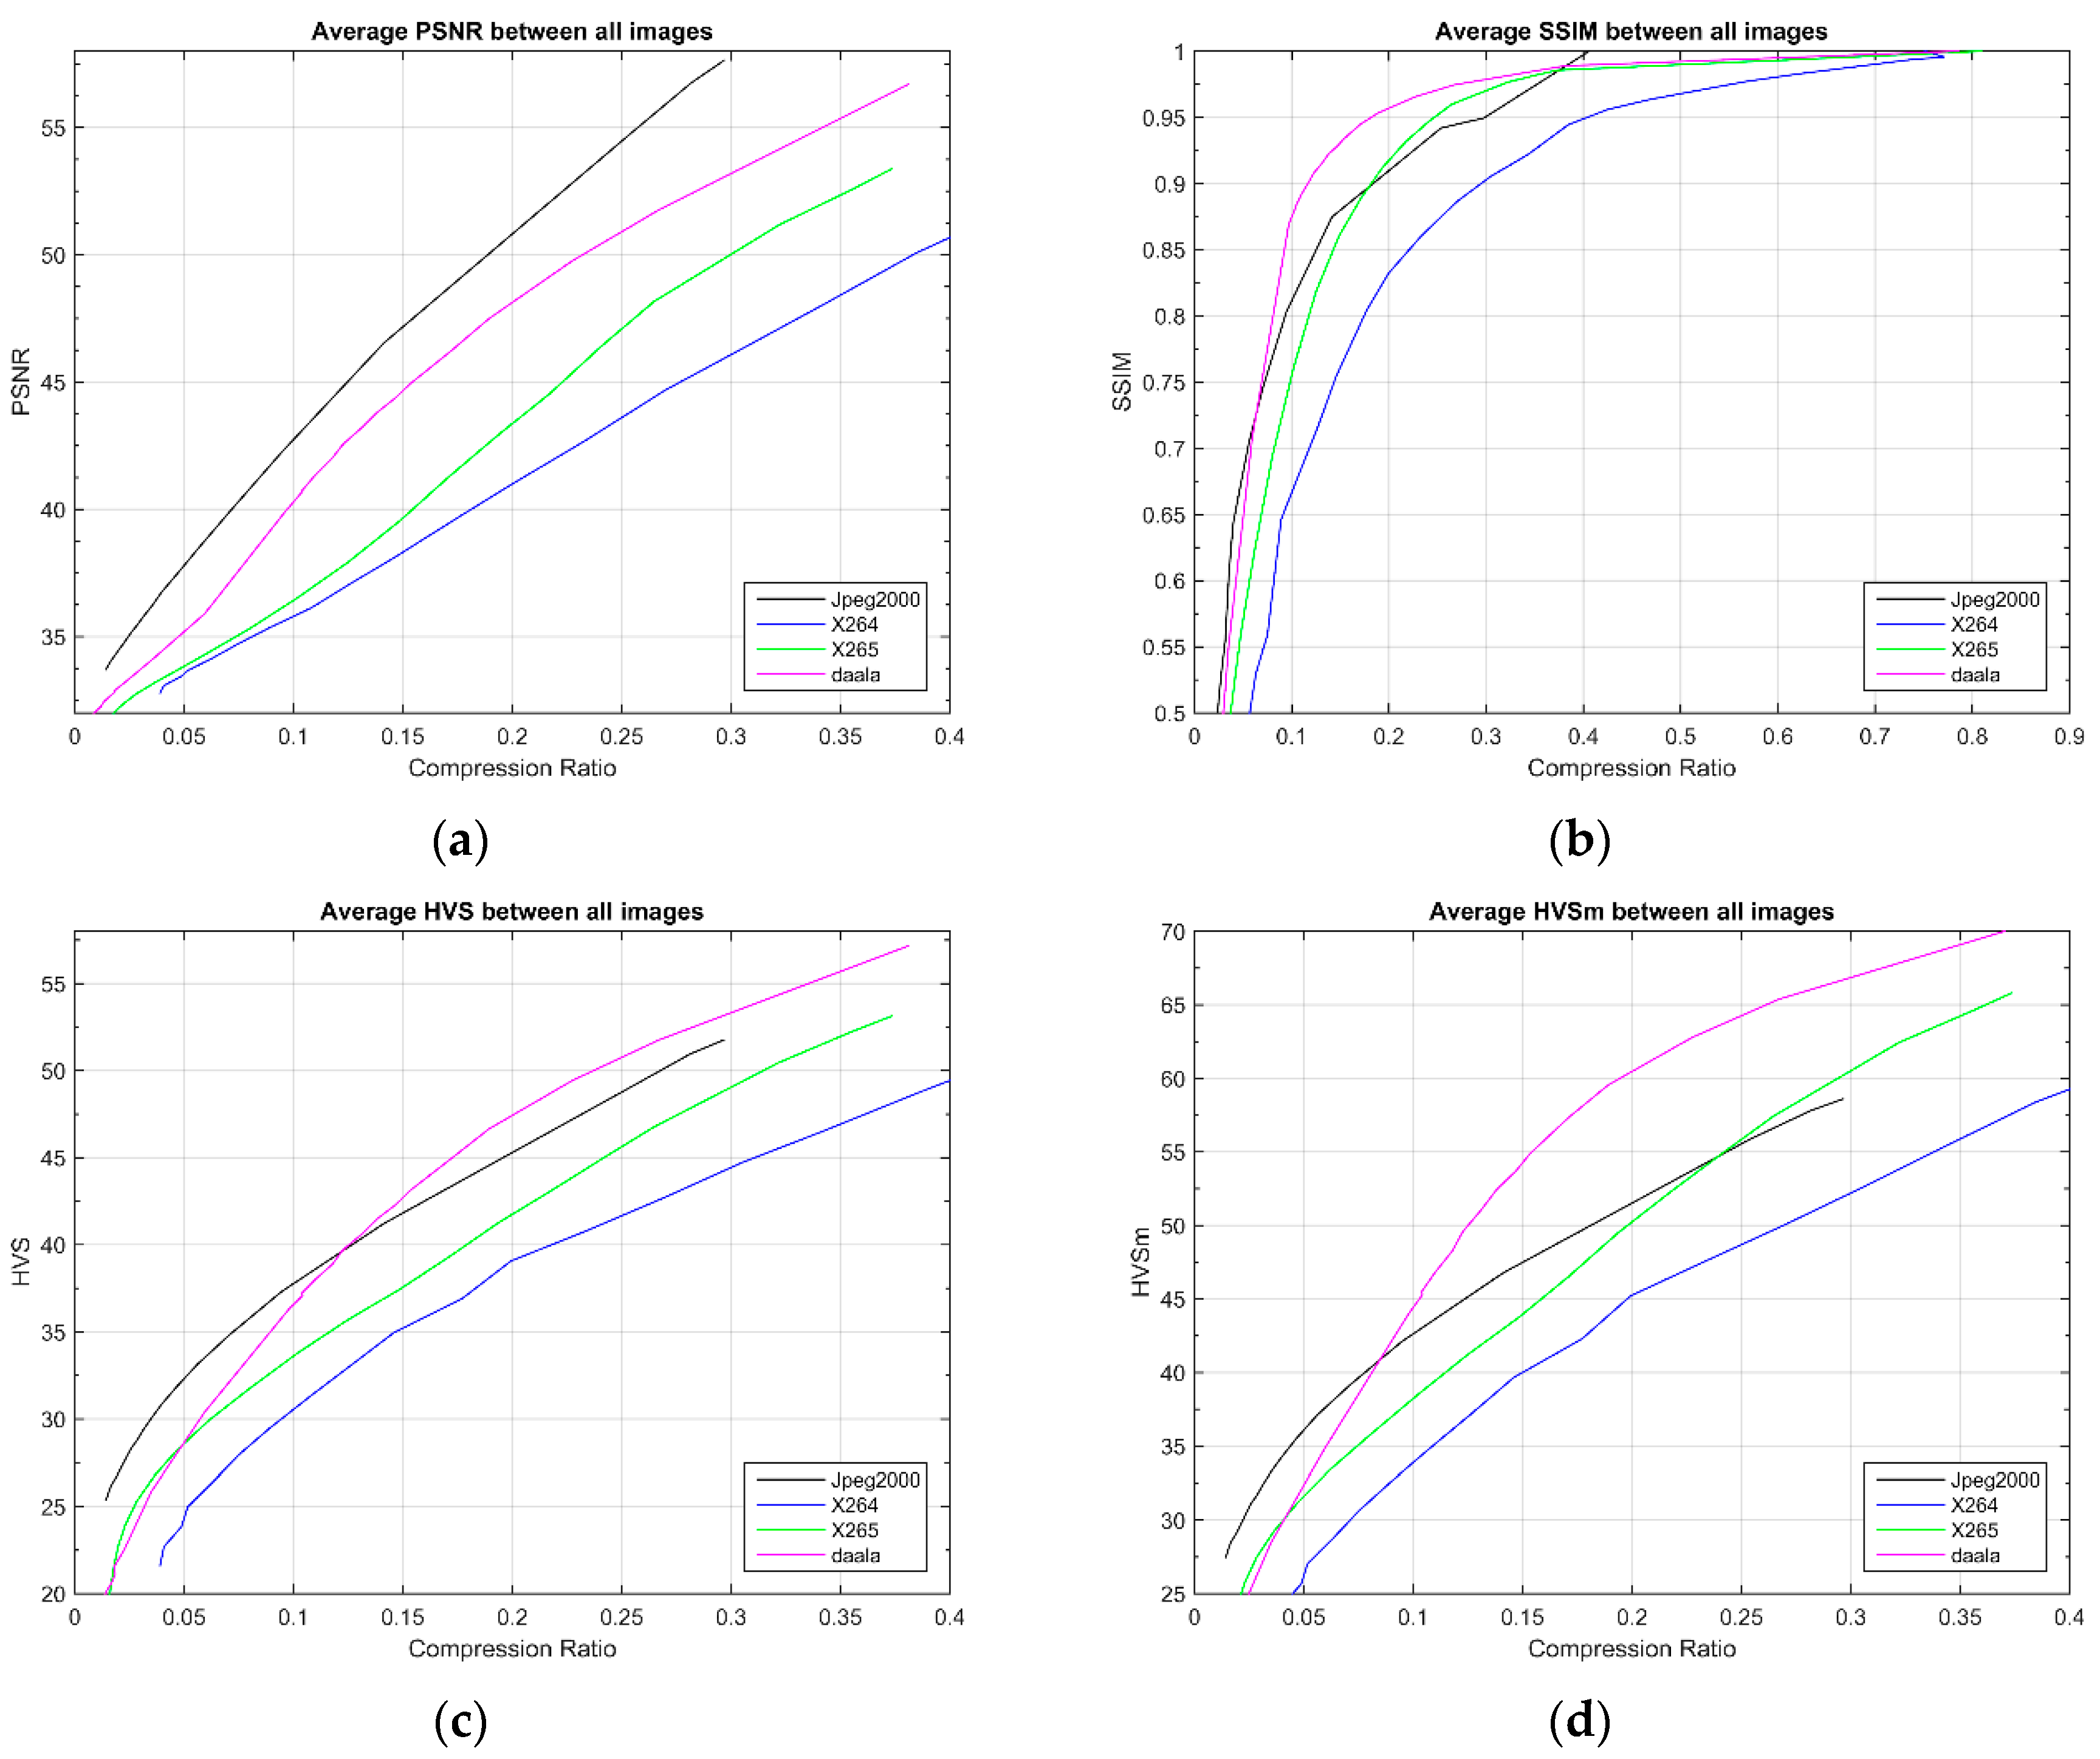
Figure 16 shows the four metrics of different codecs for the sonar images. The results comparing JPEG2000, Daala, X264, and X265 are very similar to the low and high resolution maritime results. JPEG2000 and Daala consistently outperformed X264 and X265, which were nearly identical. JPEG2000 yielded the strongest PSNR across all compression rates because of high energy compaction due to wavelet transform. At compression rates higher than 0.1, Daala produced a stronger SSIM, HVS, and HVSm because of strong emphasis in perceptual quality by the developers of Daala. As shown in
Table 5, Daala and JPEG2000 had more than 40 dBs in HVSm. This means that near or even perceptually lossless compression could be achieved.
Figure 17 shows the comparison between original and decompressed sonar images. One can hardly see any differences because the HVSm scores were high.
3.6. Error Concealment for Maritime Images
As mentioned above, communication channels in maritime environments have strong and random interferences, especially in wireless channels, which create packet errors. Even with good error correction coding, it is unavoidable to have some missing packets. We recommend that the missing data should be recovered by advanced error concealment algorithms, which do not add any overhead to the network bandwidth.
In this research, we evaluated two error concealment algorithms: our own algorithm [
28] and a commercial product called Transformic [
43]. We randomly introduced corrupted blocks of sizes 16 × 16, 8 × 8, 4 × 4, and 2 × 2 in color images and then applied the concealment algorithms to recover the missing data. Our objective was to see if we could conceal the errors introduced in the communication channel.
3.6.1. Error Recovery in Maritime Images
We used two images to illustrate the performance of error recovery. Mean square error (MSE) was used as the objective metric to compare the two algorithms. In addition, we visually inspected the recovered images and performed subjective evaluation.
Maritime Image 1
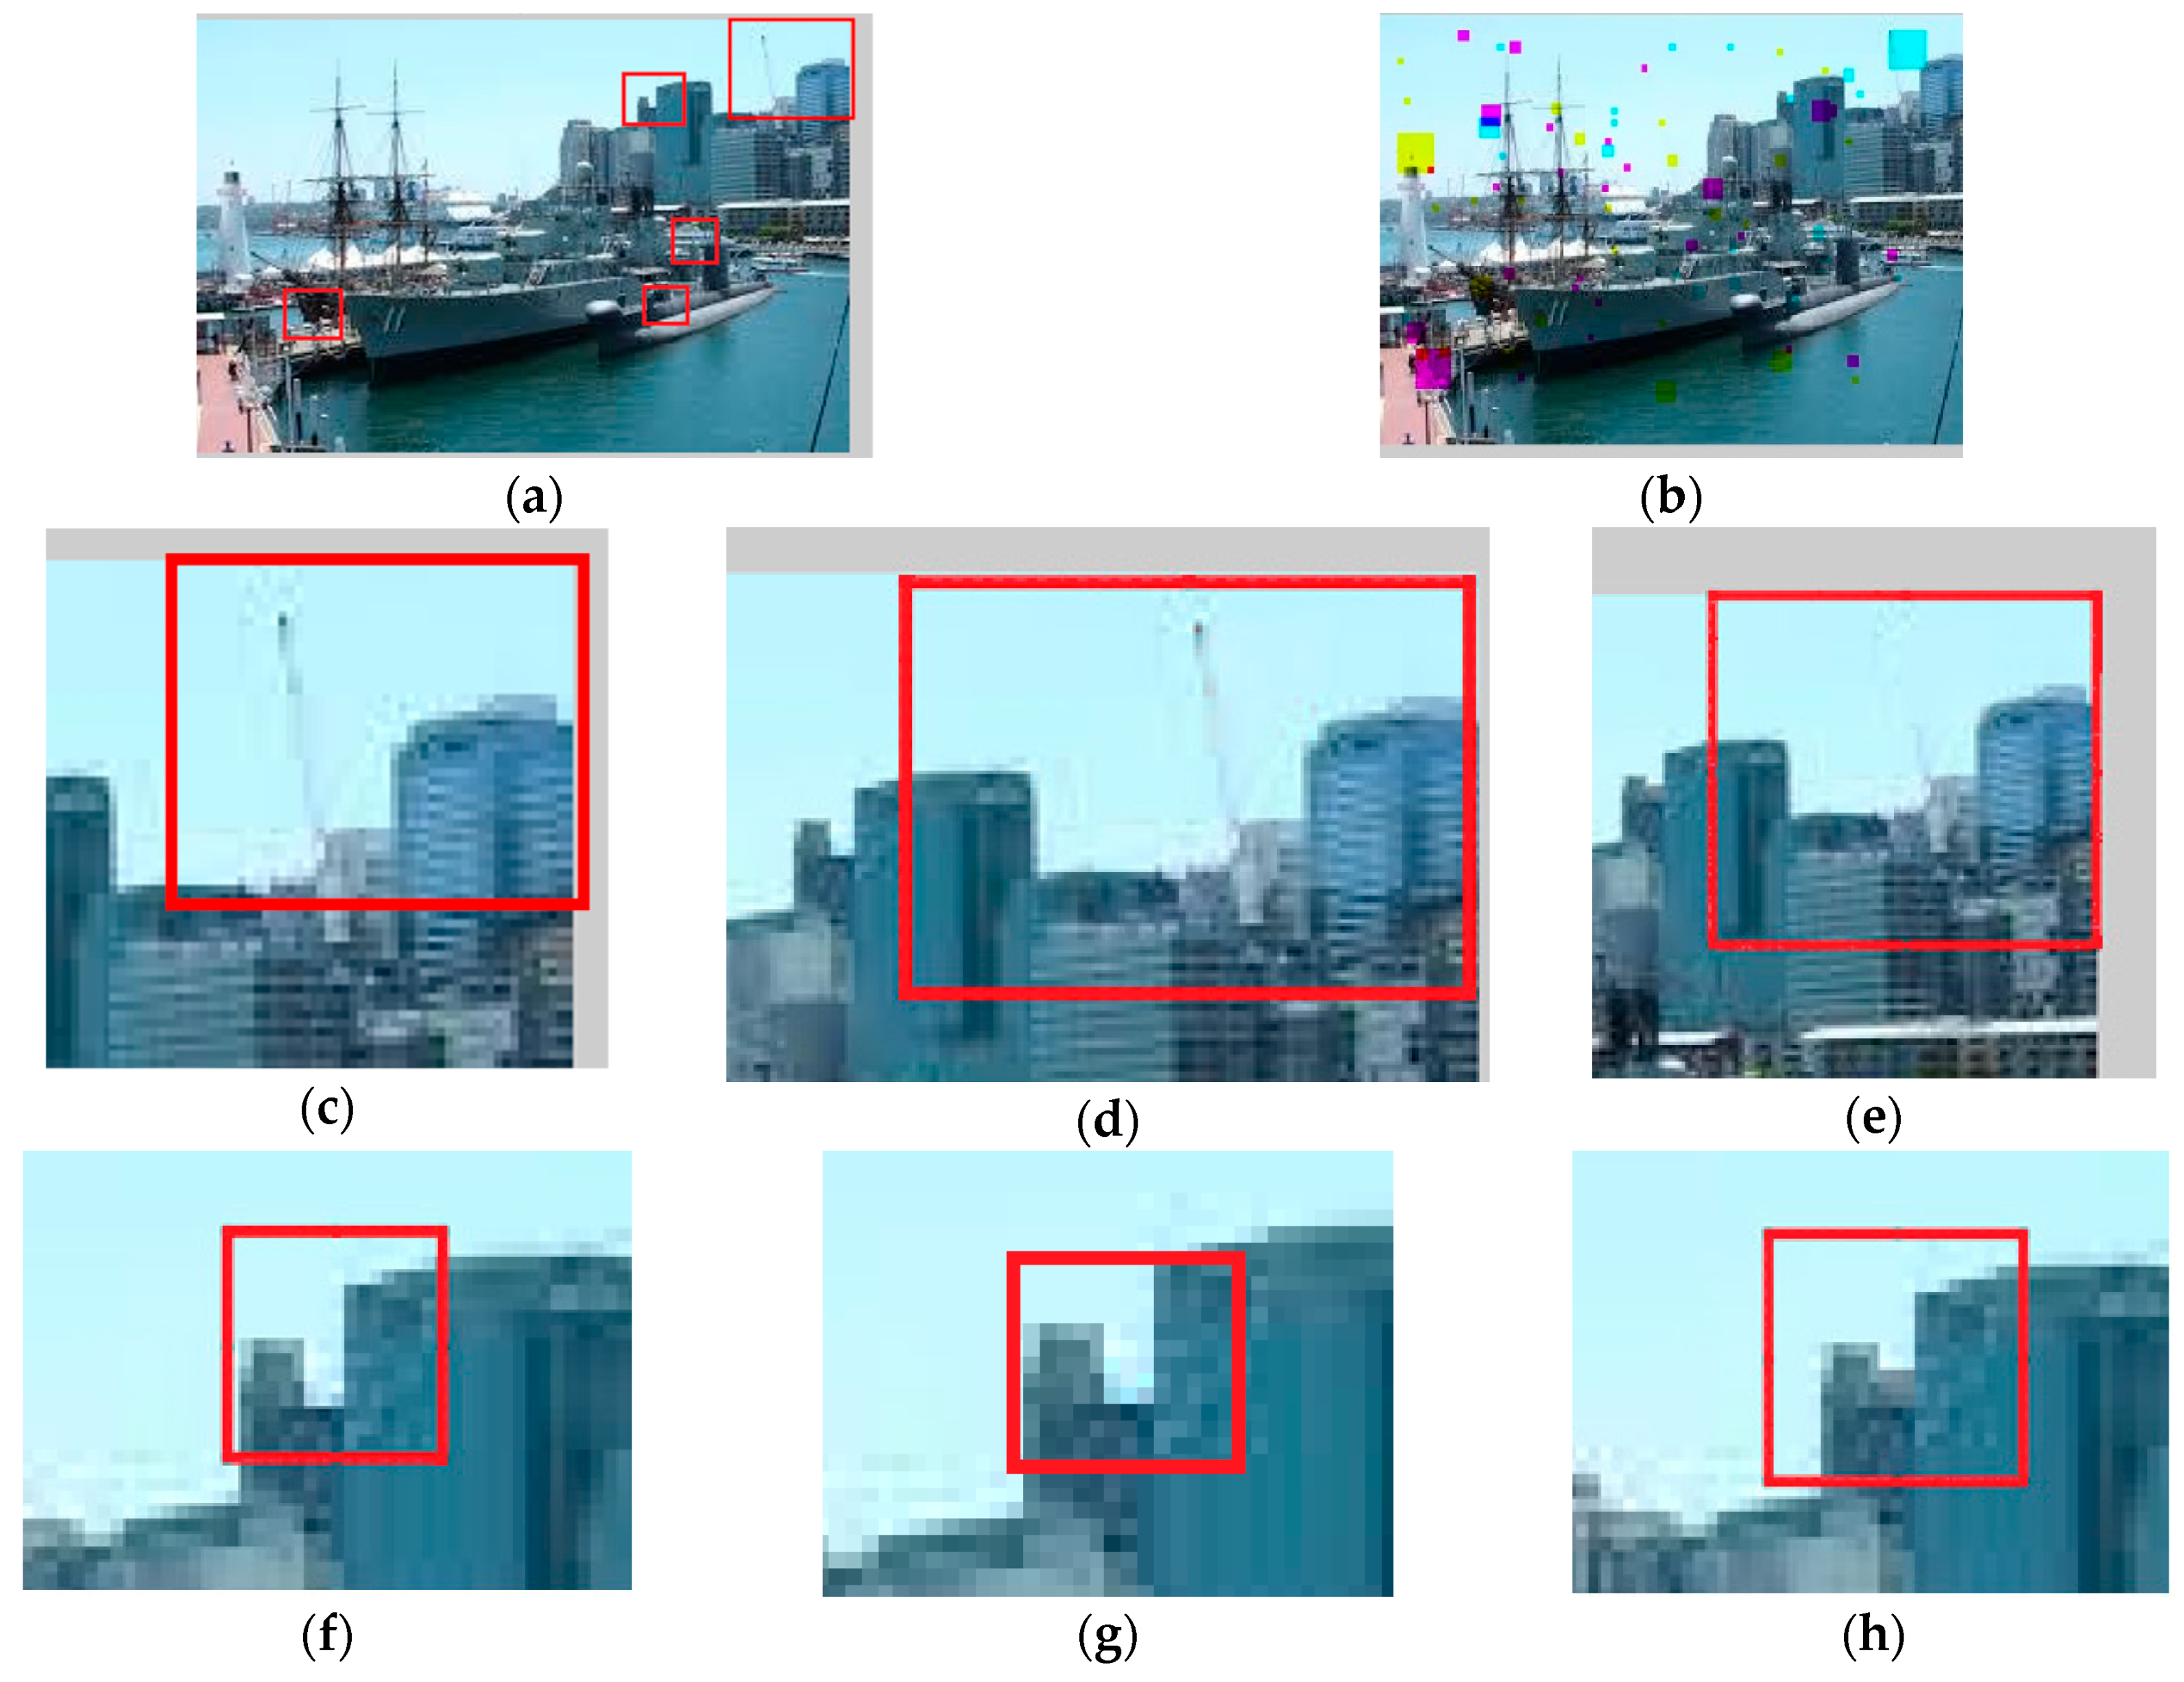
Figure 18a shows the original image where a few red blocks indicate some areas of interest.
Figure 18b shows the locations of some corrupted blocks. We then applied two algorithms to repair those corrupted blocks. We used RMSE to compare the reconstruction performance using two algorithms. For this image, the RMSE using our method was 6.69 and the RMSE for Transformic was 7.18. When visually inspecting the recovered pixels, one could see that the differences between our method and Transformic was huge. Comparing
Figure 18c–e, it can be seen that Transformic failed to recover the crane, whereas our method could successfully recover the crane. In addition, by inspecting
Figure 18f–h, one can see that Transformic could not recover the missing block near the building, whereas our method could reconstruct the missing block. This clearly shows that our method could effectively conceal the corrupted blocks.
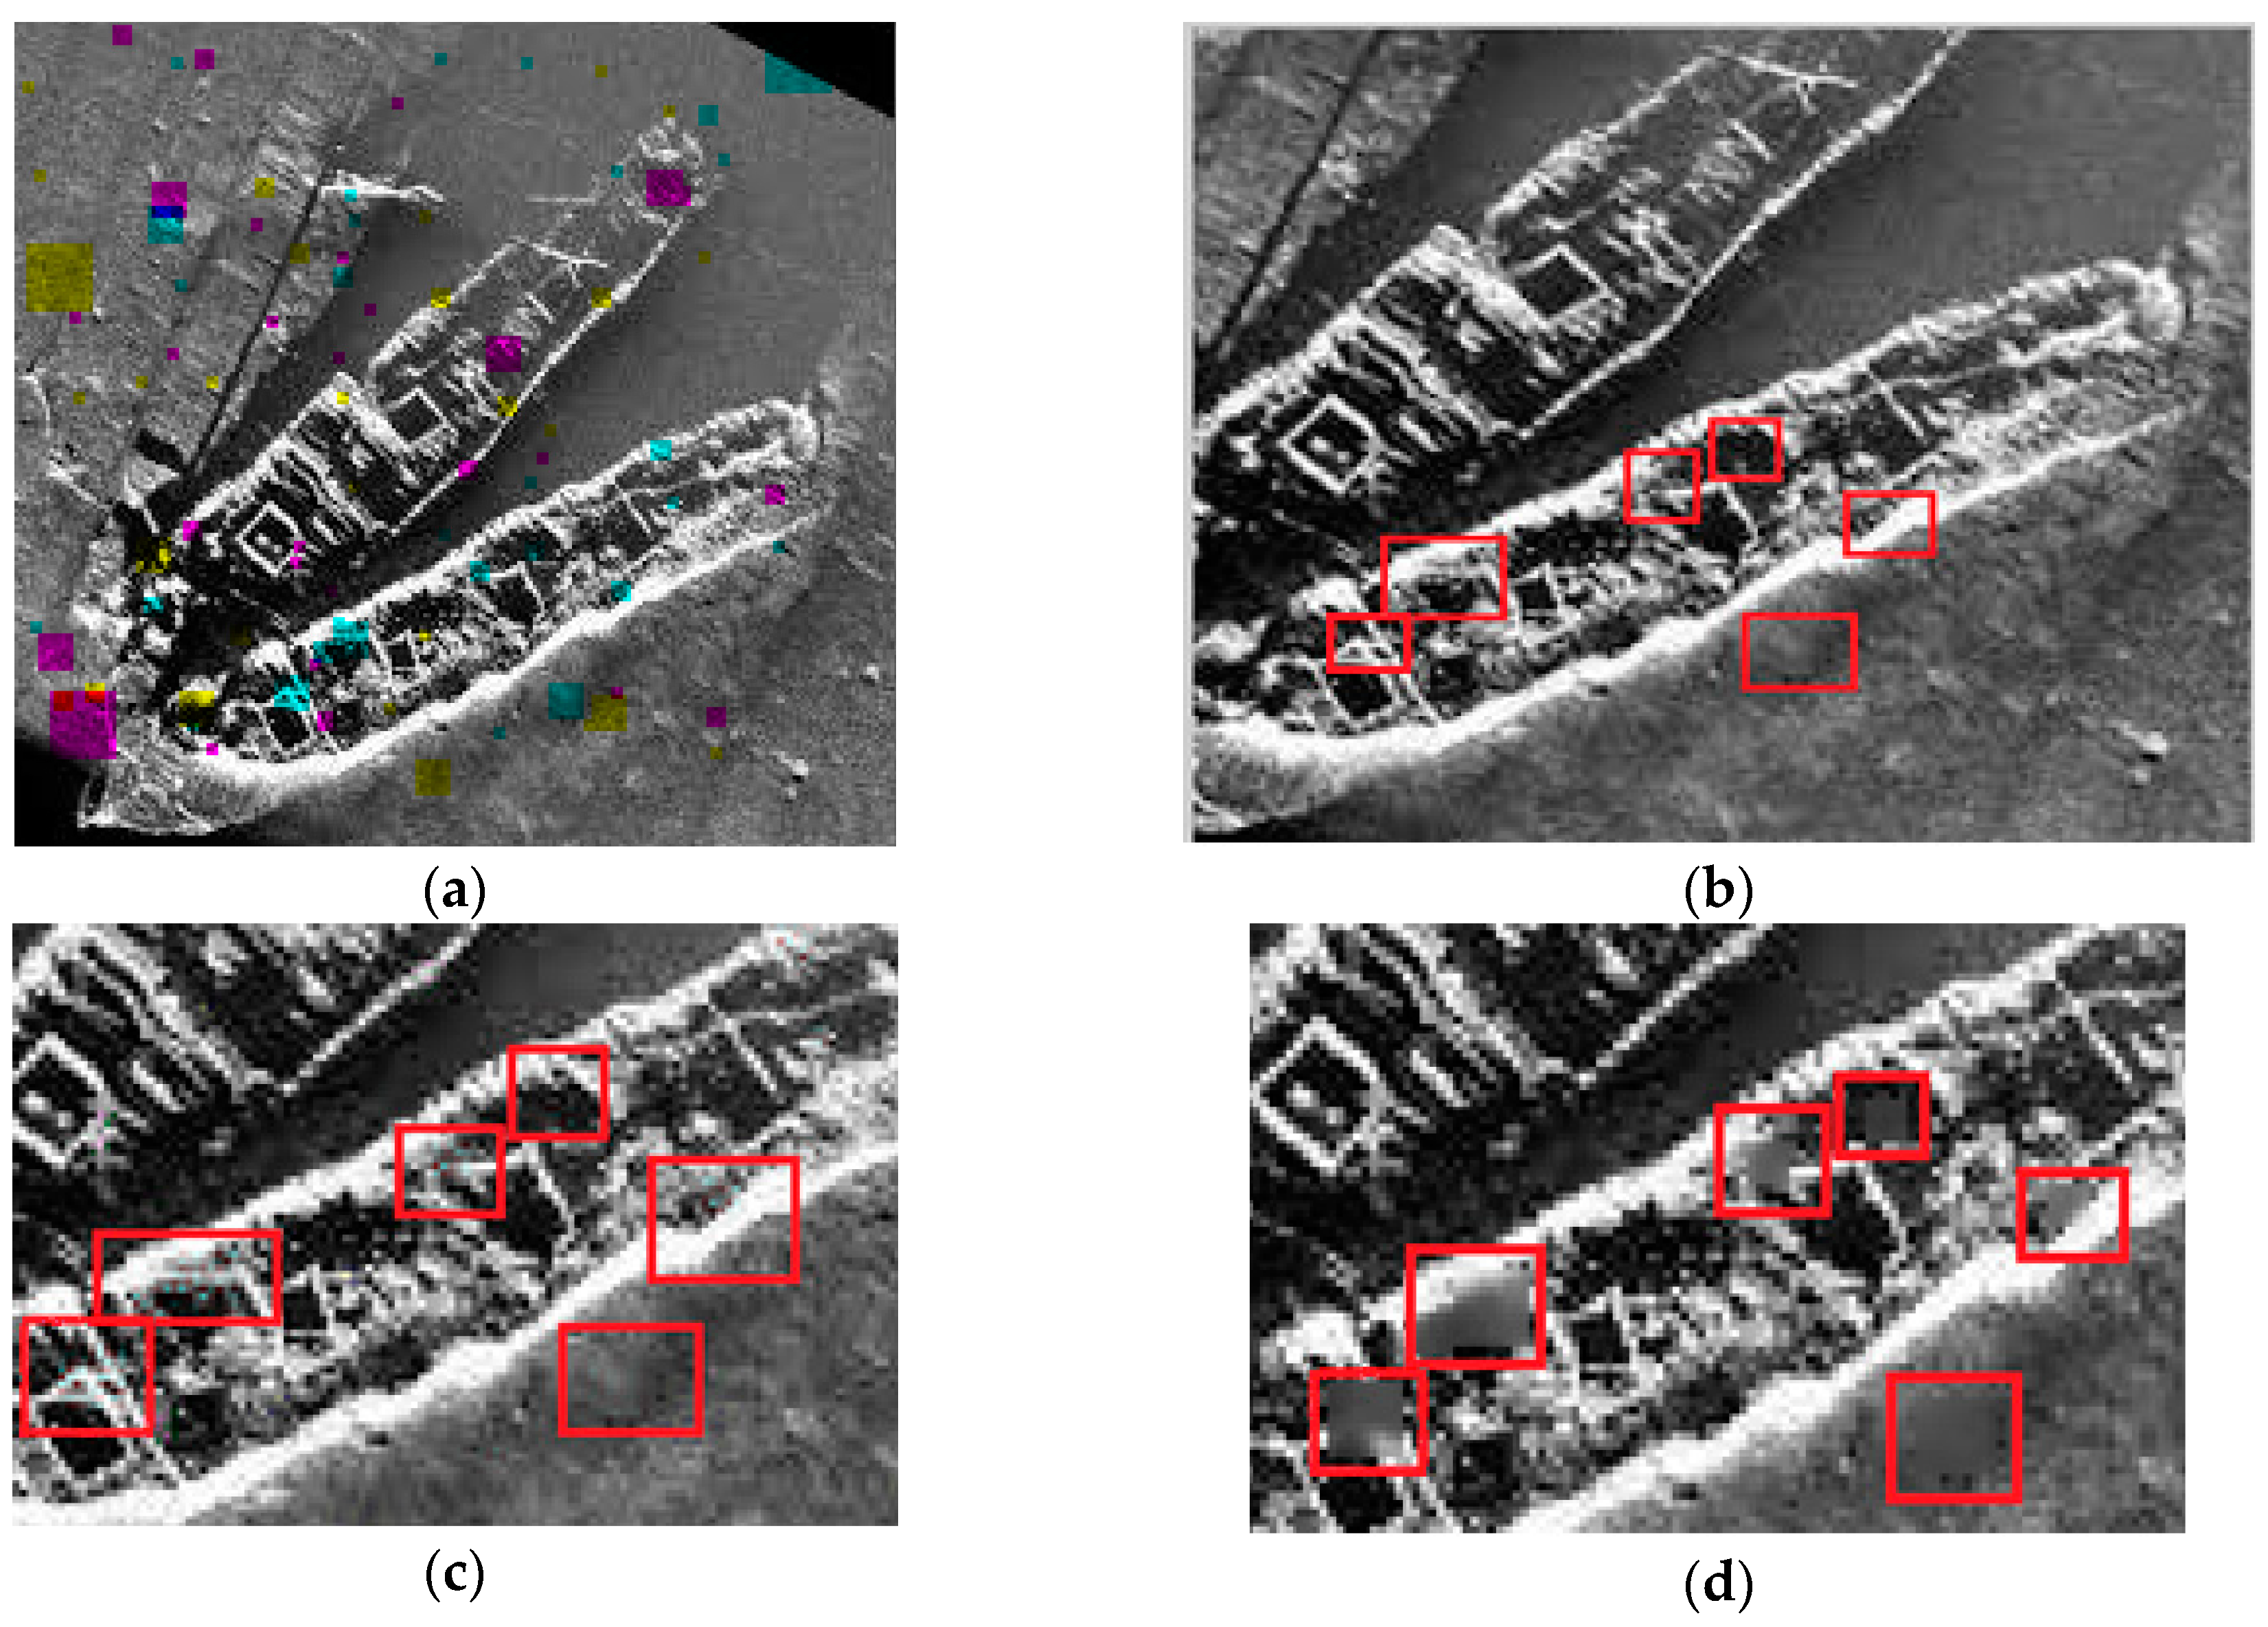
Maritime Image 2
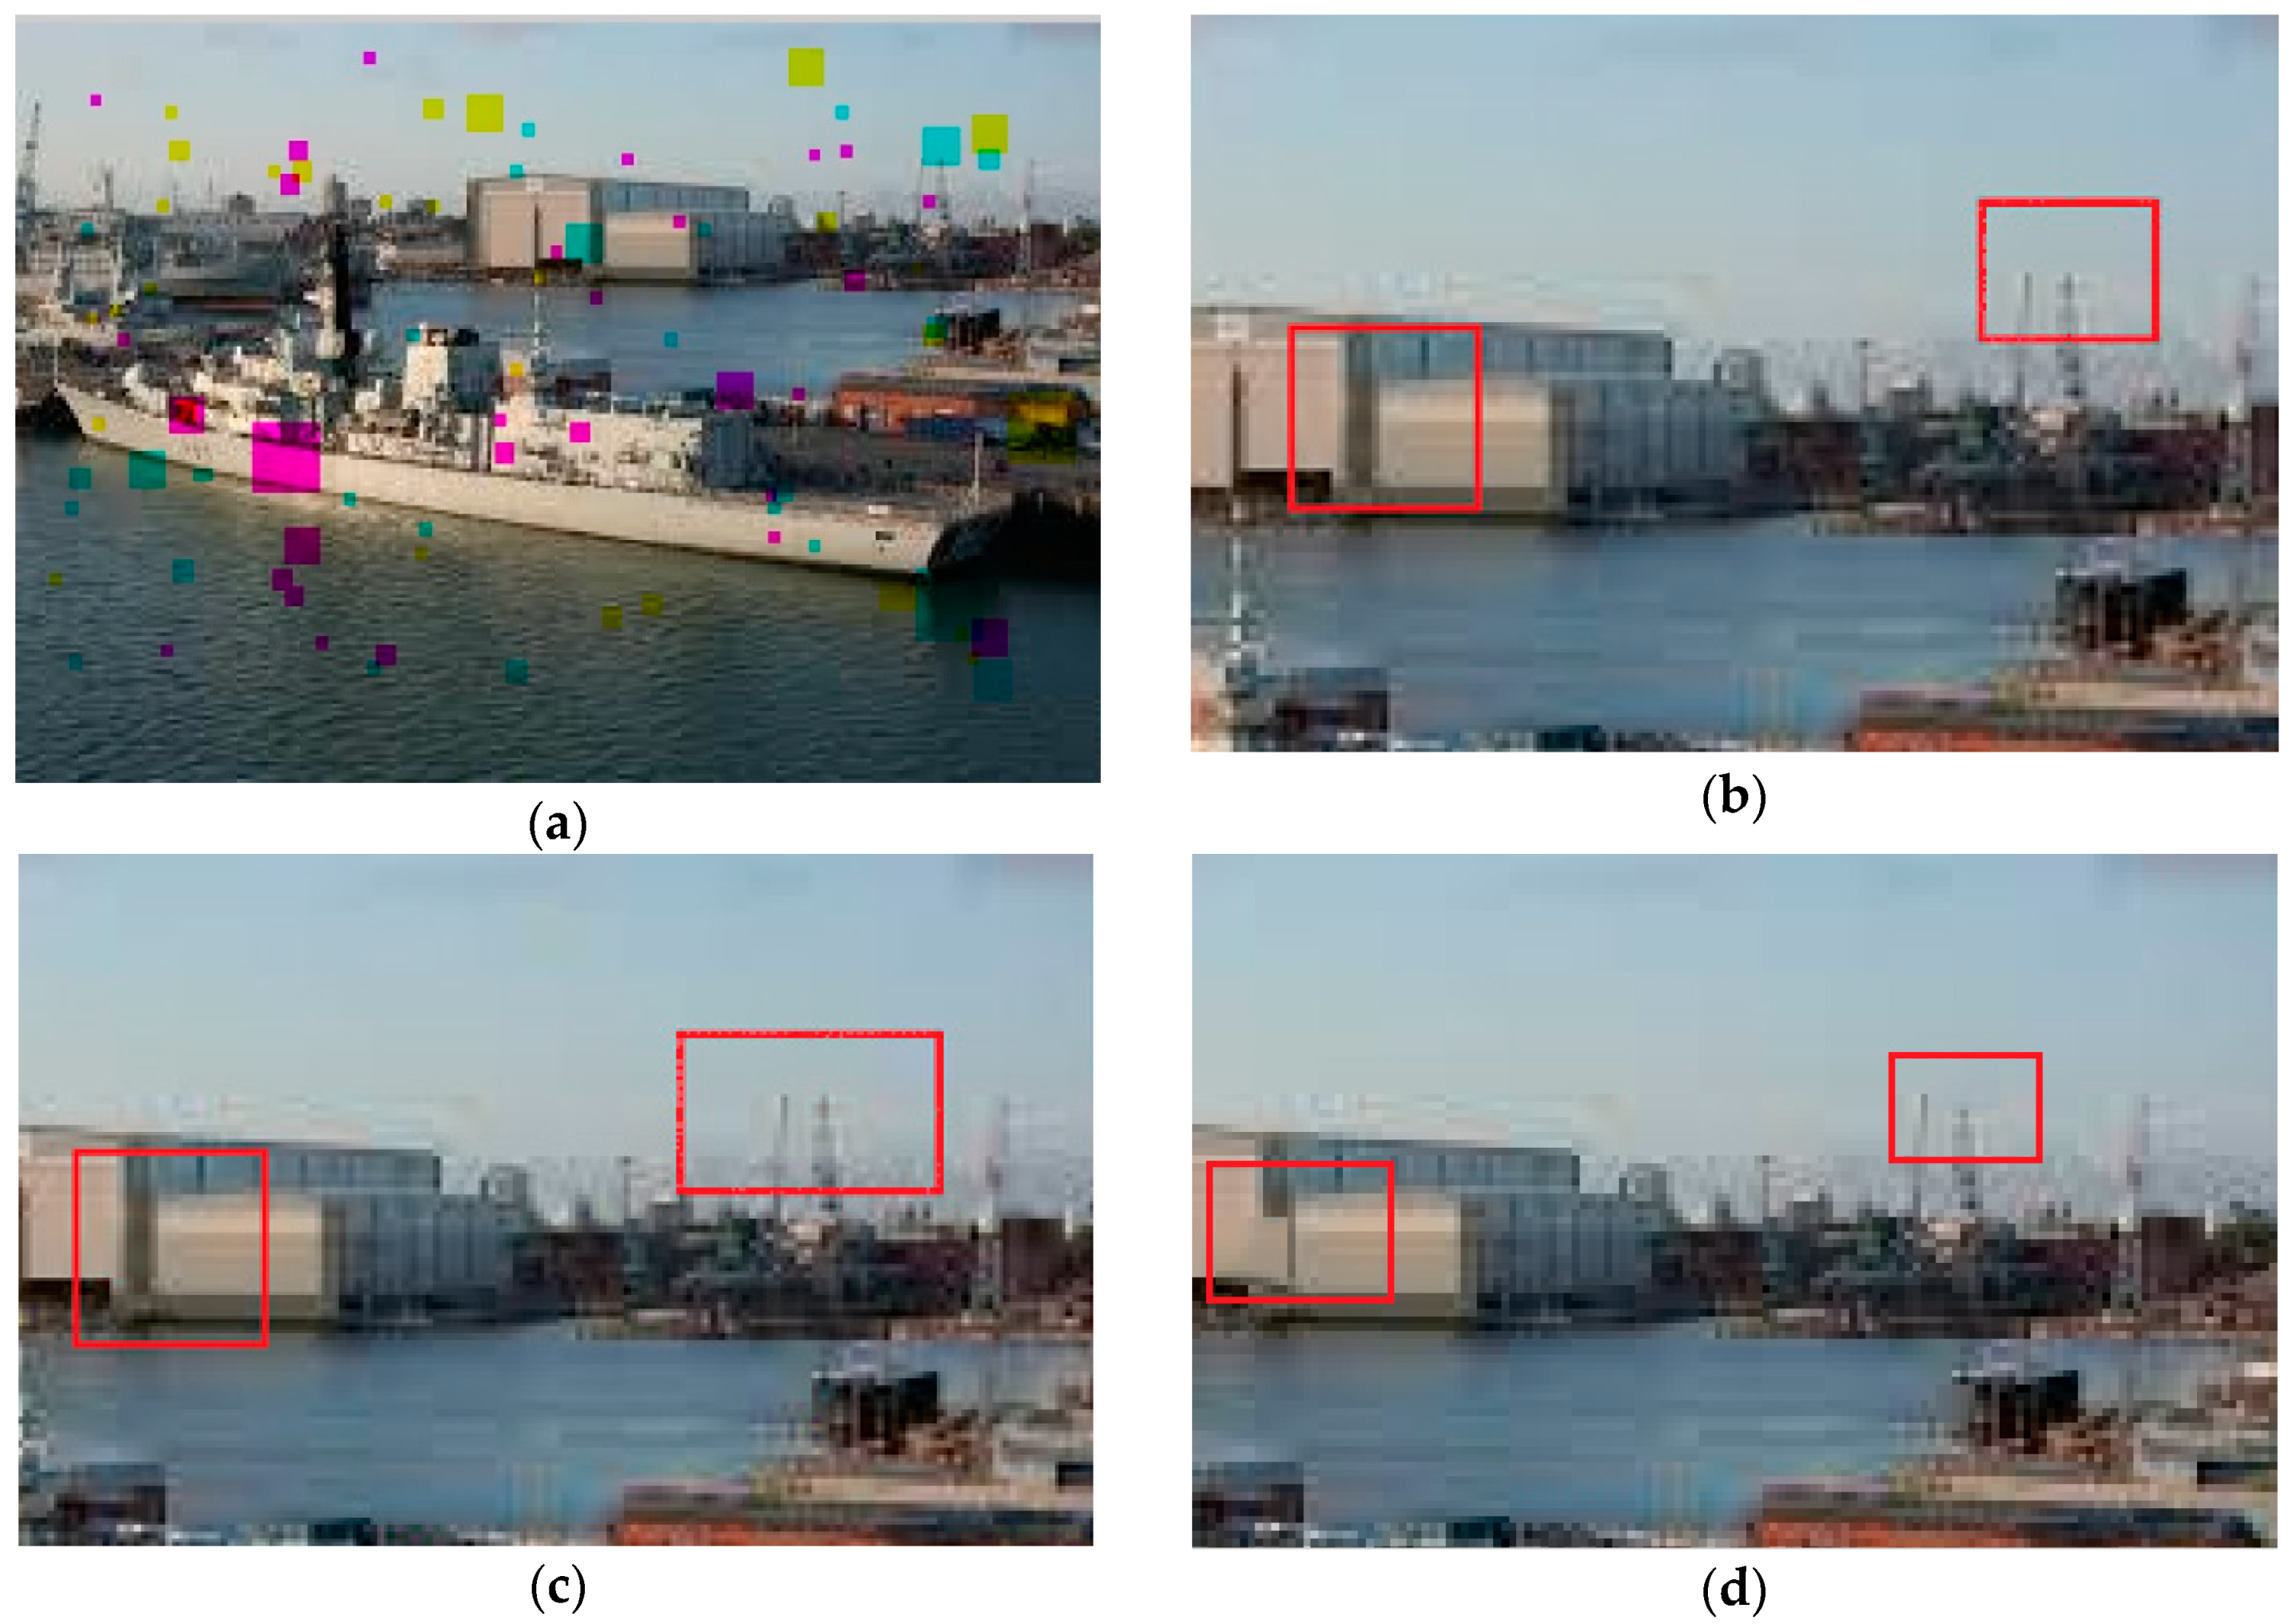
Figure 19a shows a number of corrupted blocks in an image.
Figure 19b shows the zoomed in areas of two locations.
Figure 19c,d presents the reconstructed images using our method and the Transformic method, respectively. For this image, the RMSE using our matrix completion method was 5.4 and the RMSE for Transformic wais 5.55. Although the difference between the MSEs was small, the perceptual appearance of our method was much better (see
Figure 19c,d). In particular, the gap between the two buildings was reconstructed correctly by our method. This example further highlights the importance of error concealment because, even if one uses error correction coding, there may still be corrupted packets during image transmission.
3.6.2. Error Recovery in Sonar Images
Similar to the study presented in
Section 3.6.1, we applied two error concealment methods to repair damaged blocks in the decompressed images.
Sonar Image 1
Figure 20a illustrates the locations of the damaged blocks.
Figure 20b shows the zoomed in areas of some regions of interest. Two methods were applied to repair the damaged blocks.
Figure 20c,d shows the reconstructed images. For this image, our method achieved a RMSE of 22.68, whereas the RMSE for Transformic was 71.32. The difference was tremendous. By visually inspecting
Figure 20c,d, one can see that our results are clear and have more textures as compared to the results of Transformic.
Sonar Image 2
To further demonstrate the error concealment for sonar images, we include another example.
Figure 21a shows the locations of regions of interest with corrupted blocks.
Figure 21b,c shows the reconstructed image using the two methods. For this image, the RMSE of our method was 21.87 and the RMSE for Transformic was 65.55. Again, the difference between RMSEs was huge. By visually inspecting the reconstructed results in
Figure 21c,d, one can see that our results look much better than that of Transformic.
3.7. Discussions
As mentioned above, our sponsor is interested in achieving 10 to 1 compression or a compression ratio of 0.1 using new or existing compression algorithms and, at the same time, the decompressed image should be near perceptually lossless (40 dBs or more in terms of HVSm). These were the first and second goals. To meet these goals, we collected low and high resolution images (maritime images) and sonar images. The reason for using low and high quality images was because there are cameras with different resolutions onboard the naval ships. It was therefore required that the compression algorithm should work satisfactorily for all images, including sonar images as well. We chose four metrics, two of which (PSNR and SSIM) have been widely used by many people before, but they do not correlate well with human perceptions. The two other metrics, HVS and HVSm, have better correlation with human perceptions. From those metrics for low and high quality optical images and sonar images, we observed that Daala had consistently reached more than 40 dBs at 10 to 1 compression in HVSm in all images that we tested. Other codecs such as X265 and JPEG2000 could also marginally meet the above requirements. It is up to our sponsor to make the final decision on which codec to adopt. Our third objective was to demonstrate the performance of error concealment, which does not incur any additional bandwidth usage. Our experiments showed that error concealment could indeed recover image pixels in those corrupted areas.
4. Conclusions
We would like to emphasize that our work was different from those papers on perceptually lossless coding [
15,
16,
17,
18], which embed HVS model into the coding process. One key objective in our research was to achieve near or even perceptually lossless compression with 0.1 compression ratio for still images (maritime and sonar). The requirement was raised by our customer. We evaluated four popular algorithms (JPEG2000, Daala, X264, X265) using four performance metrics (PSNR, SSIM, HVS, and HVSm). In our compression experiments, JPEG2000 performed the best in terms of PSNR at 0.1 compression ratio. However, for all the other metrics, Daala achieved the best scores. It was surprising to find that X264 and X265 did not perform as well as Daala. Perhaps because those codecs are video codecs and were not optimally designed for still images. For 0.1 compression ratio, we found that near perceptually lossless compression could be achieved for still images, as the performance metrics were very high ( >40 dBs for PSNR, HVS, and HVSm). In addition, we think Daala is a good choice for practical applications because it is amenable to parallel processing. Our observations can be corroborated by another independent study performed by the Xiph team [
44].
We also investigated error concealment algorithms for handling corrupted pixels due to transmission errors. Extensive experiments demonstrated that error concealment is a feasible method to conceal corrupted pixels without incurring additional bandwidth usage.


