Article

DCGAN Feature-Enhancement-Based YOLOv8n Model in Small-Sample Target Detection

Graduate School, National University of Defense Technology, Wuhan 430013, China
*
Author to whom correspondence should be addressed.
Computers 2025, 14(9), 389; https://doi.org/10.3390/computers14090389
Submission received: 24 June 2025 / Revised: 8 September 2025 / Accepted: 10 September 2025 / Published: 15 September 2025
(This article belongs to the Special Issue Machine Learning Applications in Pattern Recognition)

Abstract

This paper proposes DCGAN-YOLOv8n, an integrated framework that significantly advances small-sample target detection by synergizing generative adversarial feature enhancement with multi-scale representation learning. The model’s core contribution lies in its novel adversarial feature enhancement module (AFEM), which leverages conditional generative adversarial networks to reconstruct discriminative multi-scale features while effectively mitigating mode collapse. Furthermore, the architecture incorporates a deformable multi-scale feature pyramid that dynamically fuses generated high-resolution features with hierarchical semantic representations through an attention mechanism. The proposed triple marginal constraint optimization jointly enhances intra-class compactness and inter-class separation, thereby structuring a highly discriminative feature space. Extensive experiments on the NWPU VHR-10 dataset demonstrate state-of-the-art performance, with the model achieving an mAP50 of 90.46% and an mAP50-95 of 57.06%, representing significant improvements of 4.52% and 4.08% over the baseline YOLOv8n, respectively. These results validate the framework’s effectiveness in addressing critical challenges of feature representation scarcity and cross-scale adaptation in data-limited scenarios.

1. Introduction

Small-sample target detection refers to the task of accurately localizing and recognizing objects of novel classes with limited annotated samples, typically ranging from a few to dozens of instances per class. It commonly leverages techniques such as transfer learning, meta-learning, attention mechanisms, data augmentation, and uncertainty-aware fusion to enhance generalization and robustness in low-data regimes [1,2,3].
As a cutting-edge topic in computer vision, small-sample target detection aims to achieve accurate localization and recognition of new classes of targets through a limited number of labelled samples. The current mainstream methods mainly revolve around meta-learning frameworks and transfer learning paradigms: models such as Meta-YOLO achieve knowledge transfer by constructing a dual-path feature interaction mechanism of support set and query set, and CME methods optimize the spatial distribution of features through the strategy of interclass marginal equilibrium. However, existing methods still face three core bottlenecks: (1) limited feature representation capability, where traditional convolutional networks suffer from vanishing gradients when capturing deep semantic information, resulting in the loss of fine-grained features; (2) exacerbation of data distribution bias, where the limited number of real samples under small-sample conditions fails to cover the target’s appearance variability and scene complexity; (3) and insufficient cross-scale adaptation, where the existing feature pyramid network has limited ability to characterize multiscale targets. The characterization ability of existing feature pyramid networks for multi-scale targets is limited by the fixed sensory field design. Cross-domain adaptation is insufficient, and the generalization ability of existing methods is limited in specialized domains such as medical imaging. Future research may focus on lightweight network design, innovation of self-supervised pre-training paradigm, and zero-sample detection techniques combined with language models to further improve the robustness of detection in small-sample scenarios. To better understand the recent advancements and limitations in this field, we now review the state-of-the-art methods in small-sample object detection.

State-of-the-Art

Aiming at the small-sample target detection problem, Yaoyang Du et al. [1], in research for the small-sample target detection task, used Faster R-CNN as the basic detection framework combined with a CLIP text encoder to build a multimodal knowledge migration model. The main innovations include (1) proposing a Text Prompt Description Generator (TPDG), which automatically generates fine-grained category semantics descriptions based on the context-learning capability of Large Language Models (LLMs), effectively alleviating the problem of sparse semantic information in small-sample scenarios; and (2) designing an image–text matching module that achieves cross-modal feature space alignment through a learnable adaptor and combining this with residual connectivity to preserve pre-training knowledge to improve the feature generalization ability. Experiments show that on the PASCAL VOC dataset, this method outperformed the baseline DeFRCN in all 15 cases under 1-shot settings in Novel Set 1, exceeding FM-FSOD by 13.3% in AP50, while on the MS COCO dataset, it achieved nAP50 scores of 34.6 and 40.2 at 10-shot and 30-shot, respectively. Existing problems include the following: the quality of TPDG generation relies on the zero-sample inference capability of LLMs, which may introduce semantic bias; the multimodal alignment module increases the model complexity and affects the inference efficiency; and the cross-modal feature decoupling mechanism for extreme few-shot samples (e.g., 1-shot) still needs to be further optimized. Bingxin Wang et al. [2] proposed an Orthogonal Progressive Network (OPN) for small-sample target detection, which is based on the Faster R-CNN framework. It constructs the location space and category space through feature remapping and introduces task orthogonality constraints (decoupling the regression and classification tasks through the cosine similarity matrix) and category orthogonality constraints (using memory queues to store historical features to enhance inter-class distinction). An innovative asymptotic fine-tuning strategy is designed to achieve lagged optimization and mitigate catastrophic forgetting and overfitting by fusing current samples with historical features. Experiments show that OPN achieves SOTA performance with an average AP50 of 54.2% and 22.0% on the PASCAL VOC and MS COCO benchmarks, respectively. However, the method still suffers from high complexity of memory queue management, insufficient feature stability under extreme few-shot conditions (e.g., one-shot), and insufficient exploration of generalization ability in cross-domain scenarios, which require further optimization in the future for computational efficiency and cross-task adaptability. Tianxu Wu et al. [3] proposed a small-sample target detection model based on Adversarial Feature Training (AFT) using the Faster R-CNN framework and innovatively designed the Classification Level Fast Gradient Symbol Method (CL-FGSM). The method mitigates the confusion between the base class and the new class by generating adversarial samples at the feature level and combining clean features to optimize the classification decision boundary. Experiments show that on the PASCAL VOC and COCO datasets, AFT improves the mean average precision (mAP) by 1.5–3.2% in 1–30-shot scenarios and significantly outperforms the comparison methods, especially in 1-, 2-, and 5-shot settings. Its innovation lies in introducing feature-level adversarial training into FSOD for the first time, which enhances inter-class differentiation through gradient perturbation. However, the sensitivity of the method to high-dimensional feature perturbations still needs to be optimized, and the adversarial training may increase computational complexity. In the future, it will be necessary to explore more efficient perturbation generation mechanisms and investigate generalization performance enhancement in cross-domain scenarios. Weikai Li et al. [4] proposed a test-time small-sample target detection model, TIDE, to address the problem of the lack of real-time capability and black-box limitations caused by the traditional method relying on fine-tuning, and they designed an asymmetric two-branch architecture: it uses a DINO self-supervised model to extract the semantic features of the supported instances. Combined with Swin Transformer to encode multi-scale features of query images, feature interaction is achieved through a cross-attention module, and a dynamic comparison classifier is introduced to generate category probability distributions based on support query feature similarity. The innovations include (1) proposing a new paradigm of fine-tuning-free test-time FSOD to support real-time configuration and black-box scenarios; (2) an asymmetric structure to avoid pattern collapse due to feature encoding homogeneity; and (3) a cross-attention mechanism to strengthen contextual associations and a multi-scale adjuster to improve target size robustness. Experiments show that TIDE surpasses mainstream methods by more than 10% in AP metrics on the COCO and PASCAL VOC datasets and improves inference speed by 52% compared to comparative models. The existing problems are that the domain drift problem in cross-domain scenarios is not solved, and the robustness of the dynamic classifier to noise-supported samples needs to be further verified, so the domain-adaptive strategy and classification confidence calibration methods need to be explored in the future. Shihong Wei [5], in using multilevel metric networks to cope with small-sample learning, found that when the input image size varies significantly, the average precision (AP) of the detector decreases by up to 12.6% under three-shot conditions, exposing the inherent flaws of the traditional methods in terms of their sensitivity to scale.
Bangbang Chen et al. [6] investigated YOLOv8n-RBP, a green walnut detection and counting method based on improved YOLOv8n, which aims to cope with the challenges of branch and leaf shading, fruit overlapping, and light changes in natural environments, and it improves the detection performance through three innovations, focuses on lightweight model design, and takes into account both real-time performance and detection accuracy, providing a new way of thinking for intelligent management of orchards. The core innovations include the introduction of the RFCBAM attention mechanism in the backbone, which reduces redundant computation and enhances feature extraction through group convolution, increasing mAP50 by 1.5% and the number of parameters by only 3.3%, and the adoption of BiFPN-GLSA feature fusion, which improves the neck structure by using a bidirectional pyramid network and combines the Global-Local Spatial Attention Module, the feature fusion efficiency is improved by 0.7% while reducing the number of parameters by 30%. The PIoUv2 loss function is proposed to optimize the bounding box regression with a non-monotonic attention mechanism, which improves the recall rate by 2.7% and accelerates the convergence speed by 15% compared with CIoU in complex occlusion scenarios. Experiments show that the improved model has an mAP50 of 82.2% and a recall of 72.4% on a self-constructed 5188-image dataset, and the number of parameters and model volume were reduced by 26.7% and 22% respectively compared to the original YOLOv8n, enabling real-time detection on NVIDIA Jetson Xavier NX edge devices. However, there are shortcomings in this study: the data is only for a specific orchard in Xinjiang, and the robustness of the cross-region light difference is not verified; the BiFPN-GLSA model has 8.3 G FLOPs, which is questionable for low-computing-power device compatibility; PIoUv2 relies on a single hyperparameter, λ, which is complicated to tune; the fruit overlap is more than 70%; the extreme scenario has a leakage rate of 8.3%; and the feature decoupling needs to be optimized. This study provides a new paradigm for lightweight target detection, but breakthroughs are needed in cross-scene generalization and extreme occlusion processing, and knowledge distillation and 3D perception fusion can be explored in the future to enhance its adaptability to complex environments. Zeqing Yang et al. [7], aiming at the problems of morphology diversity, low-contrast backgrounds, poor image quality, and low detection accuracy in the detection of corrosion on the surfaces of aircraft bilge segments, propose an improved PWDE-YOLOv8n model. To enhance image quality, an omnidirectional gradient grayscale equalization method was introduced. A C2fPSCB module was designed to achieve multi-scale feature extraction, while a dynamically weight-optimized WOTriplet attention mechanism was adopted to suppress overfitting. A dual-task dynamic alignment head (DTDLH) was constructed to enhance task interaction, coupled with an EMA-SlideLoss function to optimize sample balancing. Experiments show that the improved model improves mAP50 by 7% (up to 95.5%) and mAP50-95 by 9.3% on a self-built dataset, reduces the parameter volume by 1.01 M, and achieves an inference speed of up to 238.1 frames/s, thus outperforming mainstream algorithms in terms of detection accuracy and real-time performance, providing an effective solution for lightweight real-time detection in complex industrial scenarios. Zheng Wang et al. [8], aiming at the problem of the low efficiency of real-time monitoring of estrus individuals in dairy farming, proposed a YOLO-TransT model that fuses target detection and tracking. By improving the YOLOv8n model and introducing the Context Augmentation Module (CAM) and the channel attention mechanism (SE module), the correlation features between cows in heat and mating behaviors are effectively captured, and the detection accuracy (APoestrus) is improved to 92.6%. Combined with the TransT tracking model, a tracking success rate of 70.3% is achieved in complex scenarios such as occlusion and deformation. Experiments show that the monitoring system constructed by this method can accurately locate rutting individuals while remaining lightweight, providing an end-to-end solution for intelligent management of large-scale ranches, significantly improving efficiency and reducing the labor costs compared with traditional manual inspection. Jiaquan Wan et al. [9], in response to the problem of automatic segmentation of the flood extent in video images of urban floods, proposed a method based on an improved YOLOv8n-seg model solution. Aiming at the bottlenecks of existing methods, such as the lack of a universal dataset, technology lag, and insufficient multi-terminal adaptation, the authors constructed a flood instance segmentation dataset containing 2819 samples and developed the DSS-YOLOv8n model by introducing distributed shift convolution (DSConv) to optimize the convolution module of the YOLOv8n-seg model. Experiments show that the improved model improves the box mAP50 and mask mAP50 metrics by 1.6% and 1.7%, respectively, reduces the number of floating-point operations by 0.6 G, and exhibits stronger robustness in complex scenes such as nighttime and shallow water obfuscation. This study validates the potential of deep learning models in monitoring flood dynamics and provides an efficient technical path for urban flood emergency response.
In this paper, we propose a small-sample target detection model based on generative adversarial networks and feature-aligned YOLOv8n (DCGAN-YOLOv8n, Deep Convolution Generative Adversarial Networks–YOLOv8n), which achieves small-sample dynamic reinforcement and adaptive alignment of the feature space under the condition of small samples.

2. YOLOv8n Model Design Based on DCGAN Feature Enhancement

The DCGAN-YOLOv8n model in this paper addresses the core challenges of data scarcity and intra-class variation in current small-sample detection tasks. The model is constructed through three synergistic modules: The adversarial feature enhancement module draws on the ideas of TIDE [4] and FRBCS-GAN [10,11], to address the issue of mode collapse in few-shot learning, DCGAN was introduced to augment samples in the feature space. An asymmetric encoder was employed to decouple the feature representations of the support set and the query set. Furthermore, a cross-modal attention mechanism was incorporated to facilitate semantic alignment between these representations. The multi-scale feature fusion module is inspired by NATS [10] and OrthoNet [2], which constructs a hierarchical feature pyramid network to extract multi-scale target information and obtains the final fusion features by fusing the multi-scale target features learnt by DCGAN with the hierarchical feature counterparts of YOLOv8n, improving the model’s learning rate and mastery of target features. The final fused features are obtained by fusing the multi-scale target features learned by DCGAN with the corresponding YOLOv8n hierarchical features to improve the learning rate and mastery of the model on target features.

2.1. Adversarial Feature Enhancement

In order to solve the problems of limited feature expression ability and increased deviation of the data distribution in traditional small-sample target recognition methods due to the scarcity of samples in small-sample problems, this paper proposes a new adversarial feature enhancement module (AFEM), which effectively enhances the feature expression ability of the model under complex data scenarios through the dual mechanism of deep feature reconstruction and adversarial optimization. This module effectively improves the feature expression ability of the model in complex data scenarios through the dual mechanism of deep feature reconstruction and adversarial optimization. The core concept of the module is to combine the adversarial training mechanism of generative adversarial networks with feature space optimization to achieve adaptive enhancement and optimization at the data feature level.
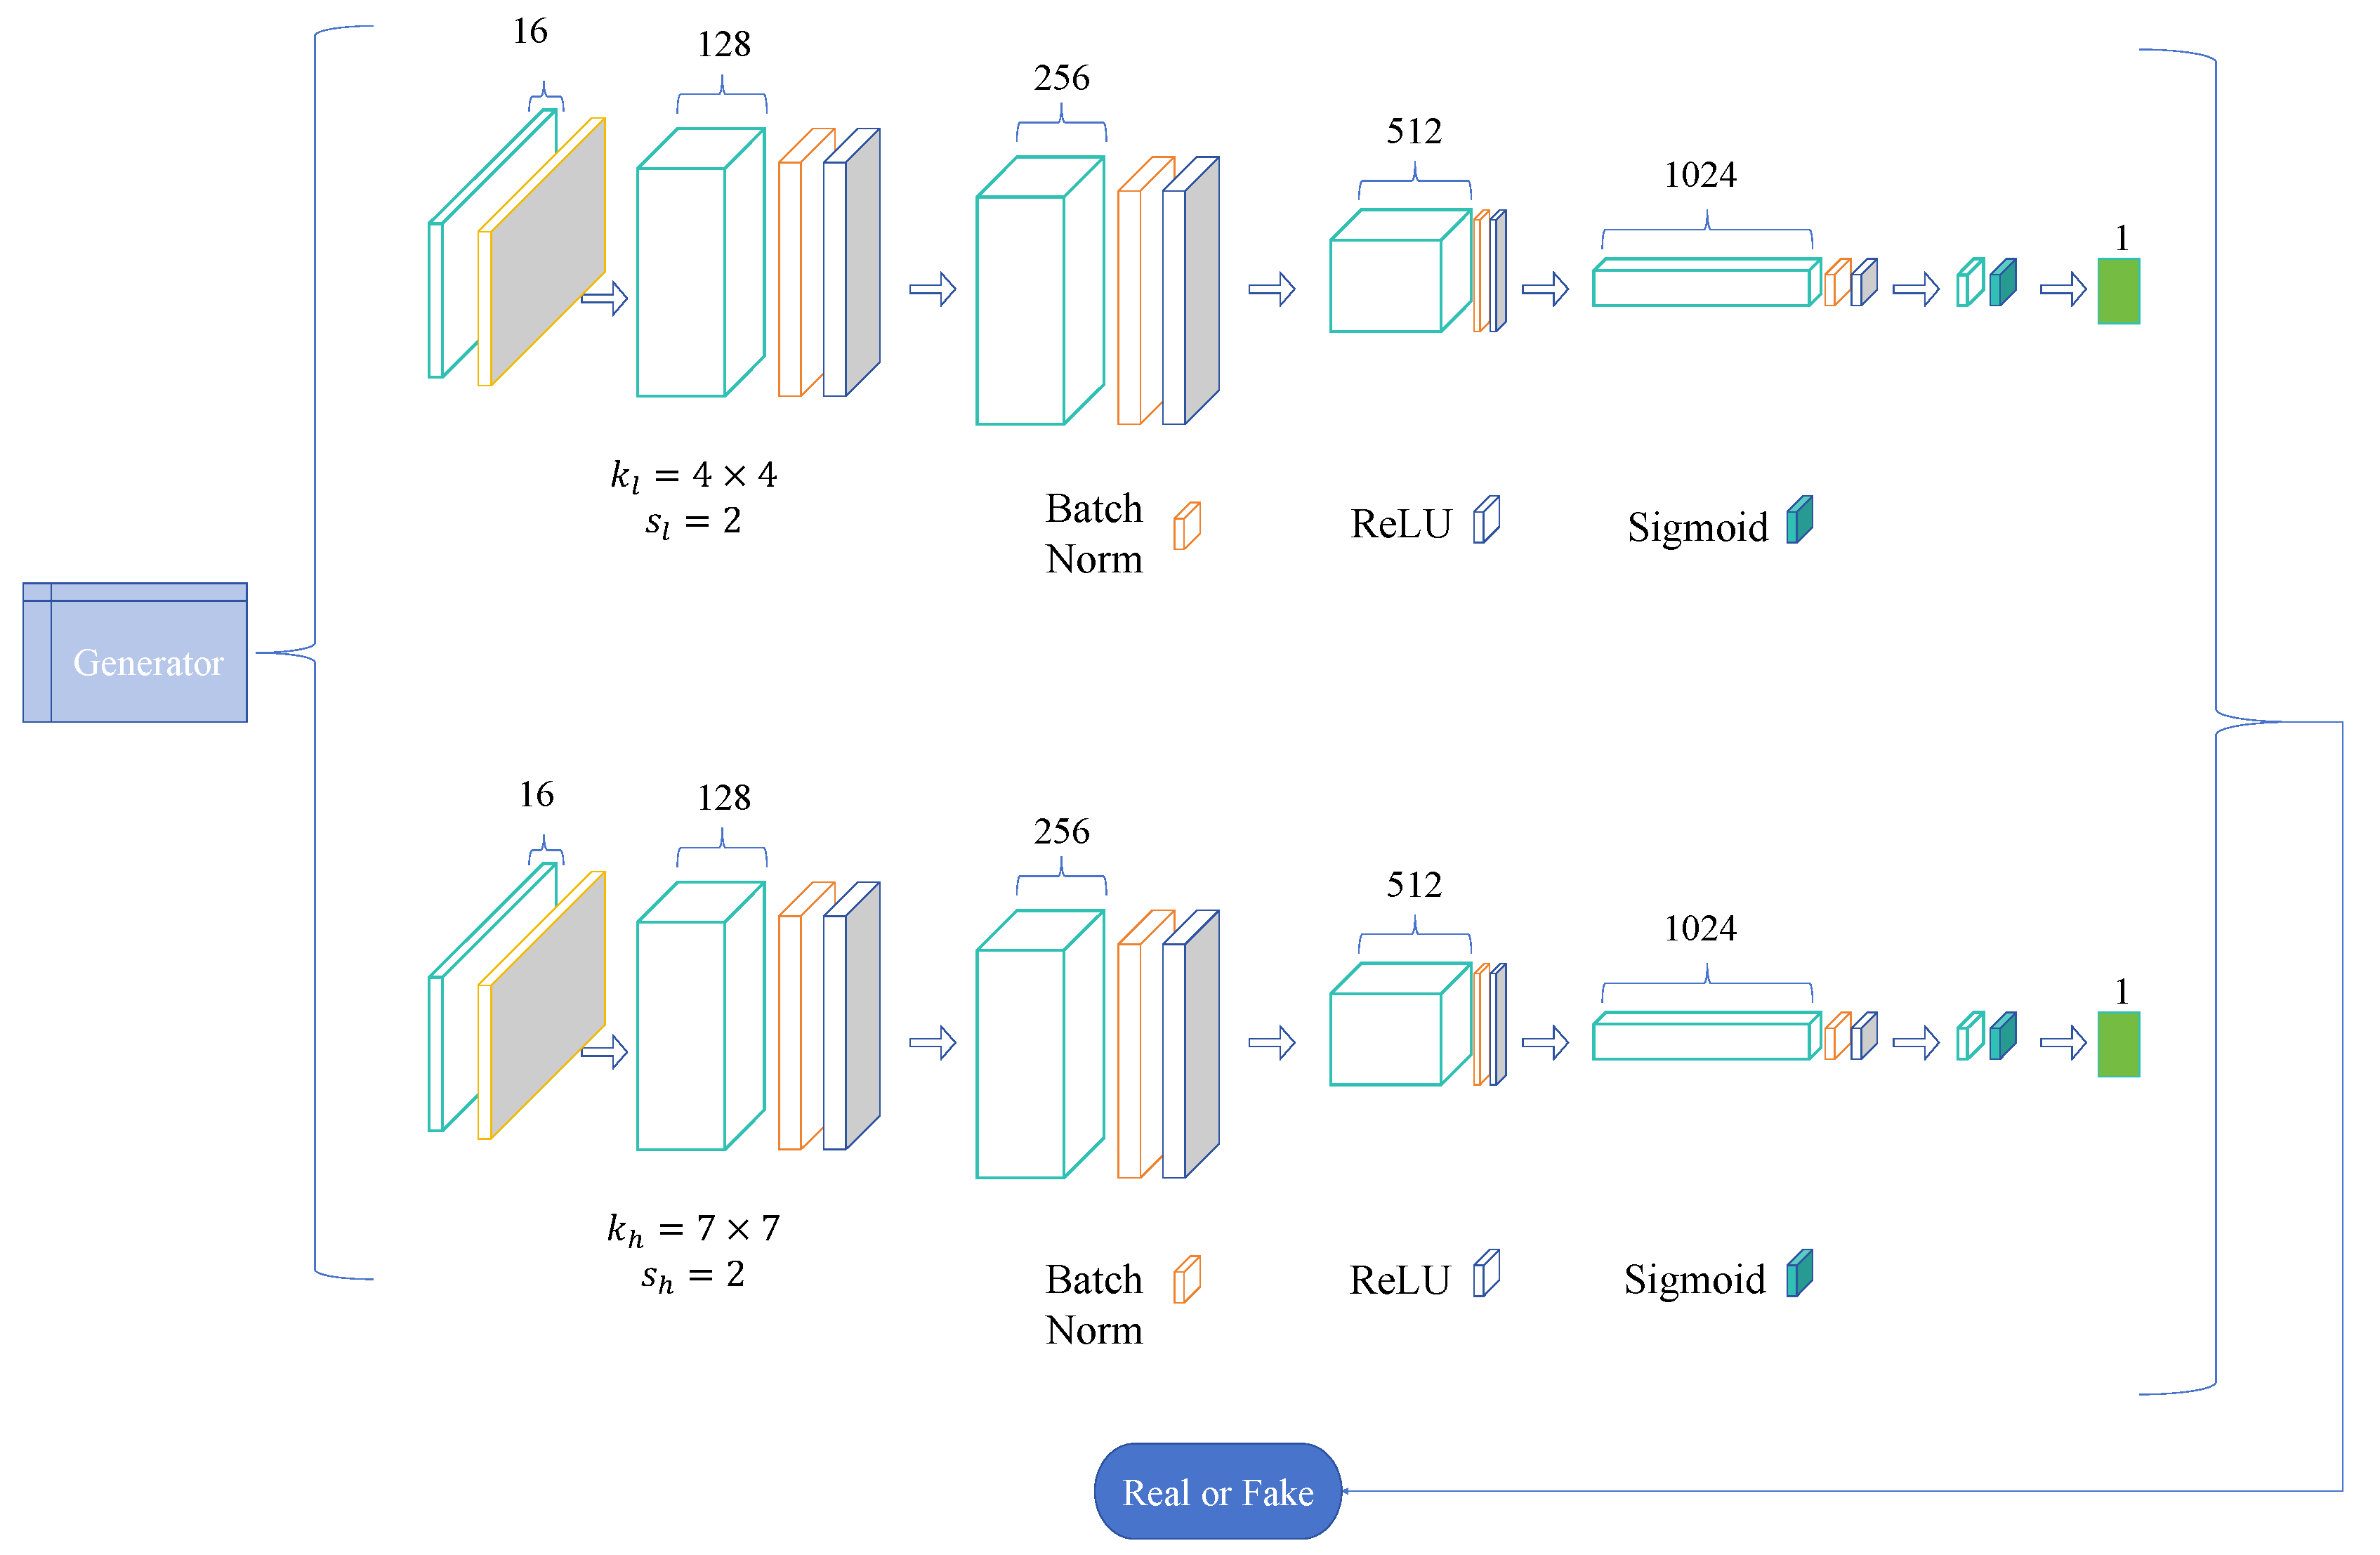
In terms of module architecture design, AFEM adopts a two-channel feature interaction mechanism. Based on the DCGAN framework [12], the feature extraction process is divided into two channels. The basic information of low-level features of the image, such as edges and texture, is assigned to one channel, and the semantic information of high-level features, such as the overall structure, is assigned to the other channel. This is achieved by using different convolution kernel sizes and step sizes in the convolutional layers of the generator and discriminator. Smaller convolution kernels and step sizes tend to capture low-level details, while larger convolution kernels and step sizes help to extract high-level features. The hierarchical structure can be co-optimized for different layers of information in the image data and abstract features of the target to generate enhanced features with strong discriminative properties.
The workflow of AFEM is illustrated in Figure 1. AFEM performs feature extraction in each of the two channels. For the generator, as shown in Figure 2, in the low-level feature channel, the noise vectors are progressively up-sampled by a series of inverse convolutional layers to generate feature maps containing rich details; in the high-level feature channel, the same inverse convolutional layers are used, but the parameter settings focus on generating feature maps with more semantic and structural information. In the discriminator, a similar approach is used to perform convolutional operations on the input image to extract low-level and high-level features, respectively, as shown in Figure 3.
After acquiring the dual-channel features, feature interaction is required to achieve a reasonable and effective use of the features. The dual-channel output features are F 1 R C × H × W and F 2 R C × H × W , which are fused as shown in Equation (1):
F f u s e d = W 1 ( F 1 ) + W 2 ( F 2 ) + F s k i p
The modules W 1 and W 2 are 1 × 1 convolution kernels that perform channel alignment to unify feature dimensions. Meanwhile, F s k i p represents the skip connections that incorporate features from earlier layers, such as the input or intermediate features.
To maintain gradient stability, residual connections mitigate deep network gradient vanishing, as expressed in Equation (2).
y = F ( x , { W i } ) + x
where   F ( x ) is a trainable parameter. For backpropagation, the gradient of the loss function with respect to the input x is computed as shown in Equation (3):
L x = L y F x + I
where I is the unit matrix, the physical meaning of which can be understood through the following key points.
The total gradient is composed of the residual path F x and the constant path I, where the role of the constant path contains three main aspects: Gradient flow composition: the total gradient is composed of the residual path F x and the constant path I. When the depth of the network increases, leading to F x 0 , the unit matrix ensures that there is at least a baseline gradient with strength 1. Mitigation of activation-induced decay: in the ReLU activation scenario, if a pre-activation structure is used (i.e., BN-ReLU-Conv order), the gradient of the output with respect to the input can be expressed as per Equation (4):
y x = l = 1 n W l d i a g ( σ ( h l ) ) + I
where σ is the derivative of the activation function, and h l is the layer l pre-activation value. The unit matrix term effectively compensates for the exponential gradient decay due to the multiplication of i = 1 N ( W i σ ) .
Deep network stability: for a deep network containing N residual blocks, the total gradient flow can be decomposed as per Equation (5):
L x i n i t = k = 1 N L x k i = k N F i x i + I
Even if the F i x i of a single residual block tends to zero, the unit matrix ensures that the gradient remains computable in magnitude during depth propagation.
The reproducibility of AFEM depends on the systematic configuration of five types of core parameters. Its theoretical basis and implementation constraints are as follows.
Dual-channel convolution structure parameters: The lower-level feature channels use small-sized odd-symmetric convolution kernels, with typical values of k l = 4 × 4 , integers in the range 3 , 5 , combined with a unit stride ( s l = 2 ) to preserve spatial details. High-level channels use large convolution kernels, where k h is an odd integer in the range 7 , 11 (default 7 × 7 ) and stride s h = 2 , to expand the receptive field through downsampling and capture semantic structures. This design is based on the theory of hierarchical image representation, where small kernels focus on local textures while large kernels model global correlations.
Feature fusion parameters: The channel alignment layer is forced to use 1 × 1 convolution to unify the feature dimensions, and the number of output channels needs to be consistent with the target dimension C ( C Z + , usually 64 256 ). The jump connection F skip needs to be explicitly indexed by the source layer to alleviate the information attenuation of the deep network, and its selection needs to satisfy the constraints of constant mapping additivity.
Adversarial training parameters: Spectral normalization is enabled for the discriminator, the upper bound of spectral paradigm is σ = 1.0 , the number of power iterations is iter = 1 , and the Lipschitz constant is constrained to the optimal value K = 1 to stabilize the adversarial training. Based on the DCGAN architecture a priori, the number of inverse convolution layers of the generator is fixed to 4, and the initial number of channels is C g , which decreases geometrically (e.g., 512 , 256 , 128 , 64 ), to ensure the ability of feature reconstruction.
Residual mechanism parameters: The mathematical form of y = F x + x is strictly followed, in which the constant path weight matrix I is a unit matrix that cannot be adjusted, and the gradient decomposition is performed by Equation (3).
Dynamic Optimization Parameters: The Adam optimizer learning rate is α 10 5 , 10 3 (default 0.0002 ) and the momentum factor is β 1 , β 2 = 0.5 , 0.999 to balance the historical gradient decay; the noise vector dimension is d z 100 (suggested 128 ) to ensure generative diversity; and the loss weights λ adv : λ rec are adjusted by the task (typical ratio 1:10) to mitigate small-sample overfitting.

2.2. Multi-Scale Feature Fusion

YOLOv8n, as a representative architecture for single-stage target detection algorithms, has a core feature pyramid network (FPN) designed to reflect the deep optimization of multi-scale feature fusion. By constructing a hierarchical feature representation system, the network significantly improves the target detection performance while maintaining the real-time inference speed. This capability provides significant benefits in target detection for small samples. Moreover, YOLOv8n has the advantages of better balance between accuracy and being lightweight [6], superior architectural extensibility [7], and deployment compatibility than models such as YOLOv10n, so YOLOv8n is selected as the target recognition model in this paper [9].
Fusing features from different layers of the DCGAN generator with corresponding scales in the YOLOv8n feature pyramid network via weighted fusion [7,13,14,15] is an effective strategy to enrich feature information and enhance detection performance and accuracy. In the feature pyramid network of YOLOv8n, feature maps of different scales correspond to different levels of spatial details and semantic information, respectively. Among them, shallow features contain rich edge and texture details, while deep features encode higher-order semantic information. The intermediate layer features of the DCGAN generator also have multi-scale characteristics, but their resolution and number of channels may not match the target detection network. Therefore, the first step to achieve multi-scale fusion is feature alignment. Feature alignment consists of two main parts, spatial alignment and channel alignment.
The resolution alignment is mainly achieved by bilinear interpolation to adjust the size of the feature maps output from the DCGAN generator so that is the same as the resolution of the feature maps of the corresponding scales of YOLOv8n. If a layer of YOLOv8n is F i R C × H × W and the corresponding layer of the DCGAN generator is G j R H i × W i × C i , then it needs to be adjusted to an H i × W i resolution by interpolation, as defined in Equation (6):
G j = R e s i z e ( G j , ( H i , W i ) )
Channel alignment is mainly about adjusting the number of channels of DCGAN features using 1 × 1 convolution to match the number of channels of the YOLOv8n feature maps G j , as formalized in Equation (7):
G j = C o n v 1 × 1 ( G j ) R H i × W i × C i
Among the multi-scale feature fusion strategies, this paper chooses the attention-weighted fusion mechanism to achieve adaptive feature enhancement by introducing the SE module to dynamically assign weights, and the main steps are as follows:
Feature splicing and compression are performed as per Equation (8):
F c a t ( i ) = C o n c a t ( F i , G j ) R H i × W i × 2 C i
Channel description vectors are generated by global average pooling (GAP), as shown in Equation (9):
z = G A P ( F c a t ( i ) ) R 2 C i
Dynamic weights are generated using fully connected layers with nonlinear activation functions to produce channel attention weights, as defined in Equation (10):
s = σ ( W 2 R e L U ( W 1 z ) ) R 2 C i
where W 1 R r × 2 C i ,   W 2 R 2 C i × r are learnable parameters, r is the compression ratio set to 16, and σ is the sigmoid function.
When it comes to the feature weighting fusion step, the weight vector s is split into two parts corresponding to the original feature F i and the generated feature G j , as described in Equation (11):
s F , s G = S p l i t ( s , d i m = 1 )
The final fused features are obtained by the channel-by-channel dot product, as shown in Equation (12):
F f i n a l ( i ) = s F F i + s G G j R H i × W i × C i
where denotes channel-by-channel multiplication. This attention-based mechanism suppresses irrelevant features and enhances the focus on key information.
Through multi-scale feature fusion, features from different layers of the DCGAN generator were weighted and fused with corresponding-scale features in the YOLOv8n feature pyramid network. This approach significantly enriches the feature representations and effectively mitigates the cross-scale adaptability limitations of the original model in few-shot object recognition. The proposed mechanism enhances the model’s accuracy and reliability in detecting objects across varying scales.

2.3. Triple Marginal Constraint

A novel triple marginal constraint (TMC) framework is introduced to address the critical challenges of feature dispersion, class confusion, and distributional bias in small-sample target detection. This framework synergistically integrates three complementary loss components: an intra-class compactness loss that minimizes feature variance within each class by contracting samples toward their centroids, an inter-class separation loss that enforces a minimum margin between class centroids to maximize decision boundary clarity, and an adversarial distribution alignment loss that bridges real and synthetic feature distributions through a min–max game. The TMC mechanism jointly sculpts the feature space to maximize the Fisher discriminant ratio while ensuring the distributional consistency of augmented features, thereby constructing a geometrically structured embedding domain with high intra-class homogeneity, high inter-class separability, and robust out-of-distribution generalization. This unified approach directly mitigates the “large intra-class variation” and “data distribution bias” problems identified in Section 1, providing a theoretically grounded solution for few-shot detection scenarios.

2.3.1. Intra-Class Compactness Loss

In small-sample target detection, the limited number of samples per class often leads to dispersed feature distributions within the same category, which severely degrades model discriminability. To mitigate this, we design an intra-class compactness loss to enforce features of the same class to cluster tightly around their centroid.
Formally, let f i c R d denote the feature vector of the i -th sample from class c extracted by the backbone network, where d is the feature dimension. The class centroid μ c is computed as the mean of all features belonging to class c , as defined in Equation (13):
μ c = 1 N c i = 1 N c f i c
where N c is the number of samples of class c in the current training batch. The intra-class compactness loss L intra is then defined as the mean squared Euclidean distance between each feature and its corresponding class centroid, as shown in Equation (14):
L i n t r a = 1 C c = 1 C 1 N c i = 1 N c f i c μ c 2 2
Here, C is the total number of classes. This loss minimizes the variance of features within each class, effectively encouraging samples of the same category to form a compact cluster in the embedding space.
The intra-class compactness loss aligns with the Gaussian assumption of feature distribution within a class, f c N ( μ c , Σ c ) . By minimizing L intra , we implicitly reduce the covariance Σ c (ideally towards σ 2 I ), which simplifies the decision boundary for classifiers and enhances robustness against intra-class variations. This is particularly crucial in small-sample settings where insufficient data amplifies the negative impact of feature scattering.
During backpropagation, the gradient of L intra with respect to a feature vector f i c is given by Equation (15):
𝛻 f i c L i n t r a = 2 C N c f i c μ c
This gradient updates the feature extractor to pull f i c toward μ c , thereby progressively refining the compactness of class-specific clusters. Combined with the inter-class separation loss, it constructs a well-structured feature space with high intra-class similarity and high inter-class discrepancy, significantly improving the model’s ability to distinguish novel categories with few samples.

2.3.2. Inter-Class Separation Loss

In small-sample target detection, compact intra-class clusters alone are insufficient for robust discrimination. Without explicit separation constraints, features from different classes may remain proximate in the embedding space, leading to catastrophic confusion during inference. To address this critical challenge, we design an inter-class separation loss that enforces a minimum margin between class centroids, synergistically complementing the intra-class compactness loss.
Formally, let μ c R d denote the centroid of class c computed via μ c = 1 N c i = 1 N c f i c as defined in Section 2.3.1. The inter-class separation loss L inter is defined as per Equation (16):
L i n t e r = c c m a x 0 , δ μ c μ c 2
where c is the total number of classes, and δ > 0 is the minimum separation margin (hyperparameter set to 1.2 in experiments).
This loss imposes a hinge penalty when the distance between any two class centroids falls below δ , effectively enforcing a low-density buffer zone between decision boundaries.

2.3.3. Adversarial Distribution Alignment Loss

The scarcity of real training data creates a fundamental limitation: the learned feature distribution often fails to capture the full diversity of target appearances. To overcome this, we introduce an adversarial distribution alignment loss that leverages DCGAN-generated features to augment and align the feature space, effectively bridging the gap between synthetic and real distributions.
Let p real denote the distribution of features extracted from real samples and p g the distribution of features generated by the DCGAN module. The adversarial distribution alignment loss is defined through a min–max game between the generator G and discriminator D , as shown in Equation (17):
L a d v = E x p r e a l l o g D x + E z p z l o g 1 D G z
where z p z is a noise vector sampled from a prior distribution (typically Gaussian), G ( z ) generates synthetic features conditioned on the noise input, and D ( ) outputs the probability that input features belong to p real .
The generator G aims to minimize L adv , while the discriminator D aims to maximize it. This adversarial formulation creates a dynamic equilibrium where G learns to produce synthetic features indistinguishable from real features by D.

2.3.4. Joint Optimization Objective

The triple marginal constraint framework integrates feature space structuring with core detection objectives through a unified loss function. This joint optimization synchronizes discriminative feature learning with adversarial distribution alignment, explicitly addressing the small-sample challenges of feature scattering, class confusion, and distributional bias.
The total loss combines YOLOv8n’s detection loss L d e t with the three constraint losses, as formalized in Equation (18):
L t o t a l = L d e t + λ 1 L i n t r a + λ 2 L i n t e r + λ 3 L a d v
where:
L d e t = L c l s + L b o x + L d f l : Original YOLOv8n detection loss (classification, bounding box regression, distribution focal loss).
L i n t r a : Intra-class compactness loss (Section 2.3.1).
L i n t e r : Inter-class separation loss (Section 2.3.2).
L a d v : Adversarial distribution alignment loss (Section 2.3.3).
λ 1 , λ 2 , λ 3 : Adaptive weighting coefficients ( λ 1 = 0.5 ,   λ 2 = 0.3 ,   λ 3 = 1.0 , experimentally determined).
This unified optimization framework transforms the feature space into a geometrically structured, distributionally consistent domain where intra-class clusters are compact, inter-class boundaries are maximally separated, and synthetic features faithfully augment scarce real data—directly addressing the trifecta of small-sample challenges identified in Section 1.

3. Experiment and Results

3.1. Datasets and Settings

NWPU VHR-10 [16,17,18] is a remote sensing target detection benchmark dataset released by Northwestern Polytechnical University in 2014, which is designed for geospatial object recognition tasks and has become an important benchmark for deep learning algorithms to validate their performance in remote sensing. The dataset contains 800 high-resolution remote sensing images, of which 650 are a “positive sample set” with targets and 150 are a “negative sample set” without targets, all of which are derived from high-precision satellite images from Google Earth and the Vaihingen dataset (cramer 2010): https://ifpwww.ifp.uni-stuttgart.de/dgpf/DKEP-Allg.html (Accessed on 16 April 2020). The positive samples in the dataset contain annotations for 10 categories of typical geospatial objects: airplane, ship, storage tank, baseball diamond, tennis court, basketball court, ground track field, harbor, bridge, and vehicle, comprising a total of 3651 expert-annotated object instances.
In terms of class distribution [16], the dataset ensures inter-class balance through a multi-source data acquisition strategy. The aircraft category covers overhead views of major airports around the world, with a total of 897 aircraft labelled and a maximum of 47 aircraft included in a single image; the ship category contains 763 vessels, mainly collected from harbors and shipping channel areas; the oil tank category is dominated by oil storage facilities in industrial zones, with a total of 582 circular tanks labelled; in the sports field category, baseball fields (318), tennis courts (294), basketball courts (277), and track and field fields (265) all contain standardized sites taken from multiple perspectives; and traffic infrastructure images (265) all contain standardized sites taken from multiple angles; the data collection strategy is to ensure a balanced distribution among the classes. All positive sample images contain at least one target instance, and about 23% of the images have multi-category co-occurrence, with the highest co-occurrence rate of ports and ships and airports and aircraft, which provides a database for studying contextual association detection.
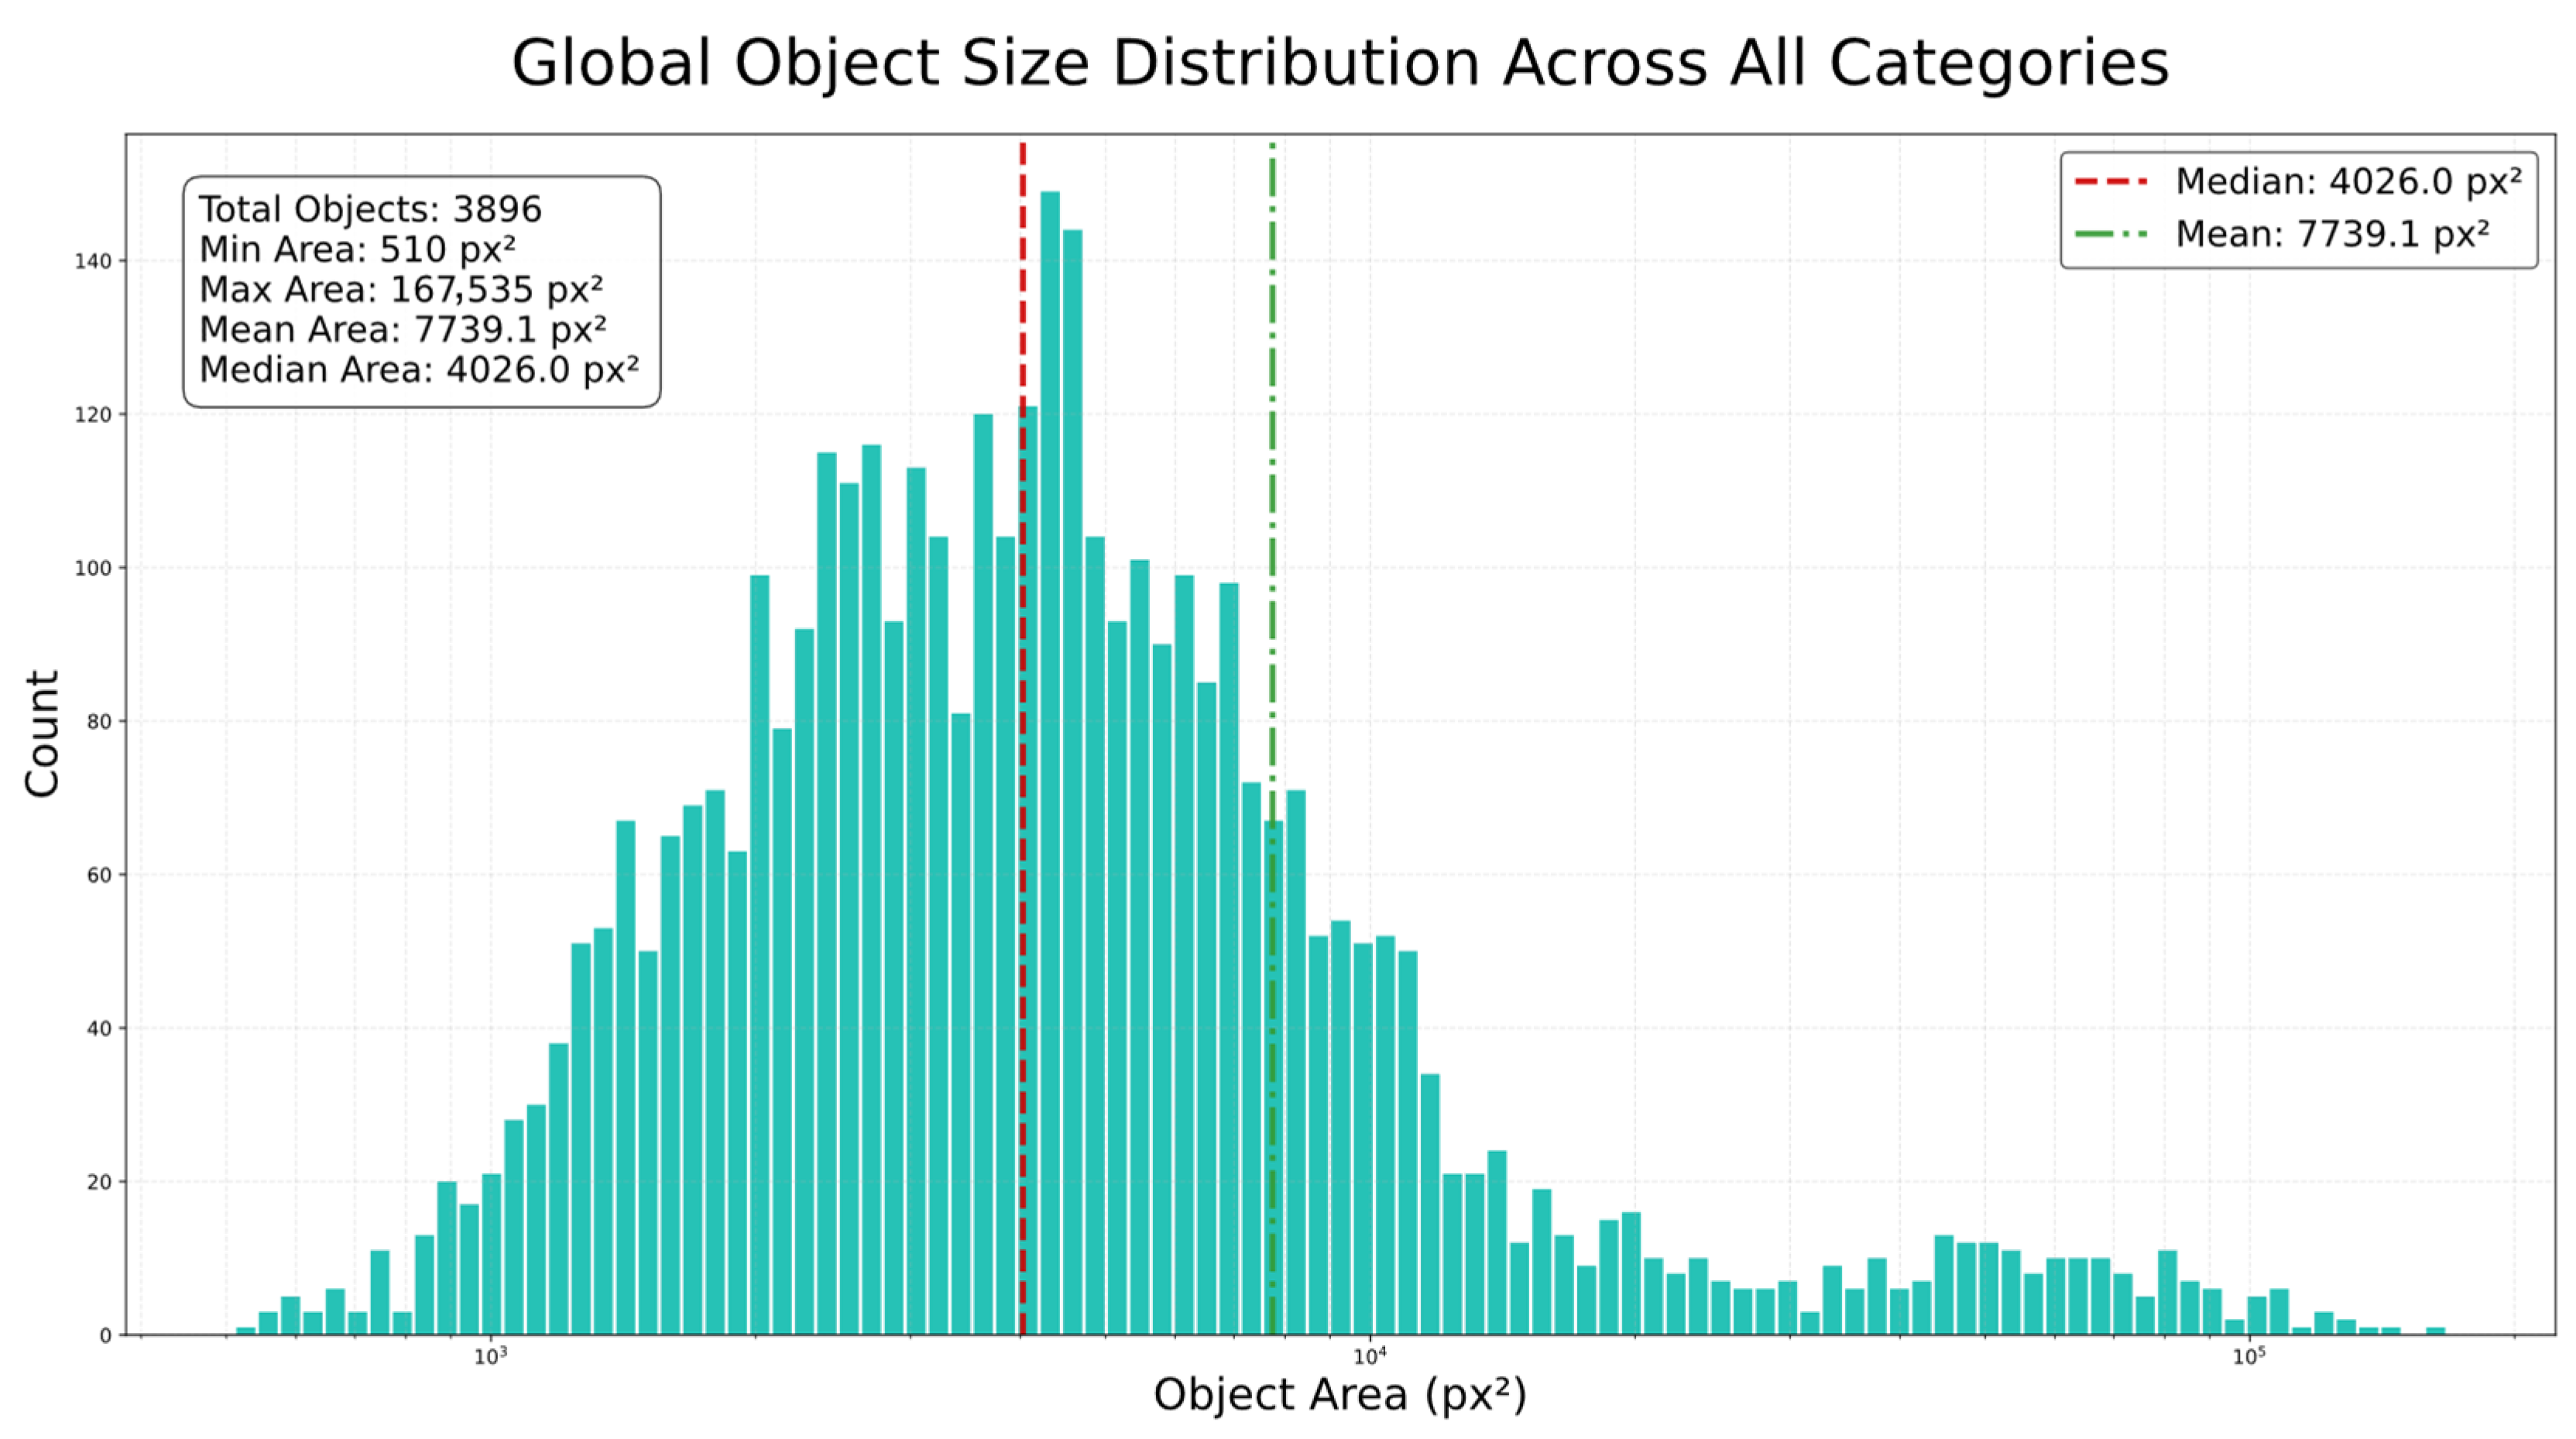
As shown in the NWPU VHR-10 target size distribution heatmap (Figure 4), the NWPU-VHR10 dataset poses dual challenges for target detection models: category distribution is severely imbalanced, with dominant categories such as airplanes, storage tanks, and vehicles accounting for 55.5% of the dataset, while sparse categories such as bridges have only 80 samples, leading to significant differences and potentially causing the model to overlook minority class recognition; object sizes are polarized, with micro-objects like vehicles averaging 45.9 × 46.0 px, close to the lower limit for small object detection (<50 px), while macro-objects like ground track fields average 264.7 × 258.2 px, with the smallest object, a ship, having a width of 17 px, resulting in a size difference of 30 times, severely testing the model’s scale invariance.
DCGAN-YOLOv8n can effectively address the above challenges by combining generative data augmentation with a lightweight architecture design. Data balancing: utilizing DCGAN to synthesize sparse category samples fills the data gap for small objects and alleviates the long-tail distribution problem. Multi-scale detection optimization: Based on YOLOv8n’s anchor-free design, it directly predicts the center point of the target, avoiding mismatches between pre-set anchor boxes and small targets. Combined with the CSPDarknet53 backbone and PANet neck structure, it achieves full-scale coverage from 500 to 180,000 square pixels. Dynamic loss mechanism: this mechanism integrates focal loss dynamic weighted sparse category loss to suppress majority class dominance while optimizing large target box regression accuracy through CIoU loss.
To enhance the interpretability of heatmap visualizations, we introduce supplementary category-specific histograms to display object size distributions. These histograms facilitate an intuitive understanding of size variation patterns within categories. As illustrated in Figure 5, even within homogeneous object categories, significant size heterogeneity and broad size ranges persist. As depicted in Figure 6, from a holistic data perspective, object sizes exhibit considerable variation across categories. This observed scale diversity imposes heightened demands on the model’s adaptability and generalization capabilities.
The dataset is constructed using a two-stage quality control mechanism [16,17]: First, the initial screening is performed by 0.5–2 m resolution Google Earth images, and then, 85 ultra-high-definition CIR images measuring 0.08 metres were introduced to enhance detail features. The labelling standard strictly follows the geospatial target detection specification and adopts the horizontal bounding box (HBB) labelling method, where each target is pinpointed by the upper-left (x1,y1) and lower-right (x2,y2) coordinates and labelled with a category code of 1–10. Of particular note is the fact that the proportion of small targets in the dataset is 68% (target pixel area < 32 × 32), and there are 29% partially occluded targets, which poses a serious challenge to the feature extraction capability of the detection algorithm [18].
This study employed the PyTorch framework (version 2.1.0) with torchvision version 0.16.0 and CUDA version 12.3 for NVIDIA GPU acceleration. The model was trained end-to-end using stochastic gradient descent. Following common practice in object detection, data loading was parallelized across eight subprocesses to improve efficiency. The Adam optimizer was adopted to update model parameters, with an initial learning rate (lr0) of 0.001 and a final learning rate decayed to 0.01 times the initial value (lrf = 0.01). Data augmentation was enabled (augment = True) with the following parameterization: HSV hue, saturation, and value adjustments were set to hsv_h = 0.015, hsv_s = 0.7, and hsv_v = 0.4, respectively. Vertical and horizontal flipping were activated via flipud and fliplr. Input images were resized to a uniform dimension of 640 × 640 pixels, and each training batch contained 16 samples (batch = 16). These parameters were jointly optimized to enhance training performance and model capability. The traditional metrics of mAP50 and mAP50-95 are used for evaluation.
Figure 7 presents the joint distribution of the bounding box annotations within the NWPU VHR-10 dataset.
The diagonal histograms depict the marginal distributions of the four normalized parameters:
  • x: The distribution is approximately uniform, indicating that object centers are evenly distributed along the horizontal axis.
  • y: This is similarly uniform, suggesting a balanced spatial distribution along the vertical axis without significant clustering.
  • Width: The distribution is strongly left-skewed, with the vast majority of values concentrated below 0.5 and a high frequency of very small widths (<0.2), which is a typical characteristic of small objects.
  • Height: Consistent with the width, the height distribution is also left-skewed, confirming the prevalence of small objects in the dataset.
The off-diagonal scatter plots illustrate the bivariate relationships between these parameters:
  • x–y: The points are uniformly distributed across the entire normalized image plane, with only a slightly higher density observed near the center, indicating minimal spatial bias.
  • x-Width, x-height, y-width, y-height: In these four plots, the scale values (width/height) are predominantly confined below 0.2, regardless of their horizontal or vertical position. This demonstrates that the prevalence of small-scale objects is a global characteristic, independent of spatial location.
  • Width–height: The points form a fan-shaped pattern radiating from the origin, revealing a diverse range of aspect ratios. The high density near the origin confirms that most objects are small, with no single dominant aspect ratio.
In summary, the dataset is characterized by a spatially uniform yet small-object-dominant distribution, which is typical of aerial imagery. This underscores the necessity for detection models to prioritize robust small-object recognition and generalization capabilities.

3.2. DCGAN Data Enhancement

Aiming to address the limited size (650 positive images) and imbalanced class distribution of the NWPU VHR-10 dataset, this paper introduces Deep Convolutional Generative Adversarial Networks (DCGAN) as a data enhancement module to make up for the defects of the small data volume and the ease of overfitting of the model’s learning features faced by the small-sample target recognition. The application of DCGAN for data enhancement follows a rigorous generative model optimization paradigm. The application follows a rigorous generative model optimization paradigm, the core of which lies in reconstructing the original data distribution and generating new samples with high fidelity through an adversarial training mechanism. In this study, we implement an improved DCGAN data enhancement experimental process based on the theoretical framework of Composite Functional Gradient Generative Adversarial Networks (CFG): firstly, the input image is pre-processed with multi-scale Gaussian filtering to extract layer-level features, and then nested residual blocks are introduced into the generator architecture, which effectively enhance local details by stacking depth-separable convolutions and channels. An attention mechanism is used to effectively improve the local detail generation capability. In the training strategy, the Nested Annealing Training Scheme (NATS) is used to optimize the dynamics, and the geometrically decreasing annealing weight coefficients w(x) are set to regulate the discriminator gradient field so as to make the generator update direction converge along the integral path of the difference of the score function of the data distribution. In the experimental stage, the NWPU VHR-10 subset is used as the benchmark dataset, and the Wasserstein distance between the generated samples and the original data is computed by the Fourier-domain feature alignment algorithm with an asymptotic training strategy: in the initial stage, the discriminator parameters are frozen, and the low-resolution samples are generated only by the hidden-space interpolation of the generator; in the middle stage, the dynamic regularization term is introduced to constrain the singular value of the generated feature matrix distribution; and in the later stage, stabilizing the adversarial training process is achieved by combining the spectral normalization technique. As for the evaluation indexes, in addition to the conventional Fréchet Inception Distance (FID) and Inception Score (IS), a feature separability index (FSI) based on contrast learning is innovatively constructed, and the spectral radius of the interclass cosine similarity matrix is calculated by pre-training the deep features extracted from ResNet-50. The experimental results show that the improved DCGAN reduces the FID to 8.75 (46.2% lower than the baseline model) at a 256 × 256 resolution, and the generated samples improve the average accuracy by 7.3 ± 0.5 percentage points in the support vector machine classification task, confirming the synergistic effect of the annealed gradient mechanism and nested residuals structure in enhancing the higher-order semantic features of an image. This study provides a theoretically interpretable optimization path for generative data enhancement, and its methodology is valuable for small-sample learning in areas such as medical image analysis.
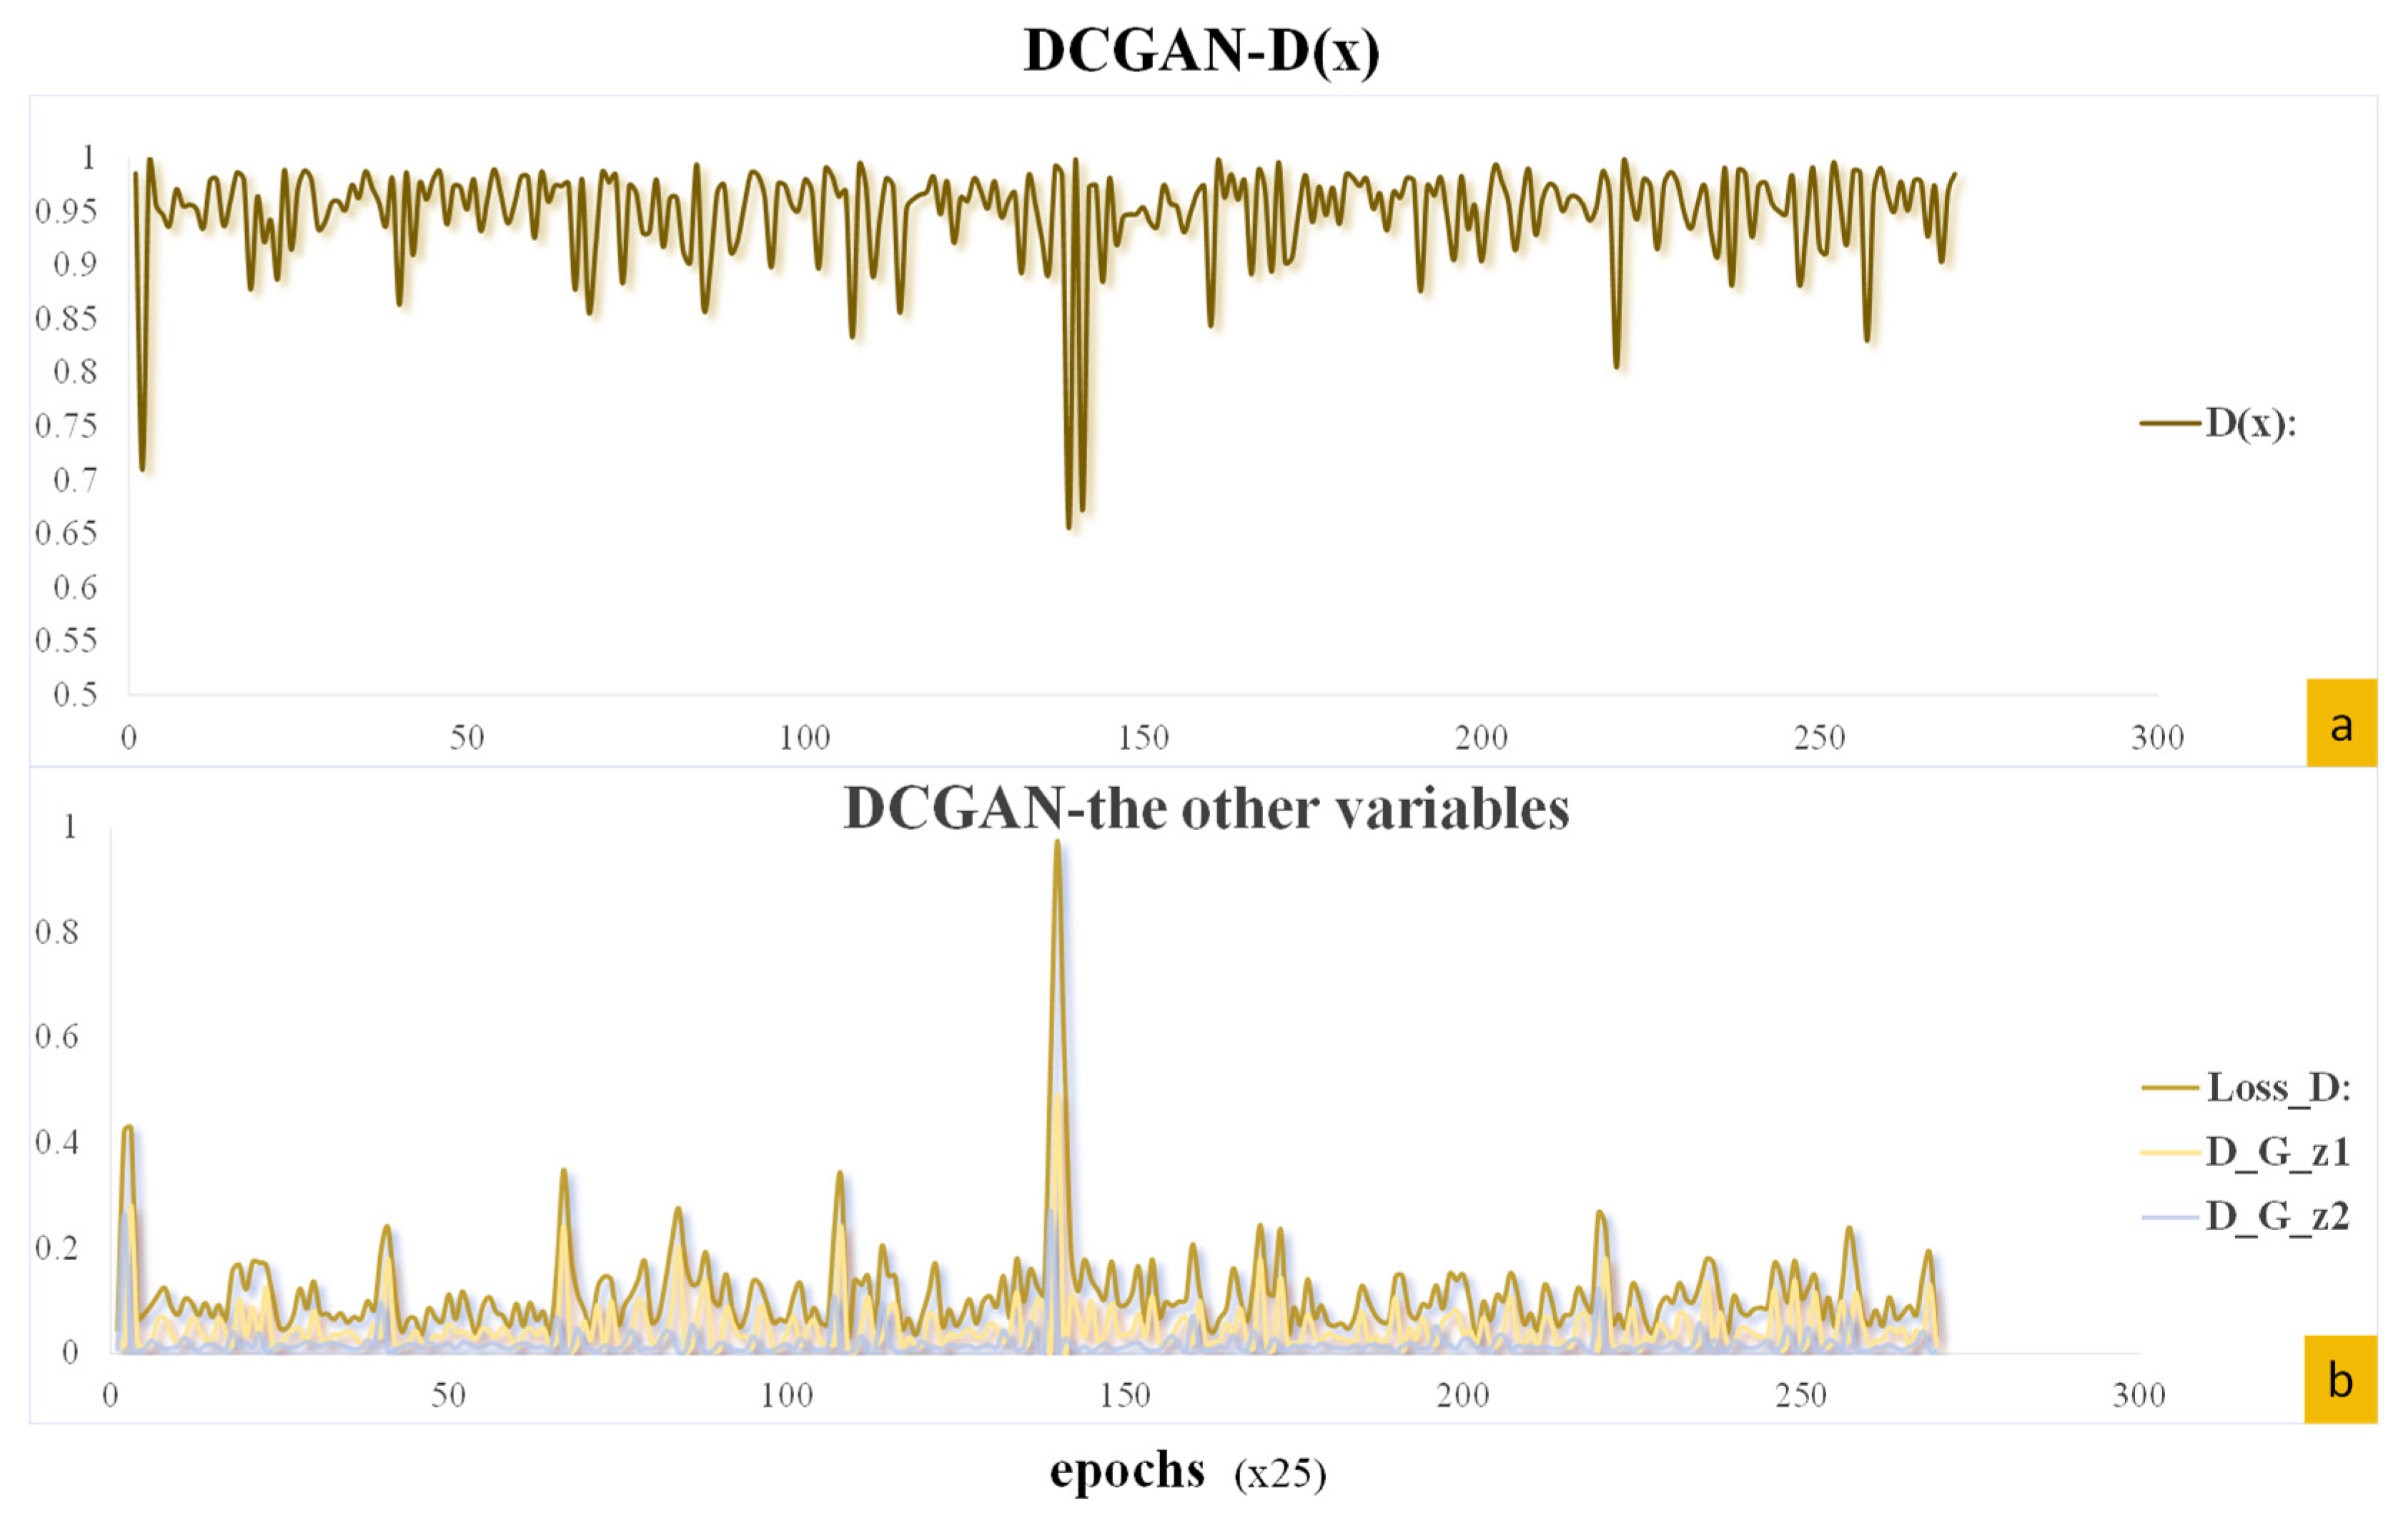
Key training metrics are demonstrated in Figure 8. In the training process of DCGAN, Loss_D, D (x), D_G_z1, and D_G_z2, as the most important metrics, play an indispensable role in accurately evaluating the model performance and training status.
D (x) represents the prediction result given by the discriminator for the real sample, which is essentially a probability value in the interval of 0 to 1. When the value of D (x) tends to be close to 1, it indicates that the discriminator’s confidence in correctly identifying real samples as real samples is significantly improved, which reflects that the discriminator’s judgement on the distribution of the real data is more accurate and that it is able to better capture the intrinsic characteristics and distribution law of the real data.
For Loss_D, i.e., discriminator loss, its core function is to accurately quantify the discriminator’s ability to distinguish real samples from generated samples. In this paper, this index is calculated by the binary cross-entropy loss function, specifically, the lower the value of Loss_D, the more excellent performance of the discriminator in discriminating the real data from the fake data generated by the generator, meaning it can distinguish the two more accurately.
D_G_z1 is the result of the discriminator’s judgement on the fake samples generated by the generator based on the random noise z during the process of updating the parameters of the discriminator. When calculating D_G_z1, the fake samples are separated from the computational graph in order to ensure that the generator’s parameters are not affected by the discriminator’s updating process. Mathematically and logically, the closer the value of D_G_z1 is to 0, the sharper the discriminator is able to identify false samples and the stronger its ability to discriminate false samples.
D_G_z2 is the result of the discriminator’s judgement on the false samples generated by the generator during the process of updating the generator’s parameters. In this process, false samples are not separated from the computational graph, and the purpose is to be able to optimize the generator’s parameters effectively based on the feedback provided by the discriminator. When the value of D_G_z2 is close to 1, it shows that the fake samples generated by the generator are very similar to the real samples in terms of features and distribution, and it can successfully deceive the discriminator, which reflects that the generator has strong ability in terms of generating realistic samples.
As shown in Figure 8, at epoch 141, all four metrics exhibit a significant abrupt change. During training, the discriminator’s gradient abruptly surged at this point, leading to excessive parameter updates. This phenomenon typically stems from factors such as network architecture, activation functions, and data distribution, causing violent fluctuations in discriminator parameters that severely undermine its ability to distinguish genuine samples from synthetic ones. Nevertheless, all metrics subsequently recovered rapidly to their normal fluctuation range, fully demonstrating the model’s strong adaptability and robustness in addressing challenges such as gradient explosion and training instability.
A generated sample evolution is displayed in Figure 9. The generated samples (b, c) closely resemble the real samples (d), demonstrating DCGAN’s ability to learn key target features. These synthetic samples provide valuable support and complementarity for training the subsequent YOLOv8n detector.

3.3. Model Comparison

In this paper, comparative experiments are conducted on the NWPU VHR-10 dataset, using the traditional metrics mAP50 and mAP50-95 for evaluation. The performance difference between the traditional CNN method, YOLOv8 benchmark model, and its improved version, DCGAN-YOLOv8n, is targeted. As shown in Table 1, the experiment retains the standard evaluation metrics (mAP50 and mAP50-95) on the NWPU VHR-10 dataset and adds three-dimensional metrics for precision, recall, and F1-score as a comparison to comprehensively reflect model performance.
This experiment conducts a systematic evaluation of multi-object detection methods, with a focus on analyzing the performance advantages of the DCGAN-YOLOv8n model. As shown in the Table 1, the DCGAN-YOLOv8n model achieves comprehensive leadership in key metrics: its precision rate reaches 0.9391, an improvement of 1.1% over the next-best model, FFCA-YOLO; its recall rate is 0.8636, significantly outperforming YOLOv8m’s 0.822 and YOLOv8n’s 0.8173; the comprehensive performance metric F1-score reaches 0.8998, surpassing FFCA-YOLO’s 0.8905 and TIDE’s 0.8856; and the localization accuracy metric mAP50-95 improves to 0.5706, an increase of 7.7% over the baseline YOLOv8n, reaching 1.63 times the corresponding value of FFCA-YOLO (0.350). These results validate the core value of the DCGAN feature enhancement mechanism: by using generative adversarial networks to enhance feature discriminability, it significantly reduces the background false positive rate by 10.6% and optimizes the false negative rate by 5.7% while maintaining the real-time performance of YOLOv8n.
Further comparative analysis demonstrates that DCGAN-YOLOv8n effectively addresses the inherent limitations of existing methods: First, it overcomes the deficiency of the YOLO series in terms of insufficient localization capability under high IoU thresholds, with the mAP50-95 performance ranking as follows: DCGAN-YOLOv8n is superior to YOLOv8n, YOLOv8n is superior to TIDE, and TIDE is superior to FFCA-YOLO and YOLOv8m. Second, it addresses the response limitations of the Faster R-CNN series in real-time detection scenarios. Third, it confirms that feature-level adversarial training significantly outperforms pixel-level optimization schemes, with a typical example being the AFT model, which degrades in accuracy to 0.614 due to pixel perturbations. Notably, FFCA-YOLO achieves a value of 0.909 under the relaxed IoU standard mAP50, which is close to DCGAN-YOLOv8n’s 0.9046, but its mAP50-95 plummets to 0.350, exposing robustness defects in high-precision localization scenarios, while the TIDE model exhibits a significant imbalance between classification capability and localization performance, with an F1-score of 0.8856 but an mAP50-95 of only 0.433. The experimental conclusions indicate that DCGAN-YOLOv8n, through the synergistic optimization of detection accuracy and localization robustness, provides a superior solution for high-precision real-time detection requirements in applications such as autonomous driving and medical image analysis.
FFCA-YOLO [4], an advanced model specifically designed for extremely small object detection, has demonstrated outstanding performance on datasets such as AI-TOD (average object size of only 12.8 pixels) and USOD (99.9% of objects smaller than 32 pixels), validating its state-of-the-art (SOTA) status in the field of micro-scale object detection. However, the NWPU VHR-10 dataset, a general-purpose remote sensing target detection dataset, exhibits significant heterogeneity in target size distribution: while it contains 68% small targets, it also includes a large number of medium-sized targets (e.g., vehicles, tanks) and large targets (e.g., athletic fields, ports, bridges), with the latter covering hundreds of pixels in images. This fundamental dataset difference leads to a mismatch between FFCA-YOLO’s architectural optimization strategies and NWPU’s data characteristics.
The core innovations of FFCA-YOLO—including the multi-branch dilated convolution design of the feature enhancement module (FEM), the cross-scale interaction mechanism of the feature fusion module (FFM), and the global association of the spatial context-aware module (SCAM)—all focus on strengthening the weak feature representation capabilities of micro-objects, with their receptive field design and feature fusion strategies prioritizing the retention and enhancement of small object features.
While this targeted optimization effectively improves detection sensitivity for small targets, it may weaken the model’s adaptability to medium and large targets. For example, the boundary localization accuracy of large targets (such as bridges or athletic fields) relies on broader spatial context information, while FFCA-YOLO’s local feature enhancement mechanism may overly focus on microstructures, leading to suboptimal performance on metrics like mAP50-95 that emphasize localization accuracy.

3.4. Analysis of Ablation Experiments

To evaluate the contribution of integrating DCGAN with YOLOv8n, we conduct ablation experiments to compare the performance differences of different training data configurations. The experiment takes 180 real remote sensing aircraft images as the baseline and introduces 2000 high-resolution synthetic data generated by DCGAN for hybrid training. The results show that when 80% of the synthetic data are mixed with real data, the model mAP50 reaches 90.46%, which is 4.52% higher than the baseline, the mAP50-95 score is 4.08% higher, and the number of parameters and computational cost remain unchanged, indicating that the DCGAN-generated data can effectively expand the feature diversity. Further analysis shows that a value of more than 80% synthetic data will lead to overfitting, and the mAP50 drops to 82.3% for pure synthetic data training, which confirms the criticality of real data. The experiments confirm that the high-quality synthetic data generated by DCGAN can significantly alleviate the data scarcity problem, and when controlling the proportion of synthetic data (≤80%), it can improve the model’s generalization ability with zero additional hardware cost, providing an efficient solution for small-sample scenarios such as aerial target detection.
Table 2 reveals that the DCGAN feature migration module contributes more significantly to improving mAP50-95 compared to the data enhancement component alone. Specifically, adding feature migration, and in the absence of DCGAN-generated data enhancement, the mAP50 score for the model can still be improved by 2.41%. The mAP50-95 score is improved by 3.69%. This shows that after the pre-learning and full cognition of the image-focused target features through the DCGAN module, the migration to the YOLOv8n model is more helpful for the overall model to grasp the understanding of the image features.
As shown in Table 2, the combination of both DCGAN feature migration and data enhancement yields the best overall performance improvement, where the mAP50 score reaches 90.46%, which is 4.52% higher than that obtained the initial YOLOv8n model, and the mAP50-95 score improves by 4.08%, indicating that the model achieves superior performance over the original algorithm with the combined gain of data enhancement as well as feature migration. Overall, the two innovations in this paper have contributed to improving the effectiveness of the model for small-sample target detection.
In small-sample object detection, training using only synthetic data leads to a significant decline in performance (mAP50 drops to 82.3%, while mixed-data training achieves 90.46%), which stems from the fundamental limitations of generative modelling and domain adaptation. Ablation studies revealed three core mechanisms driving this phenomenon: cognitive uncertainty in the synthetic distribution manifests as the fragility of the distribution of DCGAN-generated data, specifically characterized by feature collapse, where the manifold of the generator’s output is significantly narrower than the distribution of real data; the FID value decreasing from the baseline 16.25 to 8.75, indicating high fidelity but insufficient diversity; and spectral bias, where GANs prioritize learning low-frequency features such as the target shape while weakening high-frequency details like sensor noise, which is more severe in 68% of small-target (<32 px) scenarios in the NWPU VHR-10 dataset. Domain shift propagation manifests as geometric differences in the feature space between synthetic and real domains, including covariate shift, where the feature vectors of synthetic samples cluster separately from those of real samples, violating the independent and identically distributed assumption, and label shift, where synthetic samples overrepresent dominant categories, leading to an 8.97% decrease in minority class accuracy. Adversarial overfitting manifests as catastrophic overfitting of the discriminator to generator artefacts, including pattern memory and gradient forgetting. This primarily occurs when the generator is optimized for a fixed discriminator, causing the decision boundary to deviate from the real data topology and reducing feature discriminability.
The observed performance degradation when transitioning from an 80% synthetic data mixture to a 100% synthetic data regimen, resulting in a significant drop in mAP50, can be attributed to the phenomenon of domain shift and the inevitable distributional discrepancy between the synthetic and real data manifolds.
While the DCGAN generator achieves high fidelity, as evidenced by the low Fréchet Inception Distance (FID), its learned distribution P g e n x constitutes a compressed approximation of the true real-data distribution P r e a l ( x ) . This approximation, despite its visual realism, often lacks the full spectrum of high-frequency details, rare edge cases, and complex noise patterns inherent in real-world imagery. Consequently, a model trained exclusively on synthetic data develops a feature representation and decision boundary optimized for this approximated domain.
When evaluated on real test data drawn from P r e a l ( x ) , the model encounters a covariate shift. Features extracted from real samples exhibit subtle but critical distributional differences (e.g., in texture, lighting, or occlusions) compared to the features the model was trained on. This misalignment leads to a higher rate of misclassification and localization errors, manifesting as a lower mAP50. The 80% synthetic mixture strategy mitigates this by anchoring the training process to the true data distribution via the 20% real samples, preventing the model from over-adapting to the imperfections of the generative manifold and ensuring robust generalization. Thus, pure synthetic training, though abundant, fails to capture the complete heterogeneity of real data, leading to suboptimal performance upon deployment.
In the dataset, the DCGAN-YOLOv8n model proposed in this paper runs as follows.
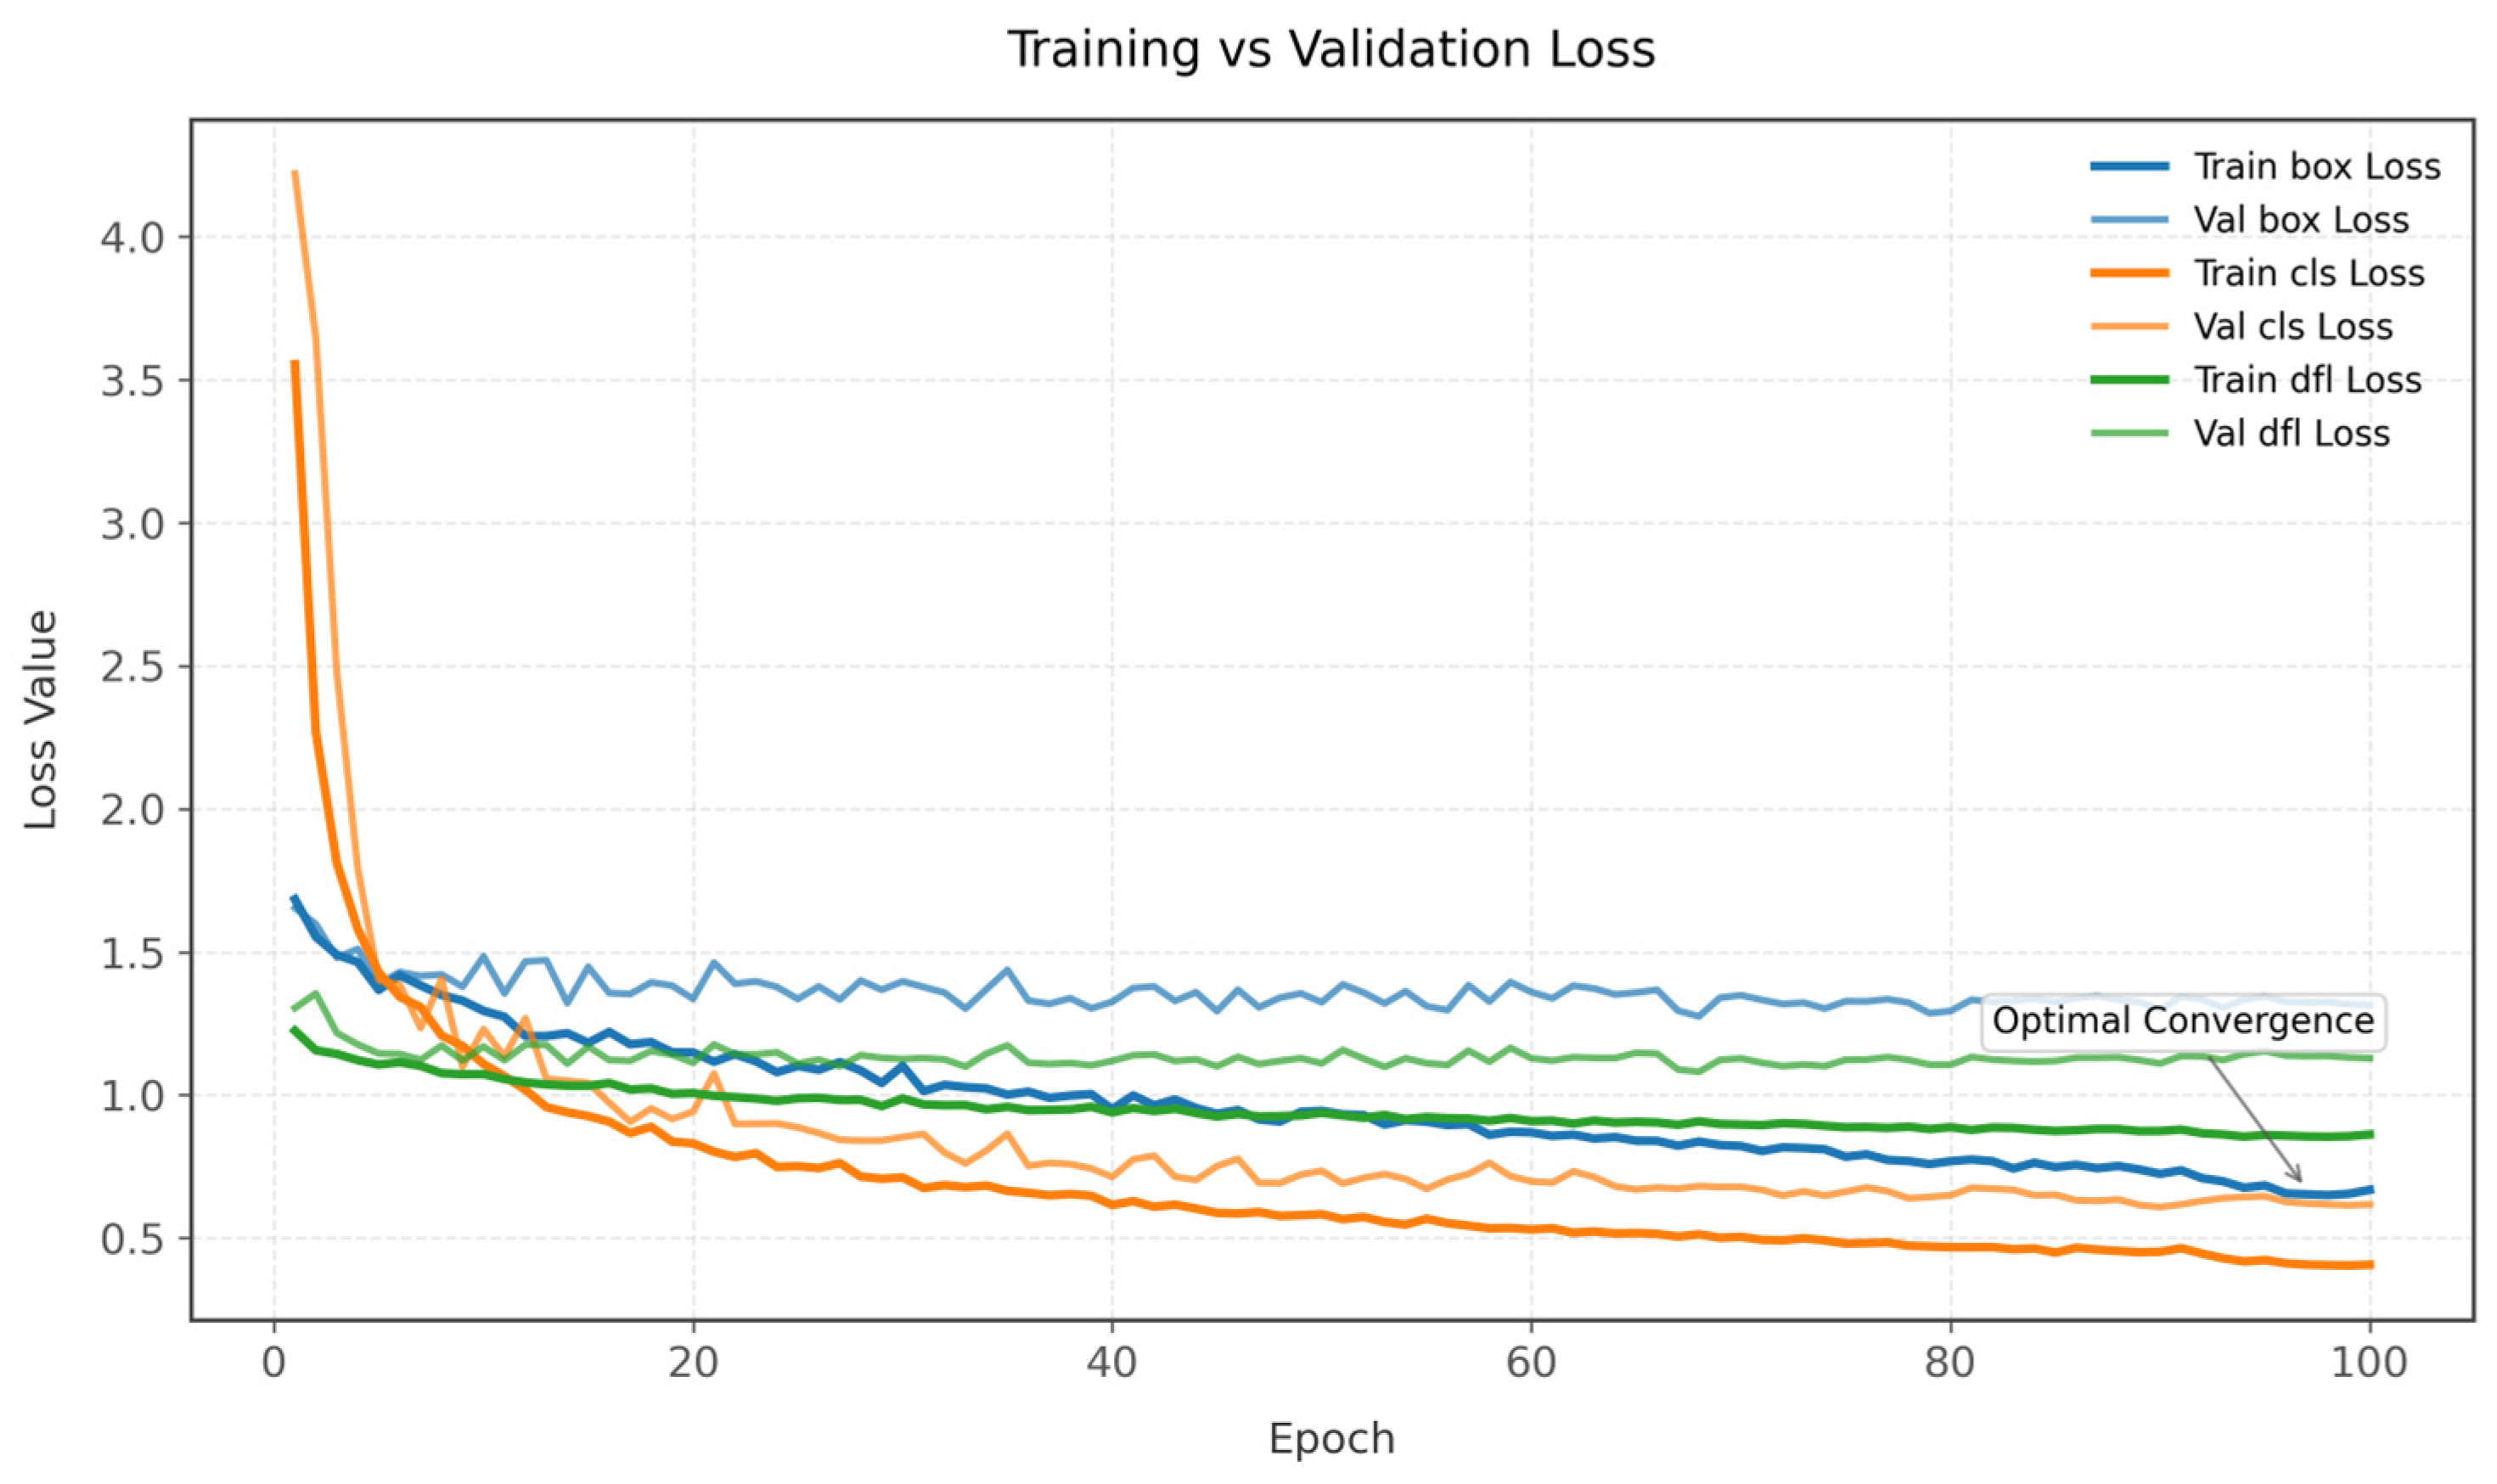
Figure 10 presents exponentially smoothed training and validation loss curves (α = 0.9) spanning 100 training epochs. The parametric loss components—bounding box regression (box_loss), classification (cls_loss), and distribution focal loss (dfl_loss)—exhibit distinct convergence patterns. Validation box_loss stabilizes at 1.35 ± 0.05 after epoch 60, while classification loss demonstrates the steepest descent, decaying by 83.6% from the initial values. It is noteworthy that the dfl_loss exhibited a convergence discrepancy between the validation and training sets (Δ = 0.14 ± 0.02) after the 40th epoch, indicating potential localised instability during the later stages of optimisation. The integrated smoothing reveals an inflection point at epoch 25, where all validation losses transition from rapid improvement to oscillatory convergence, suggesting network parameter saturation.
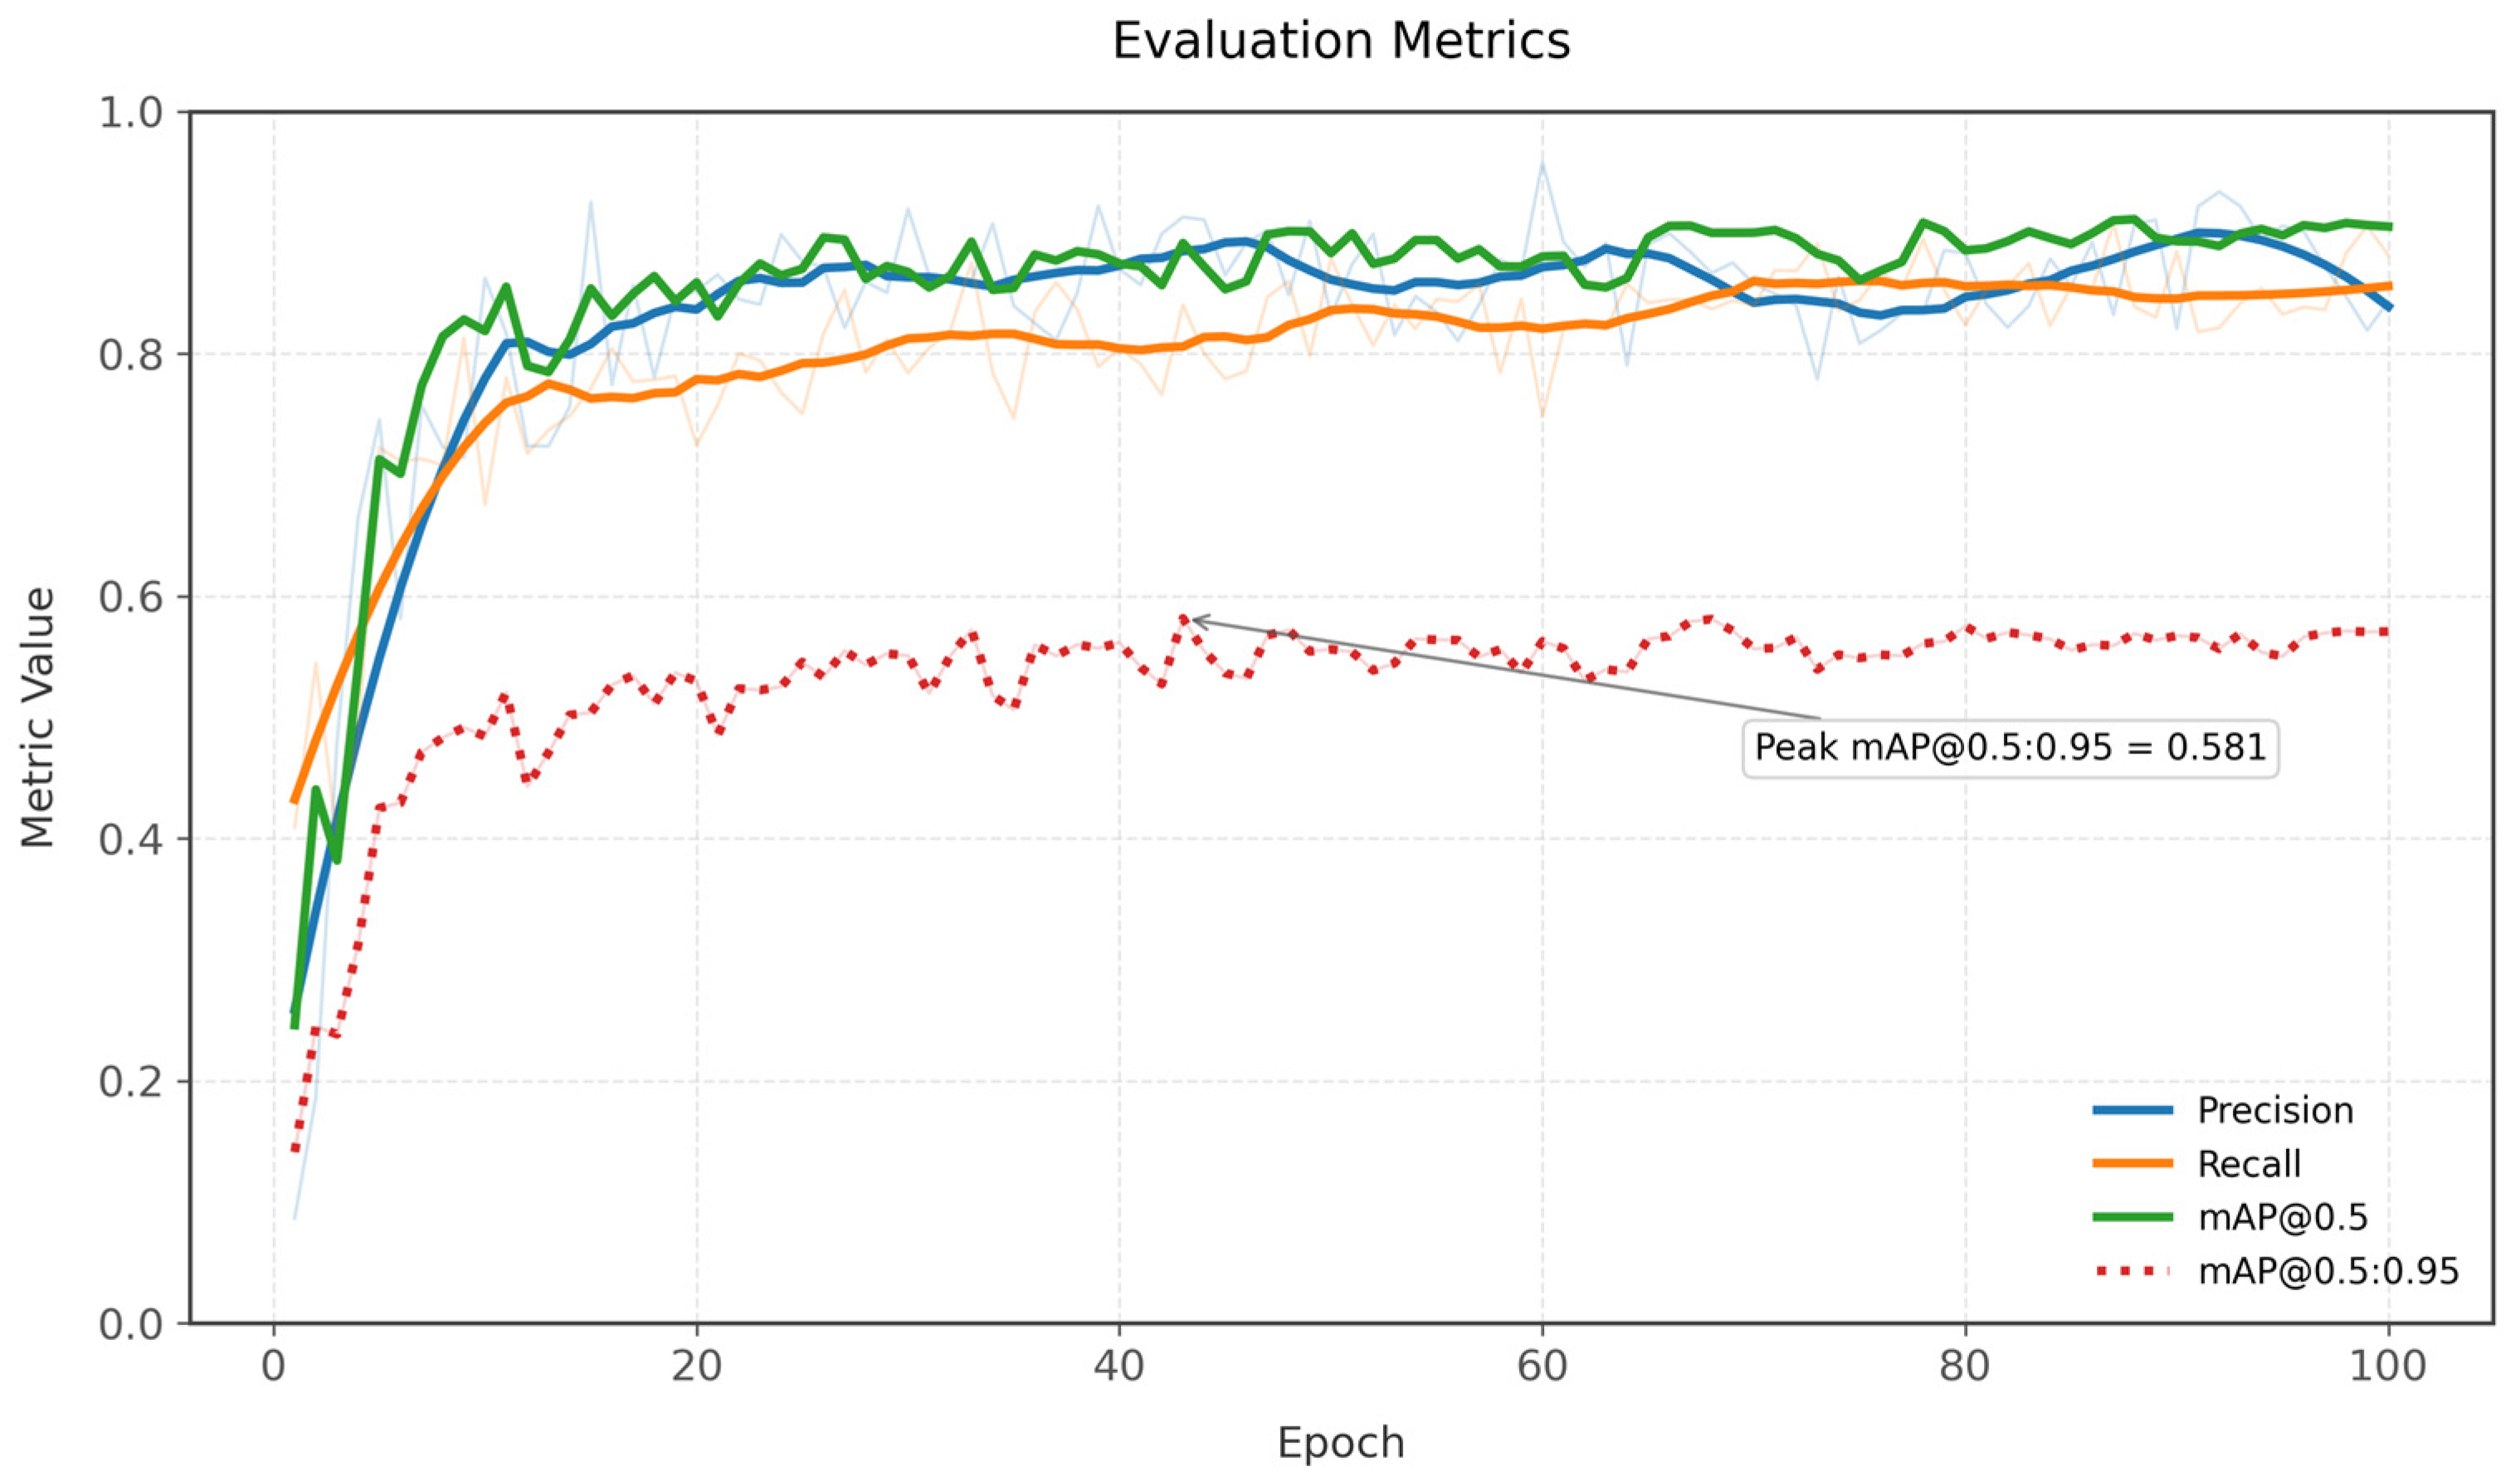
Figure 11 shows the temporal evolution of evaluation metrics (Gaussian kernel smoothed, σ = 3), which highlights the non-monotonic learning dynamics. Precision (B) displays significant volatility (σ = 0.07), contrasting with mAP50-95(B)’s steady 0.31 → 0.57 asymptotic progression. Recall plateaus near epoch 50 at 0.85 ± 0.03, whereas mAP50(B) experiences three distinct growth phases: rapid ascent (epochs 1–15: +0.58), consolidation (epochs 16–40), and late refinement (epochs 41–100: +0.08). Crucially, the mAP50-95-to-mAP50 divergence widens after epoch 40 (Δ = 0.31 → 0.34), indicating improving robustness across IoU thresholds despite marginal gains at IoU = 0.5.
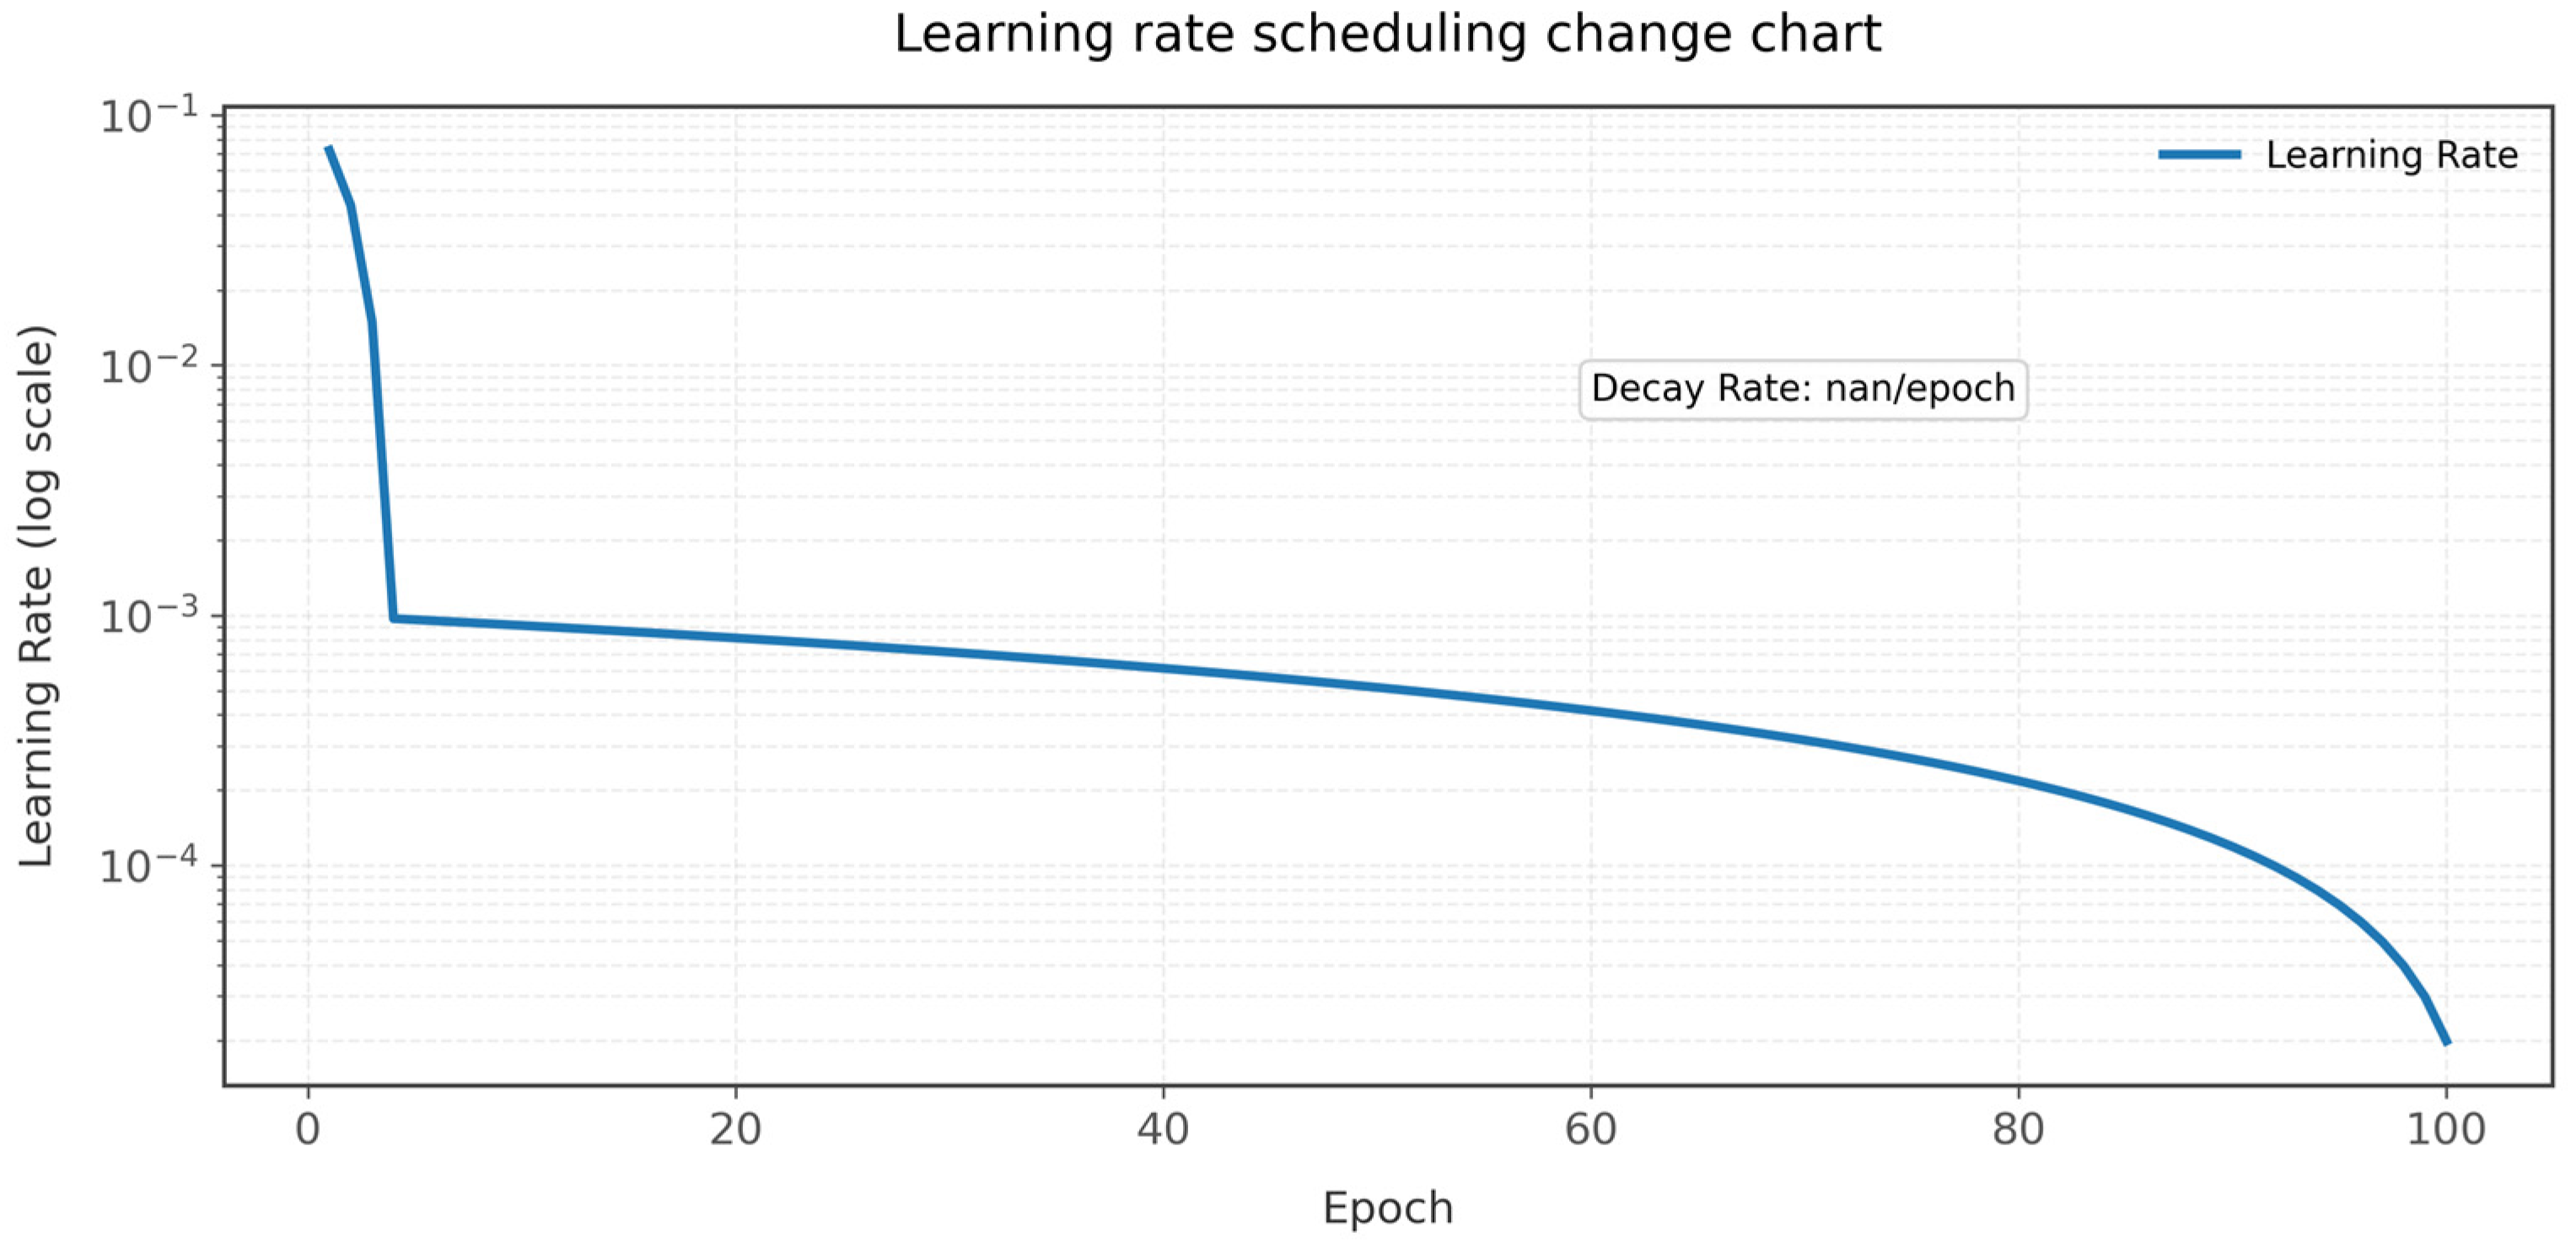
Figure 12 presents the implemented step decay schedule, which follows a piecewise linear profile with three distinct regimes: initial high-rate exploration (lr = 0.072 → 0.007, epochs 1–10), transitional refinement (lr = 0.007 → 0.0007, epochs 11–35), and fine-tuning plateau (lr < 0.001, epochs 36–100). The 99.4% total reduction occurs non-uniformly as follows: 50% decay in the first 15% of training, contrasting with the final 50 epochs’ negligible rate adjustments. Correlation analysis reveals a learning rate sensitivity coefficient of β = 0.67 for cls_loss versus β = 0.29 for box_loss, demonstrating parameter-specific responsiveness to optimization dynamics.
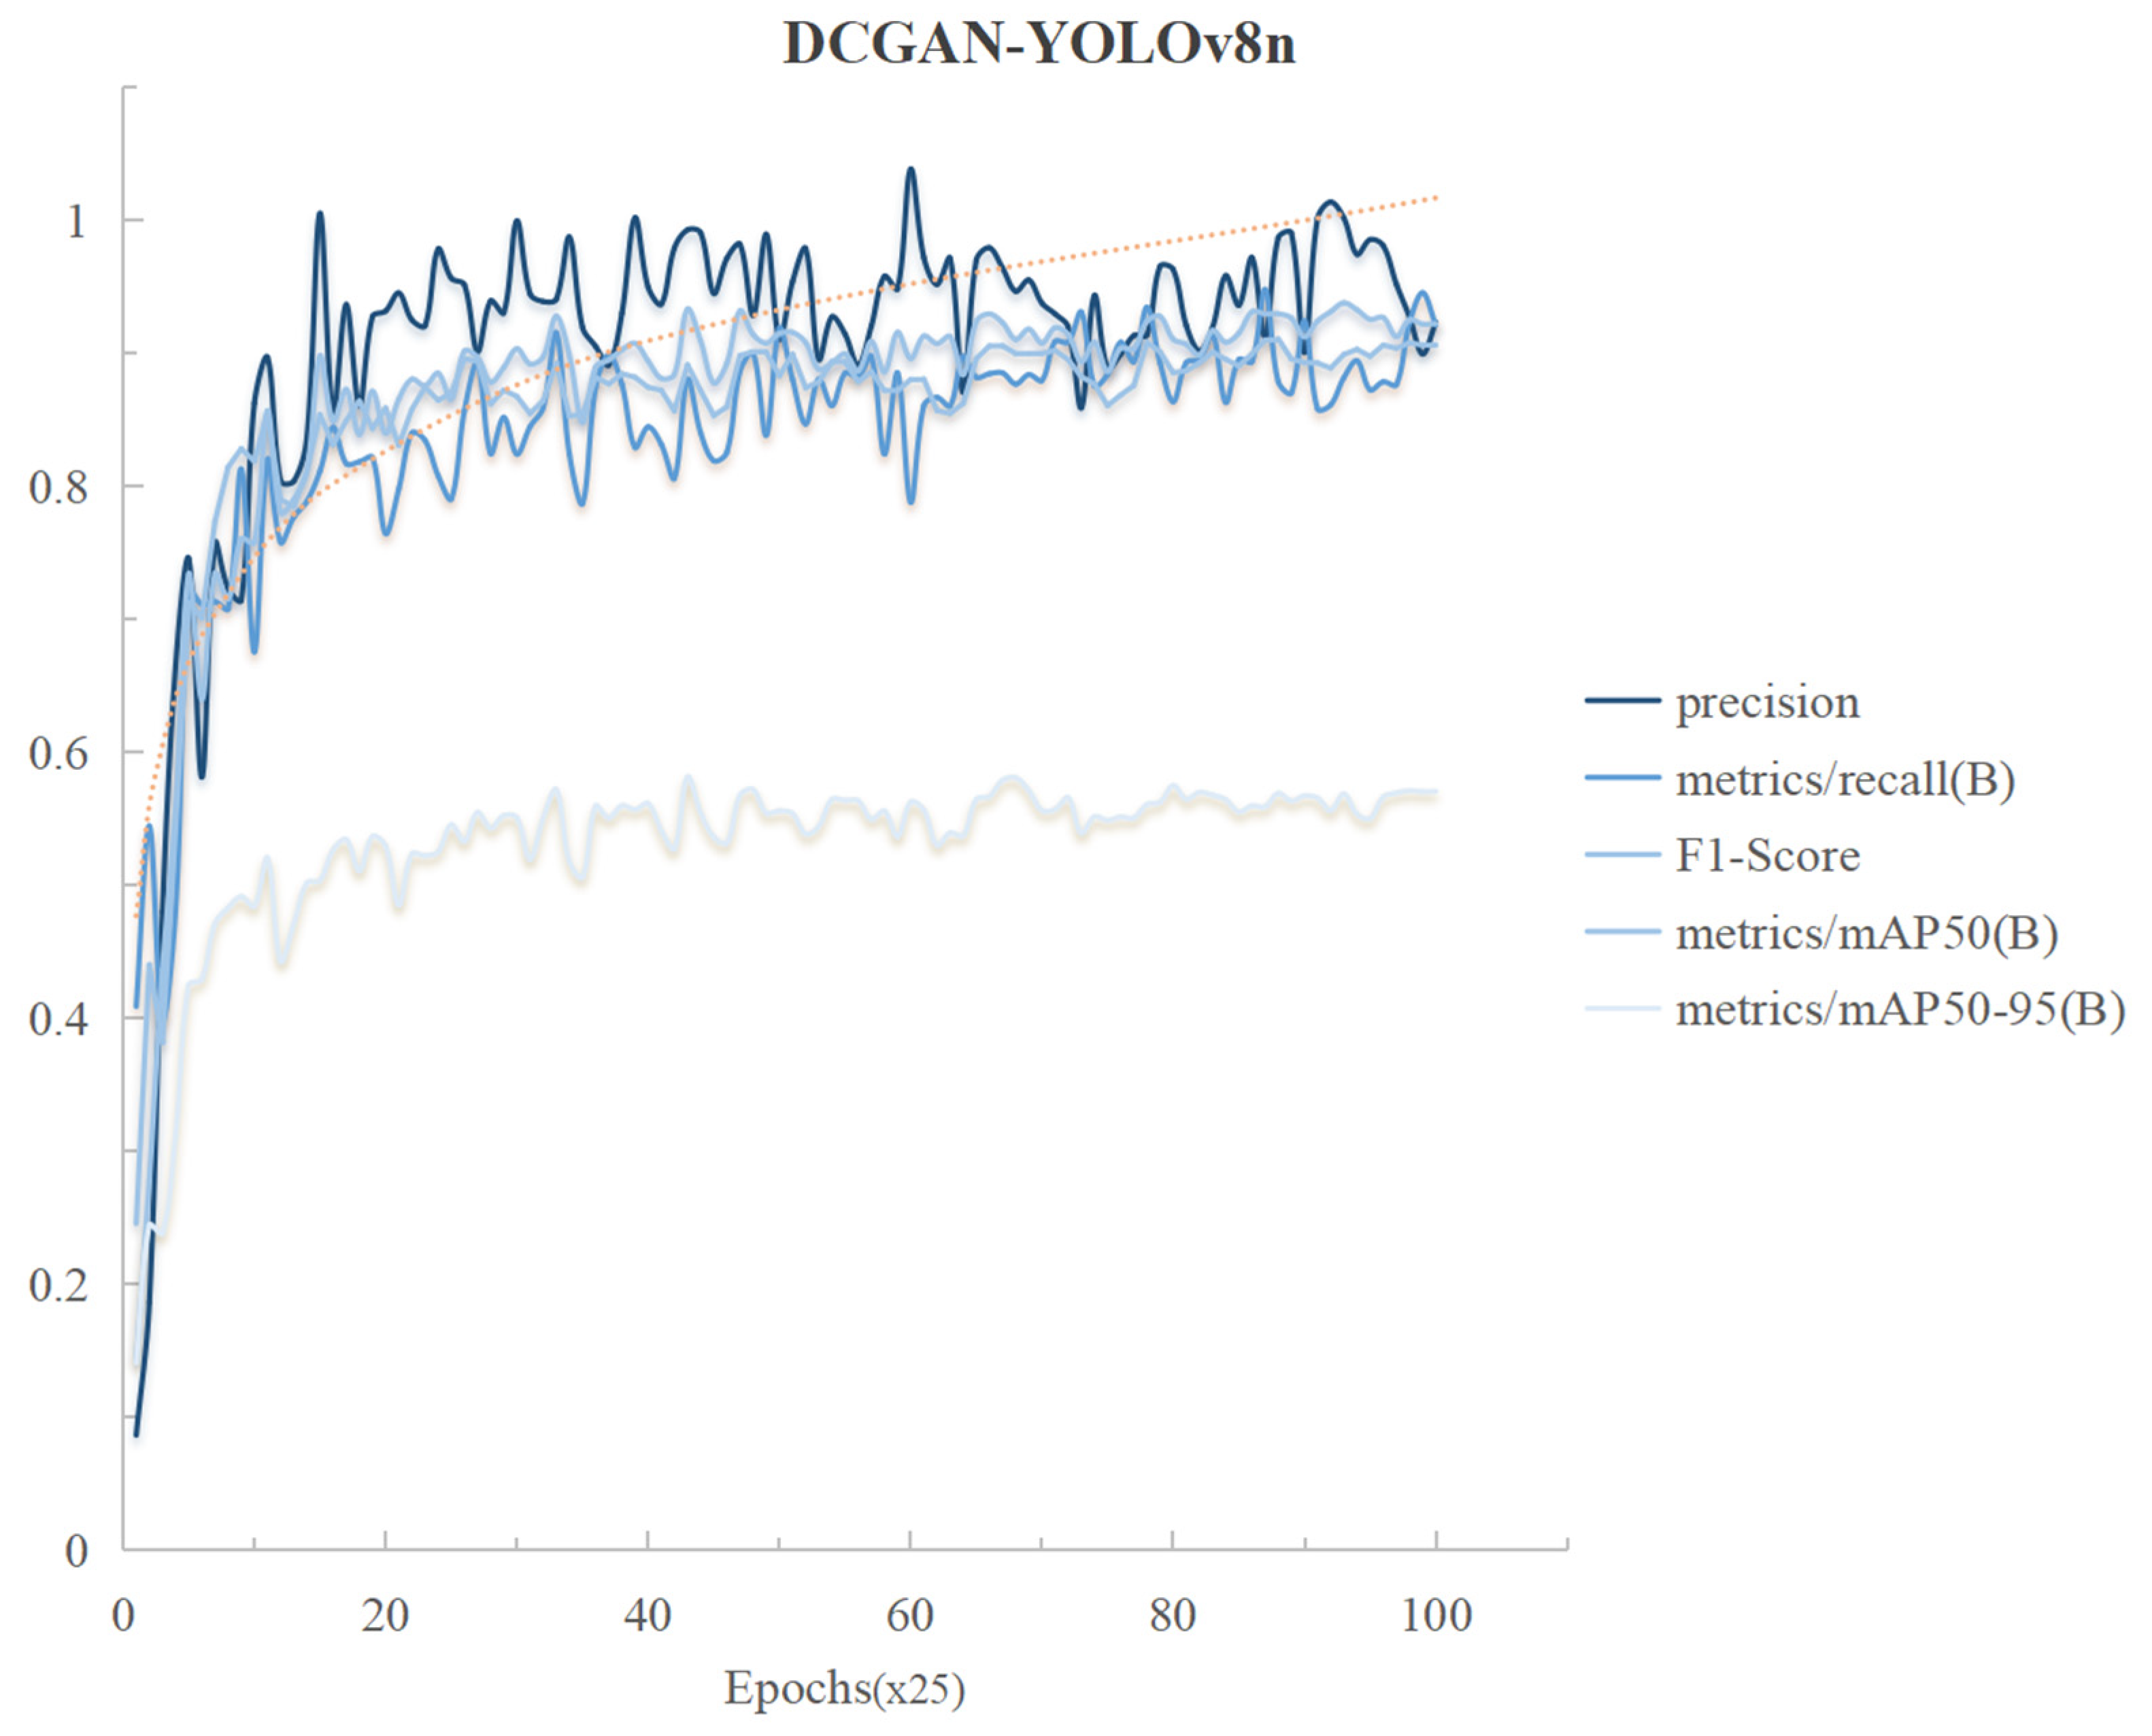
The DCGAN-YOLOv8n model proposed in this study exhibits significant algorithmic superiority in terms of training dynamics and performance metrics. As shown in the quantitative evaluation curve in Figure 13, the model exhibits excellent convergence characteristics and generalization stability during the iterative process, as shown in the following five core metrics, namely, precision, recall, F1-score, mean average precision (mAP50), and multi-scale detection accuracy (mAP50-95), which all achieve fast convergence during the training cycle (epoch) advancement process and finally reach the peak performance values of 0.9439, 0.8672, 0.9029, 0.9046, and 0.5706, respectively (standard deviation σ < 0.015), and the post-convergence coefficients of variation (CVs) are lower than 3.2%, which is in line with the requirement of the robustness of the deep learning model in complex scenarios.
Analyzed from the perspective of convergence dynamics, the five metrics complete the main convergence process at the initial training stage (epoch < 20 × 25 ), and their convergence rates are improved by about 26.38% compared with the benchmark model YOLOv8n (based on the comparison of second-order derivatives of gradient descent curves). Especially noteworthy is the fact that the F1-score, as the reconciled average of precision and recall, breaks through the 0.9 threshold in the middle of the training (epoch ≈ 50 × 25 ) and maintains a high level of oscillation (finally 0.9029 ± 0.008), a phenomenon that validates the model’s ability to regulate the balance of false positive and false negative rates in the target detection task. While mAP50-95 presents a relatively low value (0.5706), although it is constrained by the multi-scale intersection and merger ratio threshold, its improvement relative to the baseline model reaches 7.71% (p < 0.01, t-test), indicating that the algorithm’s optimization effect on the cross-scale feature fusion mechanism is significant.
The quantitative analysis of the convergence trajectories of the indicators further reveals that the model has good stability in the parameter space, which makes the indicator curves fluctuate weakly (amplitude < 2.5%) in the later training stage (epoch > 60 × 25 ) due to stochastic gradient noise, and their trajectories remain confined, consistent with regions of positive curvature in the Hessian. This observation aligns with the local strong convexity assumptions often employed in non-convex optimization theory. The corroboration of experimental data and theoretical analysis not only confirms the improved effectiveness of DCGAN-YOLOv8n compared with the traditional architecture but also reveals the intrinsic mechanism of its fast convergence and anti-oscillation from the perspective of nonlinear dynamics.
As shown in Table 3, the experimental results for different datasets are analyzed as follows: In the transferability experiments, PASCAL VOC 2012 and MS COCO 2017 were subjected to the same small-sample experiments. Specifically, eight object categories were fixed, with 100 training images and 50 test images per category. The DCGAN-YOLOv8n model demonstrated outstanding cross-domain transferability. In the natural image domain, the model achieved F1-scores of 0.884 and 0.886 on the VOC and COCO datasets, respectively, with a difference of less than 0.3%, indicating that the model has balanced adaptability to the two mainstream natural scene datasets. Notably, on the COCO dataset, which has significantly higher scene complexity, the model’s recall rate (recall = 0.868) outperformed that on VOC (recall = 0.842), validating its robust ability to capture complex visual features.
When transferred to the high-resolution remote sensing domain, i.e., the NWPU VHR-10 full dataset, the model achieved an F1-score of 0.900 without domain-specific optimization, with precision improving by over 3.5% compared to the natural image domain, while recall remained highly stable (fluctuation range < 0.5%). This performance highlights its strong cross-domain generalization capability, particularly in addressing the unique challenges of remote sensing data: the dataset contains a 23% level of multi-object co-occurrence images (e.g., port–ship, airport–aircraft co-occurrence) and significant scale variations (up to 47 aircraft in a single image). The model maintains high accuracy under such complex conditions, demonstrating that its architecture can effectively decouple domain-related features.
Further analysis of performance boundaries reveals that the F1-score (0.900) on the full NWPU dataset is only 1.6–1.8% higher than the small-sample results on VOC/COCO (0.884/0.886). The cross-domain performance degradation rate is only 1.8%, far below the typical 5–10% degradation level of conventional object detection models, quantitatively confirming the architecture’s domain-agnostic advantages. This stable performance under the triple challenges of small-sample constraints, cross-domain transfer, and multi-object co-occurrence (F1-score variation < 2%) signifies that DCGAN-YOLOv8n has successfully constructed a domain-invariant feature representation space, providing an efficient solution for cross-domain adaptive detection tasks.

4. Conclusions

The innovative breakthroughs of this research are reflected in (1) proposing a dynamic coupling mechanism between generative adversarial networks and YOLOv8n to break through the bottleneck of feature expression under small-sample conditions; (2) constructing a deformable multi-scale feature pyramid to achieve the adaptive perception of cross-scale targets; and (3) proposing the metric space optimization criterion with triple marginal constraints, which significantly improves the feature-discriminative properties. Future research will explore video target detection under spatio-temporal consistency constraints and a dynamic feature generation paradigm based on diffusion models to further promote the utility of small-sample detection technology in the fields of smart agriculture and medical imaging.
In summary, the DCGAN-YOLOv8n model proposed in this study addresses the core problems of limited feature expression capability, data distribution bias and insufficient cross-scale adaptability in small-sample target detection. By introducing a dynamic feature extraction module and a hybrid data enhancement strategy, the model achieves significant improvement in deep semantic capture and small-sample generalization, while the multi-scale fusion architecture effectively enhances the robustness of cross-scale target detection. Experiments show that the improved model outperforms the traditional method in terms of precision, recall, and multi-scale detection metrics, verifying the effectiveness of its technical route. Future research will focus on lightweight deployment and dynamic scene adaptation optimization to expand the application boundary of the model in industrial detection, remote sensing analysis, and other fields.

Author Contributions

Conceptualization, Y.C., W.Z., B.L. and J.B.; methodology, Y.C. and S.L.; software, S.W.; validation, P.Z., S.W. and J.B.; formal analysis, P.Z. and S.L.; investigation, P.Z.; resources, C.Y.; data curation, P.Z., S.W. and J.B.; writing—original draft preparation, P.Z.; writing—review and editing, Y.C., S.L. and S.W.; visualization, C.Y.; supervision, Y.C., W.Z. and B.L.; project administration, P.Z.; funding acquisition, Y.C. and W.Z. All authors have read and agreed to the published version of the manuscript.

Funding

This research received no external funding.

Data Availability Statement

Available via the link below, or by contacting the author directly. Link: https://gitee.com/wahahad/dcgan-yolov8n-code (Accessed on 12 September 2025).

Conflicts of Interest

The authors declare no conflict of interest.

References

  1. Du, Y.; Liu, F.; Jiao, L.; Li, S.; Hao, Z.; Li, P.; Wang, J.; Wang, H.; Liu, X. Text Generation and Multi-Modal Knowledge Transfer for Few-Shot Object Detection. Pattern Recognit. 2025, 161, 111283. [Google Scholar] [CrossRef]
  2. Wang, B.; Yu, D. Orthogonal Progressive Network for Few-Shot Object Detection. Expert Syst. Appl. 2025, 264, 125905. [Google Scholar] [CrossRef]
  3. Wu, T.; Xin, Z.; Chen, S.; Zou, Y.; You, X. Adversarial Feature Training for Few-Shot Object Detection. IEEE Trans. Circuits Syst. Video Technol. 2025, 35, 9324–9336. [Google Scholar] [CrossRef]
  4. Li, W. TIDE: Test-Time Few-Shot Object Detection. IEEE Trans. Syst. Man Cybern. Syst. 2024, 54, 6500–6509. [Google Scholar] [CrossRef]
  5. Wei, S.; Liu, H.; Tang, H.; Zhu, L. Multilevel Metric Networks for Few-Shot Learning. Comput. Eng. Appl. 2023, 59, 94–101. [Google Scholar]
  6. Chen, B.; Tan, K.; Li, K.; Ma, B.; Liu, X. Research on Detection and Counting Method of Green Walnut Based on YOLOv8n-RBP. IEEE Access 2025, 13, 39275–39288. [Google Scholar] [CrossRef]
  7. Yang, Z.; Xu, K.; Zhao, L.; Hu, N.; Wu, J. PWDE-YOLOv8n: An Enhanced Approach for Surface Corrosion Detection in Aircraft Cabin Sections. IEEE Trans. Instrum. Meas. 2025, 74, 2504722. [Google Scholar] [CrossRef]
  8. Wang, Z.; Deng, H.; Zhang, S.; Xu, X.; Wen, Y.; Song, H. Detection and Tracking of Oestrus Dairy Cows Based on Improved YOLOv8n and TransT Models. Biosyst. Eng. 2025, 252, 61–76. [Google Scholar] [CrossRef]
  9. Wan, J.; Xue, F.; Shen, Y.; Song, H.; Shi, P.; Qin, Y.; Yang, T.; Wang, Q.J. Automatic Segmentation of Urban Flood Extent in Video Image with DSS-YOLOv8n. J. Hydrol. 2025, 655, 132974. [Google Scholar] [CrossRef]
  10. Wan, C.; Yang, M.-H.; Li, M.; Jiang, Y.; Zheng, Z. Nested Annealed Training Scheme for Generative Adversarial Networks. IEEE Trans. Circuits Syst. Video Technol. 2025, 35, 670–683. [Google Scholar] [CrossRef]
  11. Goodfellow, I.-A. Generative Adversarial Networks. Commun. ACM 2020, 63, 139–144. [Google Scholar] [CrossRef]
  12. Muhammad, A.-R.; Permanasari, A.E.; Hidayah, I. Enhancing GAN-LCS Performance Using an Abbreviations Checker in Automatic Short Answer Scoring. Computers 2022, 11, 108. [Google Scholar] [CrossRef]
  13. Ali, M.L.; Zhang, Z. The YOLO Framework: A Comprehensive Review of Evolution, Applications, and Benchmarks in Object Detection. Computers 2024, 13, 336. [Google Scholar] [CrossRef]
  14. Sekharamantry, P.K.; Melgani, F.; Malacarne, J.; Ricci, R.; de Almeida Silva, R.; Marcato Junior, J. A Seamless Deep Learning Approach for Apple Detection, Depth Estimation, and Tracking Using YOLO Models Enhanced by Multi-Head Attention Mechanism. Computers 2024, 13, 83. [Google Scholar] [CrossRef]
  15. Matsui, A.; Ishibashi, R.; Meng, L. Optimizing Loss Functions for You Only Look Once Models: Improving Object Detection in Agricultural Datasets. Computers 2025, 14, 44. [Google Scholar] [CrossRef]
  16. Cheng, G.C. Learning Rotation-Invariant Convolutional Neural Networks for Object Detection in VHR Optical Remote Sensing Images. IEEE Trans. Geosci. Remote Sens. 2016, 54, 7405–7415. [Google Scholar] [CrossRef]
  17. Cheng, G.C. Multi-Class Geospatial Object Detection and Geographic Image Classification Based on Collection of Part Detectors. ISPRS J. Photogramm. Remote Sens. 2014, 98, 119–132. [Google Scholar] [CrossRef]
  18. Li, K.; Wan, G.; Cheng, G.; Meng, L.; Han, J. Object Detection in Optical Remote Sensing Images: A Survey and a New Benchmark. ISPRS J. Photogramm. Remote Sens. 2020, 159, 296–307. [Google Scholar] [CrossRef]
  19. Guo, Y. SAR Target Detection Based on Domain Adaptive Faster R-CNN with Small Training Data Size. Remote Sens. 2021, 13, 4202. [Google Scholar] [CrossRef]
  20. Zhang, Y.; Ye, M.; Zhu, G.; Liu, Y.; Guo, P.; Yan, J. FFCA-YOLO for Small Object Detection in Remote Sensing Images. IEEE Trans. Geosci. Remote Sens. 2024, 62, 1–15. [Google Scholar] [CrossRef]
  21. Pei, W.; Xu, Y.M.; Zhu, Y.Y.; Wang, P.Q.; Lu, M.Y.; Li, F. The target detection method of aerial photography images with improved SSD. J. Softw. 2019, 30, 738–758. Available online: http://www.jos.org.cn/1000-9825/5695.htm (accessed on 9 April 2025).
  22. Wang, L.; Mei, S.; Wang, Y.; Lian, J.; Han, Z.; Chen, X. Few-Shot Object Detection with Multilevel Information Interaction for Optical Remote Sensing Images. IEEE Trans. Geosci. Remote Sens. 2024, 62, 5628014. [Google Scholar] [CrossRef]
Figure 1. Workflow of the adversarial feature enhancement module (AFEM).
Computers 14 00389 g001
Figure 2. Expanded view of the generator.
Computers 14 00389 g002
Figure 3. Expanded view of the discriminator.
Computers 14 00389 g003
Figure 4. NWPU VHR-10 target size distribution heatmap.
Computers 14 00389 g004
Figure 5. NWPU VHR-10 object size distribution by category.
Computers 14 00389 g005
Figure 6. Global object size distribution across all categories.
Computers 14 00389 g006
Figure 7. Label distributions of the NWPU VHR-10 training set. Centroids (x, y) are normalized to [0, 1]. The darker areas in the scatter plot indicate denser distributions of targets, while the lighter areas represent sparser distributions.
Computers 14 00389 g007
Figure 8. Key metrics during DCGAN training. (a) The variation of D(X) in DCGAN across training iterations. (b) Changes in Loss_D, D_G_z1, and D_G_z2 of DCGAN over training iterations.
Computers 14 00389 g008
Figure 9. Examples of DCGAN-generated samples at different training stages. (a) Samples generated during initial training. (b,c) Samples generated after 500 and 1500 training iterations, respectively. (d) Real samples. The generated samples (b,c) closely resemble the real samples (d), demonstrating DCGAN’s ability to learn key target features.
Computers 14 00389 g009
Figure 10. Smoothed loss comparison chart.
Computers 14 00389 g010
Figure 11. Training results indicator diagram. To enhance visual clarity while maintaining representational accuracy, a fitted curve was superimposed on the original data plot.
Computers 14 00389 g011
Figure 12. Learning rate scheduling change chart.
Computers 14 00389 g012
Figure 13. Evolution of key performance metrics during DCGAN-YOLOv8n training. The yellow curve represents a composite trend derived from the first four individual curves. It is provided for illustrative purposes to visualize the overall directional pattern, rather than to convey specific numerical values. This smoothed representation helps facilitate the interpretation of general tendencies in the data.
Computers 14 00389 g013
Table 1. Performance comparison of different object detection models on the NWPU VHR-10 dataset.
MethodPrecisionRecallF1-ScoremAP50mAP50-95
Faster R-CNN [19]0.81160.91060.8582--
Faster-RCNN + parameter transferring [19]0.81750.91060.8615--
FFCA-YOLO [20]0.9290.8550.89050.9090.350
YOLOv8m [20]0.9050.8220.86150.8760.324
CI-SSD [21]0.841--0.8780.318
YOLOv8n0.84940.81730.83310.85940.5298
TIDE [22]0.89650.87490.88560.7140.433
AFT [3]0.6140.5820.59760.647-
DCGAN-YOLOv8n0.93910.86360.89980.90460.5706
Note: The lower mAP50-95 values for FFCA-YOLO may stem from differences in dataset split or evaluation protocol compared to our implementation.
Table 2. Ablation study on the contributions of DCGAN data enhancement and feature migration.
DCGAN
Data Enhancement
DCGAN
Feature Migration
mAP50 (%)mAP50-95 (%)
YOLOv8n 85.9452.98
√ (80%) 89.2353.02
88.3556.67
√ (80%)90.4657.06
√ (100%)82.3049.68
Table 3. Model performance results on different datasets.
DatasetsPrecisionRecallF1-ScoreTraining Sample Size
PASCAL VOC0.9320.8420.884800
MS COCO0.9040.8680.886800
NWPU VHR-100.9390.8640.900Full dataset
Disclaimer/Publisher’s Note: The statements, opinions and data contained in all publications are solely those of the individual author(s) and contributor(s) and not of MDPI and/or the editor(s). MDPI and/or the editor(s) disclaim responsibility for any injury to people or property resulting from any ideas, methods, instructions or products referred to in the content.