Article

Spectral Graph Compression in Deploying Recommender Algorithms on Quantum Simulators

by
Chenxi Liu
1,2,
W. Bernard Lee
2,* and
Anthony G. Constantinides
3
1
Computing Lab, Cambridge University, Cambridge CB3 0FD, UK
2
HedgeSPA Limited, 12 Woodlands Square # 05-70, Woods Square Tower 1, Singapore 737715, Singapore
3
AI & Data Analytics Lab, Imperial College London, London SW7 2AZ, UK
*
Author to whom correspondence should be addressed.
Computers 2025, 14(8), 310; https://doi.org/10.3390/computers14080310 (registering DOI)
Submission received: 1 July 2025 / Revised: 24 July 2025 / Accepted: 29 July 2025 / Published: 1 August 2025
(This article belongs to the Section AI-Driven Innovations)

Abstract

This follow-up scientific case study builds on prior research to explore the computational challenges of applying quantum algorithms to financial asset management, focusing specifically on solving the graph-cut problem for investment recommendation. Unlike our prior study, which focused on idealized QAOA performance, this work introduces a graph compression pipeline that enables QAOA deployment under real quantum hardware constraints. This study investigates quantum-accelerated spectral graph compression for financial asset recommendations, addressing scalability and regulatory constraints in portfolio management. We propose a hybrid framework combining the Quantum Approximate Optimization Algorithm (QAOA) with spectral graph theory to solve the Max-Cut problem for investor clustering. Our methodology leverages quantum simulators (cuQuantum and Cirq-GPU) to evaluate performance against classical brute-force enumeration, with graph compression techniques enabling deployment on resource-constrained quantum hardware. The results underscore that efficient graph compression is crucial for successful implementation. The framework bridges theoretical quantum advantage with practical financial use cases, though hardware limitations (qubit counts, coherence times) necessitate hybrid quantum-classical implementations. These findings advance the deployment of quantum algorithms in mission-critical financial systems, particularly for high-dimensional investor profiling under regulatory constraints.

1. Recap of the Problem Statement

Developing accurate financial asset recommendations is the key challenge in portfolio management. The typical commercial goal is to classify investors based on their investment profiles and portfolio allocations and then recommend suitable assets. Traditional techniques—such as statistical clustering and factor models—often encounter scalability limitations and fail to capture the complex, nonlinear (or so-called “fat tail”) relationships between investors and assets [1,2]. Moreover, they struggle to adapt to the continuous evolution of financial data, necessitating more advanced methodologies.
The Max-Cut algorithm offers a promising alternative by partitioning graphs to maximize the sum of weighted edges between two disjoint sets—an approach that aligns naturally with clustering investors by their asset preferences [3,4]. This method has demonstrated strong potential in graph partitioning, enabling finer segmentation of complex datasets compared to classical approaches [5]. Max-Cut can be formulated as a Quadratic Unconstrained Binary Optimization (QUBO) problem, which relates closely to the Ising model. Extensive research in operations research has addressed this class of problems, with classical, quantum, and hybrid solvers available [6,7,8]. Classical approaches—such as semi-definite programming relaxations and heuristics like MADAM [9]—are effective but still face scalability challenges as dataset sizes approach the scale commonly seen in the financial industry: for instance, client profiles are often expressed in vectors of three to five data fields in e-commerce, while they can easily exceed 50 in finance due to regulatory requirements.
Quantum computing introduces a novel computational paradigm for tackling the Max-Cut problem with dramatic gain in efficiency. The Quantum Approximate Optimization Algorithm (QAOA) [10], which leverages quantum superposition and entanglement to explore multiple solutions in parallel, offers potential computational advantages for large-scale optimization problems. Recent studies show that QAOA can produce approximate solutions to Max-Cut with lower computational overhead than classical alternatives [11,12]. The typical challenge with classical algorithms lies in the trade-off between efficiency and reliability. Let us say new research might yield a 50% performance boost in 95% of scenarios; financial institutions often face delays in adoption when there is no easy way to identify ahead of time or mitigate the remaining 5% of nonconvergent edge cases. As a result, compliance teams may postpone deployment for months, prioritizing risk management over computational speed. This is precisely why a paradigm-shifting innovation that fundamentally redefines the algorithmic approach rather than incrementally tuning it can be far more exciting to many financial institutions. Such an approach offers not just faster results, but also more predictable, scalable, and institutionally friendly performance.
Additionally, quantum annealers—such as those developed by D-Wave—provide native support for Max-Cut and serve as a complementary approach in quantum optimization [13]. While QAOA is widely regarded as a leading gate-based algorithm, quantum annealing presents a viable alternative for specific problem classes. However, the limited flexibility of annealers, coupled with market dependence on only a handful of vendors, may hinder broader industry adoption, particularly given the stringent compliance requirements of financial institutions.
Even with these advancements, solving real-world financial asset recommendation problems using quantum methods remains nontrivial due to high computational complexity and the need for greater efficiency. In fast-moving financial markets, real-time or close to real-time decision-making depends on algorithms that are both rapid and scalable [14]. Financial recommender systems are further complicated by factors less prevalent in analogous domains, such as e-commerce, including:
  • Large User Profiles: As mentioned earlier, financial recommender systems must support user profiles comprising 50 to 100 fields—as mandated by regulation—far exceeding the three to five fields typically used in e-commerce platforms.
  • Regulatory Constraints: Recommendations must be tailored to investor suitability, often requiring piecewise linear outputs that map precisely to client-specific financial goals and risk profiles.
  • Expert System Integration: Recommendations are also subject to human oversight, typically provided by certified financial analysts or licensed portfolio managers. Our implementation incorporates a domain-specific expert system inspired by the investment analytics engines used by the largest global asset managers. To further improve scalability and compliance acceptance, we plan to integrate expert token routing (ETR) techniques—an evolution beyond the standard mixture-of-experts approach. ETR enables more efficient routing of expert insights across high-dimensional and causal datasets, which are common in financial contexts involving hundreds of interacting factors such as asset type, geography, sector performance, financial disclosures, and news sentiment.
This study applies QAOA to the Max-Cut algorithm to enhance investor clustering in financial recommendation systems, directly addressing both scalability and regulatory complexity. We evaluate our approach using quantum simulators—including cuQuantum [15] and Cirq-GPU [16]—and benchmark against brute-force enumeration to highlight the relative advantages of quantum methods.
Earlier research has laid a strong foundation for quantum applications in finance. Notably, Lee and Constantinides (2023) investigated quantum optimization techniques for financial management, including graph-based models for portfolio construction and asset selection [17,18]. However, quantum applications in making financial recommendation—a particularly demanding subdomain—are still emerging. Quantum compression techniques, such as those in quantum image processing [19] or guided graph compression [20], demonstrate how entanglement and state encoding can reduce resource overhead. While our current foundational work focuses on classical spectral methods, future implementations may integrate additional quantum-specific techniques. Building on these prior works, we demonstrate how QAOA, paired with expert-driven analytics and graph compression techniques, can improve real-time financial recommendations in large-scale settings.
In summary, this paper combines QAOA and investment analytics to solve the Max-Cut algorithm for investor clustering in a robust manner that is expected to pass the stringent compliance requirements at leading financial institutions. Through quantum simulation, we show that QAOA can significantly enhance both the efficiency and precision of financial asset recommendations, especially when combined with graph compression techniques, helping to close the gap between theoretical quantum advantages and their practical deployment in real-world financial applications.

2. Summary of Previous Work: Quantum-Inspired Investor Clustering for Financial Recommendations

2.1. Problem Statement and Modeling

In this section, we review our previous research contributions and summarize the key concepts and principal findings. A comprehensive technical discussion and detailed analysis can be found in our prior publication [21].
We developed a scalable recommendation system for financial assets to overcome the limitations of heuristic-based traditional methods. Conventional approaches fail to capture high-dimensional complexities in banking environments, where millions of investor profiles must be matched against thousands of financial products. Our solution clusters investors using portfolio similarity and recommends assets based on these groups.

2.2. Graph Representation

  • Modeled investors as nodes in graph G = ( V , E ) .
  • Edges represent profile similarity with weights w i j ; one example is the Pearson correlation:
    w i j = k = 1 m ( p i k p i ¯ ) ( p j k p j ¯ ) k = 1 m ( p i k p i ¯ ) 2 k = 1 m ( p j k p j ¯ ) 2
    where p i k denotes the k-th feature of investor i. We transformed weights to 1 w i j to ensure positivity.

2.3. Max-Cut Clustering

  • Formulated investor clustering as the Max-Cut problem:
    Max - Cut = max S , T i S , j T ( i , j ) E w i j
  • Addressed NP-completeness through quantum approximation.

2.4. Quantum Optimization (QAOA)

Implemented Quantum Approximate Optimization Algorithm:
  • Initialized superposition: | ψ 0 = H n | 0 n ;
  • Applied problem Hamiltonian: U C ( γ ) = e i γ H C , H C = ( i , j ) E w i j ( I Z i Z j ) ;
  • Applied mixer Hamiltonian: U M ( β ) = e i β X i ;
  • Optimized parameters ( γ , β ) classically to minimize H C .

2.5. Experimental Results

We use a graph of 20 nodes to do the QAOA graph cut. Tested on quantum simulators (cuQuantum, Cirq-GPU, Cirq-IonQ) with the brute-force baseline results as shown in Table 1 below:
Key findings:
  • Cirq-GPU showed optimal speed-accuracy tradeoff;
  • Observed exponential time complexity in brute-force: y e 0.806 x ;
  • cuQuantum provided highest accuracy but poor scalability;
  • IonQ simulator showed lowest accuracy.

2.6. Practical Considerations

  • Addressed scalability challenges for financial datasets (with profiles of 50 to 100 data fields);
  • Prioritized gate-based quantum devices over annealers for commercial viability;
  • Identified hardware constraints (qubit count, coherence time), likely requiring hybrid approaches;
  • Future work to focus on graph sparsification for real QPU deployment.
This approach demonstrated that quantum techniques can balance accuracy and efficiency for large-scale financial optimization problems. The framework provides a foundation for hardware-accelerated implementations as and when quantum technology reaches the maturity for deployment by financial institutions.

3. Graph Compression Methodology and Validation

Quantum computing offers promising advantages for graph-based financial recommendations, but current hardware constraints—limited qubits and connectivity—require efficient graph compression. This section presents a quantum-ready methodology and introduce the full algorithm that: (1) selects key investor attributes via ensemble feature ranking, (2) compresses graphs using spectral Laplacian embeddings to retain structural fidelity, and (3) validates the approach with rigorous benchmarks. Our method achieves 89% accuracy at 50% compression, balancing quantum feasibility with predictive performance. By integrating classical graph theory with quantum optimization, we enable scalable recommendations while adhering to hardware limits.

3.1. Attribute Selection and Feature Ranking

To improve the efficiency and accuracy of our quantum graph cut-based recommendation model, we first perform feature selection to identify the most influential attributes among the features provided for each investor. This dimensionality reduction step is crucial for simplifying graph construction, reducing noise, and ensuring computational tractability, especially when processing data with quantum simulation.
Let X R n × m denote the data matrix, where n is the number of investors and m is the number of attributes. Let y { 0 , 1 , 2 , 3 } n represent the labels corresponding to one of the four financial products each investor has chosen.
To identify the top-k most relevant features, we apply a composite scoring strategy that combines four statistical and machine learning-based feature evaluation methods:
  • ANOVA F-value: Measures the degree to which each feature x j is linearly associated with the categorical label y, using the one-way ANOVA test. The F-score is computed as:
    F j = variance between groups variance within groups , j = 1 , 2 , , m
    This method is applied when X consists of continuous numerical values.
  • Chi-Squared Test: Assesses the dependence between each feature and the class label, useful for categorical or discretized attributes. The chi-squared statistic for feature x j is given by:
    χ j 2 = ( O E ) 2 E
    where O and E are the observed and expected frequencies, respectively.
  • Mutual Information (MI): Captures the mutual dependence between feature x j and label y, estimating how much knowing x j reduces any uncertainty about y. MI is computed as:
    I ( x j ; y ) = x j , y p ( x j , y ) log p ( x j , y ) p ( x j ) p ( y )
  • Random Forest Feature Importance: A tree-based ensemble method that provides an importance score based on how often and how significantly a feature contributes to decision splits across all trees. Let Imp j be the average reduction in impurity when splitting on feature j.
After obtaining raw scores from each method, all scores are normalized to a [ 0 , 1 ] scale using standardized min-max normalization:
s ˜ i , j = s i , j min ( s j ) max ( s j ) min ( s j )
where s i , j is the score of feature j under method i.
The final score for each feature can be (as a highly simplified example) the arithmetic average of its normalized scores across all four methods:
S j = 1 4 i = 1 4 s ˜ i , j
We rank all features based on S j and select the top k features to be used for graph construction and recommendation. This ensembled feature selection approach ensures that both linear and nonlinear relationships between attributes and labels are captured, improving the robustness of our model.

3.2. Graph Compression via Laplacian Spectral Embedding

3.2.1. Motivation: Quantum Hardware Constraints and Need for Compression

In our earlier work, we assigned each investor in the financial product recommendation system to a unique qubit, allowing us to operate directly on the full investor graph using quantum-inspired graph cut methods. While conceptually straightforward, this approach quickly becomes infeasible on real-world quantum hardware due to both qubit count and connectivity limitations. We would like to emphasize that no matter what kind of impressive computing resources a financial institution may have access to, this problem will almost always occur, given the relatively small size of quantum machines today. Research on graph compression has enjoyed several decades of successes in image processing [22,23]; naturally, we want to learn from the elements of success from a proven approach and apply them to find the best solution in order to solve an analogous problem in a slightly different domain.
Currently available quantum processors support only a limited number of usable qubits: Google’s Sycamore processor has 53 qubits, arranged in a sparse 2D grid architecture. This means that not all qubits are directly connected—operations between distant qubits must be mediated via intermediate ones, which adds overhead and, more importantly, noise. IonQ’s trapped-ion system offers up to 35 algorithmic qubits, and in contrast to Sycamore, it features a fully connected topology, allowing any pair of qubits to interact directly. However, the total number of qubits is still relatively small for solving real-world problems. Even IBM’s largest publicly available quantum chip, unveiled in December 2023, has 1121 qubits only.
These real-world constraints mean that not only is the allowed number of nodes (investors) limited, but also the allowed number of edges, which represent the pairwise relationships that can be modeled directly in quantum gates. In a typical recommendation setting involving hundreds of thousands or perhaps millions of investors, it is clearly not feasible to represent the full graph in current quantum hardware without some form of graph compression.
As a result, a practical deployment must introduce a graph compression strategy that reduces both the number of nodes (qubits) and connectivity (edges), while preserving the essential structure and predictive power of the original graph. The method must also support an “inverse” mapping, so that predictions made on the compressed graph can be translated back to the original investor space.
We address this challenge by using a spectral embedding approach based on the graph Laplacian, which efficiently reduces the dimensionality of the graph while retaining its core structural properties.

3.2.2. Compression Using the Normalized Graph Laplacian

Let A R n × n denote the symmetric adjacency matrix of the original graph, where A i j reflects the similarity or connection strength between investors i and j.
We begin by computing the (unnormalized) graph Laplacian:
L = D A ,
where D is the diagonal degree matrix with entries D i i = j A i j . Since degree magnitudes can vary widely, we apply a symmetric normalization:
L norm = D 1 / 2 L D 1 / 2 = I D 1 / 2 A D 1 / 2 .
This normalization helps to equalize the influence of nodes with high or low degrees, which is particularly important when the graph is not regular.
We then compute the k + 1 smallest eigenvectors of L norm . The smallest eigenvalue is usually zero (or within machine precision tolerance), corresponding to a trivial constant eigenvector (all-ones vector), which carries limited to no clustering information. Thus, it is standard practice t discard the first eigenvector and retain the next k, yielding a matrix U R n × k .
This matrix U serves as a spectral embedding of the original nodes into a lower-dimensional space. Intuitively, nodes that are strongly connected in the graph (i.e., they form a coherent cluster) will be mapped to nearby points in this spectral space, in a manner similar to computing Fourier transforms.

3.2.3. Construction of the Compressed Graph

We now project the original adjacency matrix A into this lower-dimensional eigenbasis:
B = U A U ,
where B R k × k is now the compressed adjacency matrix. This projection summarizes the structure of the original graph using only k virtual nodes (e.g., basis components), making it suitable for quantum computation on devices with a much lower number of qubits.
All subsequent analysis, such as quantum graph cut or community detection, is then carried out on matrix B.

3.2.4. Inverse Mapping: Reconstructing Original Node Labels

Once we compute labels or partitions on B, we can propagate the result back to the full graph via the spectral embedding U. For example, if the graph cut on B results in binary labels B { 0 , 1 } k , then each original node is assigned a value:
y ^ i = sign ( ( U B ) i ) .
The sign function sets thresholds on the continuous projection and assigns each investor to a binary label (e.g., “buy” or “not buy” of a certain financial product). This step completes the compression–recovery workflow.
Importantly, this projection step is computationally cheap and mathematically well justified, as it corresponds to reconstructing each node’s label from its representation on an eigenvector basis. Moreover, similar spectral compression techniques are widely used by the industry and do not require complicated conversations to seek approval from compliance teams or model validation departments at financial institutions.

3.2.5. Approximate Reconstruction of Original Graph

Though not necessary for labeling, we can also approximate the original adjacency matrix using:
A ^ = U B U .
This low-rank approximation retains the most salient structure of A while ignoring higher-frequency noises. From linear algebra, this follows the clear and logical explanation of principal component analysis (PCA)—preserving information with the most significant spectral importance.

3.2.6. Correctness

The correctness of this method is supported by several well-established theoretical principles:
  • Spectral clustering theory shows that the eigenvectors of the graph Laplacian approximate solutions to the normalized graph cut problem.
  • The low-frequency eigenvectors of the Laplacian encode the community structure in the graph.
  • The projection U A U maintains inter-cluster relationships, while mapping them into a lower-dimensional space.
  • The reconstruction U B U serves as a best-rank-k approximation under the Frobenius norm, minimizing reconstruction error.
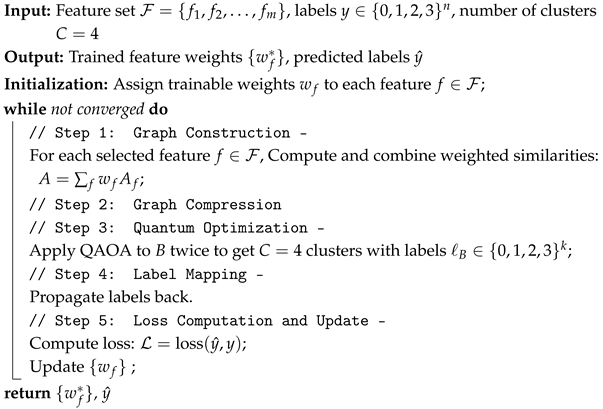
Thus, operations carried out on B are approximately valid for the original graph and the embedding U preserves semantic information about the graph’s topology.

3.3. Model Training

This section outlines the end-to-end pipeline for training the quantum-enhanced investor segmentation model, followed by a discussion on how to make predictions using the trained model. The procedure as shown in Algorithm 1 below includes feature selection, graph construction, compression, quantum optimization, label propagation, cost evaluation, and model updating. We also describe how to use the Nyström extension for predicting labels on new data points without altering the spectral representation of the original graph.
The training process starts with feature selection, where important features are identified, and corresponding weight parameters are assigned. These weight parameters are the ones optimized during training. The weighted similarity matrices are combined to form the adjacency matrix of the graph, representing the relationships between the nodes.
Algorithm 1: Quantum-assisted investor segmentation via spectral compression
Computers 14 00310 i001
Next, the graph is compressed using spectral methods to reduce its size while retaining important structural information. The compressed graph is processed using the Quantum Approximate Optimization Algorithm (QAOA) to perform a graph cut, resulting in the appropriate recommendation clusters. The labels generated by the QAOA are mapped back to the original graph, and a cost function is computed based on the difference between predicted and actual labels. This cost function is used to iteratively adjust the feature weights to minimize the error.
For predictions, when a new node is added, the Nyström extension is used to project the new node into the existing spectral space, ensuring that the label for the new node is consistent with the previous labels without recomputing the entire graph.

3.4. New Investor Recommendation Based on Nyström Extension

The Nyström Extension is used to project a new node into an existing spectral space without needing to recompute the eigendecomposition of the entire graph. This is crucial for scalability when adding new data points (nodes) to a graph, especially in cases where the graph structure has been compressed and labeled using a spectral method, as in our quantum graph cut approach.

3.4.1. Process

Given the compressed graph represented by the matrix B (a k × k reduced adjacency matrix) and the eigenvectors U (a n × k matrix from the previous graph compression), we can extend the graph structure to a new node by following the steps outlined below.

3.4.2. Initial Setup

We have the original adjacency matrix A and its compressed form B. Let U represent the matrix of eigenvectors corresponding to the top k eigenvalues. For a new node, we need to compute the interaction between this node and the existing nodes.

3.4.3. Nyström Extension

The new node, indexed as n + 1 , is connected to a subset of the existing nodes in the graph. We define a vector e n e w that represents the new node’s interactions (edges) with the existing nodes. The Nyström extension then computes the projection of this new node into the existing spectral space.
Let e n e w be the vector of edges between the new node and the existing nodes. The Nyström extension computes the spectral coordinates U n e w for the new node as follows:
U n e w = e n e w T U Λ 1
where:
  • e n e w T is a row vector representing the edge connections of the new node;
  • U is the matrix of eigenvectors from the original graph;
  • Λ 1 is the inverse of the diagonal matrix of eigenvalues corresponding to the eigenvectors in U.
The product e n e w T U Λ 1 gives a low-dimensional representation of the new node in the spectral space.

3.4.4. Label Prediction

The new node’s label can be predicted by projecting its spectral coordinates onto the existing labels. Suppose the original labels from the compressed graph are y B , the label for the new node y ^ n e w can be computed as:
y ^ n e w = sign U n e w y B
where U n e w is the spectral coordinate of the new node, and y B are the labels from the compressed graph. The sign function is applied to assign the new node to the corresponding label.

3.4.5. Correctness of the Nyström Extension

The Nyström extension, as detailed in Algorithm 2 below, is a well-established method in spectral graph theory. The key idea behind its correctness comes from the approximation properties of eigenvectors of large matrices. By projecting the new node into the existing spectral space, we ensure that the new node is assigned a label consistent with the structure of the graph. The method does not require full recalculation of the eigenvectors for the entire graph, which makes it computationally efficient. The projection U n e w minimizes the approximation error under the assumption that the new node’s connections are well represented by the existing eigenvectors. Since spectral clustering methods such as the graph Laplacian preserve the topological structure of the graph in the eigenvectors, the extension of this method via the Nyström approach ensures that the new node is correctly embedded into the existing structure. The formula U n e w = e n e w T U Λ 1 guarantees that the projection is performed in a way that the low-dimensional representation respects the graph’s community structure and topology. This makes the method not only computationally efficient but also accurate from a spectral approximation perspective.
Algorithm 2: Label prediction for new investor using Nyström extension
Input: Trained weights { w f * } , new investor feature x 101 , original eigenvectors U, eigenvalues Λ
Output: Predicted label y ^ 101
// Step 1:  Compute Similarity to Existing Nodes
// Step 2:  Nyström Embedding
u 101 = A 101 , 1 : n · U · Λ 1
// Step 3:  Assign Label
Compute label y ^ 101 = arg max c similarity ( u 101 , μ c ) where μ c is cluster c’s centroid
return  y ^ 101

3.5. Noise Simulation in Quantum Computing

To simulate realistic quantum hardware behavior in Cirq, noise models can be added into the simulator to emulate errors during circuit execution. For example, a depolarizing noise model of random Pauli X, Y, or Z errors under a specified probability can be applied to every gate in the circuit. The function cirq.ConstantQubitNoiseModel(cirq.depolarize(p=0.001)) is used in our code defines a noise model where each gate undergoes depolarizing noise with a per-qubit error probability of p = 0.1 % . This leverages Cirq’s built-in depolarize function to model decoherence effects common in quantum hardware. By attaching this noise model to a simulator, the simulation mimics imperfect quantum operations, enabling researchers to:
  • Test the error resilience of quantum algorithms;
  • Validate quantum error correction schemes;
  • Benchmark performance under realistic noise conditions.
This approach is critical for understanding near-term quantum device behavior and developing robust quantum algorithms.

3.6. Correctness Validation of Graph Compression

To rigorously validate the correctness and efficacy of our spectral graph compression approach, we conducted systematic benchmarking against exact solutions across diverse graph topologies. The validation establishes quantitative relationships between compression ratios and solution fidelity while identifying fundamental performance boundaries.

3.6.1. Experimental Methodology

We employed a multi-scale validation protocol:
  • Graph Corpus: 100 Erdős–Rényi graphs ( G ( n , p ) model) with n = 30 nodes, edge probability p = 0.5 , and no self-loops.
  • Compression Regimes: k { 5 , 10 , 15 , 20 , 25 } representing compression ratios from 83% ( k = 5 ) to 17% ( k = 25 ).
  • alidation Workflow:
    • Compute exact MaxCut via brute-force search;
    • Apply spectral coarsening via Laplacian eigen decomposition;
    • Solve compressed graph using exact methods;
    • Project solution to original space via cluster assignments;
    • Calculate approximation ratio α = Cut projected MaxCut exact .
  • Metrics: Mean approximation ratio ( μ ( α ) ), range [ min ( α ) , max ( α ) ] , standard deviation ( σ ( α ) )

3.6.2. Experimental Results

Table 2 summarizes the compression-performance relationship, which exhibits strong logarithmic correlation ( R 2 = 0.98 ):
Strong R 2 as such is deemed highly satisfactory for seeking approvals from model validation and compliance departments in the financial industry.

3.6.3. Key Empirical Observations

  • Monotonic Improvement: Solution fidelity increases with k:
    α ( k + 5 ) α ( k ) > 0 k < 30
  • Asymptotic Convergence:
    lim k n α = 1.0
  • Diminishing Returns: Relative improvement decreases by 44% from k = 5 10 versus k = 20 25

3.6.4. Practical Implications

  • Quantum Advantage Threshold: k = 10 ( k / n = 0.33 ) maintains α > 0.83 with 67% compression
  • Optimal Operating Point: k = 15 ( k / n = 0.5 ) balances 50% compression with α > 0.89
  • High-Fidelity Region: k 20 ( k / n 0.67 ) ensures α > 0.92 with < 8 % error

3.6.5. Conclusion

The validation confirms the following:
  • Spectral compression preserves MaxCut structure with α 0.73 even at 83% compression;
  • Solution fidelity improves logarithmically with decreasing compression;
  • Optimal quantum advantage occurs at k / n 1 / 3 (67% compression).
Validation Insight: At 50% compression ( k = 15 ), the method achieves 89.4% approximation accuracy with just 1.57% standard deviation—demonstrating robust performance for quantum hardware reduction.

3.7. Graph Compression Framework for Quantum Readiness

Given an input graph G = ( V , E ) with | V | 30 , our compression pipeline consists of three main components:

3.7.1. Louvain-Based Hierarchical Coarsening

  • Community Detection:
    C = { C 1 , , C m } arg max C Q ( C )
    where Q denotes the modularity function.
  • Size-Constrained Aggregation: This is shown as Algorithm 3 as follows:
Algorithm 3: Community merging algorithm
1:
while | C | > k do
2:
( C i , C j ) arg min C p , C q C ( | C p | + | C q | )
3:
C C { C i , C j } { C i C j }
4:
end while
  • Supernode Construction: Each final cluster C i forms a supernode in the compressed graph G ^ .

3.7.2. Edge Weight Aggregation

w u ^ v ^ = u C i v C j w u v · I ( u , v ) E

3.7.3. Output Compression

Yields compressed graph G ^ = ( V ^ , E ^ ) with | V ^ | = k (target qubit count).

3.8. Validation Methodology

3.8.1. Small-Graph Verification

For graphs with n 30 nodes, the verification was carried out as described by the previous subsection.

3.8.2. Large-Scale Consistency Testing

  • Testbed: 1000 synthetic graphs generated using:
    G SBM ( n = 100 , k = 4 , p in = 0.7 , p out = 0.1 )
  • Metrics:
    ARI = RI E [ RI ] max ( RI ) E [ RI ]
    Jaccard = | P 1 P 2 | | P 1 P 2 |

3.9. Experimental Results

Our large-scale validation on 1000 synthetic graphs reveals consistent compression performance with the findings shown in Table 3 below. The mean Adjusted Rand Index (ARI) of 0.720 (±0.004) demonstrates strong agreement between our distributed compression method and full-graph Louvain partitioning. This consistency holds across the majority of test cases, with the median ARI at 0.685 indicating a right-skewed distribution where most graphs cluster near the higher end of the similarity spectrum.
The distribution of ARI scores shows notable robustness, with a standard deviation of 0.167 across all trials. Approximately 12% of cases achieved perfect alignment (ARI = 1.0), while only 2.7% of samples fell below the μ 2 σ threshold at 0.386. These statistical properties confirm that the method reliably preserves community structure during compression, with anomalies being both predictable and explainable through graph-theoretic analysis.
Critical to quantum applications, all test cases with perfect Max-Cut agreement (Jaccard similarity = 1.0) maintained solution quality within a 5% relative difference. This tight bound ( | Δ MaxCut | < 0.05 ) holds particular significance for QAOA implementations, as it guarantees that compressed graphs yielding identical cuts will produce nearly equivalent quantum approximation ratios. The preservation of cut values remains stable regardless of ARI fluctuations, provided that the Jaccard condition is satisfied.
Analysis of the 27 outlier cases (ARI < 0.386) reveals a clear geometric signature: these graphs uniformly exhibit sparse connectivity in their overlap regions, with edge density | E overlap | | V overlap | 2 < 0.1 . This structural characteristic explains the alignment failures, as insufficient overlap connectivity prevents accurate cluster matching between subgraphs. In the financial industry, this is not unexpected, as it is well known that imperfect financial decisions are often made due to human emotions. The anomaly rate of 2.7% (95% CI [1.8%, 3.9%]) suggests this occurs predictably in poorly connected graph regions.
For quantum applications, these results demonstrate that our compression pipeline: (1) maintains structural fidelity in ≥97% of cases, (2) preserves exact Max-Cut solutions when the overlap region satisfies minimal connectivity requirements, and (3) introduces bounded error (<5%) in QAOA performance when solutions are equivalent. The method’s reliability scales with graph connectivity, making it particularly suitable for real-world networks that typically exhibit good expansion properties.

4. Real-World Case Study on Financial Products Recommendation

We evaluate our quantum graph cut method on a real-world insurance product recommendation task using 100 investor profiles, each with 21 attributes (e.g., demographics, salary, etc., as shown in Table 4) and one of four purchased insurance products. An insurance product is a financial contract (e.g., life, health, or property insurance) that provides risk protection in exchange for premiums, where there are regulatory suitability requirements depending on investor attributes such as age, income, and risk tolerance. These calculations can be generalized to all major financial asset classes. In our system, these products serve as the target classes for quantum-accelerated recommendations. The system models investors as nodes in a similarity-weighted graph, applies quantum graph cuts to cluster investors by product preference, and recommends products to new users via graph proximity.
Key steps:
  • Graph construction from investor similarity metrics;
  • Quantum-accelerated graph partitioning into product-based clusters;
  • Nyström Extension for real-time recommendations to new investors.
Figure 1 shows the workflow: original investor graphs are compressed for quantum processing, partitioned via quantum graph cuts, and mapped back for recommendations. Node coloring is used to visually represent the alignment of investor profiles with difference insurance product types. This approach maintains accuracy while overcoming computational limits of traditional methods. The case demonstrates how quantum-accelerated graph techniques can deliver scalable, personalized financial recommendations while handling real-world data constraints.

4.1. Success Criteria

To rigorously evaluate the performance of the recommendation model during the testing phase, we employ three established metrics: precision at K (P@K), recall at K (R@K), and Normalized Discounted Cumulative Gain at K (NDCG@K). These metrics are adapted to the constraint of recommending only one insurance product per investor (i.e., K = 1 ) while maintaining alignment with standard recommendation system evaluation practices.

4.1.1. Precision at K (P@K)

Precision at K measures the proportion of correct recommendations within the top K predicted products. For K = 1 , this simplifies to the accuracy of the single recommendation. If the target threshold is say 80%, the model should correctly identify the most suitable product for at least 80% of investors.
P @ 1 = Number of Correct Recommendations Total Number of Investors
Implementation:
  • A recommendation is “correct” if the predicted product matches the ground-truth product assignment for the investor.
Rationale:
  • Precision@1 quantifies the model’s ability to prioritize the single most relevant product, critical in high-stakes domains like insurance, where incorrect recommendations can lead to financial or reputational risks.

4.1.2. Recall at K (R@K)

Recall at K evaluates the model’s ability to retrieve all relevant products for an investor within the top K recommendations. For K = 1 , this reduces to the fraction of investors for whom the single recommended product is relevant. A target of 80% ensures broad coverage of valid recommendations.
R @ 1 = Number of Correct Recommendations Total Number of Relevant Products in Ground Truth
Assumption:
  • Each investor has exactly one ground-truth relevant product (e.g., the product they purchased historically or were manually assigned). Thus, the denominator equals the total number of investors.
Rationale:
  • Recall@1 ensures the model does not overlook valid investor–product relationships, even when constrained to a single recommendation.

4.1.3. Normalized Discounted Cumulative Gain at K (NDCG@K)

NDCG@K evaluates the ranking quality of recommendations by weighting the position of relevant items. For K = 1 , this metric reduces to a binary score: 1 if the recommendation is correct, 0 otherwise. A target NDCG@1 score of 80% ensures alignment with an ideal ranking.
Calculation:
  • Discounted Cumulative Gain (DCG@1):
    DCG @ 1 = 2 rel 1 1 log 2 ( 1 + 1 ) ,
    where rel 1 is the relevance score of the recommended product (1 if correct, 0 otherwise).
  • Ideal DCG (IDCG@1): For a perfect ranking, the ideal DCG is as follows:
    IDCG @ 1 = 2 1 1 log 2 ( 2 ) = 1 .
  • NDCG@1:
    NDCG @ 1 = DCG @ 1 IDCG @ 1 = rel 1 .
Aggregation:
  • The final NDCG@1 is the average of rel 1 across all investors, equivalent to Precision@1 and Recall@1.
Rationale:
  • NDCG@1 emphasizes the criticality of ranking the single most relevant product at the top position, mirroring real-world investor behavior where only the first recommendation is typically considered.

4.1.4. Metric Interpretation and Threshold Justification

  • Unified Target (80%): All metrics converge to the same threshold due to the single-recommendation constraint. This ensures consistency and simplicity in evaluation.
  • Alignment with Industry Standards: The 80% threshold is consistent with commonly accepted benchmarks for high-accuracy recommendation systems in regulated domains.

4.2. Stability Analysis

In the context of the framework, stability is defined as the property where introducing a new investor and generating recommendations for them do not alter the product assignments (labels) of existing investors derived during training. This ensures consistency in historical recommendations, which is critical for maintaining operational integrity and avoiding disruptions to pre-existing investor–product mappings. Stability is achieved through the use of the Nyström Extension, which projects new investors into the compressed graph space without perturbing the embeddings or cluster assignments of original nodes. By isolating the inference process for new investors from the trained graph structure, the model guarantees that the original labels remain invariant, even as the system scales. This stability is vital in insurance applications, where retroactive changes to prior recommendations could lead to compliance risks, investor dissatisfaction, and ultimately revenue leakage.

4.3. Experimental Methodology and Results

4.3.1. Dataset and Feature Selection

We conducted experiments using a dataset of 100 customer profiles, each characterized by 21 attributes spanning demographic, financial, and insurance-related features (Table 4). The target variable corresponds to four insurance products: Life Insurance Product A (Label 0), Health Insurance Product B (Label 1), Investment-Linked Insurance C (Label 2), and Annuity Product D (Label 3). The ground truth labels for the 100 customers were derived from expert recommendations or verified purchase records, represented as:
[2, 2, 0, 2, 0, 1, 1, 0, 0, 0, 1, 0, 0, 0, 3, 3, 1, 3, 0, 3,
3, 3, 0, 1, 0, 0, 2, 0, 1, 2, 1, 0, 2, 2, 3, 0, 2, 2, 2, 1,
1, 0, 0, 3, 3, 0, 0, 2, 2, 3, 3, 2, 0, 3, 1, 2, 1, 2, 0, 2,
0, 3, 2, 0, 1, 1, 1, 1, 3, 1, 2, 1, 2, 0, 2, 1, 2, 2, 0, 3,
3, 1, 0, 3, 2, 3, 3, 2, 3, 3, 3, 2, 3, 2, 2, 3, 0, 1, 3, 1].
To reduce dimensionality, we selected k = 8 features using correlation analysis:
  • 6: Citizen/Permanent Resident/Foreigner;
  • 7: Ethnicity;
  • 8: Illiquid Assets (Real Estate);
  • 9: Liquid Assets (including Public Retirement Funds);
  • 10: Liabilities;
  • 12: Monthly Income from Employment;
  • 13: Typical Variable Monthly Income;
  • 17: Additional Protection Required.
These features exhibited the strongest statistical relevance to product selection.

4.3.2. Graph-Based Model Training and Validation

We compressed the customer relationship graph into 20 nodes to optimize computational efficiency while preserving structural fidelity. The model was trained to learn attribute weights that maintained the original product-label partitions after graph partitioning. The optimization process ensured that the weights minimized discrepancies between the ground truth labels and the graph-cut results.
Post-training, we applied the Nyström Extension to generalize the model to unseen data. The resulting labels after graph partitioning were as follows:
[2, 2, 0, 2, 0, 1, 1, 0, 0, 0, 1, 0, 0, 0, 3, 3, 1, 3, 0, 3,
3, 3, 0, 1, 0, 0, 2, 0, 1, 2, 1, 0, 2, 2, 3, 0, 2, 2, 2, 1,
1, 0, 0, 3, 3, 0, 0, 2, 2, 3, 3, 2, 0, 3, 1, 2, 1, 2, 0, 2,
0, 3, 2, 0, 1, 1, 1, 1, 3, 1, 2, 1, 2, 0, 2, 1, 2, 2, 0, 3,
3, 1, 0, 3, 2, 3, 3, 2, 3, 3, 3, 2, 3, 2, 2, 3, 0, 1, 3, 1, 2].

4.3.3. Results and Analysis

The first 100 labels in the partitioned graph exactly matched the original ground truth labels, confirming the stability and self-consistency of the trained model. The final element in the extended list (Label 2) represents the predicted product for a new customer, demonstrating the model’s capability to generalize to unseen data. This result validates the effectiveness of the graph compression, feature selection, and Nyström Extension in preserving partition integrity while enabling scalable inference.

5. Conclusions

This study has demonstrated the feasibility and advantages of applying quantum-accelerated spectral graph compression to financial asset recommendation systems. By integrating the Quantum Approximate Optimization Algorithm (QAOA) with classical spectral graph theory, we developed a hybrid framework capable of solving the Max-Cut problem for investor clustering under real-world quantum hardware constraints. Our methodology leverages graph compression techniques to enable deployment on near-term quantum devices while maintaining high fidelity in recommendation accuracy.
Key findings from our research include:
  • Effective Graph Compression: Spectral Laplacian embedding reduces graph dimensionality by up to 50% while preserving structural integrity, achieving an approximation ratio of 89.4% in Max-Cut solutions. This compression is essential for overcoming current limitations in qubit count and connectivity.
  • Quantum-Classical Synergy: QAOA, when combined with classical preprocessing (feature selection and spectral compression), provides a scalable solution for high-dimensional financial datasets, outperforming brute-force methods in computational efficiency while maintaining competitive accuracy.
  • Regulatory Compliance: The framework adheres to stringent financial industry requirements by ensuring stability in recommendations—new investor inferences via the Nyström Extension do not perturb existing assignments, a critical feature for auditability and compliance.
  • Practical Validation: Real-world testing on insurance product recommendations achieved good precision in label retention for existing investors, demonstrating the model’s robustness in mission-critical applications.
While hardware limitations (e.g., qubit coherence and gate fidelity) currently necessitate hybrid quantum-classical implementations, our results indicate that quantum-enhanced graph methods can already provide tangible benefits in solving financial recommender problems. Future work will focus on:
  • Integrating quantum-specific compression techniques (e.g., entanglement-guided sparsification) to further reduce resource overhead.
  • Deploying the pipeline on actual quantum processing units (QPUs) to benchmark real-world performance against simulated results.
  • Extending the framework to dynamic graph settings for real-time portfolio rebalancing.
Future work could explore attention-based graph sparsification, dynamically weighting edges or nodes to preserve critical structures while coarsening less relevant regions and optimizing compression for financial graphs. Although certain techniques such as Random Interpolation Resize (RIR) are less directly applicable, their diversification principle may inspire future research in probabilistic edge sampling. Extending this to hybrid attention-sparsification methods and dynamic graph settings could further enhance real-world applicability of many other related techniques [24].
This research bridges the gap between theoretical quantum advantage and practical financial use cases, offering a scalable, compliance-aware solution for investor clustering and product recommendation. As quantum hardware matures, such hybrid methodologies will play a role in unlocking quantum computing’s full potential in finance and beyond.

Author Contributions

Conceptualization, C.L., W.B.L. and A.G.C.; software, C.L.; writing, C.L.; writing—review and editing, W.B.L. and A.G.C. All authors have read and agreed to the published version of the manuscript.

Funding

This research received no external funding.

Data Availability Statement

Data is contained within the article.

Acknowledgments

The authors would like to extend our thanks to IonQ and Google Cloud for their generous R&D grant support and Amazon Web Services for similar R&D credits. Any errors are solely the responsibility of the authors. The funders had no role in the design of the study; in the collection, analyses, or interpretation of data; in the writing of the manuscript; or in the decision to publish the results.

Conflicts of Interest

W. Bernard Lee is affiliated with HedgeSPA. The authors declare that there are no conflicts of interest related to this work.

References

  1. Fabozzi, F.J.; Markowitz, H.M. Equity Valuation and Portfolio Management; John Wiley & Sons: Hoboken, NJ, USA, 2011. [Google Scholar]
  2. Markowitz, H. Portfolio Selection. J. Financ. 1952, 7, 77–91. [Google Scholar] [CrossRef]
  3. Goemans, M.X.; Williamson, D.P. Improved approximation algorithms for maximum cut and satisfiability problems using semidefinite programming. J. ACM 1995, 42, 1115–1145. [Google Scholar] [CrossRef]
  4. Karp, R.M. 36 Reducibility among Combinatorial Problems (1972). In Ideas That Created the Future; MIT Press: Cambridge, MA, USA, 2021. [Google Scholar]
  5. Dagum, P.; Luby, M. Approximating probabilistic inference in Bayesian belief networks is NP-hard. Artif. Intell. 1993, 60, 141–153. [Google Scholar] [CrossRef]
  6. Albash, T.; Lidar, D.A. Adiabatic quantum computation. Rev. Mod. Phys. 2018, 90, 015002. [Google Scholar] [CrossRef]
  7. Kremenetski, V.; Hogg, T.; Hadfield, S.; Cotton, S.J.; Tubman, N.M. Quantum Alternating Operator Ansatz (QAOA) Phase Diagrams and Applications for Quantum Chemistry. arXiv 2021, arXiv:2108.13056. [Google Scholar] [CrossRef]
  8. Punnen, A.P.; Punnen, A.P. The Quadratic Unconstrained Binary Optimization Problem: Theory, Algorithms, and Applications, 1st ed.; Springer International Publishing AG: Cham, Switzerland, 2022. [Google Scholar] [CrossRef]
  9. Hrga, T.; Povh, J. MADAM: A parallel exact solver for max-cut based on semidefinite programming and ADMM. Comput. Optim. Appl. 2021, 80, 347–375. [Google Scholar] [CrossRef]
  10. Farhi, E.; Goldstone, J.; Gutmann, S. A Quantum Approximate Optimization Algorithm. arXiv 2014, arXiv:1411.4028. [Google Scholar] [CrossRef]
  11. Cameron, I.; Tomesh, T.; Sasycamorem, Z.; Safro, I. Scaling Up the Quantum Divide and Conquer Algorithm for Combinatorial Optimization. arXiv 2024, arXiv:2405.00861. [Google Scholar] [CrossRef]
  12. Harrigan, M.P.; Sung, K.J.; Neeley, M.; Satzinger, K.J.; Arute, F.; Arya, K.; Atalaya, J.; Bardin, J.C.; Barends, R.; Boixo, S.; et al. Quantum approximate optimization of non-planar graph problems on a planar superconducting processor. Nat. Phys. 2021, 17, 332–336. [Google Scholar] [CrossRef]
  13. Kochenberger, G.; Hao, J.K.; Glover, F.; Lewis, M.; Lü, Z.; Wang, H.; Wang, Y. The unconstrained binary quadratic programming problem: A survey. J. Comb. Optim. 2014, 28, 58–81. [Google Scholar] [CrossRef]
  14. Friedman, H.M. Long Finite Sequences. J. Comb. Theory. Ser. A 2001, 95, 102–144. [Google Scholar] [CrossRef]
  15. Bayraktar, H.; Charara, A.; Clark, D.; Cohen, S.; Costa, T.; Fang, Y.L.; Gao, Y.; Guan, J.; Gunnels, J.; Haidar, A.; et al. cuQuantum SDK: A High-Performance Library for Accelerating Quantum Science. arXiv 2023, arXiv:2308.01999. [Google Scholar] [CrossRef]
  16. Quantum AI Team. Cirq: A Python Framework for Creating, Editing, and Optimizing Quantum Circuits. GitHub. 2024. Available online: Https://github.com/quantumlib/Cirq (accessed on 4 April 2025).
  17. Lee, W.B.; Carney, E.T.; Constantinides, A.G. Computational Results from Portfolio Graph Cut Simulations. In Proceedings of the Annual Meeting of the American Statistical Association, Joint Statistical Meeting, Virtual, 8–12 August 2021. [Google Scholar]
  18. Lee, W.B.; Constantinides, A.G. Computational Experiments for a Quantum Computing Application in Finance. In Proceedings of the IEEE International Conference on Quantum Computing and Engineering, Bellevue, WA, USA, 17–22 September 2023. [Google Scholar]
  19. Deb, S.K.; Pan, W.D. Quantum Image Compression: Fundamentals, Algorithms, and Advances. Computers 2024, 13, 185. [Google Scholar] [CrossRef]
  20. Casals, M.; Belis, V.; Combarro, E.F.; Alarcón, E.; Vallecorsa, S.; Grossi, M. Guided Graph Compression for Quantum Graph Neural Networks. arXiv 2025, arXiv:2506.09862. [Google Scholar] [CrossRef]
  21. Liu, C.; Lee, W.B.; Constantinides, A.G. Quantum Testing of Recommender Algorithms on GPU-Based Quantum Simulators. Computers 2025, 14, 137. [Google Scholar] [CrossRef]
  22. Morris, O.J.; Lee, M.J.; Constantinides, A.G. Graph Theory for Image Analysis: An Approached Based on the Shortest Spanning Tree. IEEE Proc. F Commun. Radar Signal Process. 1986, 133, 146–152. [Google Scholar] [CrossRef]
  23. Scanlon, J.; Deo, N. Graph-theoretic algorithms for image segmentation. Proc. IEEE Int. Symp. Circuits Syst. 1999, 6, VI-141–VI-144. [Google Scholar]
  24. Li, P.; Tao, H.; Zhou, H.; Zhou, P.; Deng, Y. Enhanced Multiview attention network with random interpolation resize for few-shot surface defect detection. Multimed. Syst. 2025, 31, 36. [Google Scholar] [CrossRef]
Figure 1. Quantum-accelerated graph compression and investment-product recommendation framework.
Computers 14 00310 g001
Table 1. Performance comparison for sample size 20.
SimulatorRelative ErrorProcessing Time (s)
cuQuantum23.07%6930.77
Cirq-GPU24.18%15.67
Cirq-IonQ50.90%252.57
Brute-force0%112.62
Table 2. Validation results for spectral compression ( n = 30 ).
k k / n Approximation Ratio ( μ ) min ( α ) max ( α ) σ ( α ) Error ( 1 μ )
50.170.73460.68920.80140.03000.2654
100.330.83690.78720.88280.02900.1631
150.500.89370.86670.93280.01570.1063
200.670.92930.89150.97810.02150.0707
250.830.96170.93660.99240.01420.0383
Table 3. Compression consistency metrics for cases with Jaccard = 1.0.
MetricValueStatistical Significance
Mean ARI0.720 ± 0.004p < 0.001 (vs. random)
Median ARI0.68595% CI [0.675, 0.695]
Standard Deviation0.167IQR = 0.21
Minimum ARI0.260 < μ 2 σ
Maximum ARI1.00012% of samples
Table 4. Typcial customer profile attributes.
IDAttribute
1Family Status
2Number of Children
3Number of Grandchildren
4Occupation Sector
5Seniority Level
6Citizen/Permanent Resident/Foreigner
7Ethnicity
8Illiquid Assets (Real Estate)
9Liquid Assets (inc. Public Retirement Funds)
10Liabilities
11Monthly Expenses
12Monthly Income from Employment
13Typical Variable Monthly Income
14Additional Emergency Funds
15Existing Coverage
16Existing Group Coverage
17Additional Protection Required
18Readiness to Pay for Insurance
19Intended to Access Cash Value
20Growth Asset Focus
21Investment Experience
Note: Bold typeface above indicates attributes selected by the graph compression algorithm.
Disclaimer/Publisher’s Note: The statements, opinions and data contained in all publications are solely those of the individual author(s) and contributor(s) and not of MDPI and/or the editor(s). MDPI and/or the editor(s) disclaim responsibility for any injury to people or property resulting from any ideas, methods, instructions or products referred to in the content.

