One-Class Anomaly Detection for Industrial Applications: A Comparative Survey and Experimental Study
Abstract
1. Introduction
2. Related Works
3. Methodology
- Dataset Analysis, Selection Justification, and Bias Assessment:A comparative analysis of widely adopted public datasets was conducted to identify those most suitable for intrusion detection research. The selection focused on well-established and frequently cited datasets to ensure relevance and reproducibility, while newer or poorly validated datasets were excluded. In addition, a dataset selection justification was performed to align each dataset’s characteristics with the objectives of the study. A dedicated bias analysis was also carried out to identify structural imbalances, outdated attack representations, and distributional anomalies, which could influence model performance and generalizability.
- One-Class Anomaly Detection Techniques - Taxonomy and Selection:An initial taxonomy of one-class classification (OCC) techniques was developed to categorize the most widely used anomaly detection models based on their methodological foundations. This analysis enabled a structured comparison of OCC approaches and informed the subsequent selection of models for evaluation. Only algorithms that have been extensively validated in offline settings using the previously selected benchmark datasets were considered for real-time experimentation.
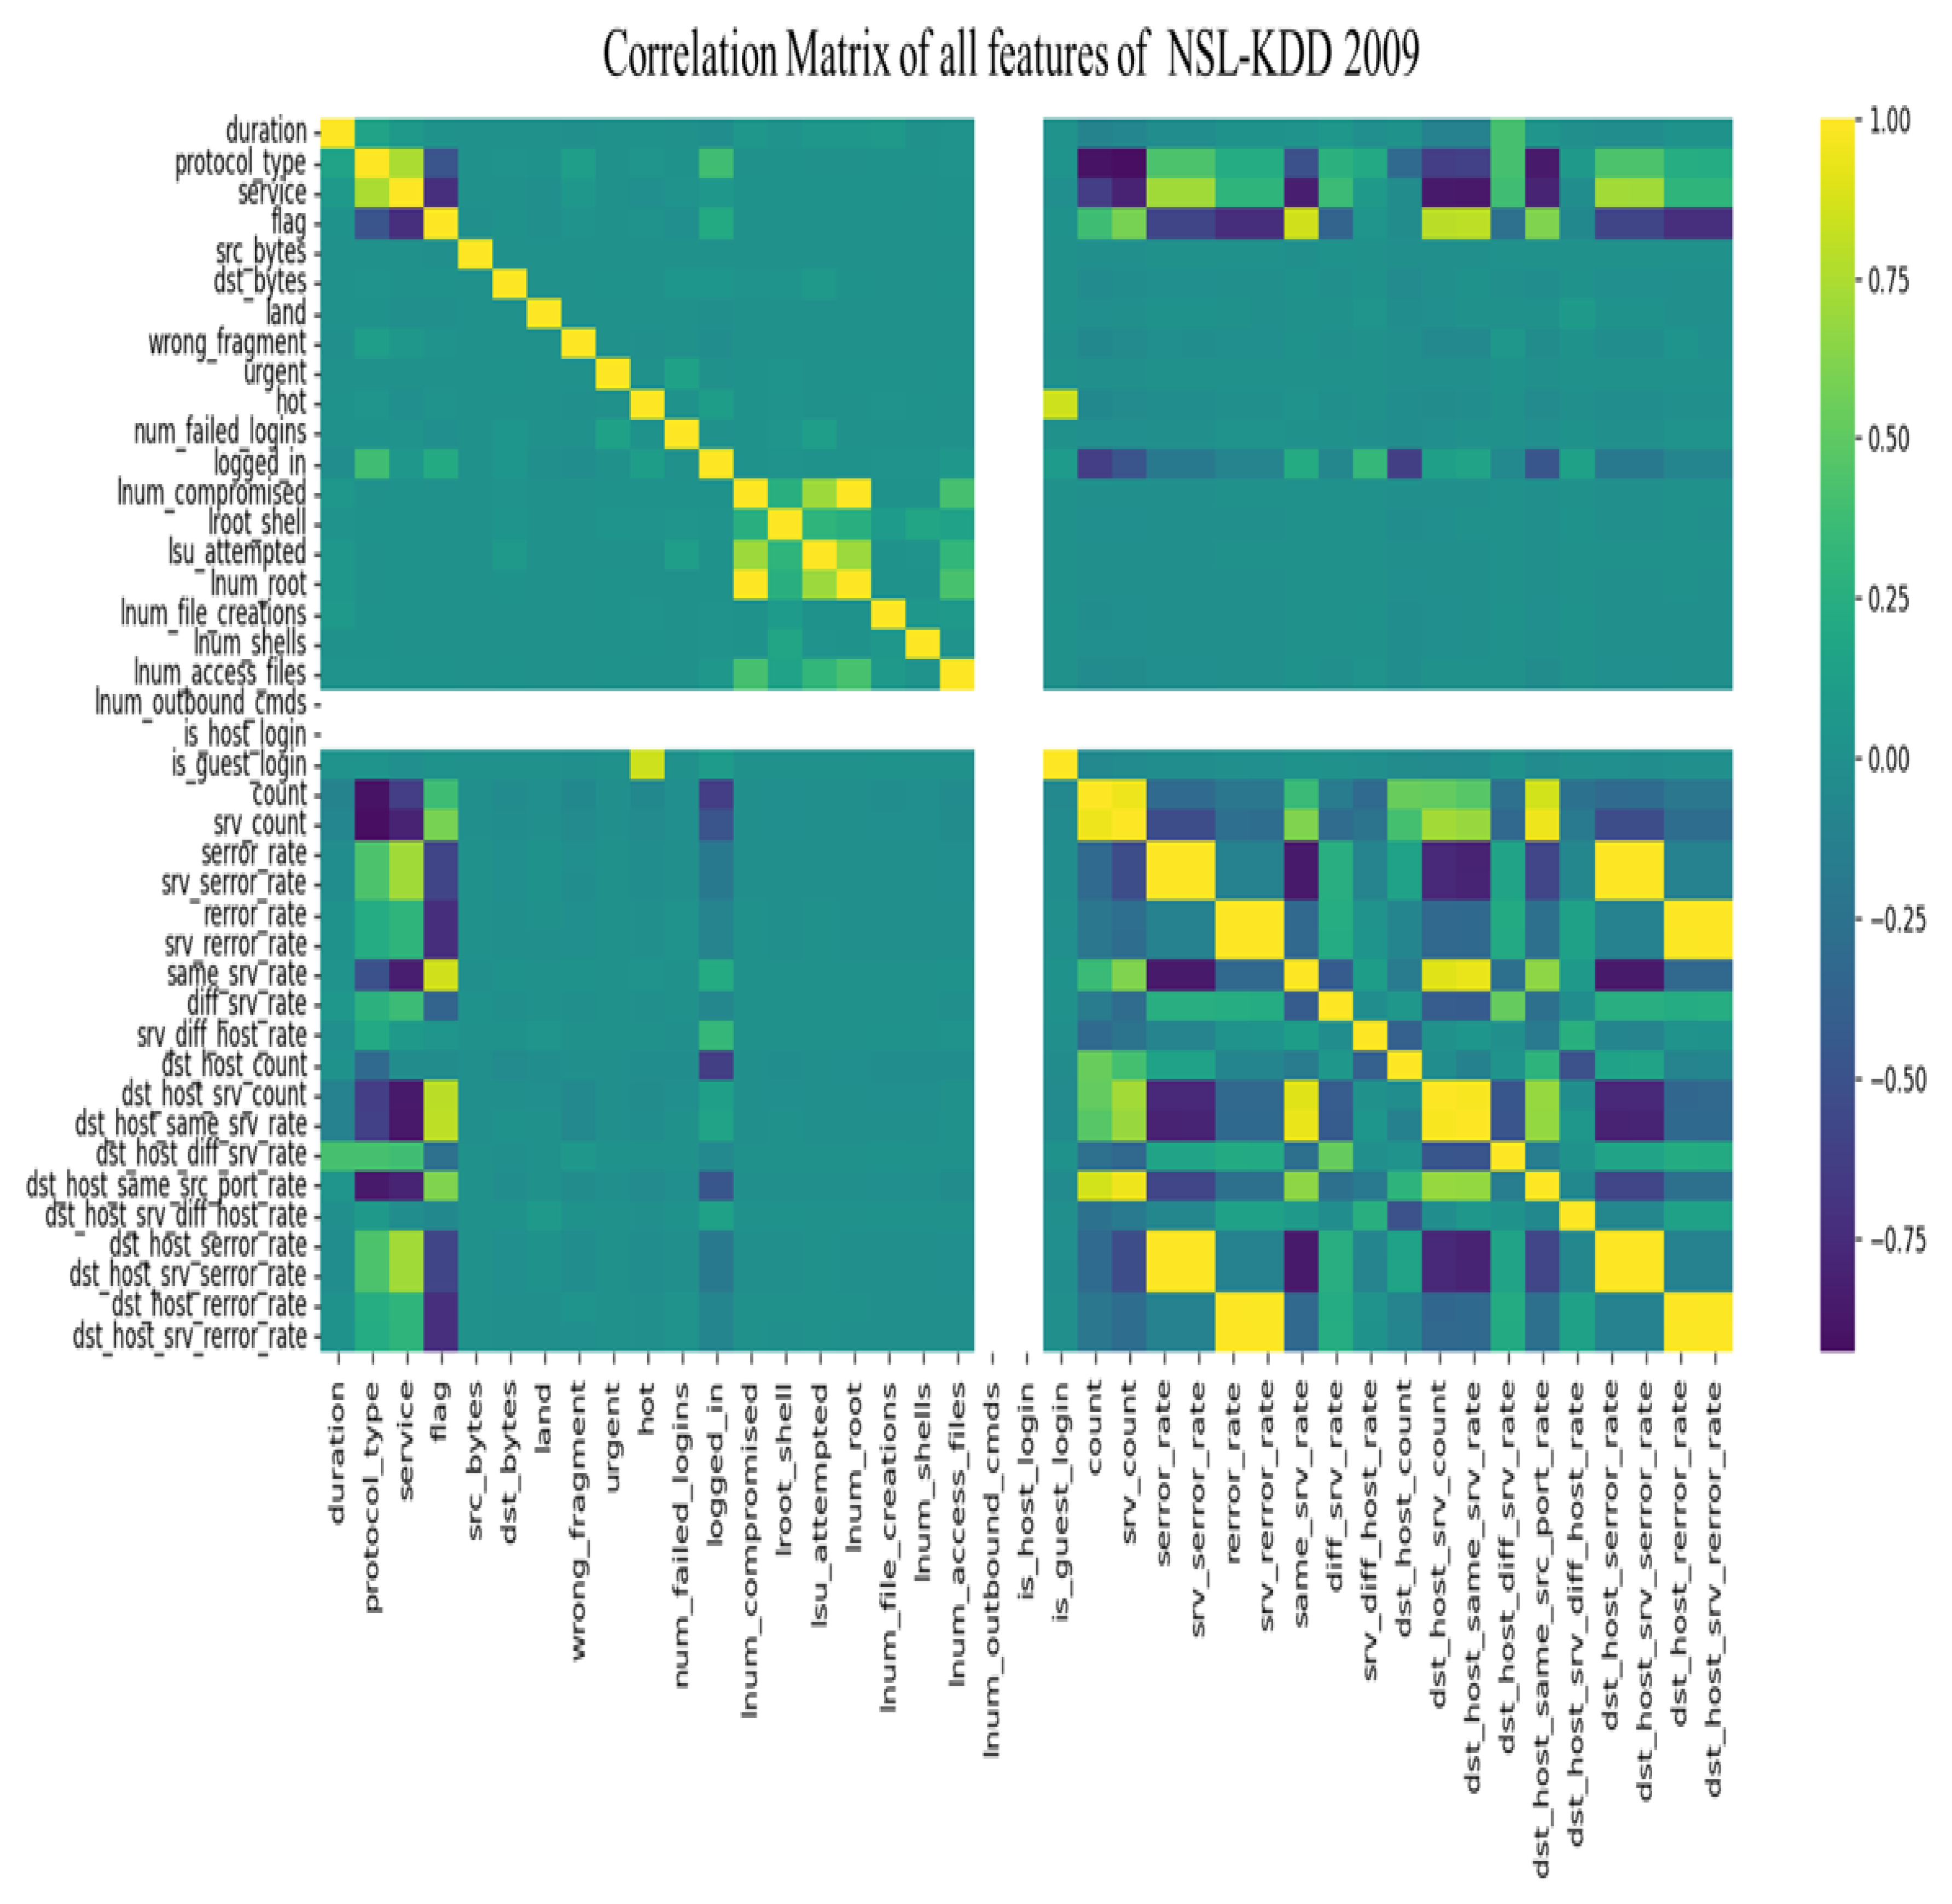
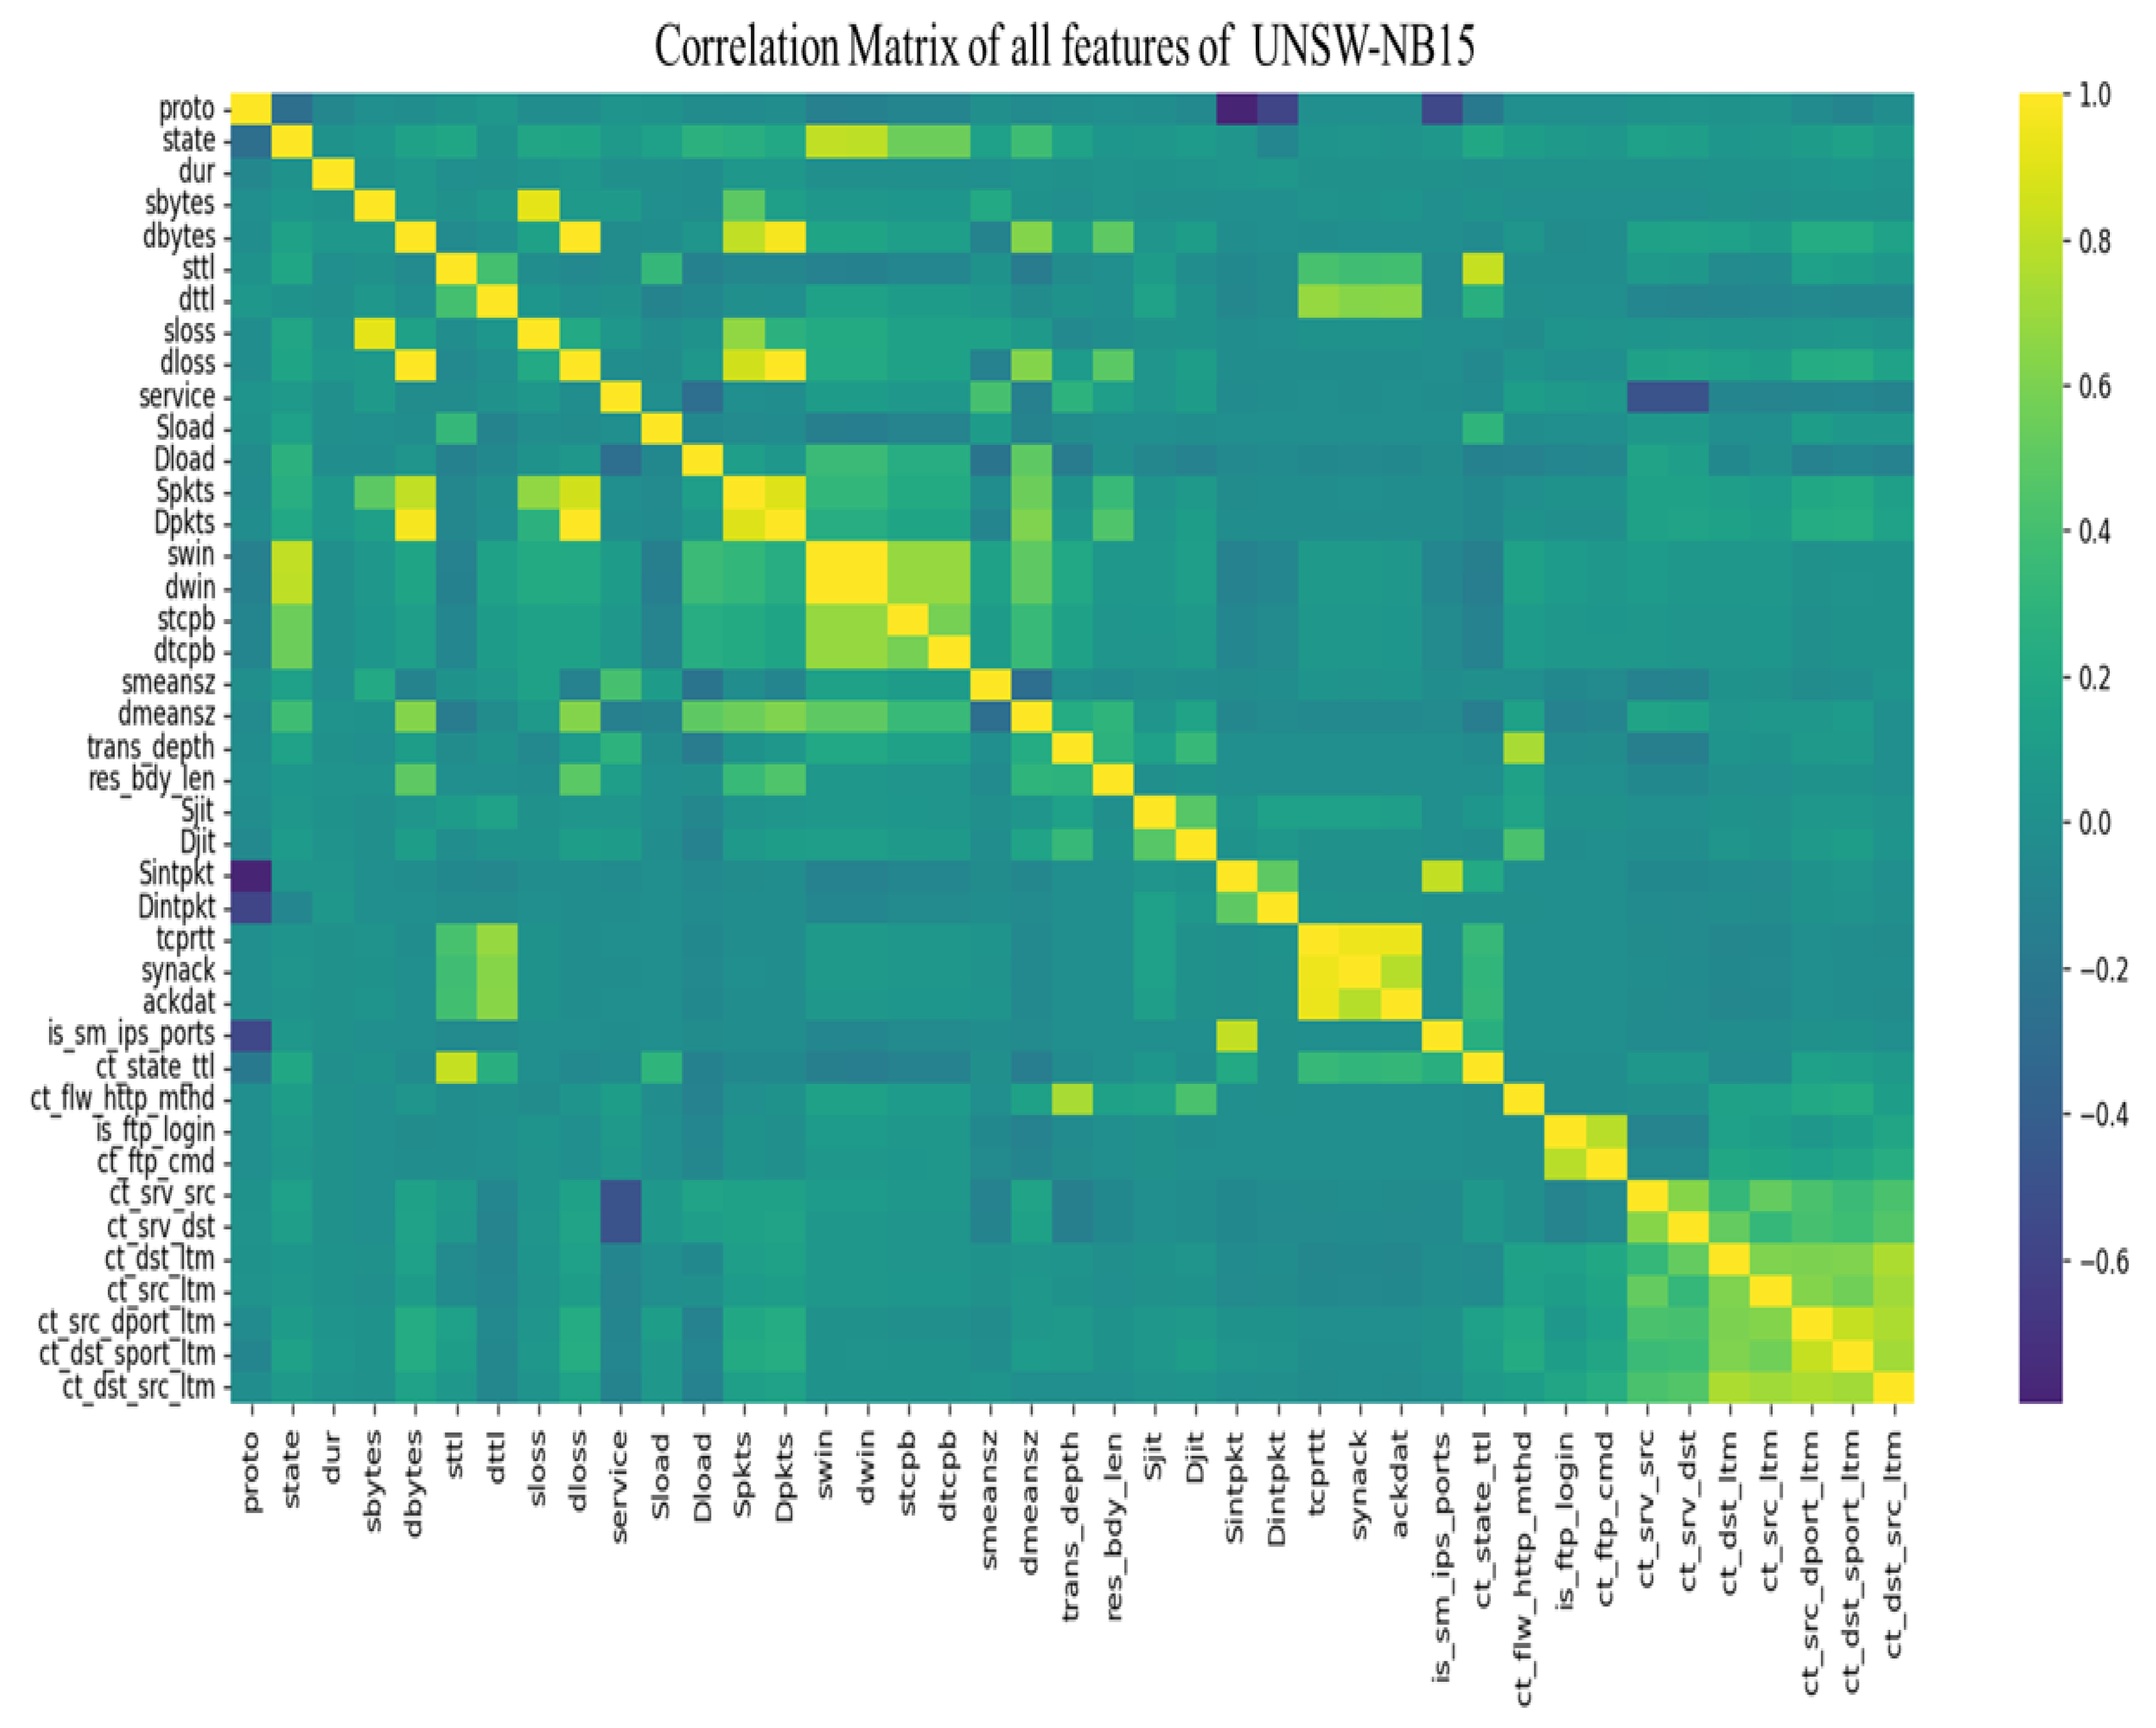
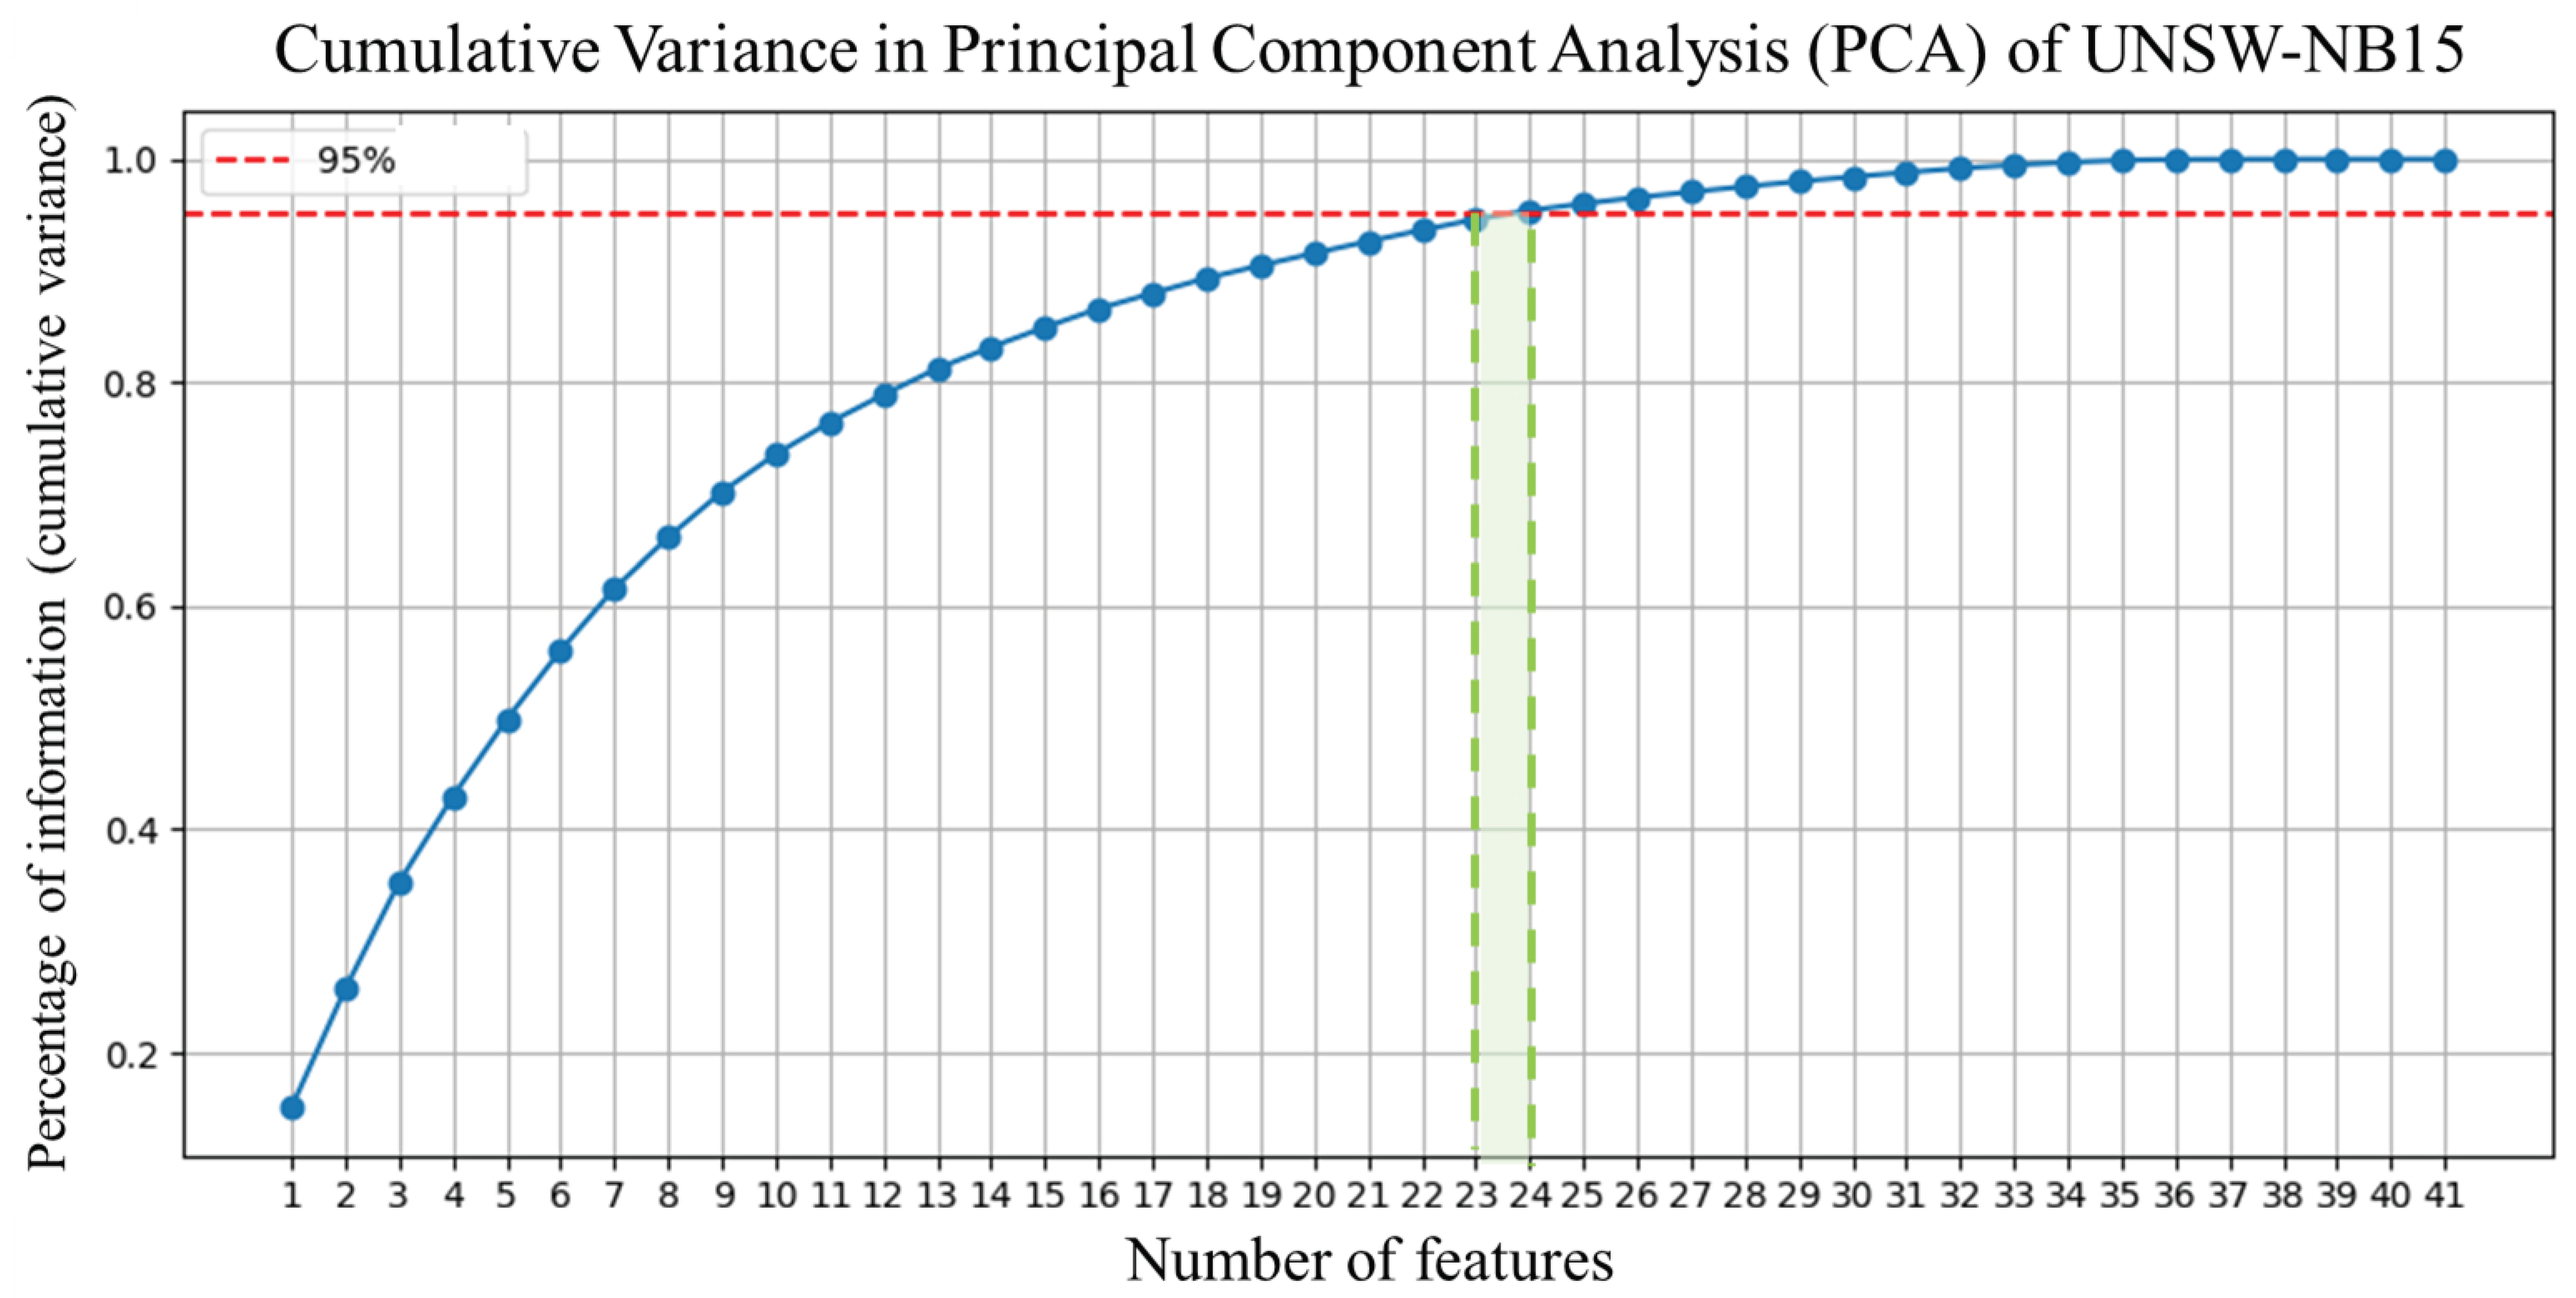
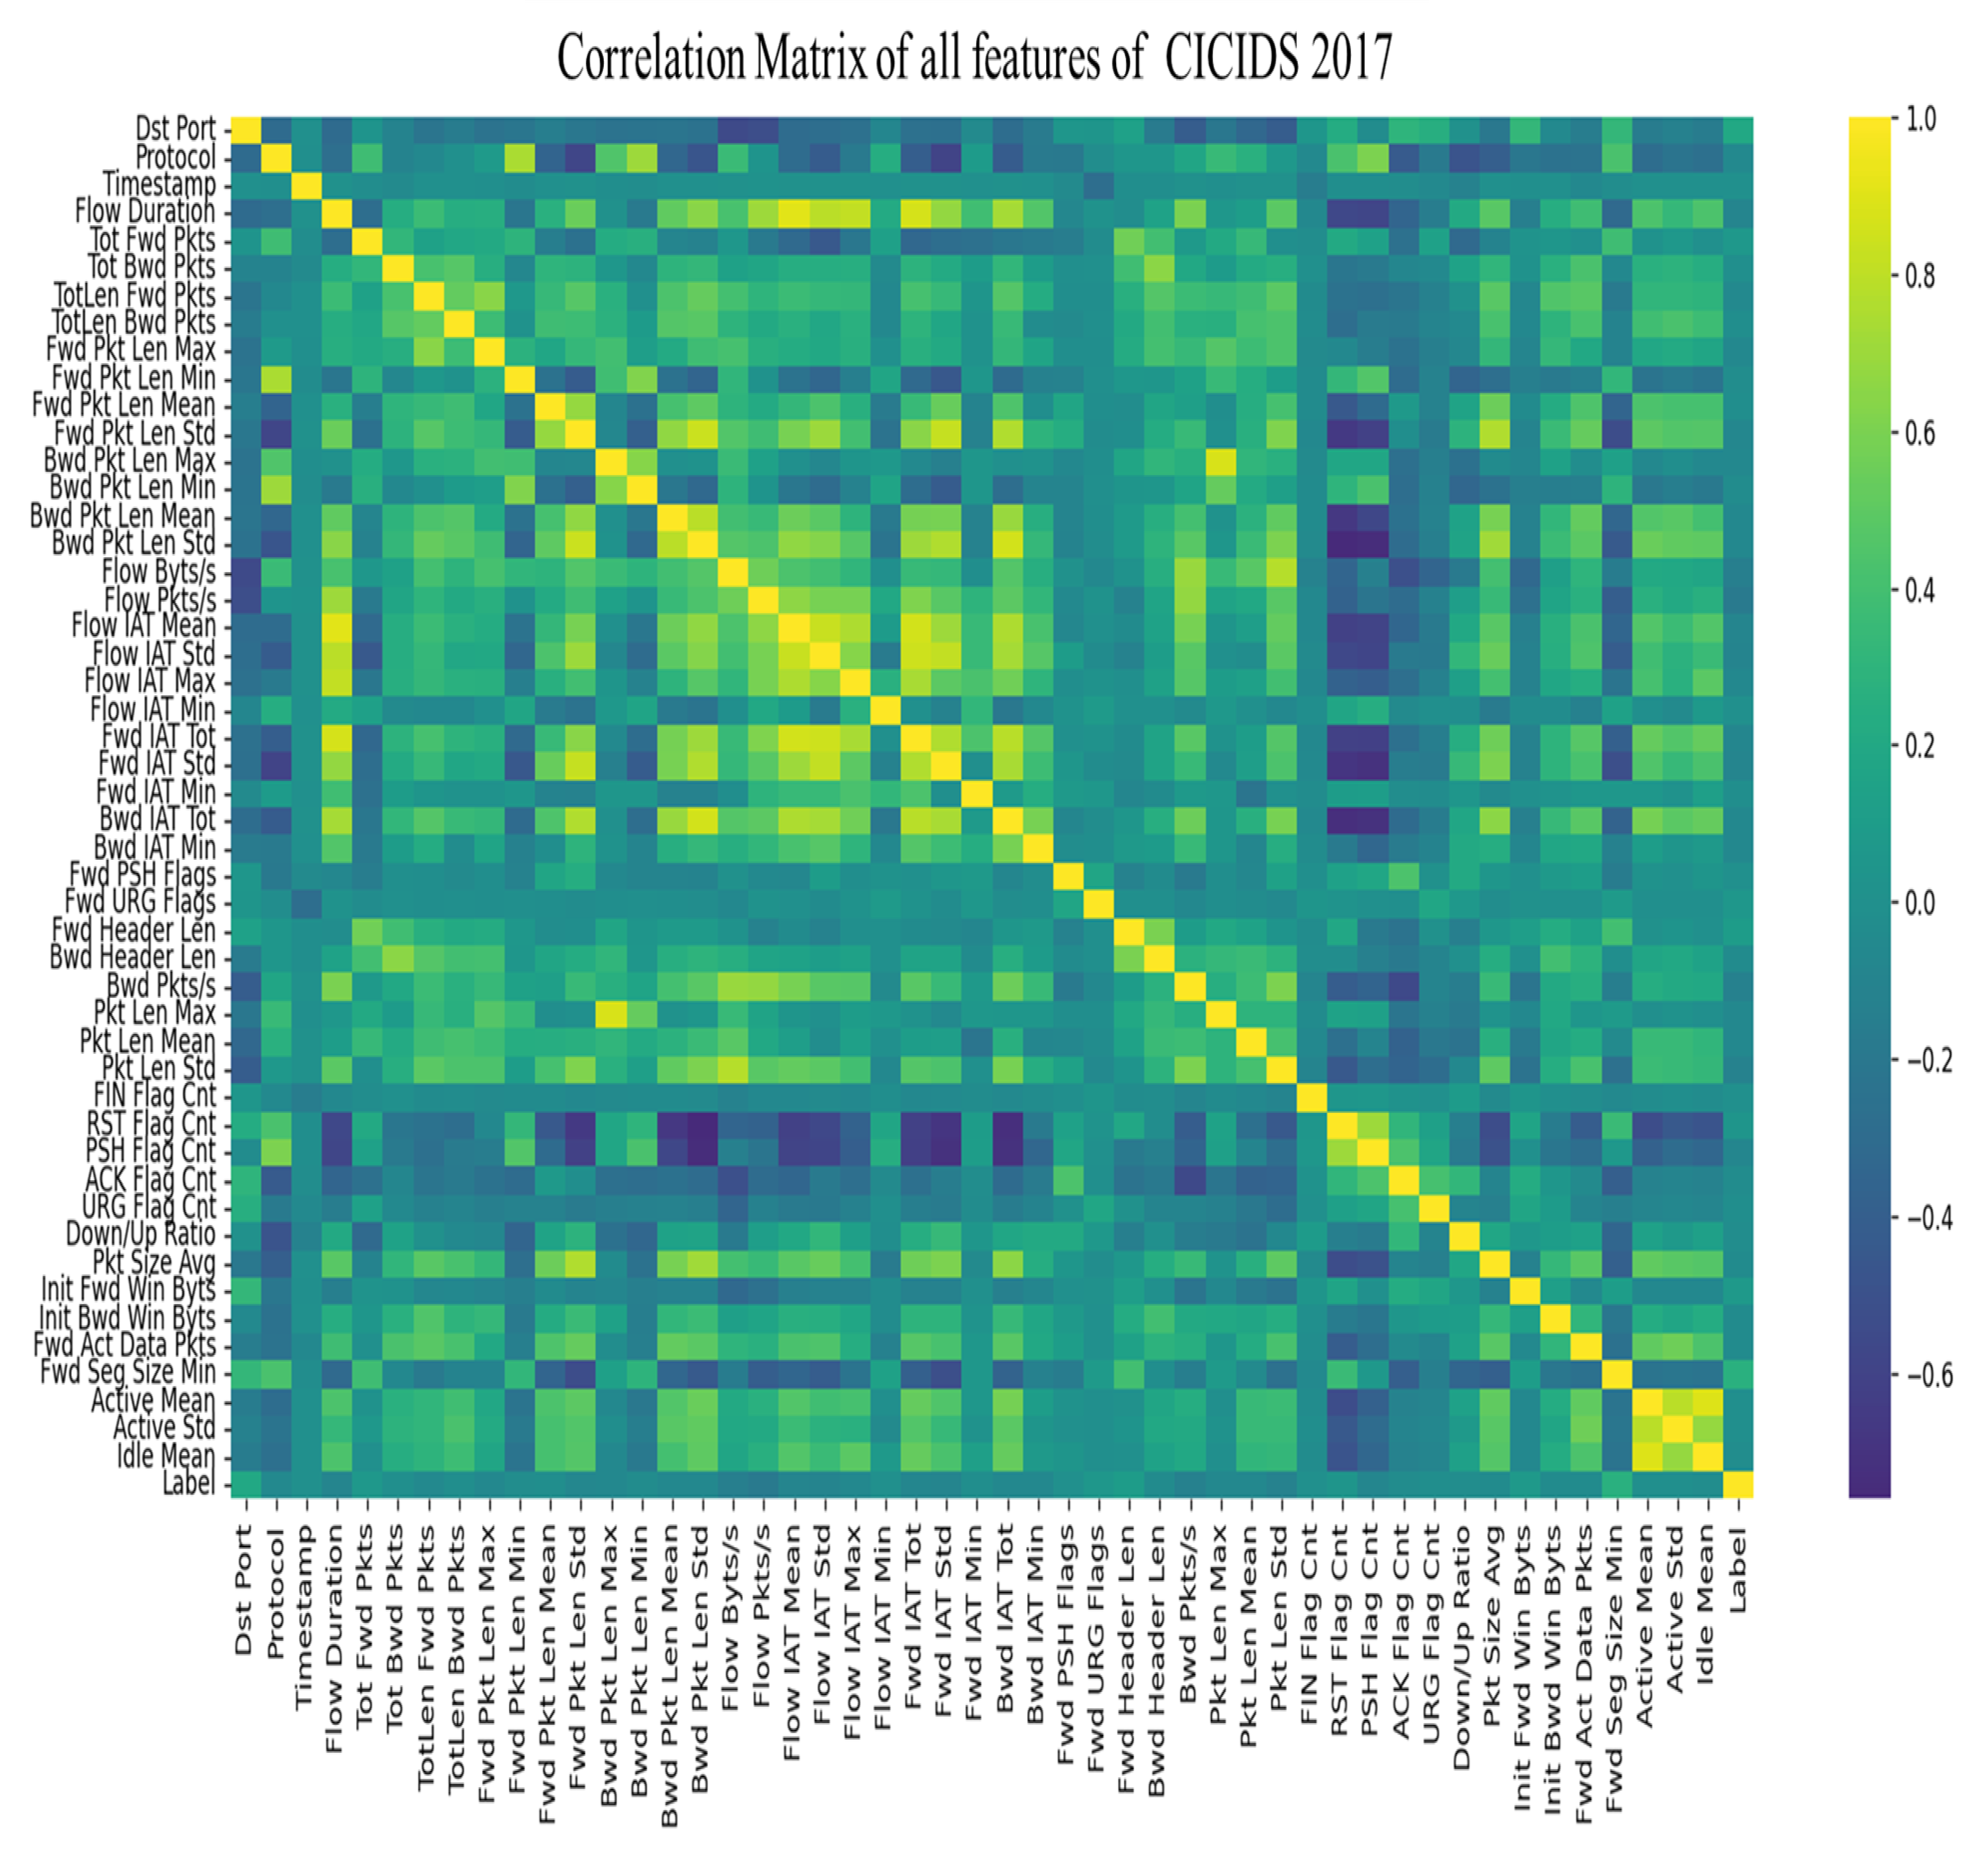
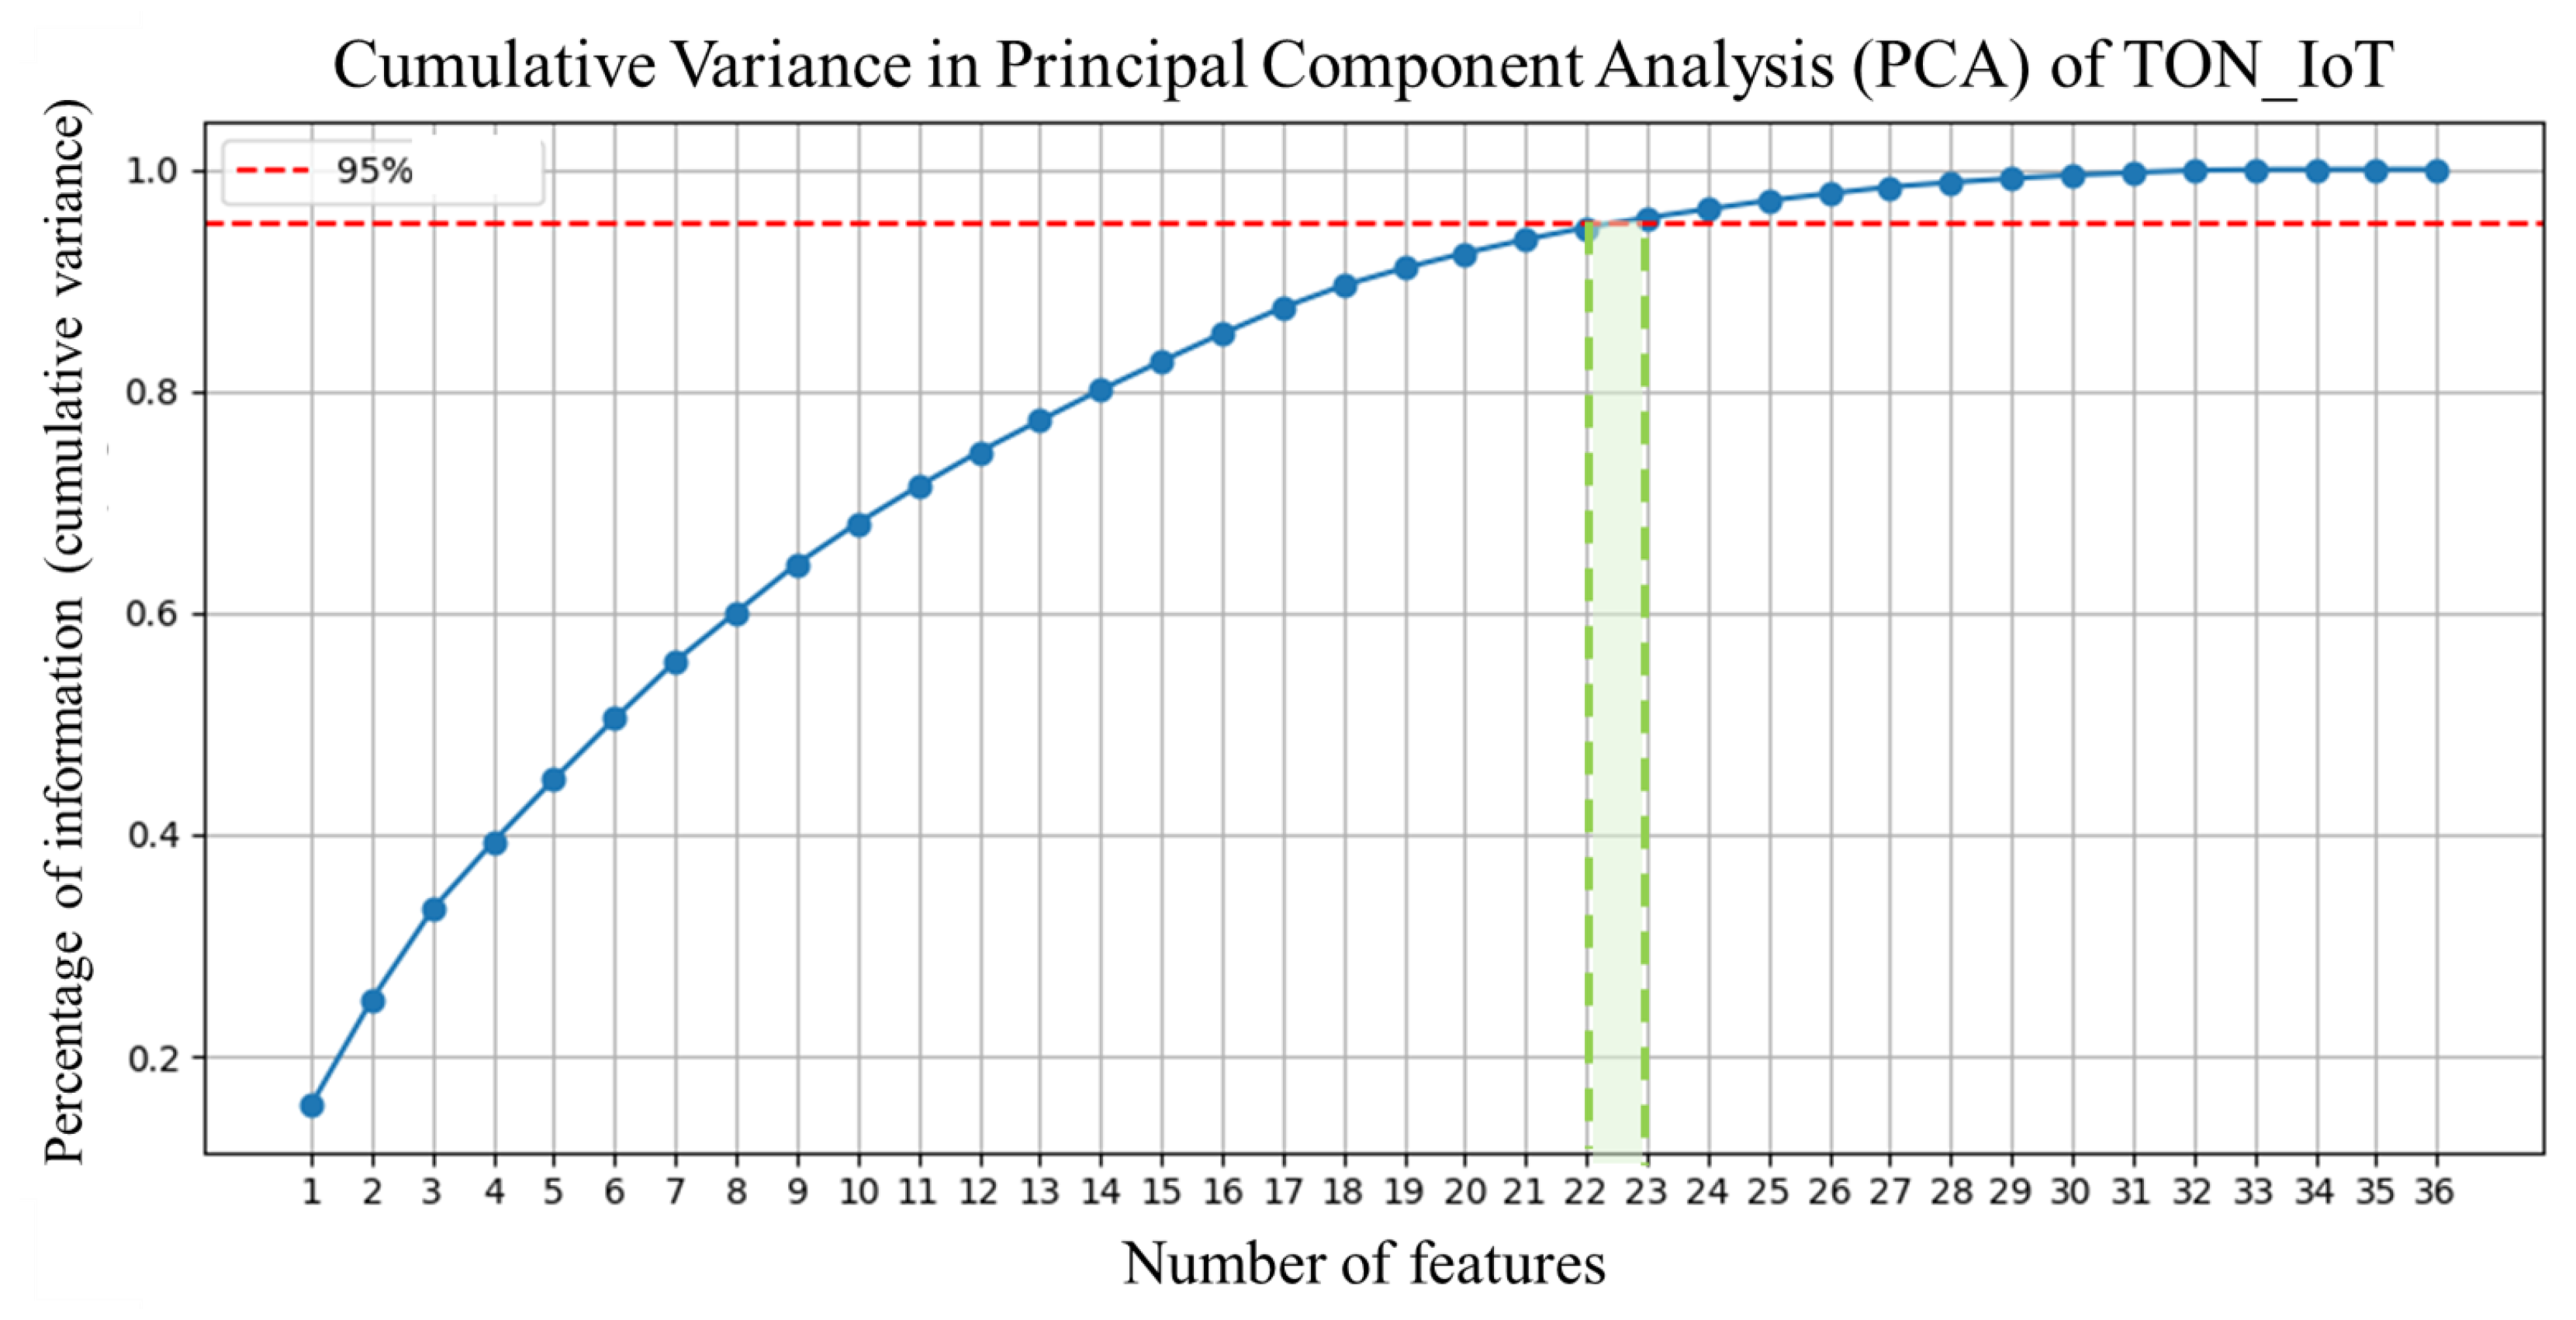
- Data Preprocessing:Data cleaning involved removing missing, redundant, or non-informative features. Principal component analysis (PCA) was applied to reduce dimensionality while preserving at least 95% of the total variance. Correlation matrices and variance plots supported feature selection.
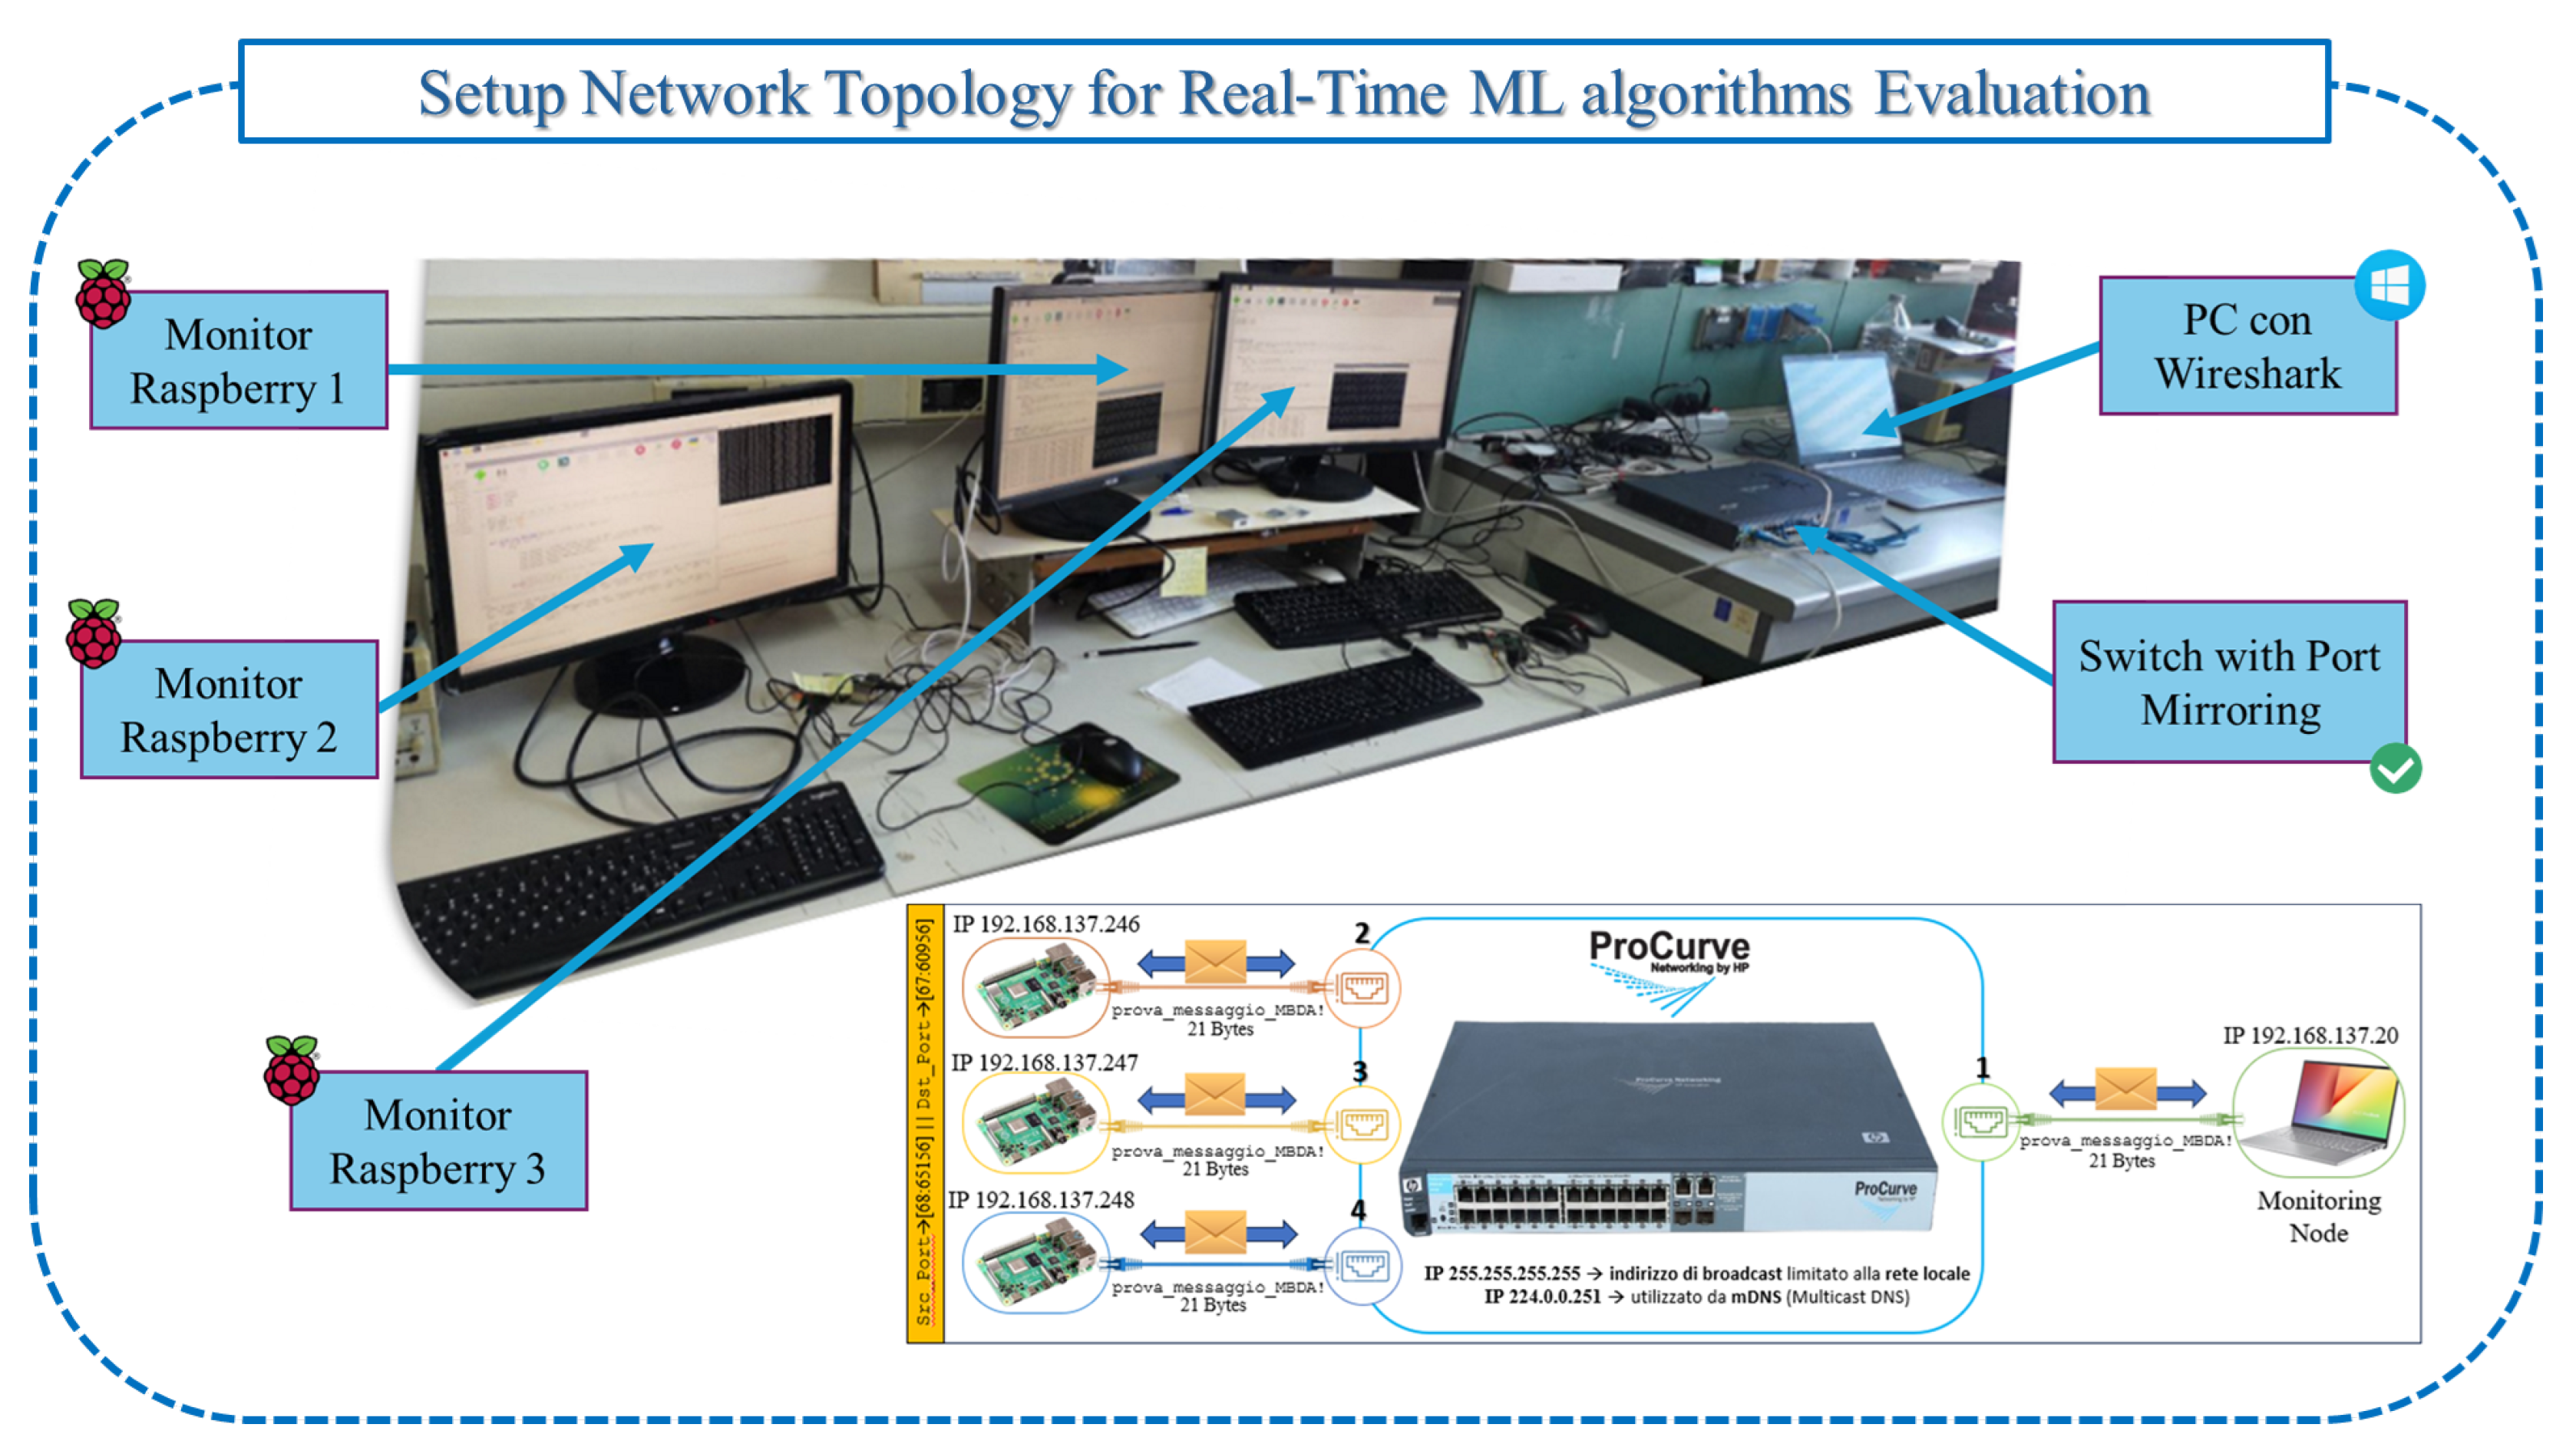
- Experimental Setup:A custom testbed simulating an NFSv4-based industrial network was developed. NFSv4 was selected due to its relevance in SCADA, PLC, and IoT-based systems, allowing centralized, non-redundant data access for monitoring and analysis.
- Runtime Evaluation:Models were tested in real time using key metrics such as accuracy, detection latency, precision, recall, F1-score, and runtime stability. Multiple dataset–algorithm combinations were benchmarked to identify the most robust and efficient configurations.
- Conclusions and Future Work:The study highlights the feasibility of deploying OCC-based IDS models in real-world conditions, going beyond traditional offline assessments. Proposed improvements include expanding the testbed complexity, integrating more recent datasets, and exploring next-generation ML approaches for enhanced evaluation under dynamic and constrained environments.
4. Dataset
4.1. KDD Cup 1999
4.2. NSL-KDD
4.3. CICIDS 2017
4.4. UNSW-NB15
4.5. Bot-IoT
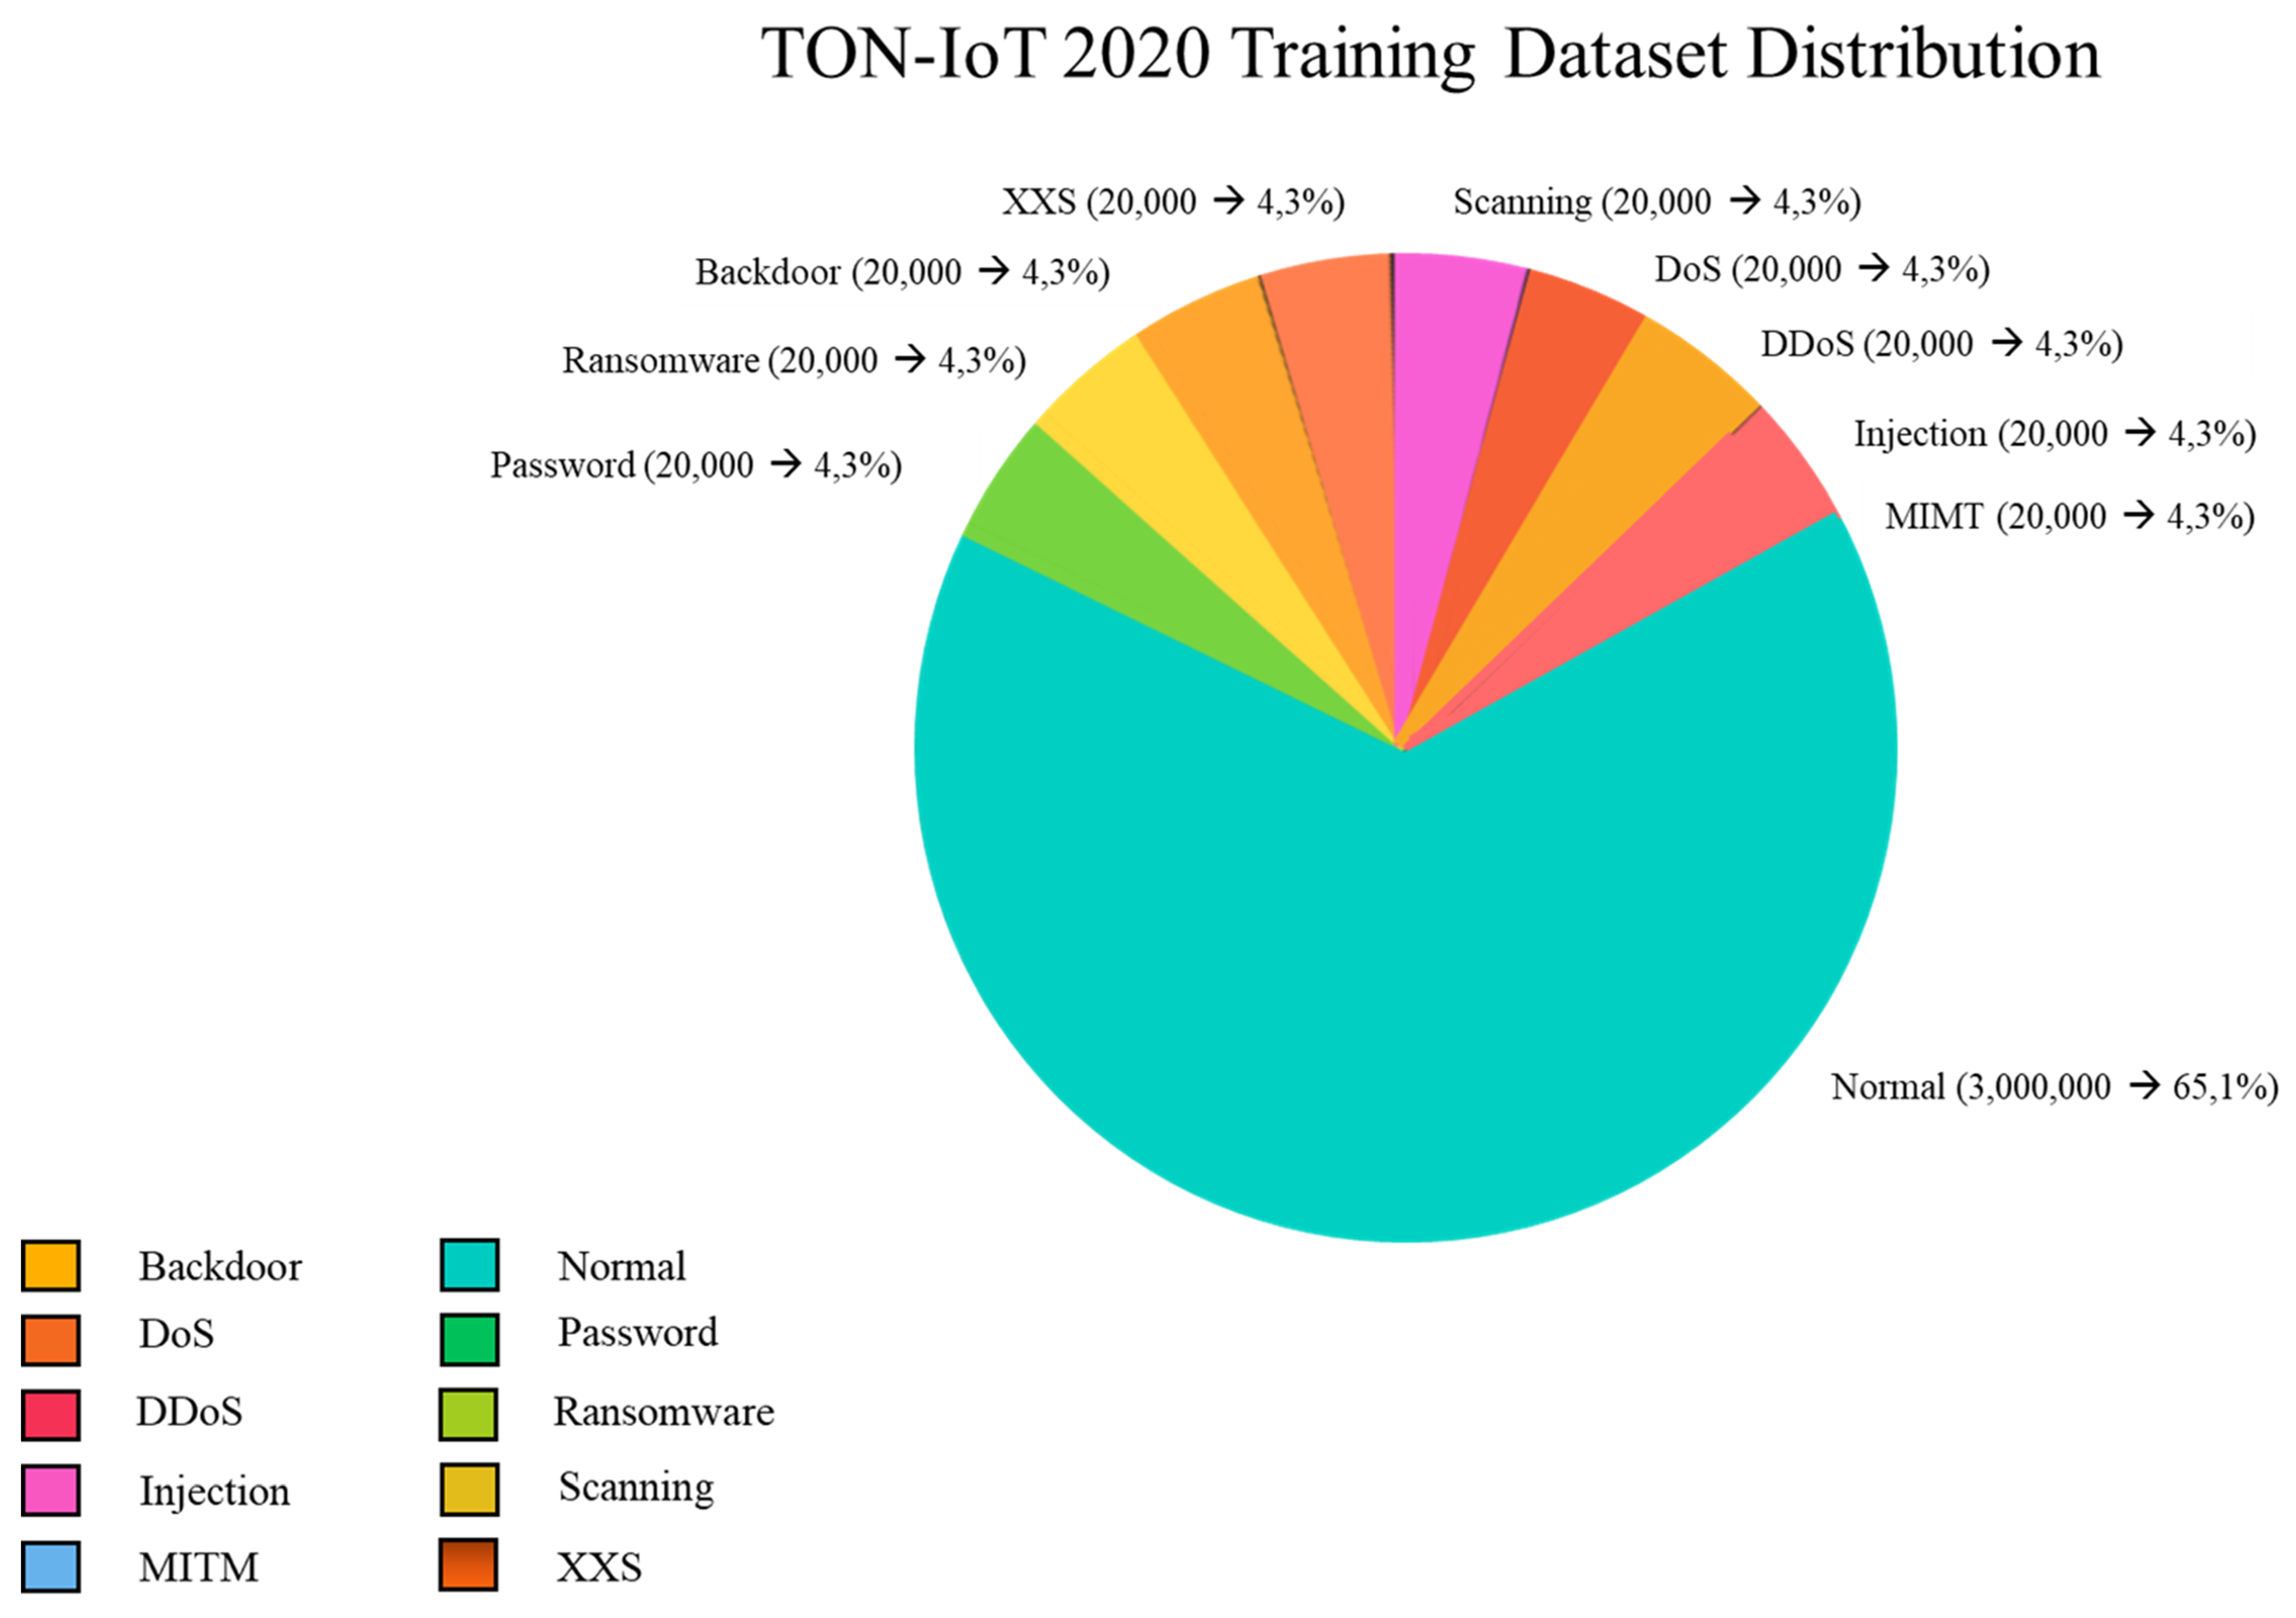
4.6. TON-IoT
4.7. Dataset Selection Justification
- Attack class overlap: The selected datasets already include a comprehensive variety of attacks, such as DoS/DDoS, brute force, infiltration, reconnaissance, shellcode, and data exfiltration, which are also present in BoT-IoT and CSE-CIC-IDS2018. Therefore, including those additional datasets would not introduce substantially novel threat scenarios.
- Source domain coverage: We ensured coverage across different environments: legacy datasets (NSL-KDD), enterprise-grade simulations (CICIDS2017), IoT-specific topologies (TON_IoT), and low-footprint attacks (UNSW-NB15). This combination already spans the intended industrial use cases.
- Avoiding redundancy and dataset inflation: The number of publicly available IDS datasets has grown significantly (e.g., on platforms like Kaggle, OpenML, and CICLab). Including all would dilute experimental focus and increase computational cost without a corresponding gain in insight.
- Quality and structure constraints: Some datasets, such as BoT-IoT, suffer from extreme class imbalance and redundancy, while CSE-CIC-IDS2018 is structurally similar to CICIDS2017 but with partial overlaps in feature sets and attack definitions. These factors would have introduced additional preprocessing complexity without offering unique evaluation benefits.
4.8. Dataset Bias Analysis
- 1.
- Imbalance Ratio (IR)It is defined as the ratio between the number of instances in the majority class and that of the minority class:In binary classification (normal vs. anomalous), an close to 1 indicates balance, while high values reflect skewness and difficulty for models to generalize.
- 2.
- Class EntropyEntropy H is a measure of uncertainty or diversity in class labels:where is the proportion of class i and C is the number of classes. Higher entropy indicates more uniform class distributions; lower entropy suggests dominance of one class.
- 3.
- Skewness of EntropyWe also compute the normalized entropy skewness with respect to the maximum entropy :Values closer to 1 indicate severe imbalance; values close to 0 indicate uniformity.
- NSL-KDD exhibits near-perfect class balance, both in IR and in entropy. This makes it ideal for training, but it may not reflect real-world distributions.
- UNSW-NB15 and CICIDS2017 show moderate imbalance (IR between 5 and 7), with relatively high entropy, indicating various types of attacks.
- TON_IoT, while modern and representative, shows severe class skewness, with IR ≈ 26 and low entropy. This may lead to underfitting of rare attack behaviors and high false negatives.
5. ML Methods One-Class Anomaly Detection
5.1. Taxonomy of One-Class Anomaly Detection Techniques
- 1.
- Detection Principle (Core Mechanism):
- Reconstruction-based: Models such as Autoencoder (AE) and Variational Autoencoder (VAE) aim to learn and reproduce normal input data, identifying anomalies via high reconstruction error.
- Boundary-based: One-Class SVM (OCSVM) and Deep SVDD create a compact boundary around normal data, flagging any deviation.
- Isolation-based: Isolation Forest separates anomalies by exploiting the fact that they are easier to isolate through random partitioning.
- Density/Distance-based: LOF and kNN-based approaches evaluate local data density or proximity to detect outliers.
- 2.
- Learning Paradigm:
- Shallow learning: Classical models (e.g., OCSVM, LOF, kNN, iForest) offer simplicity and interpretability, suitable for small or structured data.
- Deep learning: AE, VAE, and Deep SVDD are more expressive and powerful, particularly for complex or high-dimensional data.
- 3.
- Runtime Deployment Suitability:
- Edge-ready: AE, iForest, and OCSVM have acceptable latency and memory requirements for resource-constrained environments.
- Resource-intensive: VAE, Deep SVDD, and LOF may require significant CPU/GPU and are better suited for cloud or offline processing.
5.2. Autoencoder One-Class for Anomaly Detection
5.3. Variational Autoencoder (VAE) for One-Class Anomaly Detection
5.4. Isolation Forest for One-Class Anomaly Detection
- is the average path length of point x across all trees;
- is the average path length of unsuccessful searches in a binary search tree, used to normalize the score, and is approximated as:
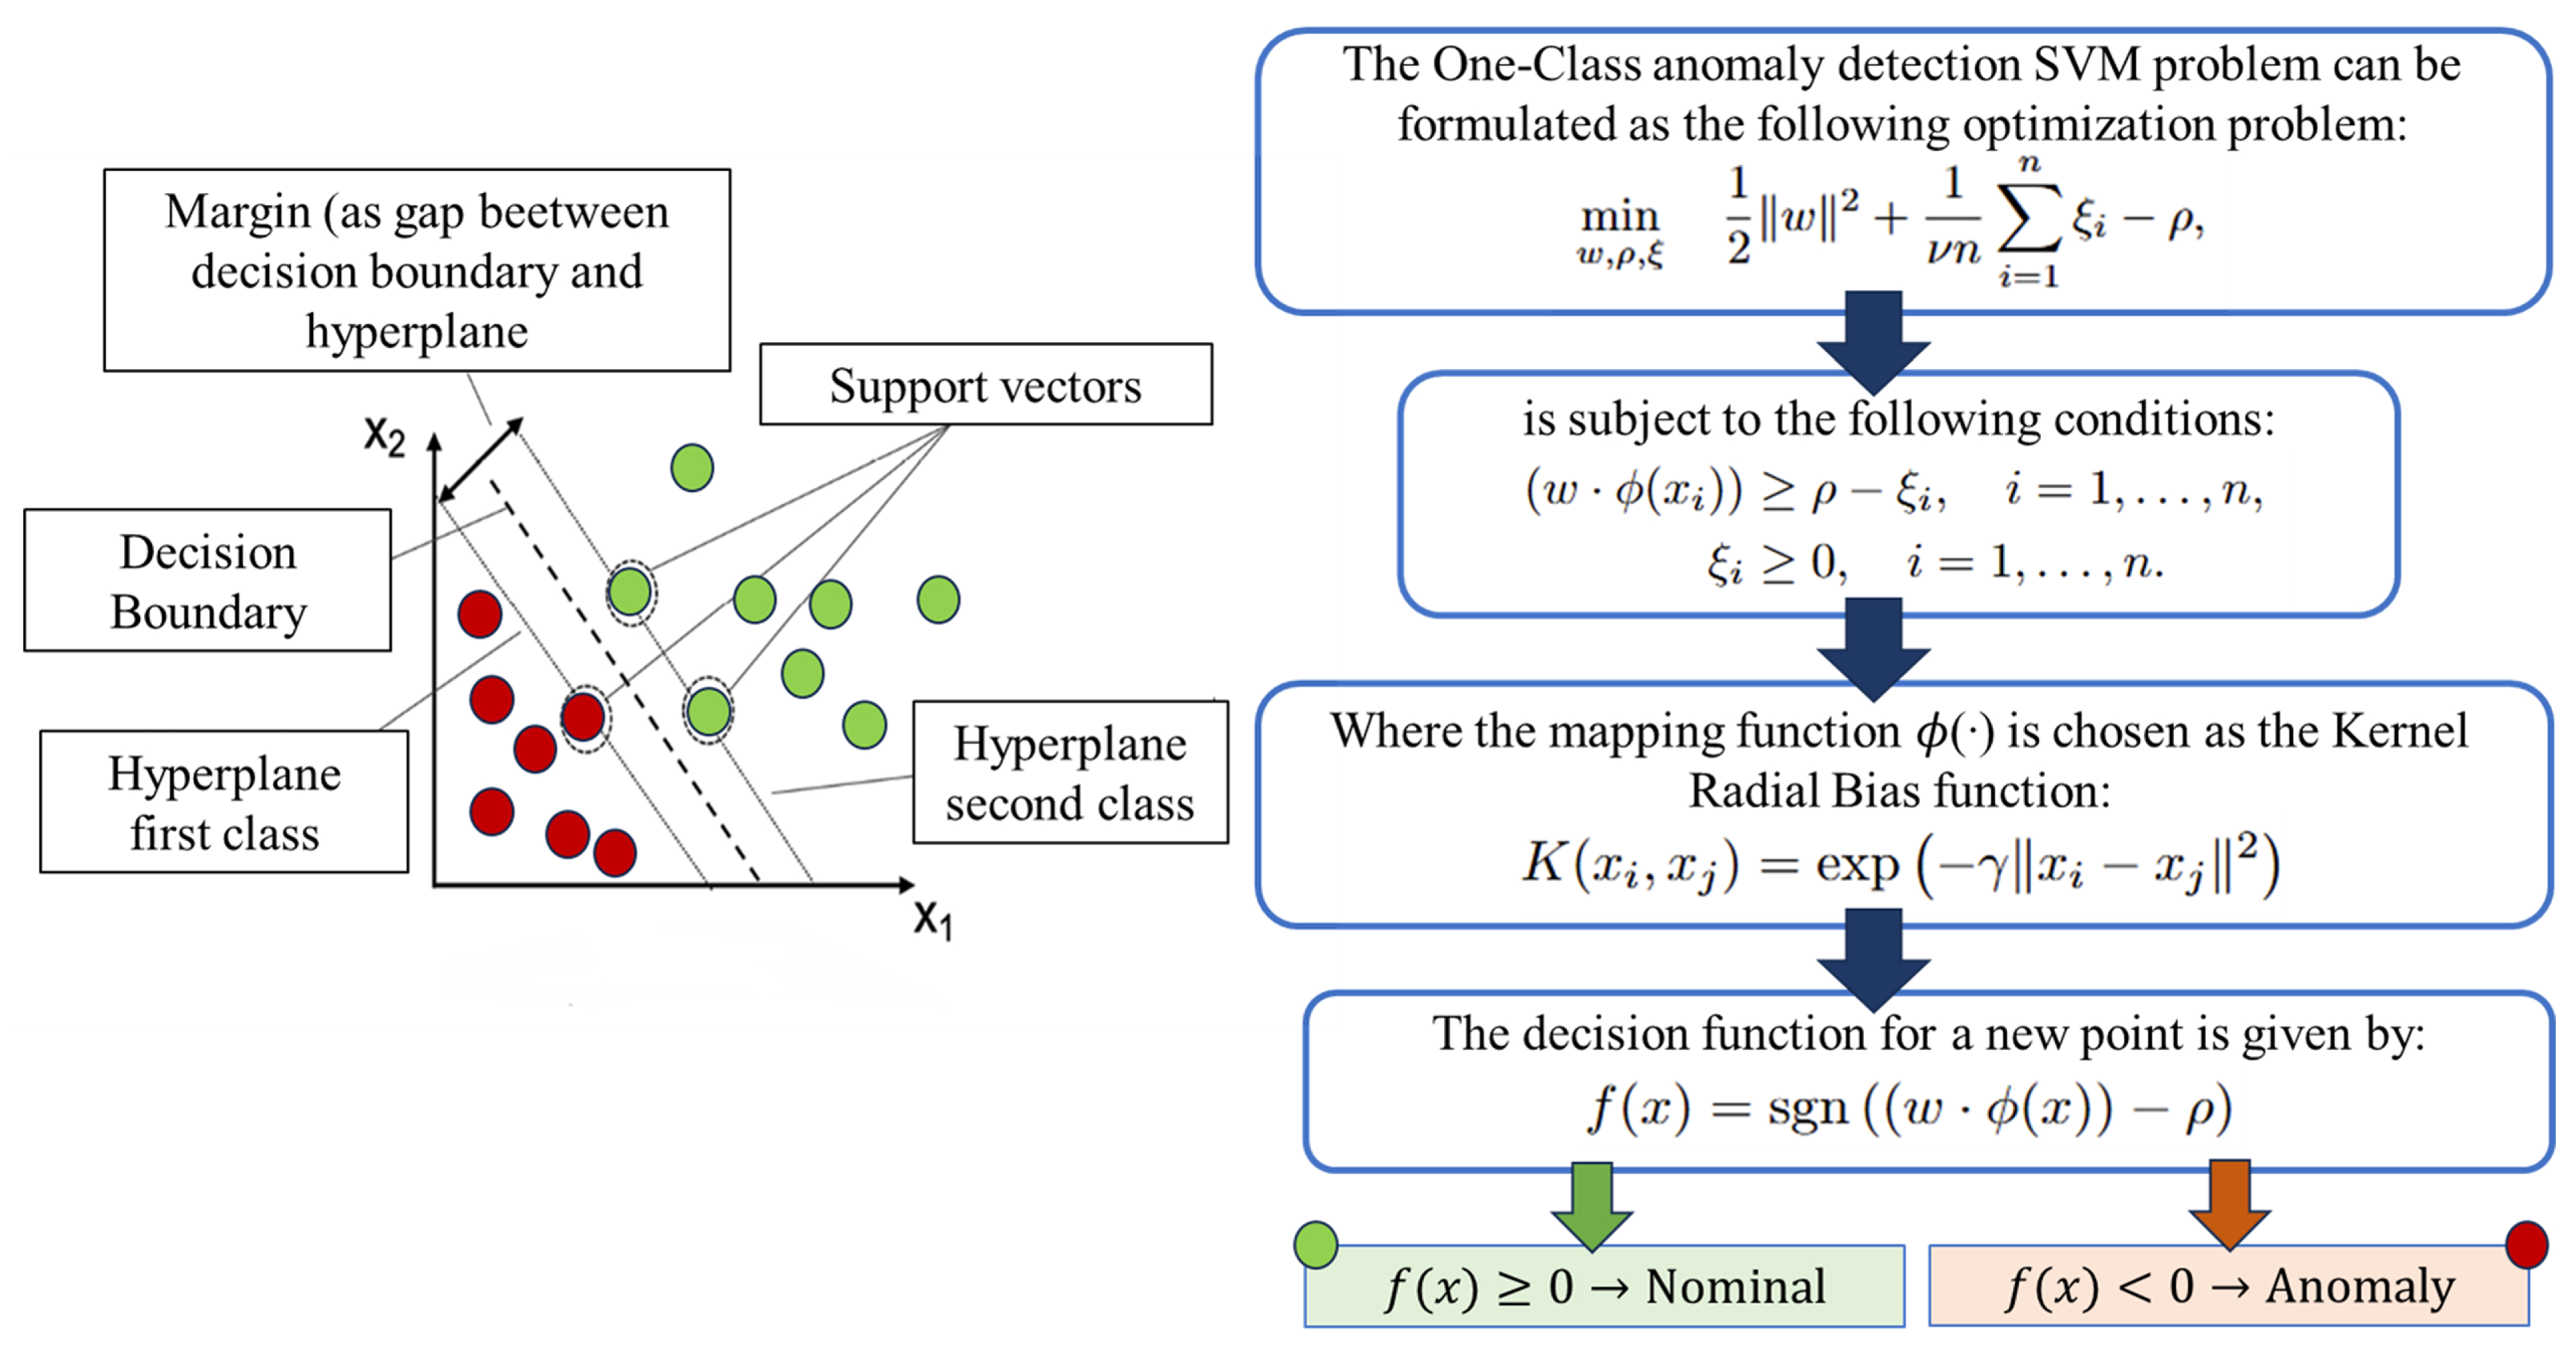
5.5. One-Class Support Vector Machine (OCSVM) for Anomaly Detection
5.6. Other One-Class Anomaly Detection Techniques: LOF, Deep SVDD, and kNN
- 1.
- Local Outlier Factor (LOF)LOF is a density-based anomaly detection method that estimates the degree of isolation of a data point by comparing its local density with that of its neighbors. The local reachability density of a point is computed based on its k-nearest neighbors, and the LOF score is defined as:where denotes the local reachability density, and is the set of the k-nearest neighbors of . An LOF score significantly greater than 1 indicates a potential outlier. Although efficient and unsupervised, LOF is sensitive to the choice of k and may degrade in high-dimensional feature spaces.
- 2.
- Deep Support Vector Data Description (Deep SVDD)Deep SVDD [153] extends the classical SVDD method by leveraging a deep neural network to learn a nonlinear transformation that maps inputs into a latent space where normal samples are enclosed in a minimal-radius hypersphere. The training objective is to minimize:where c is the center of the hypersphere in the latent space. This approach avoids the need for input reconstruction, focusing instead on compressing normal behavior representations. Deep SVDD is particularly effective on structured data but incurs a high computational cost, making it less suitable for edge-level runtime deployment.
- 3.
- kNN-Based One-Class DetectionThis method assigns anomaly scores to new observations based on their distances from k-nearest neighbors in the training data [154]:If the score exceeds a threshold , the sample is flagged as anomalous. kNN-based OCC is simple and interpretable but not well suited to high-volume or high-dimensional data due to scalability issues.
5.7. Discussion and Justification of Exclusion
- Lack of optimized support for real-time deployment in Python-based runtime environments (e.g., pyshark, joblib).
- Inability to meet the latency constraints imposed by our edge-based system on Raspberry Pi hardware.
- High sensitivity to hyperparameter tuning, which may hinder practical out-of-the-box integration in a plug-and-play GUI framework.
6. Preprocessing Data and Setup
6.1. Feature Preprocessing and Normalization
6.2. Feature Reduction Using Principal Component Analysis (PCA)
- 1.
- Dataset Centering
- 2.
- Covariance Matrix Computation
- 3.
- Eigenvalue and Eigenvector Decomposition
- 4.
- Projection into the Reduced Space
6.3. Performance Evaluation
- True Positives (TP): number of instances correctly predicted as belonging to the positive class.
- True Negatives (TN): number of instances correctly predicted as belonging to the negative class.
- False Positives (FP): number of instances incorrectly predicted as positive when they actually belong to the negative class.
- False Negatives (FN): number of instances incorrectly predicted as negative when they actually belong to the positive class.
- Accuracy
- Precision
- Recall (Sensitivity or True Positive Rate)
- F1-Score
6.4. Experimental Setup: NFSv4 Server with Runtime IDS and Multi-Client Architecture
- Request frequency and inter-arrival time;
- Packet size distribution;
- Port and protocol usage (TCP/UDP);
- System metrics (I/O, syscall anomalies).
7. Experiment & Results
7.1. Experimental Procedure and Runtime Evaluation Setup
| Algorithm 1: Nominal Traffic Generation (Client Side) |
 |
- Select the ML technique to be tested from a predefined list;
- Specify the network interface or port to be monitored;
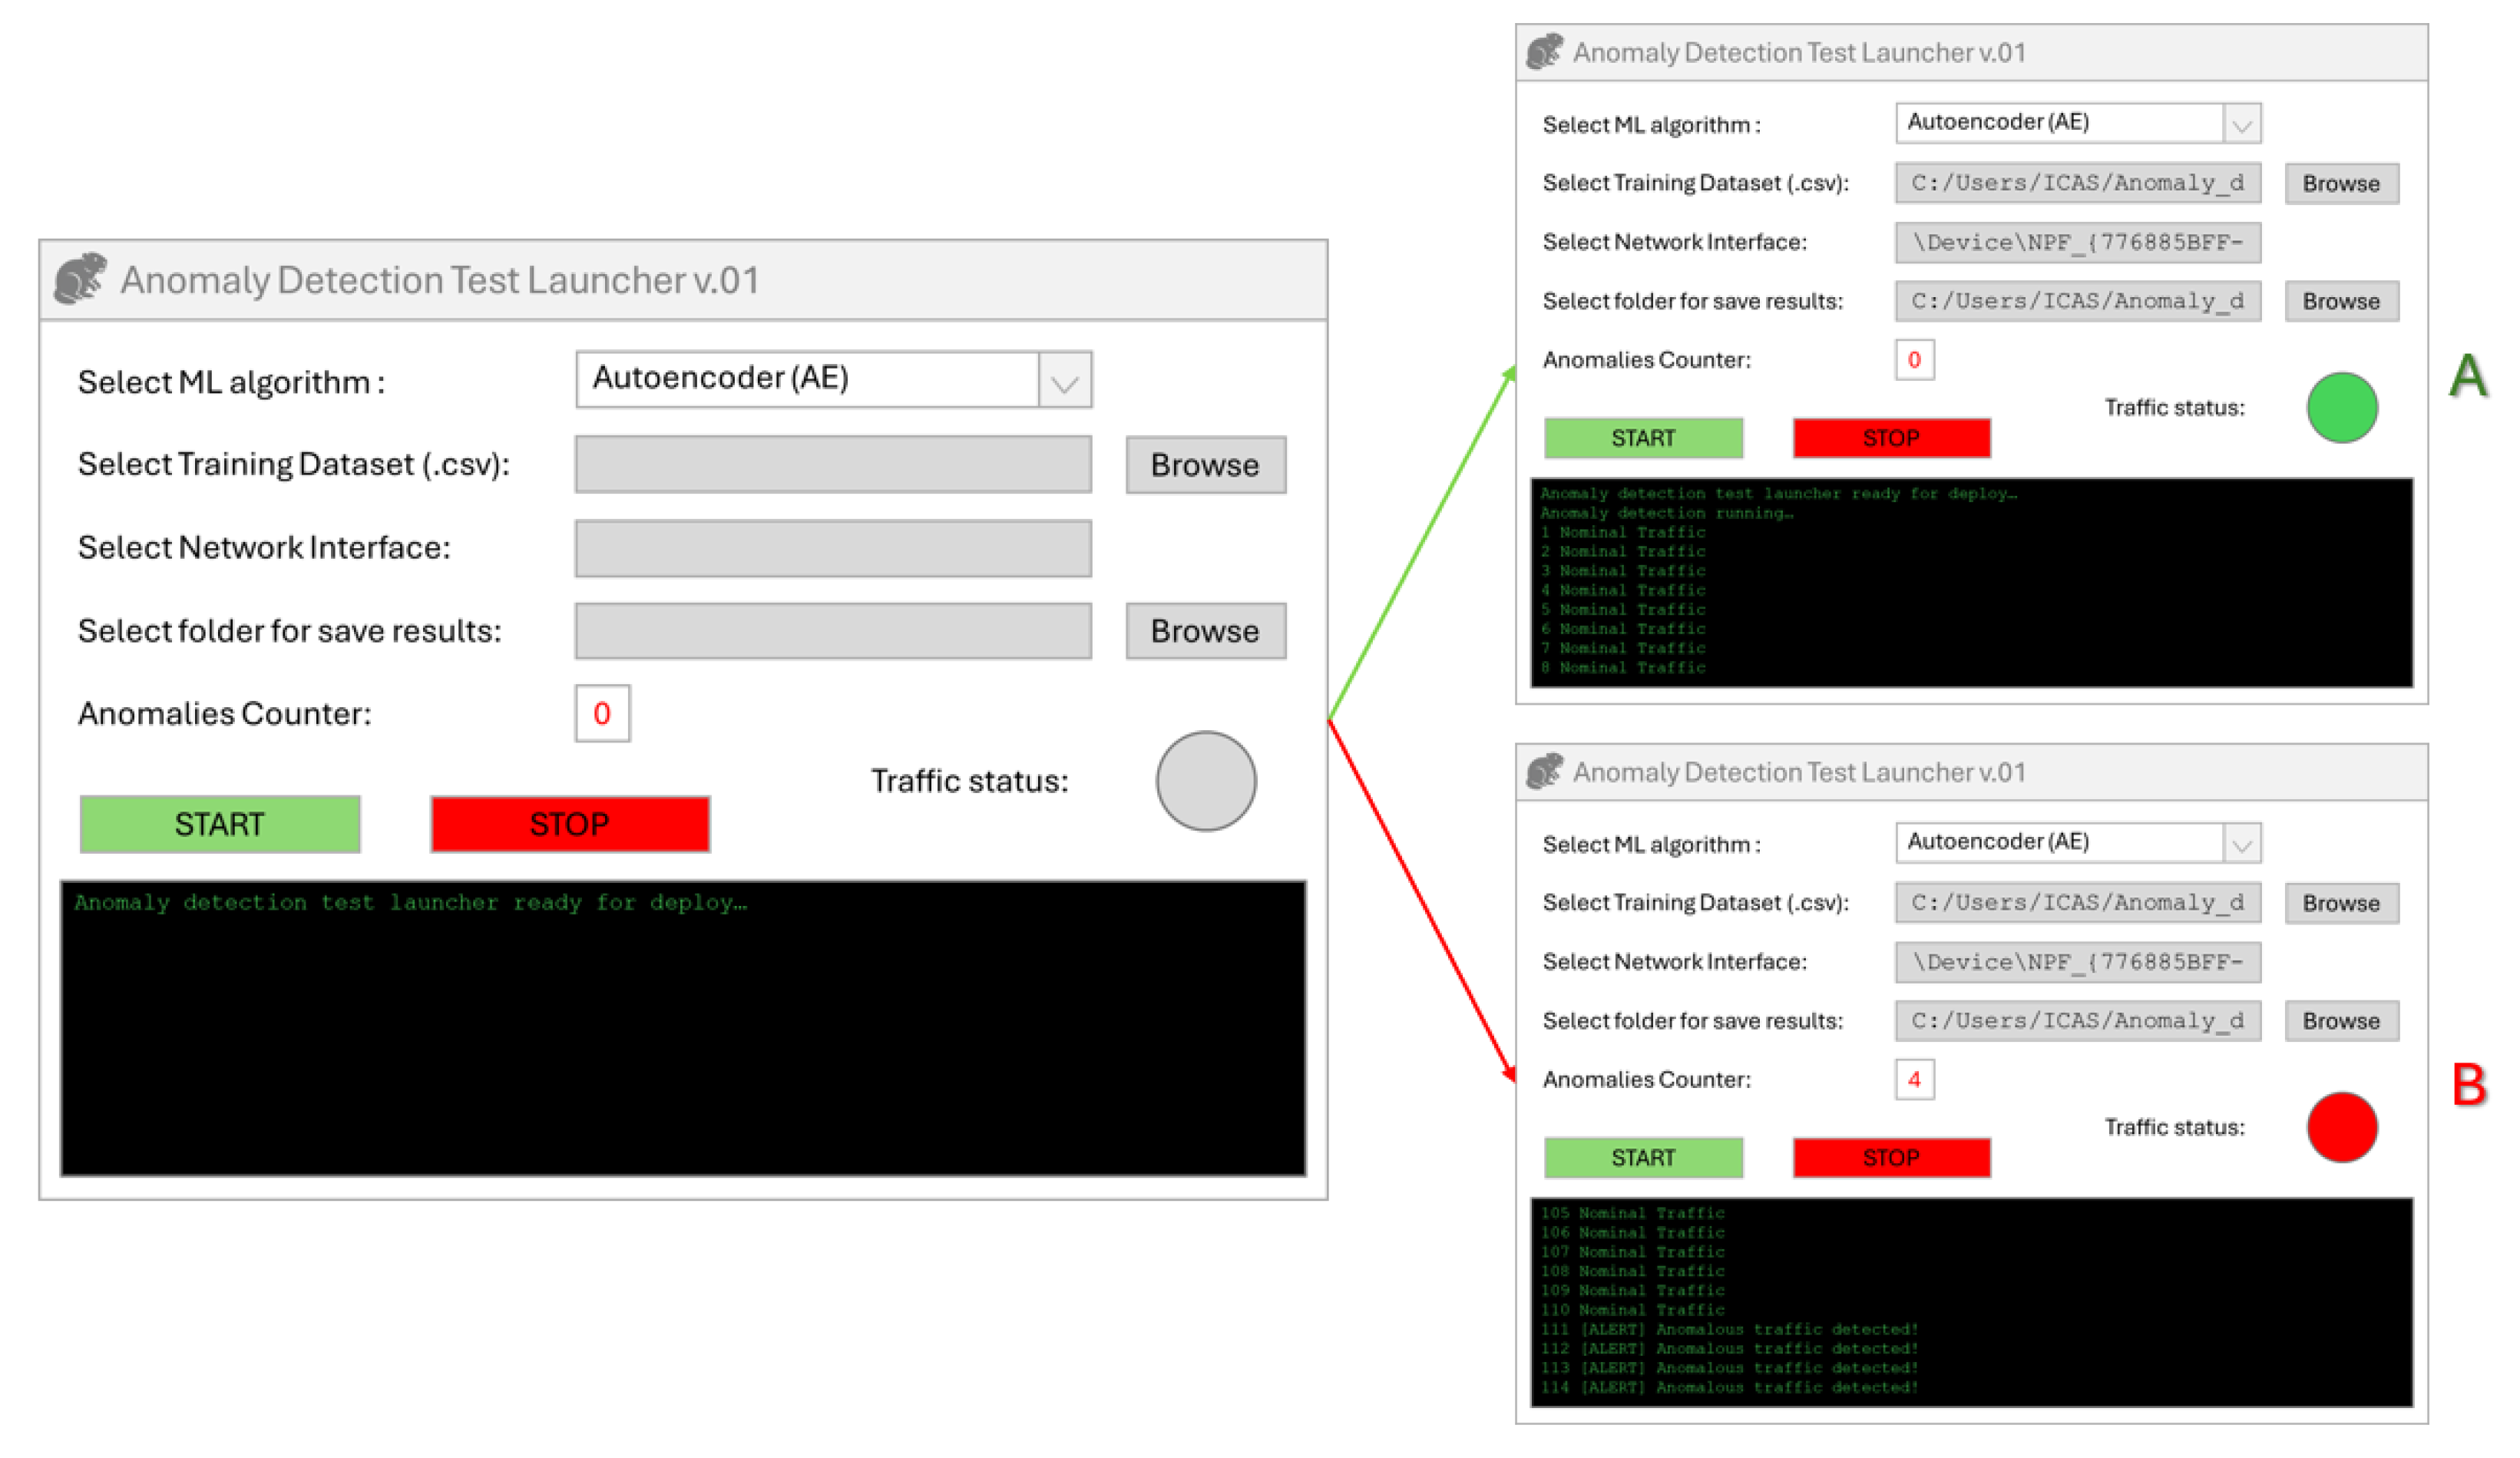
- Launch the detection process and visualize outcomes in real time.
- A summary of performance metrics (accuracy, precision, recall, F1-score) in structured output;
- A historical report saved in plain-text (.txt) format, logging each observed packet with timestamp, classification result, and basic flow metadata.
| Algorithm 2: Multi-Type Attack Traffic Generator (Client Side) |
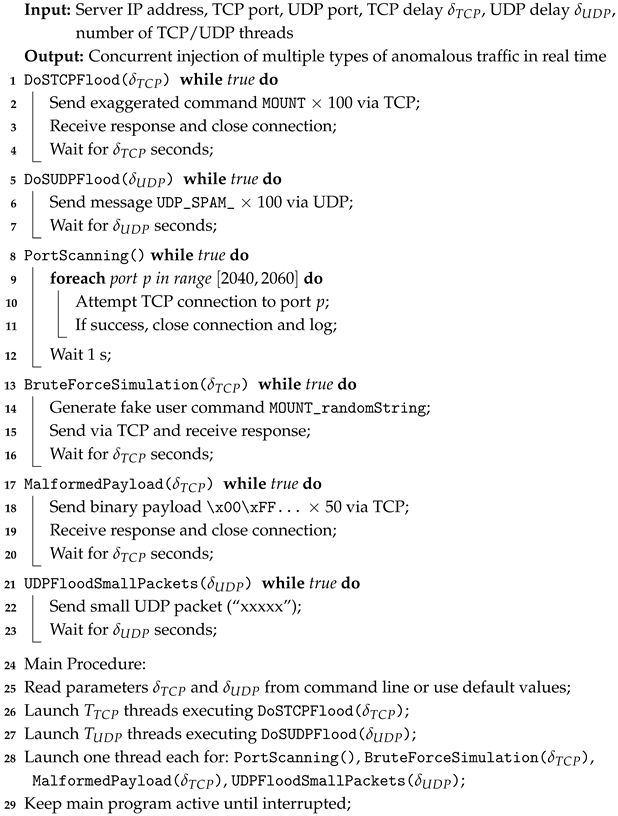 |
| Algorithm 3: TCP/UDP Request Listener on NFSv4 Simulated Server |
 |
| Algorithm 4: Runtime Intrusion Detection on Server using ML model selected (Server Side) |
 |
7.2. Results of Experiment
7.3. Statistical Validation of Performance Differences
- The UNSW-NB15 dataset yielded the strongest statistical separation (F = 21.58), with VAE and AE showing consistently higher F1-scores than OCSVM and iForest.
- NSL-KDD and CICIDS2017 showed similar trends, although the gap between the deep and classical models was narrower.
- TON_IoT, being highly imbalanced, resulted in slightly lower F-statistics but still confirmed significance.
- AE and VAE significantly outperform iForest and OCSVM across all datasets;
- The difference between AE and VAE was not statistically significant, supporting their comparable effectiveness;
- OCSVM and iForest yielded overlapping performance in TON_IoT.
7.4. Benchmark Comparison with State-of-the-Art IDS
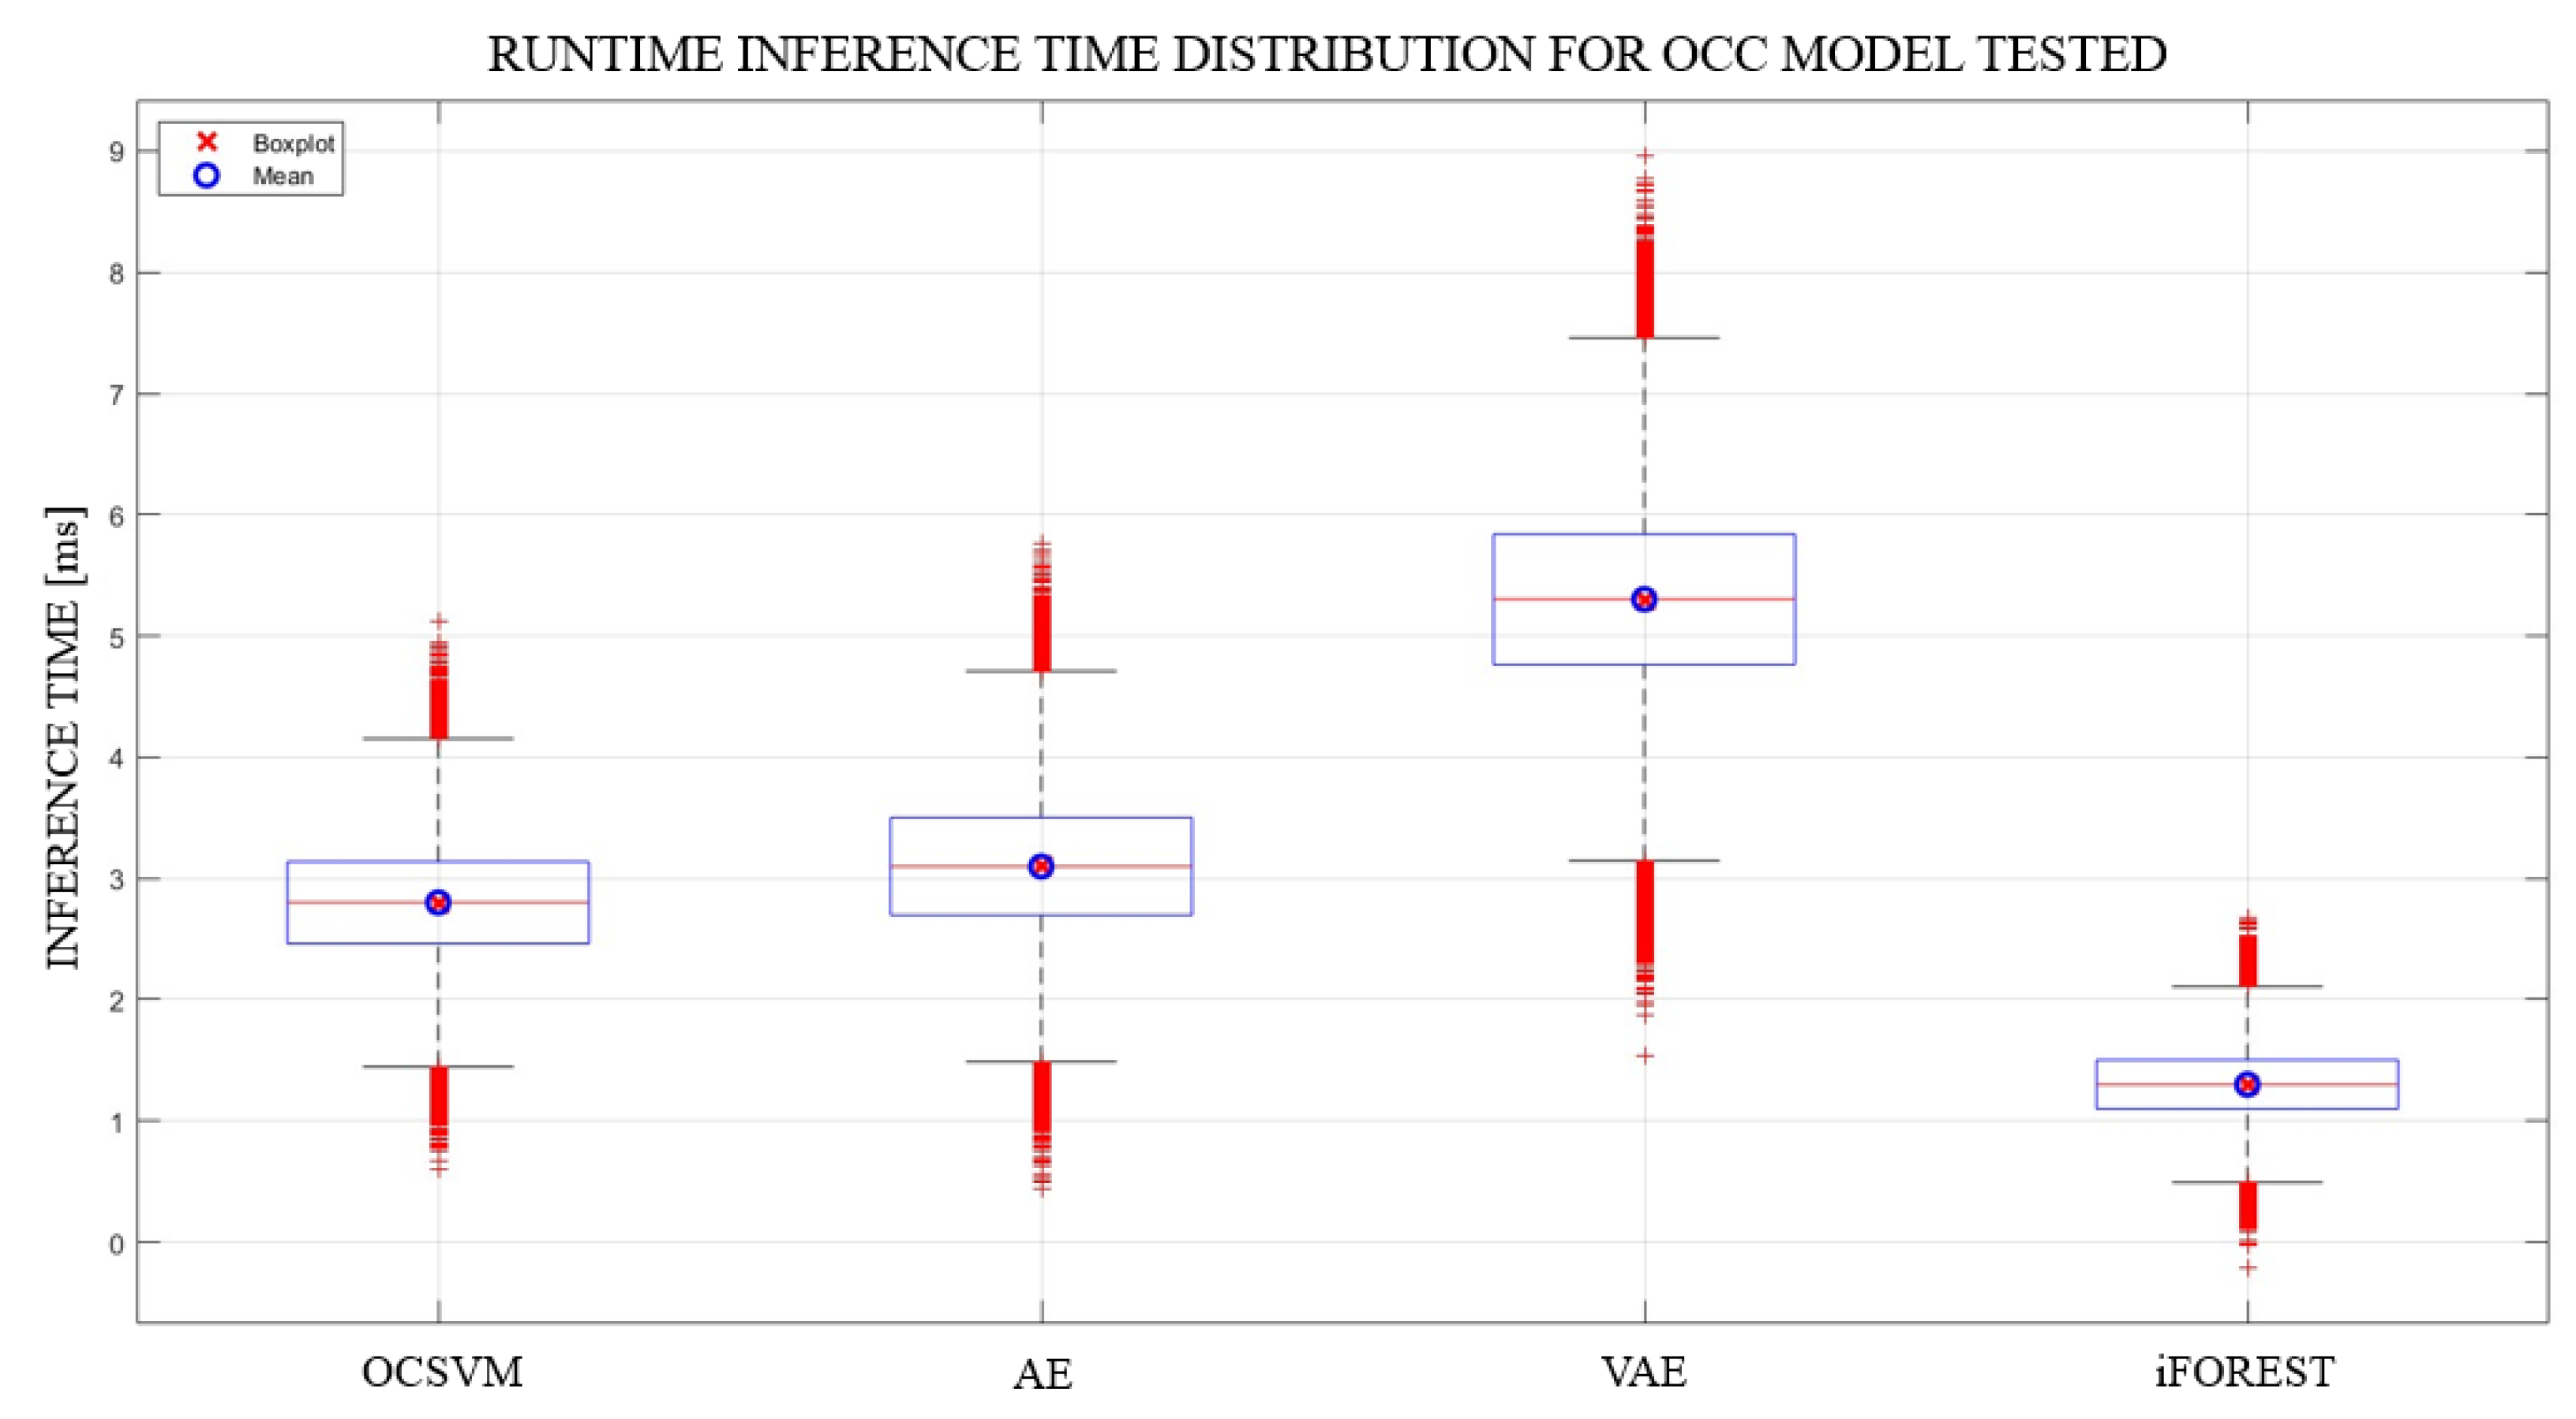
- Real-time execution: All models are executed in streaming mode using PyShark capture, with average latency below 5.5 ms per packet.
- Offline-free deployment: Unlike supervised models such as DeepIDS, our framework does not require labeled attack data for training.
- Modular GUI and configurability: The implemented interface allows model switching, real-time monitoring, and auto-logging—rarely found in academic prototypes.
- Competitive accuracy: The best model (VAE with UNSW-NB15) achieves 96% accuracy and 93% F1-score, outperforming unsupervised baselines like LOF.
7.5. Limitations and Critical Analysis
- Sensitivity to Training Data Quality: OCC models are trained exclusively on nominal data. Any biases, artifacts, or inconsistencies in this training set may lead to overfitting or misclassification of benign deviations as anomalies. Datasets such as NSL-KDD, which contain redundant or outdated traffic patterns, tend to reduce model generalization.
- False Positive Rate (FPR): Due to the absence of labeled attack samples, OCC models construct tight boundaries around the nominal class. As shown in Table 17, this often results in non-negligible false positive rates—particularly when tested on complex or imbalanced datasets such as CICIDS2017 or TON_IoT. For instance, the AE model trained on CICIDS2017 yields an FPR above 11%.
- Threshold Calibration: For models based on reconstruction error (e.g., AE and VAE), detection depends on a critical threshold . If the reconstruction error exceeds , the sample is flagged as anomalous:Improper selection of can significantly impact the trade-off between precision and recall. Static thresholds may also degrade performance in the presence of runtime variability.
- Concept Drift: Network traffic patterns and system behaviors evolve over time. Without periodic retraining or adaptation, OCC models may fail to detect new types of anomalies or may increasingly classify benign changes as malicious, thereby degrading long-term performance.
- Lack of Interpretability: Deep-learning-based OCC models (e.g., VAE) tend to operate as black boxes. This impedes root cause analysis and limits the explainability of alarms—a critical requirement in industrial or military environments.
- 1.
- Dynamic or percentile-based thresholding to reduce sensitivity to global scale variations;
- 2.
- Online learning or periodic retraining using updated nominal traffic samples;
- 3.
- Hybrid semi-supervised models capable of incorporating occasional labeled anomalies;
- 4.
- Explainable AI (XAI) layers or attribution techniques to improve transparency and operational trust.
8. Discussion and Future Work
- UNSW-NB15 outperformed other datasets, consistently yielding the highest precision and F1-scores across all OCC models.
- AE and VAE showed superior recall and F1-score, confirming their effectiveness in capturing complex traffic patterns, albeit with increased inference latency.
- Isolation Forest demonstrated the best latency/performance trade-off, making it suitable for resource-constrained, real-time deployments.
- The runtime testbed revealed the practical impact of dataset bias, dimensionality, and preprocessing strategies on detection accuracy and system robustness.
Author Contributions
Funding
Data Availability Statement
Conflicts of Interest
Abbreviations
| Acronym | Meaning | Description |
| OCC | One-Class Classification | ML technique trained only on normal data to detect anomalies as deviations. |
| IDS | Intrusion Detection System | System for identifying unauthorized or anomalous activity in a network. |
| ML | Machine Learning | Field of study focused on algorithms that improve from data. |
| AE | Autoencoder | Neural network that learns to reconstruct its input, used for anomaly detection. |
| VAE | Variational Autoencoder | Probabilistic autoencoder that models data distribution with latent variables. |
| OCSVM | One-Class Support Vector Machine | OCC algorithm that finds a boundary around normal data in feature space. |
| iForest | Isolation Forest | Tree-based anomaly detection method that isolates anomalies via random partitioning. |
| NFSv4 | Network File System version 4 | Protocol for remote file sharing over a network. |
| RPC | Remote Procedure Call | Protocol for executing a procedure on a remote host. |
| GUI | Graphical User Interface | Visual interface allowing users to interact with a system or application. User-friendly interface for controlling runtime detection and training. |
| TCP | Transmission Control Protocol | Reliable transport-layer protocol for ordered data delivery. |
| UDP | User Datagram Protocol | Lightweight transport-layer protocol for low-latency communication. |
| PCA | Principal Component Analysis | Linear dimensionality reduction technique based on variance preservation. |
| PPV | Positive Predictive Value | Also called precision; proportion of true positives among predicted positives. |
| BCE | Binary Cross-Entropy | Loss function used in binary classification and reconstruction tasks. |
| DoS | Denial of Service | Attack that aims to disrupt service availability by flooding with traffic. |
| XSS | Cross-Site Scripting | Attack that injects malicious scripts into otherwise benign websites. |
| MITM | Man-In-The-Middle | Attack where an adversary intercepts and possibly alters communication. |
References
- Annapareddy, V.N.; Preethish Nanan, B.; Kommaragiri, V.B.; Gadi, A.L.; Kalisetty, S. Emerging Technologies in Smart Computing, Sustainable Energy, and Next-Generation Mobility: Enhancing Digital Infrastructure, Secure Networks, and Intelligent Manufacturing. SSRN Electron. J. 2022. [Google Scholar] [CrossRef]
- Nair, M.M.; Tyagi, A.K. AI, IoT, blockchain, and cloud computing: The necessity of the future. In Distributed Computing to Blockchain; Elsevier: Amsterdam, The Netherlands, 2023; pp. 189–206. [Google Scholar]
- Lampropoulos, G.; Siakas, K.; Anastasiadis, T. Internet of things in the context of industry 4.0: An overview. Int. J. Entrep. Knowl. 2019, 7, 4–19. [Google Scholar] [CrossRef]
- Malik, A.; Om, H. Cloud computing and internet of things integration: Architecture, applications, issues, and challenges. In Sustainable Cloud and Energy Services: Principles and Practice; Springer: Berlin/Heidelberg, Germany, 2018; pp. 1–24. [Google Scholar]
- Sharma, S.; Chang, V.; Tim, U.S.; Wong, J.; Gadia, S. Cloud and IoT-based emerging services systems. Clust. Comput. 2019, 22, 71–91. [Google Scholar] [CrossRef]
- Elhanashi, A.; Dini, P.; Saponara, S.; Zheng, Q. Integration of deep learning into the iot: A survey of techniques and challenges for real-world applications. Electronics 2023, 12, 4925. [Google Scholar] [CrossRef]
- Li, Y.; Liu, Q. A comprehensive review study of cyber-attacks and cyber security; Emerging trends and recent developments. Energy Rep. 2021, 7, 8176–8186. [Google Scholar] [CrossRef]
- Afaq, S.A.; Husain, M.S.; Bello, A.; Sadia, H. A critical analysis of cyber threats and their global impact. In Computational Intelligent Security in Wireless Communications; CRC Press: Boca Raton, FL, USA, 2023; pp. 201–220. [Google Scholar]
- Rajasekharaiah, K.; Dule, C.S.; Sudarshan, E. Cyber security challenges and its emerging trends on latest technologies. In Proceedings of the IOP Conference Series: Materials Science and Engineering, Warangal, India, 9–10 October 2020; Volume 981, p. 022062. [Google Scholar]
- Galinec, D.; Možnik, D.; Guberina, B. Cybersecurity and cyber defence: National level strategic approach. J. Control Meas. Electron. Comput. Commun. 2017, 58, 273–286. [Google Scholar] [CrossRef]
- Jimmy, F. Emerging threats: The latest cybersecurity risks and the role of artificial intelligence in enhancing cybersecurity defenses. Val. Int. J. Digit. Libr. 2021, 1, 564–574. [Google Scholar] [CrossRef]
- Samaras, C.; Nuttall, W.J.; Bazilian, M. Energy and the military: Convergence of security, economic, and environmental decision-making. Energy Strategy Rev. 2019, 26, 100409. [Google Scholar] [CrossRef]
- Te Kulve, H.; Smit, W.A. Civilian–military co-operation strategies in developing new technologies. Res. Policy 2003, 32, 955–970. [Google Scholar] [CrossRef]
- Asharf, J.; Moustafa, N.; Khurshid, H.; Debie, E.; Haider, W.; Wahab, A. A review of intrusion detection systems using machine and deep learning in internet of things: Challenges, solutions and future directions. Electronics 2020, 9, 1177. [Google Scholar] [CrossRef]
- Kocher, G.; Kumar, G. Machine learning and deep learning methods for intrusion detection systems: Recent developments and challenges. Soft Comput. 2021, 25, 9731–9763. [Google Scholar] [CrossRef]
- Dini, P.; Elhanashi, A.; Begni, A.; Saponara, S.; Zheng, Q.; Gasmi, K. Overview on intrusion detection systems design exploiting machine learning for networking cybersecurity. Appl. Sci. 2023, 13, 7507. [Google Scholar] [CrossRef]
- Khan, S.S.; Madden, M.G. One-class classification: Taxonomy of study and review of techniques. Knowl. Eng. Rev. 2014, 29, 345–374. [Google Scholar] [CrossRef]
- Mahmud, J.S.; Lendak, I. Enhancing One-Class Anomaly Detection in Unlabeled Datasets Through Unsupervised Data Refinement. In Proceedings of the 2024 IEEE 22nd Jubilee International Symposium on Intelligent Systems and Informatics (SISY), Pula, Croatia, 19–21 September 2024; pp. 000497–000502. [Google Scholar]
- Al-Haija, Q.A.; Altamimi, S.; AlWadi, M. Analysis of extreme learning machines (ELMs) for intelligent intrusion detection systems: A survey. Expert Syst. Appl. 2024, 253, 124317. [Google Scholar] [CrossRef]
- Camacho, N.G. The role of AI in cybersecurity: Addressing threats in the digital age. J. Artif. Intell. Gen. Sci. (JAIGS) 2024, 3, 143–154. [Google Scholar] [CrossRef]
- Khan, O.U.; Abdullah, S.M.; Olajide, A.O.; Sani, A.I.; Faisal, S.M.W.; Ogunola, A.A.; Lee, M.D. The Future of Cybersecurity: Leveraging Artificial Intelligence to Combat Evolving Threats and Enhance Digital Defense Strategies. J. Comput. Anal. Appl. 2024, 33, 776–787. [Google Scholar]
- Rane, N.; Choudhary, S.; Rane, J. Machine learning and deep learning: A comprehensive review on methods, techniques, applications, challenges, and future directions. In Techniques, Applications, Challenges, and Future Directions; SSRN (Elsevier): Amsterdam, The Netherlands, 2024. [Google Scholar]
- Diana, L.; Dini, P.; Paolini, D. Overview on Intrusion Detection Systems for Computers Networking Security. Computers 2025, 14, 87. [Google Scholar] [CrossRef]
- Mathews, S.M. Explainable artificial intelligence applications in NLP, biomedical, and malware classification: A literature review. In Intelligent Computing, Proceedings of the 2019 Computing Conference, Volume 2, London, UK, 16–17 July 2019; Springer: Cham, Switzerland, 2019; pp. 1269–1292. [Google Scholar]
- Ozkan-Okay, M.; Akin, E.; Aslan, Ö.; Kosunalp, S.; Iliev, T.; Stoyanov, I.; Beloev, I. A comprehensive survey: Evaluating the efficiency of artificial intelligence and machine learning techniques on cyber security solutions. IEEE Access 2024, 12, 12229–12256. [Google Scholar] [CrossRef]
- Martins, I.; Resende, J.S.; Sousa, P.R.; Silva, S.; Antunes, L.; Gama, J. Host-based IDS: A review and open issues of an anomaly detection system in IoT. Future Gener. Comput. Syst. 2022, 133, 95–113. [Google Scholar] [CrossRef]
- Chukwunweike, J.N.; Yussuf, M.; Okusi, O.; Oluwatobi, T. The role of deep learning in ensuring privacy integrity and security: Applications in AI-driven cybersecurity solutions. World J. Adv. Res. Rev. 2024, 23, 1778–1790. [Google Scholar] [CrossRef]
- Osazuwa, O.M.C.; Mitchell, O.; Osazuwa, C. Confidentiality; Integrity, and Availability in Network Systems: A Review of Related Literature. Int. J. Innov. Sci. Res. Technol. 2023, 8, 1946–1953. [Google Scholar]
- Mishra, N.; Pandya, S. Internet of things applications, security challenges, attacks, intrusion detection, and future visions: A systematic review. IEEE Access 2021, 9, 59353–59377. [Google Scholar] [CrossRef]
- Khraisat, A.; Alazab, A. A critical review of intrusion detection systems in the internet of things: Techniques, deployment strategy, validation strategy, attacks, public datasets and challenges. Cybersecurity 2021, 4, 18. [Google Scholar] [CrossRef]
- Dong, H.; Kotenko, I. Cybersecurity in the AI era: Analyzing the impact of machine learning on intrusion detection. In Knowledge and Information Systems; Springer: Berlin/Heidelberg, Germany, 2025; pp. 1–52. [Google Scholar]
- Alkadi, S.; Al-Ahmadi, S.; Ben Ismail, M.M. Toward improved machine learning-based intrusion detection for internet of things traffic. Computers 2023, 12, 148. [Google Scholar] [CrossRef]
- Sun, N.; Ding, M.; Jiang, J.; Xu, W.; Mo, X.; Tai, Y.; Zhang, J. Cyber threat intelligence mining for proactive cybersecurity defense: A survey and new perspectives. IEEE Commun. Surv. Tutor. 2023, 25, 1748–1774. [Google Scholar] [CrossRef]
- Alsulami, B.; Almalawi, A.; Fahad, A. A Review on Machine Learning Based Approaches of Network Intrusion Detection Systems. Int. J. Curr. Sci. Res. Rev. 2022, 5, 2159–2177. [Google Scholar] [CrossRef]
- Priyanka, C.; Vivek, Y.; Ravi, V. Benchmarking One Class Classification in Banking, Insurance, and Cyber Security. In Proceedings of the International Conference on Frontiers of Intelligent Computing: Theory and Applications, London, UK, 6–7 June 2024; pp. 1–14. [Google Scholar]
- Lwakatare, L.E.; Raj, A.; Crnkovic, I.; Bosch, J.; Olsson, H.H. Large-scale machine learning systems in real-world industrial settings: A review of challenges and solutions. Inf. Softw. Technol. 2020, 127, 106368. [Google Scholar] [CrossRef]
- Aouedi, O.; Sacco, A.; Piamrat, K.; Marchetto, G. Handling privacy-sensitive medical data with federated learning: Challenges and future directions. IEEE J. Biomed. Health Inform. 2022, 27, 790–803. [Google Scholar] [CrossRef] [PubMed]
- Shen, M.; Ye, K.; Liu, X.; Zhu, L.; Kang, J.; Yu, S.; Li, Q.; Xu, K. Machine learning-powered encrypted network traffic analysis: A comprehensive survey. IEEE Commun. Surv. Tutor. 2022, 25, 791–824. [Google Scholar] [CrossRef]
- Khan, N.; Ahmad, K.; Tamimi, A.A.; Alani, M.M.; Bermak, A.; Khalil, I. Explainable AI-based Intrusion Detection System for Industry 5.0: An Overview of the Literature, associated Challenges, the existing Solutions, and Potential Research Directions. arXiv 2024, arXiv:2408.03335. [Google Scholar]
- He, K.; Kim, D.D.; Asghar, M.R. Adversarial machine learning for network intrusion detection systems: A comprehensive survey. IEEE Commun. Surv. Tutor. 2023, 25, 538–566. [Google Scholar] [CrossRef]
- Seliya, N.; Abdollah Zadeh, A.; Khoshgoftaar, T.M. A literature review on one-class classification and its potential applications in big data. J. Big Data 2021, 8, 122. [Google Scholar] [CrossRef]
- Perera, P.; Oza, P.; Patel, V.M. One-class classification: A survey. arXiv 2021, arXiv:2101.03064. [Google Scholar]
- Lee, W.; Stolfo, S.J. A framework for constructing features and models for intrusion detection systems. ACM Trans. Inf. Syst. Secur. (TiSSEC) 2000, 3, 227–261. [Google Scholar] [CrossRef]
- Afifi, H.; Pochaba, S.; Boltres, A.; Laniewski, D.; Haberer, J.; Paeleke, L.; Poorzare, R.; Stolpmann, D.; Wehner, N.; Redder, A.; et al. Machine learning with computer networks: Techniques, datasets, and models. IEEE Access 2024, 12, 54673–54720. [Google Scholar] [CrossRef]
- Wang, Y.; Zhang, B.; Ma, J.; Jin, Q. Artificial intelligence of things (AIoT) data acquisition based on graph neural networks: A systematical review. Concurr. Comput. Pract. Exp. 2023, 35, e7827. [Google Scholar] [CrossRef]
- Shaukat, K.; Luo, S.; Varadharajan, V.; Hameed, I.A.; Chen, S.; Liu, D.; Li, J. Performance comparison and current challenges of using machine learning techniques in cybersecurity. Energies 2020, 13, 2509. [Google Scholar] [CrossRef]
- Hettich, S.; Bay, S. The UCI KDD Archive; University of California, Department of Information and Computer Science: Irvine, CA, USA, 1999; Volume 152, Available online: http://kdd.ics.uci.edu/ (accessed on 10 July 2025).
- Tavallaee, M.; Bagheri, E.; Lu, W.; Ghorbani, A.A. A detailed analysis of the KDD CUP 99 data set. In Proceedings of the 2009 IEEE Symposium on Computational Intelligence for Security and Defense Applications, Ottawa, ON, Canada, 8–10 July 2009; pp. 1–6. [Google Scholar]
- Siddique, K.; Akhtar, Z.; Khan, F.A.; Kim, Y. KDD cup 99 data sets: A perspective on the role of data sets in network intrusion detection research. Computer 2019, 52, 41–51. [Google Scholar] [CrossRef]
- Khraisat, A.; Gondal, I.; Vamplew, P.; Kamruzzaman, J. Survey of intrusion detection systems: Techniques, datasets and challenges. Cybersecurity 2019, 2, 20. [Google Scholar] [CrossRef]
- Cholakoska, A.; Shushlevska, M.; Todorov, Z.; Efnusheva, D. Analysis of machine learning classification techniques for anomaly detection with nsl-kdd data set. In Data Science and Intelligent Systems, Proceedings of 5th Computational Methods in Systems and Software 2021; Springer: Cham, Switzerland, 2021; Volume 2, pp. 258–267. [Google Scholar]
- Protić, D.D. Review of KDD Cup ‘99, NSL-KDD and Kyoto 2006+ datasets. Vojnoteh. Glas. Tech. Cour. 2018, 66, 580–596. [Google Scholar] [CrossRef]
- Albayati, M.; Issac, B. Analysis of intelligent classifiers and enhancing the detection accuracy for intrusion detection system. Int. J. Comput. Intell. Syst. 2015, 8, 841–853. [Google Scholar] [CrossRef][Green Version]
- Jaw, E.; Wang, X. Feature selection and ensemble-based intrusion detection system: An efficient and comprehensive approach. Symmetry 2021, 13, 1764. [Google Scholar] [CrossRef]
- Rani, M.; Gagandeep. Effective network intrusion detection by addressing class imbalance with deep neural networks multimedia tools and applications. Multimed. Tools Appl. 2022, 81, 8499–8518. [Google Scholar] [CrossRef]
- Yang, C. Anomaly network traffic detection algorithm based on information entropy measurement under the cloud computing environment. Clust. Comput. 2019, 22, 8309–8317. [Google Scholar] [CrossRef]
- Zhang, C.; Jia, D.; Wang, L.; Wang, W.; Liu, F.; Yang, A. Comparative research on network intrusion detection methods based on machine learning. Comput. Secur. 2022, 121, 102861. [Google Scholar] [CrossRef]
- Sharafaldin, I.; Lashkari, A.H.; Ghorbani, A.A. Toward generating a new intrusion detection dataset and intrusion traffic characterization. ICISSp 2018, 1, 108–116. [Google Scholar]
- Thakkar, A.; Lohiya, R. A review of the advancement in intrusion detection datasets. Procedia Comput. Sci. 2020, 167, 636–645. [Google Scholar] [CrossRef]
- Kilincer, I.F.; Ertam, F.; Sengur, A. Machine learning methods for cyber security intrusion detection: Datasets and comparative study. Comput. Netw. 2021, 188, 107840. [Google Scholar] [CrossRef]
- Oyelakin, A.; Ameen, A.; Ogundele, T.; Salau-Ibrahim, T.; Abdulrauf, U.; Olufadi, H.; Ajiboye, I.; Muhammad-Thani, S.; Adeniji, I.A. Overview and exploratory analyses of CICIDS 2017 intrusion detection dataset. J. Syst. Eng. Inf. Technol. (JOSEIT) 2023, 2, 45–52. [Google Scholar] [CrossRef]
- Talukder, M.A.; Islam, M.M.; Uddin, M.A.; Hasan, K.F.; Sharmin, S.; Alyami, S.A.; Moni, M.A. Machine learning-based network intrusion detection for big and imbalanced data using oversampling, stacking feature embedding and feature extraction. J. Big Data 2024, 11, 33. [Google Scholar] [CrossRef]
- Al Farsi, A.; Khan, A.; Bait-Suwailam, M.M.; Mughal, M.R. Comparative Performance Evaluation of Machine Learning Algorithms for Cyber Intrusion Detection. J. Cybersecur. Priv. 2024. [Google Scholar] [CrossRef]
- Mallidi, S.K.R.; Ramisetty, R.R. Advancements in training and deployment strategies for AI-based intrusion detection systems in IoT: A systematic literature review. Discov. Internet Things 2025, 5, 8. [Google Scholar] [CrossRef]
- Moustafa, N.; Slay, J. The evaluation of Network Anomaly Detection Systems: Statistical analysis of the UNSW-NB15 data set and the comparison with the KDD99 data set. Inf. Secur. J. Glob. Perspect. 2016, 25, 18–31. [Google Scholar] [CrossRef]
- Moustafa, N.; Slay, J. UNSW-NB15: A comprehensive data set for network intrusion detection systems (UNSW-NB15 network data set). In Proceedings of the 2015 Military Communications and Information Systems Conference (MilCIS), Canberra, ACT, Australia, 10–12 November 2015; pp. 1–6. [Google Scholar]
- Singh, G.; Khare, N. A survey of intrusion detection from the perspective of intrusion datasets and machine learning techniques. Int. J. Comput. Appl. 2022, 44, 659–669. [Google Scholar] [CrossRef]
- Moustafa, N.; Slay, J.; Creech, G. Novel geometric area analysis technique for anomaly detection using trapezoidal area estimation on large-scale networks. IEEE Trans. Big Data 2017, 5, 481–494. [Google Scholar] [CrossRef]
- Moustafa, N.; Creech, G.; Slay, J. Big data analytics for intrusion detection system: Statistical decision-making using finite dirichlet mixture models. In Data Analytics and Decision Support for Cybersecurity: Trends, Methodologies and Applications; Springer: Berlin/Heidelberg, Germany, 2017; pp. 127–156. [Google Scholar]
- Meftah, S.; Rachidi, T.; Assem, N. Network based intrusion detection using the UNSW-NB15 dataset. Int. J. Comput. Digit. Syst. 2019, 8, 478–487. [Google Scholar] [CrossRef] [PubMed]
- Oroian, D.; Bolboaca, R.; Roman, A.S.; Dobrota, V. Network Intrusion Detection System Using Anomaly Detection Techniques. In Proceedings of the 2024 IEEE 20th International Conference on Intelligent Computer Communication and Processing (ICCP), Cluj-Napoca, Romania, 17–19 October 2024; pp. 1–8. [Google Scholar]
- Kamal, H.; Mashaly, M. Advanced Hybrid Transformer-CNN Deep Learning Model for Effective Intrusion Detection Systems with Class Imbalance Mitigation Using Resampling Techniques. Future Internet 2024, 16, 481. [Google Scholar] [CrossRef]
- Chou, D.; Jiang, M. Data-driven network intrusion detection: A taxonomy of challenges and methods. arXiv 2020, arXiv:2009.07352. [Google Scholar]
- Moualla, S.; Khorzom, K.; Jafar, A. Improving the Performance of Machine Learning-Based Network Intrusion Detection Systems on the UNSW-NB15 Dataset. Comput. Intell. Neurosci. 2021, 2021, 5557577. [Google Scholar] [CrossRef] [PubMed]
- Aleesa, A.; Younis, M.; Mohammed, A.A.; Sahar, N. Deep-intrusion detection system with enhanced UNSW-NB15 dataset based on deep learning techniques. J. Eng. Sci. Technol. 2021, 16, 711–727. [Google Scholar]
- Janarthanan, T.; Zargari, S. Feature selection in UNSW-NB15 and KDDCUP’99 datasets. In Proceedings of the 2017 IEEE 26th International Symposium on Industrial Electronics (ISIE), Edinburgh, UK, 19–21 June 2017; pp. 1881–1886. [Google Scholar]
- Sarhan, M.; Layeghy, S.; Moustafa, N.; Portmann, M. Netflow datasets for machine learning-based network intrusion detection systems. In Proceedings of the Big Data Technologies and Applications: 10th EAI International Conference, BDTA 2020, and 13th EAI International Conference on Wireless Internet, WiCON 2020, Virtual Event, 11 December 2020; pp. 117–135. [Google Scholar]
- Koroniotis, N.; Moustafa, N.; Sitnikova, E.; Turnbull, B. Towards the development of realistic botnet dataset in the internet of things for network forensic analytics: Bot-iot dataset. Future Gener. Comput. Syst. 2019, 100, 779–796. [Google Scholar] [CrossRef]
- Koroniotis, N.; Moustafa, N.; Sitnikova, E.; Slay, J. Towards developing network forensic mechanism for botnet activities in the IoT based on machine learning techniques. In Proceedings of the Mobile Networks and Management: 9th International Conference, MONAMI 2017, Melbourne, Australia, 13–15 December 2017; pp. 30–44. [Google Scholar]
- Peterson, J.M.; Leevy, J.L.; Khoshgoftaar, T.M. A review and analysis of the bot-iot dataset. In Proceedings of the 2021 IEEE International Conference on Service-Oriented System Engineering (SOSE), Oxford, UK, 23–26 August 2021; pp. 20–27. [Google Scholar]
- Mashaleh, A.S.; Ibrahim, N.F.; Alauthman, M.; AlKaraki, J.; Almomani, A.; Atalla, S.; Gawanmeh, A. Evaluation of machine learning and deep learning methods for early detection of internet of things botnets. Int. J. Electr. Comput. Eng. (IJECE) 2024, 14, 4732–4744. [Google Scholar] [CrossRef]
- Koroniotis, N.; Moustafa, N.; Sitnikova, E. A new network forensic framework based on deep learning for Internet of Things networks: A particle deep framework. Future Gener. Comput. Syst. 2020, 110, 91–106. [Google Scholar] [CrossRef]
- Leevy, J.L.; Hancock, J.; Khoshgoftaar, T.M.; Peterson, J. Detecting information theft attacks in the bot-iot dataset. In Proceedings of the 2021 20th IEEE International Conference on Machine Learning and Applications (ICMLA), Pasadena, CA, USA, 13–16 December 2021; pp. 807–812. [Google Scholar]
- Al-Haija, Q.A.; Droos, A. A comprehensive survey on deep learning-based intrusion detection systems in Internet of Things (IoT). Expert Syst. 2025, 42, e13726. [Google Scholar] [CrossRef]
- Kerrakchou, I.; Abou El Hassan, A.; Chadli, S.; Emharraf, M.; Saber, M. Selection of efficient machine learning algorithm on Bot-IoT dataset for intrusion detection in internet of things networks. Indones. J. Electr. Eng. Comput. Sci. 2023, 31, 1784–1793. [Google Scholar] [CrossRef]
- Pinto, D.A.P. HERA: Enhancing Network Security with a New Dataset Creation Tool. Master’s Thesis, University of Porto, Porto, Portugal, 2024. [Google Scholar]
- Koroniotis, N.; Moustafa, N. Enhancing network forensics with particle swarm and deep learning: The particle deep framework. arXiv 2020, arXiv:2005.00722. [Google Scholar]
- Peterson, J.M.; Khoshgoftaar, T.M.; Leevy, J.L. Composition analysis of the Bot-IoT dataset. Int. J. Internet Things Cyber-Assur. 2022, 2, 31–44. [Google Scholar] [CrossRef]
- Koroniotis, N.; Moustafa, N.; Schiliro, F.; Gauravaram, P.; Janicke, H. A holistic review of cybersecurity and reliability perspectives in smart airports. IEEE Access 2020, 8, 209802–209834. [Google Scholar] [CrossRef]
- Leevy, J.L.; Khoshgoftaar, T.M.; Hancock, J. Iot attack prediction using big bot-iot data. Int. J. Internet Things Cyber-Assur. 2022, 2, 45–61. [Google Scholar] [CrossRef]
- Koroniotis, N. Designing an Effective Network Forensic Framework for the Investigation of Botnets in the Internet of Things. Ph.D. Thesis, UNSW Sydney, Sydney, Australia, 2020. [Google Scholar]
- Moustafa, N. A new distributed architecture for evaluating AI-based security systems at the edge: Network TON_IoT datasets. Sustain. Cities Soc. 2021, 72, 102994. [Google Scholar] [CrossRef]
- Booij, T.M.; Chiscop, I.; Meeuwissen, E.; Moustafa, N.; Den Hartog, F.T. ToN_IoT: The role of heterogeneity and the need for standardization of features and attack types in IoT network intrusion data sets. IEEE Internet Things J. 2021, 9, 485–496. [Google Scholar] [CrossRef]
- Moustafa, N.; Keshky, M.; Debiez, E.; Janicke, H. Federated TON_IoT Windows datasets for evaluating AI-based security applications. In Proceedings of the 2020 IEEE 19th International Conference on Trust, Security and Privacy in Computing and Communications (TrustCom), Guangzhou, China, 31 December 2020–1 January 2021; pp. 848–855. [Google Scholar]
- Alsaedi, A.; Moustafa, N.; Tari, Z.; Mahmood, A.; Anwar, A. TON_IoT telemetry dataset: A new generation dataset of IoT and IIoT for data-driven intrusion detection systems. IEEE Access 2020, 8, 165130–165150. [Google Scholar] [CrossRef]
- Ashraf, J.; Keshk, M.; Moustafa, N.; Abdel-Basset, M.; Khurshid, H.; Bakhshi, A.D.; Mostafa, R.R. IoTBoT-IDS: A novel statistical learning-enabled botnet detection framework for protecting networks of smart cities. Sustain. Cities Soc. 2021, 72, 103041. [Google Scholar] [CrossRef]
- Moustafa, N. A systemic IoT–fog–cloud architecture for big-data analytics and cyber security systems: A review of fog computing. Secure Edge Comput. 2021, 41–50. [Google Scholar]
- Zachos, G.; Essop, I.; Mantas, G.; Porfyrakis, K.; Ribeiro, J.C.; Rodriguez, J. Generating IoT edge network datasets based on the TON_IoT telemetry dataset. In Proceedings of the 2021 IEEE 26th International Workshop on Computer Aided Modeling and Design of Communication Links and Networks (CAMAD), Porto, Portugal, 25–27 October 2021; pp. 1–6. [Google Scholar]
- Moustafa, N.; Ahmed, M.; Ahmed, S. Data analytics-enabled intrusion detection: Evaluations of ToN_IoT linux datasets. In Proceedings of the 2020 IEEE 19th International Conference on Trust, Security and Privacy in Computing and Communications (TrustCom), Guangzhou, China, 29 December 2020–1 January 2021; pp. 727–735. [Google Scholar]
- Maasaoui, Z.; Merzouki, M.; Battou, A.; Lbath, A. A Scalable Framework for Real-Time Network Security Traffic Analysis and Attack Detection Using Machine and Deep Learning. Platforms 2025, 3, 7. [Google Scholar] [CrossRef]
- Moustafa, N. New generations of internet of things datasets for cybersecurity applications based machine learning: TON_IoT datasets. In Proceedings of the Research Australasia Conference, Brisbane, Australia, 21–25 October 2019; pp. 21–25. [Google Scholar]
- Sarhan, M.; Layeghy, S.; Portmann, M. Towards a standard feature set for network intrusion detection system datasets. Mob. Netw. Appl. 2022, 27, 357–370. [Google Scholar] [CrossRef]
- Mutleg, M.L.; Mahmood, A.M.; Al-Nayar, M.M.J. A Comprehensive Review of Cyber-Attacks Targeting IoT Systems and Their Security Measures. Int. J. Saf. Secur. Eng. 2024, 14, 1073–1086. [Google Scholar] [CrossRef]
- Guo, G.; Pan, X.; Liu, H.; Li, F.; Pei, L.; Hu, K. An IoT intrusion detection system based on TON IoT network dataset. In Proceedings of the 2023 IEEE 13th Annual Computing and Communication Workshop and Conference (CCWC), Las Vegas, NV, USA, 8–11 March 2023; pp. 0333–0338. [Google Scholar]
- Gad, A.R.; Nashat, A.A.; Barkat, T.M. Intrusion detection system using machine learning for vehicular ad hoc networks based on ToN-IoT dataset. IEEE Access 2021, 9, 142206–142217. [Google Scholar] [CrossRef]
- Inuwa, M.M.; Das, R. A comparative analysis of various machine learning methods for anomaly detection in cyber attacks on IoT networks. Internet Things 2024, 26, 101162. [Google Scholar] [CrossRef]
- Deng, H.; Li, X. Anomaly detection via reverse distillation from one-class embedding. In Proceedings of the IEEE/CVF Conference on Computer Vision and Pattern Recognition, New Orleans, LA, USA, 18–24 June 2022; pp. 9737–9746. [Google Scholar]
- Pollastro, A.; Testa, G.; Bilotta, A.; Prevete, R. Semi-supervised detection of structural damage using variational autoencoder and a one-class support vector machine. IEEE Access 2023, 11, 67098–67112. [Google Scholar] [CrossRef]
- An, J.; Cho, S. Variational autoencoder based anomaly detection using reconstruction probability. Spec. Lect. IE 2015, 2, 1–18. [Google Scholar]
- Li, K.L.; Huang, H.K.; Tian, S.F.; Xu, W. Improving one-class SVM for anomaly detection. In Proceedings of the 2003 International Conference on Machine Learning and Cybernetics (IEEE Cat. No. 03EX693), Xi’an, China, 5 November 2003; Volume 5, pp. 3077–3081. [Google Scholar]
- Liu, F.T.; Ting, K.M.; Zhou, Z.H. Isolation-based anomaly detection. ACM Trans. Knowl. Discov. Data (TKDD) 2012, 6, 1–39. [Google Scholar] [CrossRef]
- Li, P.; Pei, Y.; Li, J. A comprehensive survey on design and application of autoencoder in deep learning. Appl. Soft Comput. 2023, 138, 110176. [Google Scholar] [CrossRef]
- Song, Y.; Hyun, S.; Cheong, Y.G. Analysis of autoencoders for network intrusion detection. Sensors 2021, 21, 4294. [Google Scholar] [CrossRef] [PubMed]
- Wang, W.; Huang, Y.; Wang, Y.; Wang, L. Generalized autoencoder: A neural network framework for dimensionality reduction. In Proceedings of the IEEE Conference on Computer Vision and Pattern Recognition Workshops, Columbus, OH, USA, 23–28 June 2014; pp. 490–497. [Google Scholar]
- Berahmand, K.; Daneshfar, F.; Salehi, E.S.; Li, Y.; Xu, Y. Autoencoders and their applications in machine learning: A survey. Artif. Intell. Rev. 2024, 57, 28. [Google Scholar] [CrossRef]
- Alsaade, F.W.; Al-Adhaileh, M.H. Cyber attack detection for self-driving vehicle networks using deep autoencoder algorithms. Sensors 2023, 23, 4086. [Google Scholar] [CrossRef] [PubMed]
- Torabi, H.; Mirtaheri, S.L.; Greco, S. Practical autoencoder based anomaly detection by using vector reconstruction error. Cybersecurity 2023, 6, 1. [Google Scholar] [CrossRef]
- Bhuyan, M.H.; Bhattacharyya, D.K.; Kalita, J.K. Network anomaly detection: Methods, systems and tools. IEEE Commun. Surv. Tutor. 2013, 16, 303–336. [Google Scholar] [CrossRef]
- Zavrak, S.; Iskefiyeli, M. Anomaly-based intrusion detection from network flow features using variational autoencoder. IEEE Access 2020, 8, 108346–108358. [Google Scholar] [CrossRef]
- Neloy, A.A.; Turgeon, M. A comprehensive study of auto-encoders for anomaly detection: Efficiency and trade-offs. Mach. Learn. Appl. 2024, 17, 100572. [Google Scholar] [CrossRef]
- Asperti, A.; Trentin, M. Balancing reconstruction error and kullback-leibler divergence in variational autoencoders. IEEE Access 2020, 8, 199440–199448. [Google Scholar] [CrossRef]
- Mendonça, F.; Mostafa, S.S.; Morgado-Dias, F.; Ravelo-García, A.G. On the Use of Kullback–Leibler Divergence for Kernel Selection and Interpretation in Variational Autoencoders for Feature Creation. Information 2023, 14, 571. [Google Scholar] [CrossRef]
- Böhm, V.; Seljak, U. Probabilistic autoencoder. arXiv 2020, arXiv:2006.05479. [Google Scholar]
- Sinha, S.; Dieng, A.B. Consistency regularization for variational auto-encoders. Adv. Neural Inf. Process. Syst. 2021, 34, 12943–12954. [Google Scholar]
- Nicolau, M.; McDermott, J. Learning neural representations for network anomaly detection. IEEE Trans. Cybern. 2018, 49, 3074–3087. [Google Scholar] [CrossRef] [PubMed]
- Huang, H.; Wang, P.; Pei, J.; Wang, J.; Alexanian, S.; Niyato, D. Deep Learning Advancements in Anomaly Detection: A Comprehensive Survey. arXiv 2025, arXiv:2503.13195. [Google Scholar] [CrossRef]
- Yang, H.; Kong, Q.; Mao, W. A deep latent space model for interpretable representation learning on directed graphs. Neurocomputing 2024, 576, 127342. [Google Scholar] [CrossRef]
- Chaabouni, N.; Mosbah, M.; Zemmari, A.; Sauvignac, C.; Faruki, P. Network intrusion detection for IoT security based on learning techniques. IEEE Commun. Surv. Tutor. 2019, 21, 2671–2701. [Google Scholar] [CrossRef]
- Li, C.; Guo, L.; Gao, H.; Li, Y. Similarity-measured isolation forest: Anomaly detection method for machine monitoring data. IEEE Trans. Instrum. Meas. 2021, 70, 1–12. [Google Scholar] [CrossRef]
- Jain, P.; Jain, S.; Zaïane, O.R.; Srivastava, A. Anomaly detection in resource constrained environments with streaming data. IEEE Trans. Emerg. Top. Comput. Intell. 2021, 6, 649–659. [Google Scholar] [CrossRef]
- Barbariol, T.; Chiara, F.D.; Marcato, D.; Susto, G.A. A review of tree-based approaches for anomaly detection. In Control Charts and Machine Learning for Anomaly Detection in Manufacturing; Springer: Berlin/Heidelberg, Germany, 2022; pp. 149–185. [Google Scholar]
- Xu, H.; Pang, G.; Wang, Y.; Wang, Y. Deep isolation forest for anomaly detection. IEEE Trans. Knowl. Data Eng. 2023, 35, 12591–12604. [Google Scholar] [CrossRef]
- Lifandali, O.; Abghour, N.; Chiba, Z. Feature selection using a combination of ant colony optimization and random forest algorithms applied to isolation forest based intrusion detection system. Procedia Comput. Sci. 2023, 220, 796–805. [Google Scholar] [CrossRef]
- Hasan, M.A.M.; Nasser, M.; Ahmad, S.; Molla, K.I. Feature selection for intrusion detection using random forest. J. Inf. Secur. 2016, 7, 129–140. [Google Scholar] [CrossRef]
- Loh, W.Y.; Shih, Y.S. Split selection methods for classification trees. Stat. Sin. 1997, 7, 815–840. [Google Scholar]
- Bandaragoda, T.R.; Ting, K.M.; Albrecht, D.; Liu, F.T.; Zhu, Y.; Wells, J.R. Isolation-based anomaly detection using nearest-neighbor ensembles. Comput. Intell. 2018, 34, 968–998. [Google Scholar] [CrossRef]
- Lesouple, J.; Baudoin, C.; Spigai, M.; Tourneret, J.Y. Generalized isolation forest for anomaly detection. Pattern Recognit. Lett. 2021, 149, 109–119. [Google Scholar] [CrossRef]
- He, M.; Chen, X. Anomaly detection algorithm for big data based on isolation forest algorithm. J. Comput. Methods Sci. Eng. 2025, 14727978251337984. [Google Scholar] [CrossRef]
- Gao, J.; Ozbay, K.; Hu, Y. Real-time anomaly detection of short-term traffic disruptions in urban areas through adaptive isolation forest. J. Intell. Transp. Syst. 2025, 29, 269–286. [Google Scholar] [CrossRef]
- Shang, W.; Zeng, P.; Wan, M.; Li, L.; An, P. Intrusion detection algorithm based on OCSVM in industrial control system. Secur. Commun. Netw. 2016, 9, 1040–1049. [Google Scholar] [CrossRef]
- Maglaras, L.A.; Jiang, J.; Cruz, T. Integrated OCSVM mechanism for intrusion detection in SCADA systems. Electron. Lett. 2014, 50, 1935–1936. [Google Scholar] [CrossRef]
- Maglaras, L.A.; Jiang, J. Ocsvm model combined with k-means recursive clustering for intrusion detection in scada systems. In Proceedings of the 10th International Conference on Heterogeneous Networking for Quality, Reliability, Security and Robustness, Rhodes, Greece, 18–20 August 2014; pp. 133–134. [Google Scholar]
- Shahid, N.; Naqvi, I.H.; Qaisar, S.B. One-class support vector machines: Analysis of outlier detection for wireless sensor networks in harsh environments. Artif. Intell. Rev. 2015, 43, 515–563. [Google Scholar] [CrossRef]
- Stibor, T.; Timmis, J.; Eckert, C. A comparative study of real-valued negative selection to statistical anomaly detection techniques. In Proceedings of the Artificial Immune Systems: 4th International Conference, ICARIS 2005, Banff, AL, Canada, 14–17 August 2005; pp. 262–275. [Google Scholar]
- Awad, M.; Khanna, R. Support vector machines for classification. In Efficient Learning Machines: Theories, Concepts, and Applications for Engineers and System Designers; Springer: Berlin/Heidelberg, Germany, 2015; pp. 39–66. [Google Scholar]
- Erfani, S.M.; Rajasegarar, S.; Karunasekera, S.; Leckie, C. High-dimensional and large-scale anomaly detection using a linear one-class SVM with deep learning. Pattern Recognit. 2016, 58, 121–134. [Google Scholar] [CrossRef]
- Quadir, A.; Sajid, M.; Tanveer, M. One class restricted kernel machines. arXiv 2025, arXiv:2502.10443. [Google Scholar]
- Bermúdez-Chacón, R.; Gonnet, G.H.; Smith, K. Automatic Problem-Specific Hyperparameter Optimization and Model Selection for Supervised Machine Learning; Technical Report; ETH: Zurich, Switzerland, 2015. [Google Scholar]
- Lin, N.; Chen, Y.; Liu, H.; Liu, H. A comparative study of machine learning models with hyperparameter optimization algorithm for mapping mineral prospectivity. Minerals 2021, 11, 159. [Google Scholar] [CrossRef]
- Kaliyaperumal, P.; Periyasamy, S.; Thirumalaisamy, M.; Balusamy, B.; Benedetto, F. A novel hybrid unsupervised learning approach for enhanced cybersecurity in the IoT. Future Internet 2024, 16, 253. [Google Scholar] [CrossRef]
- Abdelli, K.; Cho, J.Y.; Azendorf, F.; Griesser, H.; Tropschug, C.; Pachnicke, S. Machine-learning-based anomaly detection in optical fiber monitoring. J. Opt. Commun. Netw. 2022, 14, 365–375. [Google Scholar] [CrossRef]
- Otokwala, U.; Arifeen, M.; Petrovski, A. A comparative study of novelty detection models for zero day intrusion detection in industrial internet of things. In Proceedings of the UK Workshop on Computational Intelligence, Sheffield, UK, 7–9 September 2022; pp. 238–249. [Google Scholar]
- Chen, X.; Cao, C.; Mai, J. Network anomaly detection based on deep support vector data description. In Proceedings of the 2020 5th IEEE International Conference on Big Data Analytics (ICBDA), Xiamen, China, 8–11 May 2020; pp. 251–255. [Google Scholar]
- Pandey, P. A KNN-Based Intrusion Detection System for Enhanced Anomaly Detection in Industrial IoT Networks. Int. J. Innov. Res. Technol. Sci. 2024, 12, 1–7. [Google Scholar]
- Zheng, M.; Robbins, H.; Chai, Z.; Thapa, P.; Moore, T. Cybersecurity research datasets: Taxonomy and empirical analysis. In Proceedings of the 11th USENIX Workshop on Cyber Security Experimentation and Test (CSET 18), Baltimore, MD, USA, 13 August 2018. [Google Scholar]
- Larriva-Novo, X.A.; Vega-Barbas, M.; Villagrá, V.A.; Rodrigo, M.S. Evaluation of cybersecurity data set characteristics for their applicability to neural networks algorithms detecting cybersecurity anomalies. IEEE Access 2020, 8, 9005–9014. [Google Scholar] [CrossRef]
- Boateng, E.A.; Bruce, J.W.; Talbert, D.A. Anomaly detection for a water treatment system based on one-class neural network. IEEE Access 2022, 10, 115179–115191. [Google Scholar] [CrossRef]
- Haluška, R.; Brabec, J.; Komárek, T. Benchmark of data preprocessing methods for imbalanced classification. In Proceedings of the 2022 IEEE International Conference on Big Data (Big Data), Osaka, Japan, 17–20 December 2022; pp. 2970–2979. [Google Scholar]
- Wang, L. Heterogeneous data and big data analytics. Autom. Control Inf. Sci. 2017, 3, 8–15. [Google Scholar] [CrossRef]
- Parizad, A.; Hatziadoniu, C.J. Cyber-attack detection using principal component analysis and noisy clustering algorithms: A collaborative machine learning-based framework. IEEE Trans. Smart Grid 2022, 13, 4848–4861. [Google Scholar] [CrossRef]
- Krithivasan, K.; Pravinraj, S.; Shankar Sriram, V.S. Detection of cyberattacks in industrial control systems using enhanced principal component analysis and hypergraph-based convolution neural network (EPCA-HG-CNN). IEEE Trans. Ind. Appl. 2020, 56, 4394–4404. [Google Scholar] [CrossRef]
- Dini, P.; Begni, A.; Ciavarella, S.; De Paoli, E.; Fiorelli, G.; Silvestro, C.; Saponara, S. Design and testing novel one-class classifier based on polynomial interpolation with application to networking security. IEEE Access 2022, 10, 67910–67924. [Google Scholar] [CrossRef]
- Hasan, B.M.S.; Abdulazeez, A.M. A review of principal component analysis algorithm for dimensionality reduction. J. Soft Comput. Data Min. 2021, 2, 20–30. [Google Scholar] [CrossRef]
- Nanga, S.; Bawah, A.T.; Acquaye, B.A.; Billa, M.I.; Baeta, F.D.; Odai, N.A.; Obeng, S.K.; Nsiah, A.D. Review of dimension reduction methods. J. Data Anal. Inf. Process. 2021, 9, 189–231. [Google Scholar] [CrossRef]
- Bhardwaj, A.; Ahluwalia, A.S.; Pant, K.K.; Upadhyayula, S. A principal component analysis assisted machine learning modeling and validation of methanol formation over Cu-based catalysts in direct CO2 hydrogenation. Sep. Purif. Technol. 2023, 324, 124576. [Google Scholar] [CrossRef]
- Tharwat, A. Principal component analysis-a tutorial. Int. J. Appl. Pattern Recognit. 2016, 3, 197–240. [Google Scholar] [CrossRef]
- Ivosev, G.; Burton, L.; Bonner, R. Dimensionality reduction and visualization in principal component analysis. Anal. Chem. 2008, 80, 4933–4944. [Google Scholar] [CrossRef] [PubMed]
- Cumming, J.A.; Wooff, D.A. Dimension reduction via principal variables. Comput. Stat. Data Anal. 2007, 52, 550–565. [Google Scholar] [CrossRef]
- Apolloni, B.; Bassis, S.; Brega, A. Feature selection via Boolean independent component analysis. Inf. Sci. 2009, 179, 3815–3831. [Google Scholar] [CrossRef]
- Li, J.; Cheng, K.; Wang, S.; Morstatter, F.; Trevino, R.P.; Tang, J.; Liu, H. Feature selection: A data perspective. ACM Comput. Surv. (CSUR) 2017, 50, 1–45. [Google Scholar] [CrossRef]
- Russo, D.; Zou, J. How much does your data exploration overfit? Controlling bias via information usage. IEEE Trans. Inf. Theory 2019, 66, 302–323. [Google Scholar] [CrossRef]
- Hossin, M.; Sulaiman, M.N. A review on evaluation metrics for data classification evaluations. Int. J. Data Min. Knowl. Manag. Process 2015, 5, 1. [Google Scholar]
- Pommé, L.E.; Bourqui, R.; Giot, R.; Auber, D. Relative Confusion Matrix: An Efficient Visualization for the Comparison of Classification Models. In Artificial Intelligence and Visualization: Advancing Visual Knowledge Discovery; Springer: Berlin/Heidelberg, Germany, 2024; pp. 223–243. [Google Scholar]
- Amin, F.; Mahmoud, M. Confusion matrix in binary classification problems: A step-by-step tutorial. J. Eng. Res. 2022, 6, 1. [Google Scholar]
- Nassif, A.B.; Talib, M.A.; Nasir, Q.; Dakalbab, F.M. Machine learning for anomaly detection: A systematic review. IEEE Access 2021, 9, 78658–78700. [Google Scholar] [CrossRef]
- Ma, X.; Wu, J.; Xue, S.; Yang, J.; Zhou, C.; Sheng, Q.Z.; Xiong, H.; Akoglu, L. A comprehensive survey on graph anomaly detection with deep learning. IEEE Trans. Knowl. Data Eng. 2021, 35, 12012–12038. [Google Scholar] [CrossRef]
- Chandola, V.; Banerjee, A.; Kumar, V. Anomaly detection: A survey. ACM Comput. Surv. (CSUR) 2009, 41, 1–58. [Google Scholar] [CrossRef]
- Chicco, D.; Jurman, G. The advantages of the Matthews correlation coefficient (MCC) over F1 score and accuracy in binary classification evaluation. BMC Genom. 2020, 21, 6. [Google Scholar] [CrossRef] [PubMed]
- Nicora, G.; Rios, M.; Abu-Hanna, A.; Bellazzi, R. Evaluating pointwise reliability of machine learning prediction. J. Biomed. Inform. 2022, 127, 103996. [Google Scholar] [CrossRef] [PubMed]
- Elhanashi, A.; Gasmi, K.; Begni, A.; Dini, P.; Zheng, Q.; Saponara, S. Machine learning techniques for anomaly-based detection system on CSE-CIC-IDS2018 dataset. In Proceedings of the International Conference on Applications in Electronics Pervading Industry, Environment and Society, Genova, Italy, 26–27 September 2022; pp. 131–140. [Google Scholar]
- Racherla, S.; Sripathi, P.; Faruqui, N.; Kabir, M.A.; Whaiduzzaman, M.; Shah, S.A. Deep-IDS: A Real-Time Intrusion Detector for IoT Nodes Using Deep Learning. IEEE Access 2024, 12, 63584–63597. [Google Scholar] [CrossRef]
- Disha, R.A.; Waheed, S. Performance analysis of machine learning models for intrusion detection system using Gini Impurity-based Weighted Random Forest (GIWRF) feature selection technique. Cybersecurity 2022, 5, 1. [Google Scholar] [CrossRef]
- Alghushairy, O.; Alsini, R.; Soule, T.; Ma, X. A review of local outlier factor algorithms for outlier detection in big data streams. Big Data Cogn. Comput. 2020, 5, 1. [Google Scholar] [CrossRef]
- Mahadevappa, P.; Murugesan, R.K.; Al-Amri, R.; Thabit, R.; Al-Ghushami, A.H.; Alkawsi, G. A secure edge computing model using machine learning and IDS to detect and isolate intruders. MethodsX 2024, 12, 102597. [Google Scholar] [CrossRef] [PubMed]
- Abdulganiyu, O.H.; Ait Tchakoucht, T.; Saheed, Y.K. A systematic literature review for network intrusion detection system (IDS). Int. J. Inf. Secur. 2023, 22, 1125–1162. [Google Scholar] [CrossRef]
- Soe, Y.N.; Feng, Y.; Santosa, P.I.; Hartanto, R.; Sakurai, K. Rule generation for signature based detection systems of cyber attacks in iot environments. Bull. Netw. Comput. Syst. Softw. 2019, 8, 93–97. [Google Scholar]
- Do, P.H.; Le, T.D.; Dinh, T.D.; Dai Pham, V. Classifying IoT Botnet Attacks With Kolmogorov-Arnold Networks: A Comparative Analysis of Architectural Variations. IEEE Access 2025, 13, 16072–16093. [Google Scholar] [CrossRef]
- Marques, H.O.; Swersky, L.; Sander, J.; Campello, R.J.; Zimek, A. On the evaluation of outlier detection and one-class classification: A comparative study of algorithms, model selection, and ensembles. Data Min. Knowl. Discov. 2023, 37, 1473–1517. [Google Scholar] [CrossRef] [PubMed]
- Acquaah, Y.T.; Kaushik, R. Normal-only Anomaly detection in environmental sensors in CPS: A comprehensive review. IEEE Access 2024, 12, 191086–191107. [Google Scholar] [CrossRef]
- Sarhan, M.; Layeghy, S.; Moustafa, N.; Portmann, M. Cyber threat intelligence sharing scheme based on federated learning for network intrusion detection. J. Netw. Syst. Manag. 2023, 31, 3. [Google Scholar] [CrossRef]
- Zhu, X.; Vondrick, C.; Fowlkes, C.C.; Ramanan, D. Do we need more training data? Int. J. Comput. Vis. 2016, 119, 76–92. [Google Scholar] [CrossRef]
- Kotsiantis, S.B.; Kanellopoulos, D.; Pintelas, P.E. Data preprocessing for supervised leaning. Int. J. Comput. Sci. 2006, 1, 111–117. [Google Scholar]
- Patcha, A.; Park, J.M. An overview of anomaly detection techniques: Existing solutions and latest technological trends. Comput. Netw. 2007, 51, 3448–3470. [Google Scholar] [CrossRef]
- Gaggero, G.B.; Armellin, A.; Portomauro, G.; Marchese, M. Industrial control system-anomaly detection dataset (ICS-ADD) for cyber-physical security monitoring in smart industry environments. IEEE Access 2024, 12, 64140–64149. [Google Scholar] [CrossRef]
- Faramondi, L.; Flammini, F.; Guarino, S.; Setola, R. A hardware-in-the-loop water distribution testbed dataset for cyber-physical security testing. IEEE Access 2021, 9, 122385–122396. [Google Scholar] [CrossRef]

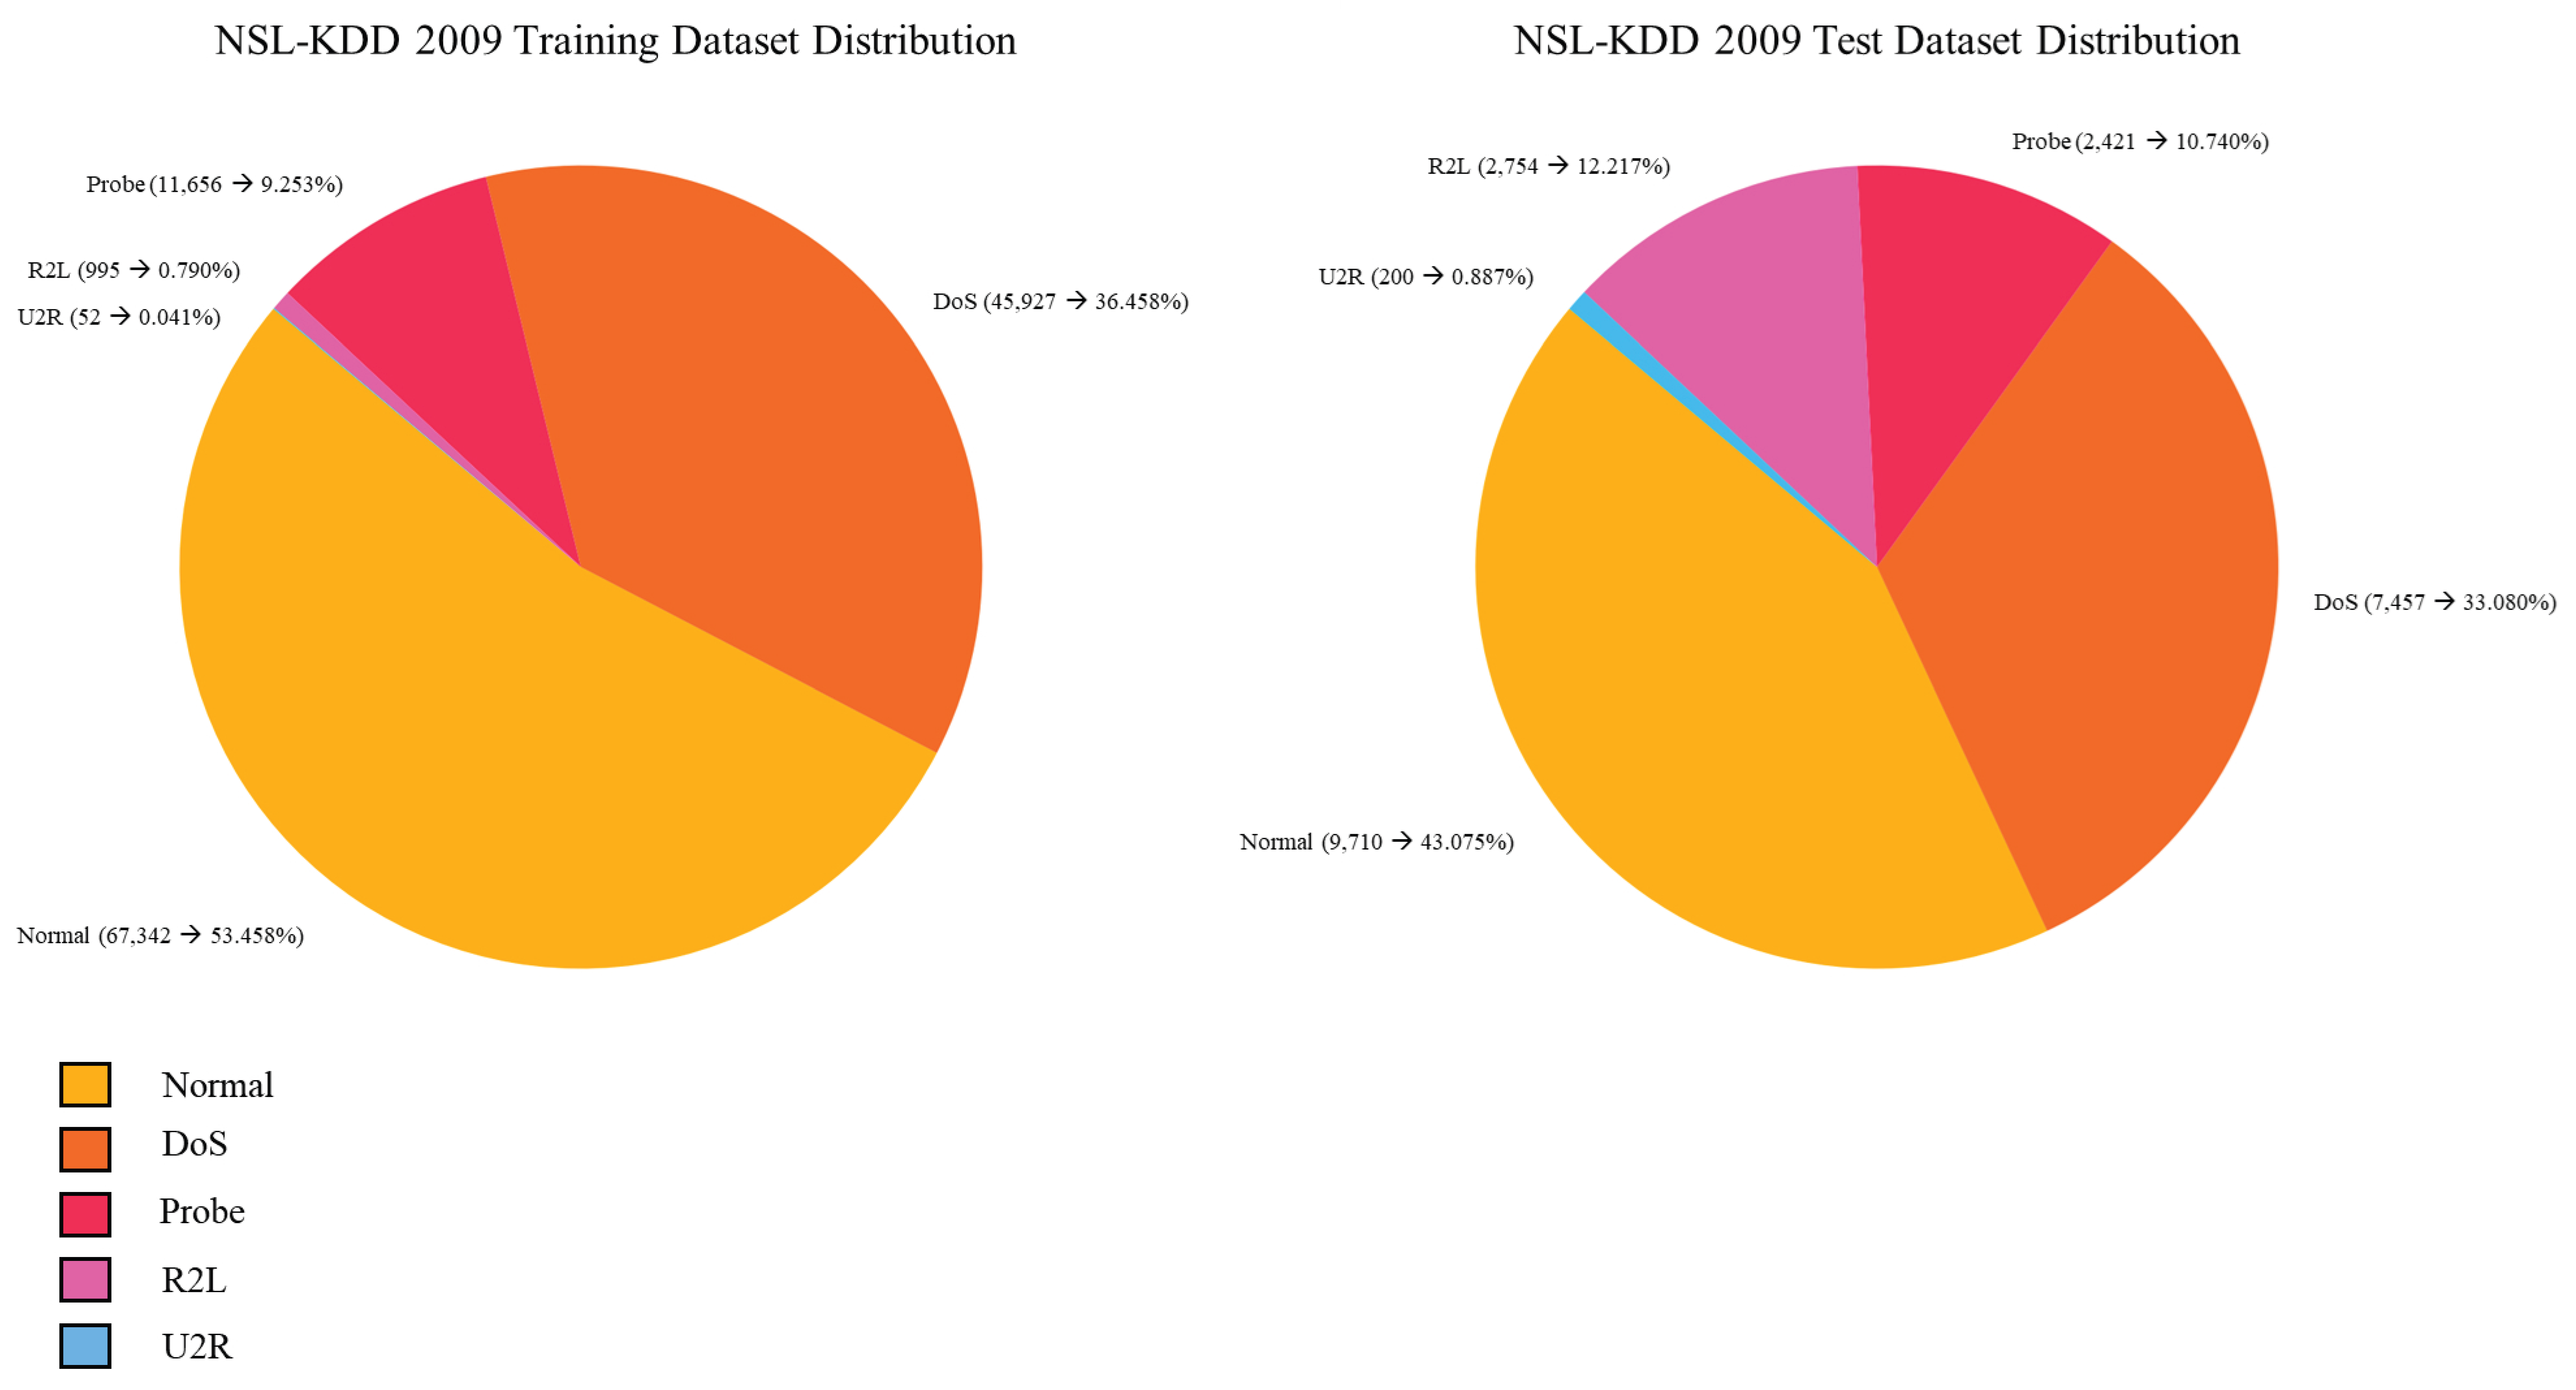

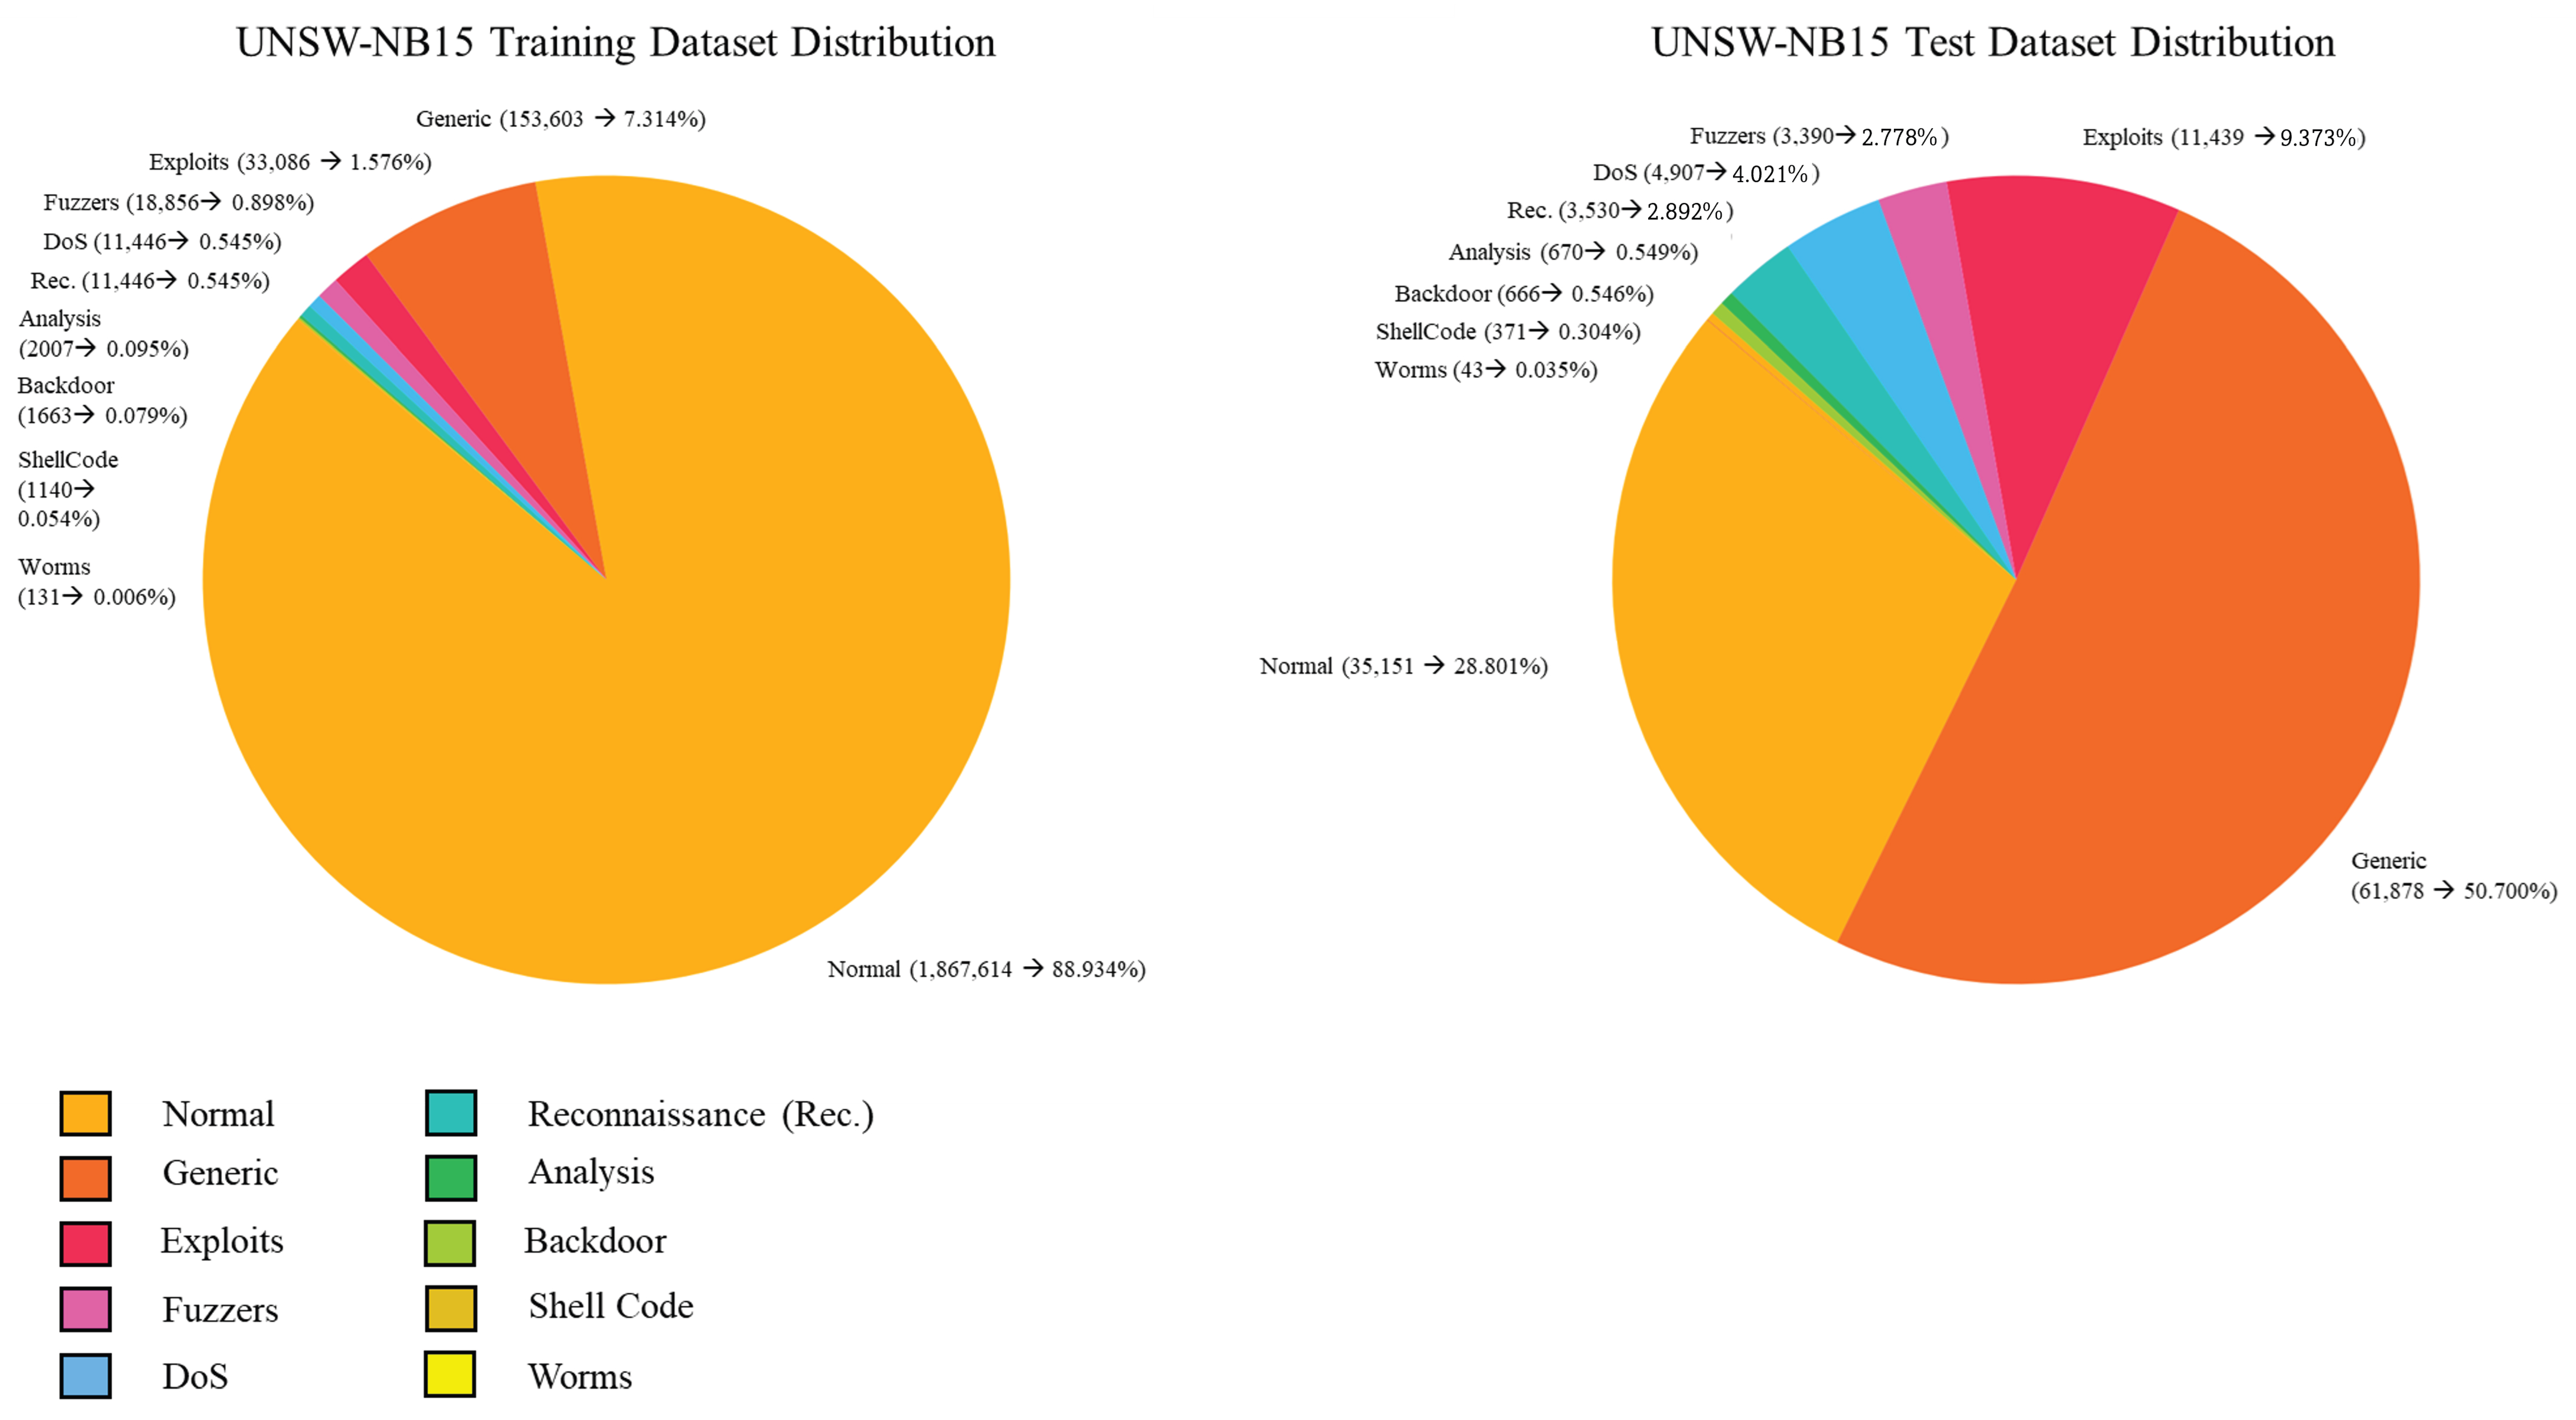
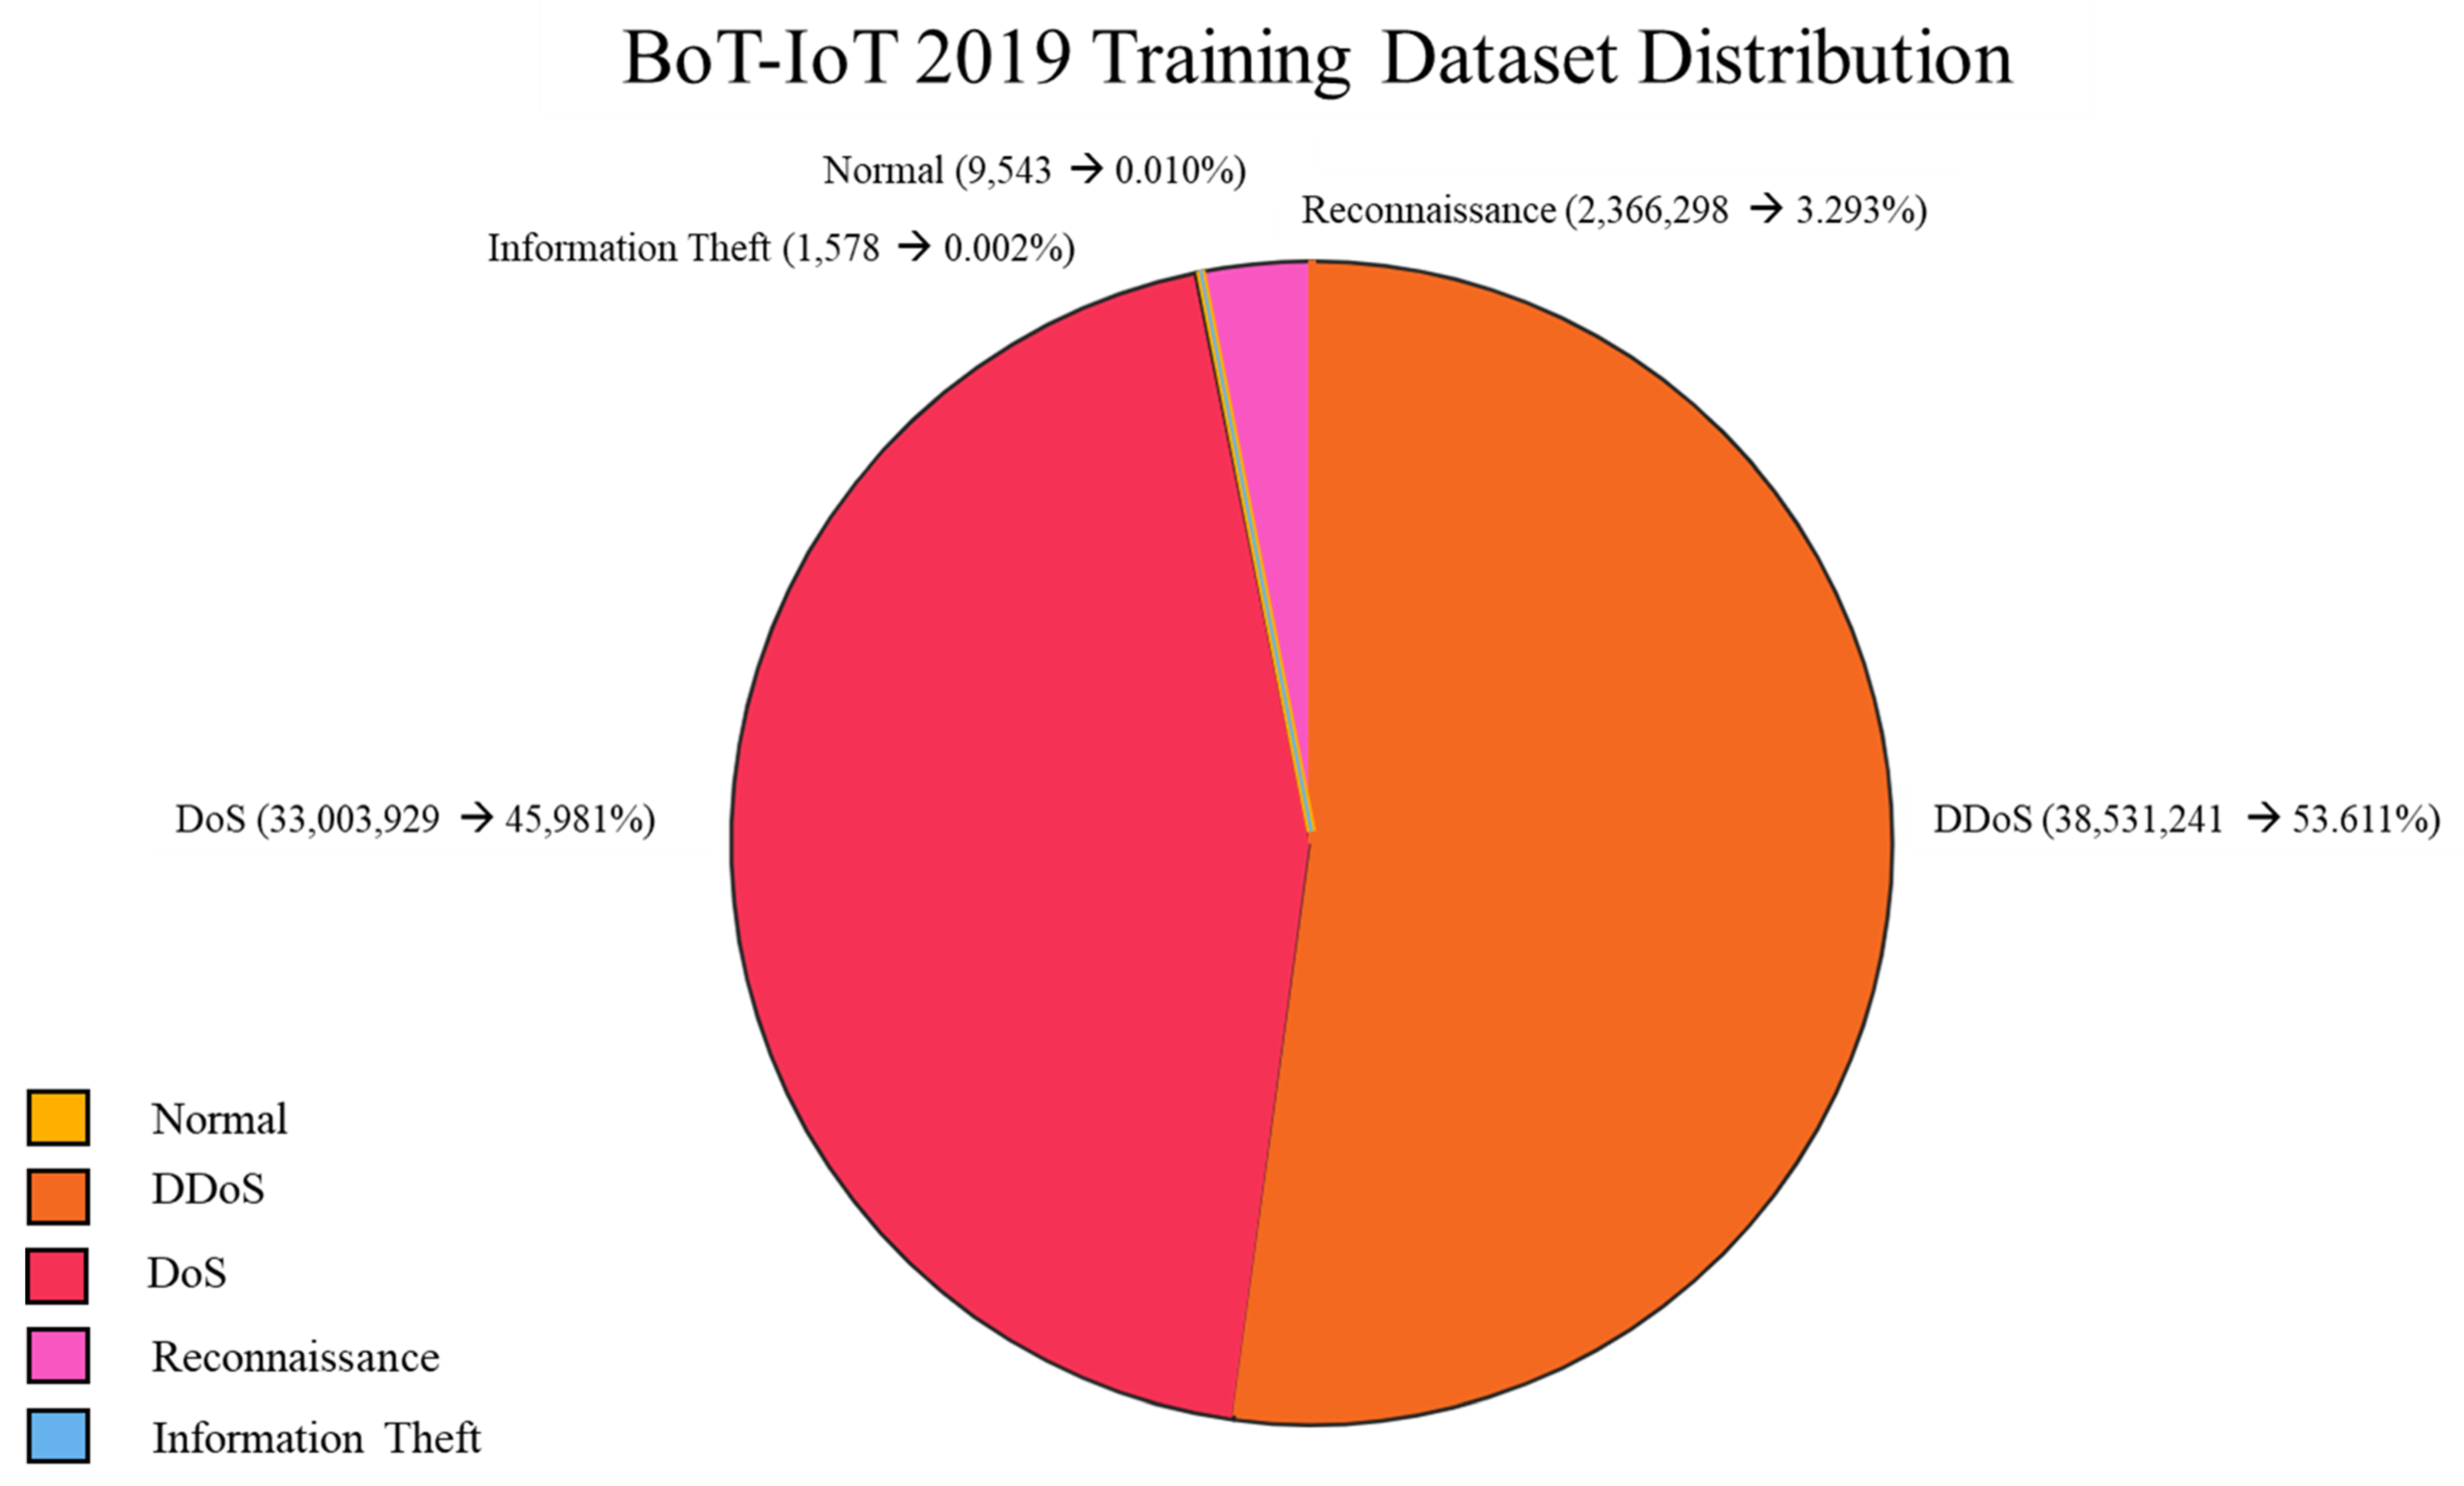







| Dataset | Year | Organization | Repository URL |
|---|---|---|---|
| KDD CUP 99 | 1999 | UCI/DARPA | https://kdd.ics.uci.edu/databases/kddcup99/kddcup99.html |
| (on-line accessed in 30 June 2025) | |||
| NSL-KDD | 2009 | University of New Brunswick (UNB) | https://www.unb.ca/cic/datasets/nsl.html |
| (on-line accessed in 30 June 2025) | |||
| UNSW-NB15 | 2015 | Australian Centre for Cyber Security | https://research.unsw.edu.au/projects/unsw-nb15-dataset |
| (on-line accessed in 30 June 2025) | |||
| CSE-CIC-IDS 2017 | 2018 | CIC + Communications Security Establishment | https://www.unb.ca/cic/datasets/ids-2017.html |
| (on-line accessed in 30 June 2025) | |||
| Bot-IoT | 2018 | UNSW/Cyber Range Lab | https://research.unsw.edu.au/projects/bot-iot-dataset |
| (on-line accessed in 30 June 2025) | |||
| TON_IoT | 2020 | UNSW + CSCRC | https://research.unsw.edu.au/projects/toniot-datasets |
| (on-line accessed in 30 June 2025) |
| Number of Features | 41 |
| Types of Features |
|
| Types of Attacks |
|
| Additional Notes |
|
| Number of Features | 41 |
| Types of Features |
|
| Types of Attacks |
|
| Additional Notes |
|
| Number of Features | 80 |
| Types of Features |
|
| Types of Attacks |
|
| Additional Notes |
|
| Number of Features | 49 |
| Types of Features |
|
| Types of Attacks |
|
| Additional Notes |
|
| Number of Features | 46 |
| Types of Features |
|
| Types of Attacks |
|
| Additional Notes |
|
| Number of Features | Variable by data source:
|
| Types of Features |
|
| Types of Attacks |
|
| Additional Notes |
|
| Attack Type | NSL-KDD | UNSW-NB15 | CICIDS2017 | TON_IoT | BoT-IoT | CSE-CIC-IDS2018 |
|---|---|---|---|---|---|---|
| DoS/DDoS | ✓ | ✓ | ✓ | ✓ | ✓ | ✓ |
| Brute Force/Auth | ✓ | ✓ | ✓ | ✓ | ✓ | |
| Port Scanning | ✓ | ✓ | ✓ | ✓ | ✓ | ✓ |
| Infiltration | ✓ | ✓ | ✓ | ✓ | ✓ | |
| Botnet/Backdoor | ✓ | ✓ | ✓ | ✓ | ||
| Shellcode/Payload | ✓ | ✓ | ✓ | |||
| Data Exfiltration | ✓ | ✓ | ✓ | |||
| Reconnaissance | ✓ | ✓ | ✓ | ✓ | ✓ | |
| Web Attacks (XSS, SQLi) | ✓ | ✓ |
| Dataset | Normal (%) | Imbalance Ratio (IR) | Entropy (Bits) | Skewness |
|---|---|---|---|---|
| NSL-KDD | 51.9 | 1.08 | 0.999 | 0.001 |
| UNSW-NB15 | 87.4 | 6.91 | 0.548 | 0.208 |
| CICIDS2017 | 84.6 | 5.49 | 0.610 | 0.144 |
| TON_IoT | 96.3 | 26.0 | 0.253 | 0.633 |
| Method | Detection Type | Learning Model | Runtime Suitability |
|---|---|---|---|
| Autoencoder (AE) | Reconstruction | Deep | Good |
| Variational Autoencoder (VAE) | Reconstruction (probabilistic) | Deep | Moderate |
| One-Class SVM (OCSVM) | Boundary-based | Shallow | Good |
| Isolation Forest (iForest) | Isolation-based | Shallow (ensemble) | Excellent |
| Local Outlier Factor (LOF) | Density-based | Shallow | Poor |
| Deep SVDD | Boundary-based | Deep | Poor |
| kNN OCC | Distance-based | Shallow | Moderate |
| Dataset | PCA Components (95% Variance) | Selected Features from PCA |
|---|---|---|
| NSL-KDD | 20 | diff_srv_rate, duration, num_file_creations, num_shells, root_shell, num_access_files, urgent, dst_host_srv_diff_host_rate, num_failed_logins, srv_diff_host_rate, dst_bytes, dst_host_diff_srv_rate, wrong_fragment, land, dst_host_count, logged_in, protocol_type, su_attempted, count, num_root |
| UNSW-NB15 | 24 | smean_sz, Djit, Sjit, res_bdy_len, Dload, Sload, service, stcpb, ct_flw_http_mthd, dttl, dtcpb, ct_srv_dst, ct_src_ltm, ct_srv_src, ct_state_ttl, ct_dst_ltm, trans_depth, Dintpkt, ct_dst_sport_ltm, state, is_sm_ips_ports, ct_ftp_cmd, ct_src_dport_ltm, sttl |
| TON_IoT | 23 | dns_rcode, conn_state, src_ip_bytes, http_response_body_len, missed_bytes, dns_qclass, dns_query, src_port, service, src_pkts, weird_name, duration, dst_port, dst_pkts, weird_addl, dst_ip, http_resp_mime_types, src_ip, proto, dst_ip_bytes, ts, dst_bytes, dns_qtype |
| CICIDS 2017 | 30 | Down/Up Ratio, TotLen Bwd Pkts, Dst Port, Fwd Pkt Len Mean, Pkt Len Mean, Fwd PSH Flags, Init Bwd Win Byts, Fwd Act Data Pkts, Tot Fwd Pkts, Fwd Pkt Len Max, Flow IAT Min, Fwd IAT Min, TotLen Fwd Pkts, Tot Bwd Pkts, Fwd URG Flags, Init Fwd Win Byts, Fwd Pkt Len Min, Bwd IAT Min, Active Std, Bwd Pkt Len Min, URG Flag Cnt, Flow Pkts/s, Bwd Pkts/s, Fwd Header Len, Pkt Len Std, Bwd Header Len, Pkt Size Avg, Bwd Pkt Len Mean, Timestamp, Flow IAT Max |
| Algorithm | Hyperparameter | Value/Choice |
|---|---|---|
| Autoencoder | Layers (enc/dec) | 2 encoder, 2 decoder |
| Units per layer | [400, 200] | |
| Activation | ReLU | |
| Loss | MSE | |
| Optimizer | Adam (lr = 0.001) | |
| Epochs | 150 | |
| Batch size | 64 | |
| Variational Autoencoder | Latent size | 6 |
| Activation | ReLU | |
| Loss | MSE + KL divergence | |
| Optimizer | Adam (lr = 0.001) | |
| Epochs | 150 | |
| Batch size | 64 | |
| One-Class SVM | Kernel | RBF |
| Gamma | ||
| Nu | 0.05 | |
| Isolation Forest | Trees | 100 |
| Max samples | 256 | |
| Contamination | 0.05 |
| Model | Dataset | Accuracy | Precision | Recall | F1-Score |
|---|---|---|---|---|---|
| OCSVM | NSL-KDD | 0.89 | 0.85 | 0.81 | 0.83 |
| UNSW-NB15 | 0.95 | 0.93 | 0.92 | 0.92 | |
| TON_IoT | 0.87 | 0.84 | 0.79 | 0.81 | |
| CICIDS2017 | 0.88 | 0.86 | 0.80 | 0.83 | |
| AE | NSL-KDD | 0.91 | 0.89 | 0.84 | 0.86 |
| UNSW-NB15 | 0.96 | 0.94 | 0.93 | 0.93 | |
| TON_IoT | 0.88 | 0.86 | 0.82 | 0.84 | |
| CICIDS2017 | 0.89 | 0.87 | 0.83 | 0.85 | |
| iForest | NSL-KDD | 0.86 | 0.83 | 0.78 | 0.80 |
| UNSW-NB15 | 0.94 | 0.92 | 0.91 | 0.91 | |
| TON_IoT | 0.85 | 0.82 | 0.77 | 0.79 | |
| CICIDS2017 | 0.87 | 0.84 | 0.80 | 0.82 | |
| VAE | NSL-KDD | 0.90 | 0.87 | 0.83 | 0.85 |
| UNSW-NB15 | 0.96 | 0.94 | 0.92 | 0.93 | |
| TON_IoT | 0.88 | 0.85 | 0.81 | 0.83 | |
| CICIDS2017 | 0.89 | 0.86 | 0.82 | 0.84 |
| ML Technique | Inference Time (ms) |
|---|---|
| OCSVM | 2.8 |
| AE | 3.1 |
| VAE | 5.3 |
| iForest | 1.3 |
| Dataset | F-Statistic | p-Value | Significance |
|---|---|---|---|
| NSL-KDD | 14.23 | 0.00009 | Yes |
| UNSW-NB15 | 21.58 | 0.00001 | Yes |
| CICIDS2017 | 11.41 | 0.00027 | Yes |
| TON_IoT | 8.67 | 0.00065 | Yes |
| System (Ref.) | Methodology | Accuracy (%) | F1-Score (%) | Runtime/Deployment |
|---|---|---|---|---|
| DeepIDS [181] | CNN + supervised | 97.2 | 96.1 | Offline (KDD, NSL-KDD) |
| CICFlowMeter + Random Forest [182] | Flow-based + RF | 92.5 | 91.0 | Real-time (CICIDS2017) |
| LOF-IDS [183] | Unsupervised LOF | 87.3 | 85.2 | Partial runtime, no GUI |
| EdgeML-IDS [184] | Lightweight DL | 94.0 | 93.1 | IoT gateway, online |
| Ours (OCC-IDS) | One-Class SVM/AE/VAE/iForest | 96.0 (max) | 93.0 (UNSW-NB15) | Real-time, modular GUI, TCP/UDP capture |
| Model | Training Dataset | FPR (%) | Comments |
|---|---|---|---|
| Autoencoder (AE) | UNSW-NB15 | 3.8 | Balanced feature space yields low FPR. |
| Autoencoder (AE) | CICIDS2017 | 11.5 | High variability in benign traffic increases FPR. |
| Variational Autoencoder (VAE) | TON_IoT | 9.2 | Sensitive to rare yet legitimate deviations. |
| OCSVM | NSL-KDD | 12.0 | Legacy dataset with limited behavioral diversity. |
| Isolation Forest (iForest) | UNSW-NB15 | 4.1 | Fast and robust tree-based separation. |
Disclaimer/Publisher’s Note: The statements, opinions and data contained in all publications are solely those of the individual author(s) and contributor(s) and not of MDPI and/or the editor(s). MDPI and/or the editor(s) disclaim responsibility for any injury to people or property resulting from any ideas, methods, instructions or products referred to in the content. |
© 2025 by the authors. Licensee MDPI, Basel, Switzerland. This article is an open access article distributed under the terms and conditions of the Creative Commons Attribution (CC BY) license (https://creativecommons.org/licenses/by/4.0/).
Share and Cite
Paolini, D.; Dini, P.; Soldaini, E.; Saponara, S. One-Class Anomaly Detection for Industrial Applications: A Comparative Survey and Experimental Study. Computers 2025, 14, 281. https://doi.org/10.3390/computers14070281
Paolini D, Dini P, Soldaini E, Saponara S. One-Class Anomaly Detection for Industrial Applications: A Comparative Survey and Experimental Study. Computers. 2025; 14(7):281. https://doi.org/10.3390/computers14070281
Chicago/Turabian StylePaolini, Davide, Pierpaolo Dini, Ettore Soldaini, and Sergio Saponara. 2025. "One-Class Anomaly Detection for Industrial Applications: A Comparative Survey and Experimental Study" Computers 14, no. 7: 281. https://doi.org/10.3390/computers14070281
APA StylePaolini, D., Dini, P., Soldaini, E., & Saponara, S. (2025). One-Class Anomaly Detection for Industrial Applications: A Comparative Survey and Experimental Study. Computers, 14(7), 281. https://doi.org/10.3390/computers14070281


