Article

A Decision Support System for Classifying Suppliers Based on Machine Learning Techniques: A Case Study in the Aeronautics Industry

by
Ana Claudia Andrade Ferreira
1,*,
Alexandre Ferreira de Pinho
1,
Matheus Brendon Francisco
1,
Laercio Almeida de Siqueira, Jr.
1 and
Guilherme Augusto Vilas Boas Vasconcelos
2
1
Production and Management Engineering Institute, Federal University of Itajubá—UNIFEI, Itajubá 37500-903, Brazil
2
Mechanical Engineering Institute, Federal University of Itajubá—UNIFEI, Itajubá 37500-903, Brazil
*
Author to whom correspondence should be addressed.
Computers 2025, 14(7), 271; https://doi.org/10.3390/computers14070271
Submission received: 28 April 2025 / Revised: 23 May 2025 / Accepted: 30 May 2025 / Published: 10 July 2025

Abstract

This paper presents the application of four machine learning algorithms to segment suppliers in a real case. The algorithms used were K-Means, Hierarchical K-Means, Agglomerative Nesting (AGNES), and Fuzzy Clustering. The analyzed company has suppliers that have been clustered using responses such as the number of non-conformities, location, and quantity supplied, among others. The CRISP-DM methodology was used for the work development. The proposed methodology is important for both industry and academia, as it helps managers make decisions about the quality of their suppliers and compares the use of four different algorithms for this purpose, which is an important insight for new studies. The K-Means algorithm obtained the best performance both for the metrics obtained and the simplicity of use. It is important to highlight that no studies to date have been conducted using the four algorithms proposed here applied in an industrial case, and this work shows this application. The use of artificial intelligence in industry is essential in this Industry 4.0 era for companies to make decisions, i.e., to have ways to make better decisions using data-driven concepts.

1. Introduction

“In the current era, marked by unprecedented technological advances and increasing globalization, efficient supply chain management (SCM) has become a fundamental pillar for the success of companies [1]. SCM refers to the management of activities, people, organizations, information, and resources involved in the delivery of a product or service from a supplier to a customer [2]. This includes managing relationships between supply chain partners, such as suppliers, logistics service providers, and information technology providers, and customers [3]. The core of SCM is to fully understand customer and market needs, maintain partnerships with other stakeholders, and achieve integrated resource sharing [4].
The present epoch is marked by the digitalization of processes, which creates a digital and autonomous world, making integration a key aspect of modern SCM [5]. Managing the supply chain involves challenging decision-making due to its complexity, specific characteristics, and the dynamic nature of its processes and operations. Suppliers play a crucial role in the supply chain, making it imperative to focus on them. As a company grows larger, managing an increasing number of suppliers becomes more difficult. Artificial intelligence (AI) is being employed to tackle such challenges [6], offering robust solutions in supply chain operations [7].
SCM provides a framework for implementing AI as it operates as a network-based system. A network of suppliers generates substantial data and requires rapid decision-making, making the use of AI tools highly recommended [8,9]. The widespread application of AI has significantly enhanced SCM, with AI applications considered one of the most valuable and promising areas [10]. Using AI for supplier assessment and selection represents a novel approach that surpasses traditional methods reliant on human analysis in decision-making processes [11].
The application of AI in supplier selection and segmentation has garnered academic interest. Ref. [12] conducted a comparative analysis of factors influencing supplier selection and monitoring in the automotive industry, employing qualitative and quantitative data to formulate a multi-criteria decision-making framework. Ref. [13] also discussed supplier selection studies, proposing an algorithm for optimal supplier selection based on managing expert opinions and rough information using TrFn-based linguistic variables. Ref. [14] presented a supervised machine learning approach for data-driven simulation of resilient supplier selection in digital manufacturing. Ref. [15] introduced a new Fuzzy BWM approach for evaluating and selecting sustainable suppliers in SCM, demonstrating its efficacy within the Iran Khodro Company. Ref. [16] analyzed the potential of automated machine learning for applications within business analytics, which could help to increase the adoption rate of ML across all industries.
Another important study was published by [17], which developed a multiple criteria decision support system for customer segmentation using a sorting outranking method. This research introduces and validates a multi-criteria model for B2B customer segmentation. It extends transactional behavior metrics like RFM with criteria such as customer collaboration and growth rates. The model employs the GLNF sorting algorithm to classify 8157 customers of a multinational healthcare company and validates the SILS quality indicator for assessing segmented customer groups. Compared to K-Means data mining, this approach produces more homogeneous, robust segments that align closely with company strategies, offering automated tools for detailed decision-making in supply chain management.
Numerous other studies employing machine learning related to supplier contexts have been published. Ref. [18] proposed a novel hybrid algorithm combining genetic algorithms and ant colony optimization for supplier selection. Ref. [19] studied a supplier selection model for hospitals using a combination of artificial neural networks and Fuzzy Vikor. Ref. [20] applied machine learning and optimization models to supplier selection and order allocation planning. Ref. [21] conducted a review of decision models for supplier selection in the Industry 4.0 era. Ref. [22] developed a dynamic decision support system for sustainable supplier selection in the circular economy, among other contributions. To address the challenge of managing numerous decision attributes and limited data samples in SCM, [23] recommended a dynamic supplier selection algorithm based on Conditional Generative Adversarial Networks (CGANs), which can reduce data dimensionality and complexity. Ref. [24] examined the effects of training data taken from long-tail suppliers on the predictive quality of different machine learning approaches for the extraction of information from invoices. Other academics are using—AI algorithms to deal with suppliers, as shown in Table 1.
Recent academic studies highlight the multifaceted importance of AI in supplier selection, improving performance, managing risks, and reducing costs. To the authors’ best knowledge, there are no (or very scarce) studies that use AI to cluster suppliers with similar characteristics and compare four clustering algorithms. In large companies, the number of suppliers is very large, and making decisions about each one of them is completely unfeasible. Thus, the need to form groups and make decisions about the groups is essential.
Therefore, this paper stands out by (i) applying AI to supplier clustering; (ii) conducting a comparative analysis of four clustering algorithms (K-Means, Hierarchical K-Means, AGNES, and Fuzzy Clustering); and (iii) developing a model to evaluate new suppliers using the implemented clustering algorithm, which is demonstrated in a real-world case.
This manuscript is organized as follows: Section 2 presents the theoretical background, Section 3 presents the methodology, Section 4 presents the conclusions.

2. Theoretical Framework

2.1. Machine Learning Techniques for Clustering

The convergence of machine learning and clustering plays an essential role in data analysis, enabling the discovery of key insights within unlabeled datasets. This connection is widely explored in current research, where the application of machine learning techniques to clustering algorithms has shown promising capabilities in identifying hidden structures in data [35]. Among the widely studied clustering algorithms, K-Means, Hierarchical K-Means, AGNES (Agglomerative Nesting), and Fuzzy Clustering stand out.

2.1.1. K-Means

The K-Means algorithm performs clustering iteratively, utilizing distance as a fundamental metric. By selecting K classes in a dataset, it computes the mean distance to establish the initial centroid for each class. For a dataset X with n multiple dimensions and category K to be defined, Euclidean distance is adopted as the similarity metric. The objective of clustering is to minimize the sum of squares of the distances between the points and associated centroids, thus seeking a significant minimization [36].
In executing K-Means, an essential approach involves randomly selecting initial data points as cluster centers. Each point is assigned to the nearest center, after which the center of each cluster is recalculated as the mean of its assigned points. This process repeats until cluster centers stabilize or until a specified number of iterations is achieved. Figure 1 depicts the K-Means method.
However, K-Means requires defining the number of clusters in advance, which can be challenging in practical applications. The initial center choices significantly affect outcomes, introducing potential instability. Furthermore, determining the centers is intrinsically linked to the choice of the K value, which constitutes the central focus of the algorithm and has a direct impact on the clustering results, considerably influencing local or global optimality [37]. The literature offers various methods to address this issue, including the Elbow Method, Gap Statistic, Silhouette Coefficient, and Canopy algorithm.
An Elbow Method Algorithm
The fundamental approach of the Elbow Method algorithm consists of calculating the squared distance between each point and the cluster centroid, generating a series of values for K. The performance metric used is the Mean Squared Error (MSE), which involves iterating different values of K, calculating it in the corresponding iterations. Smaller values indicate that each cluster is more convergent. When adjusting the number of clusters to the number of clusters shown in the data, the MSE rapidly decreases. However, when exceeding the number of actual clusters, the MSE continued to decrease, but the reduction is more gradual. This characteristic is observed when the number of defined clusters exceeds the actual number of clusters [36].
The Gap Statistic Algorithm
The Gap Statistics algorithm is an algorithm presented by [38] to determine optimal cluster numbers when the actual number is unknown. The essence of the Gap Statistics algorithm involves the introduction of reference measurements, which are obtained through the Monte Carlo sampling method found in the article by [39]. These reference measurements calculate the sum of squares of the Euclidean distance between two measurements in each class. The clustering outcomes from the reference zero-mean distribution are compared to define the best number of clusters in the dataset.
The Silhouette Coefficient Algorithm
The Silhouette Coefficient algorithm was initially introduced by Peter J. Rousseeuw cited by the author [40] and integrates the concepts of cohesion and resolution. Cohesion is about the similarity between the object and the cluster, and is entitled separation when paralleled to other clusters. This assessment is performed using the Silhouette value, which varies from −1 to 1. A Silhouette value close to 1 shows a strong association between the object and the cluster. If a cluster has a high Silhouette value, it suggests that the model is appropriate and satisfactory.
The Canopy Algorithm
The Canopy algorithm divides data into overlapping subsets, known as Canopies, each serving as a preliminary cluster. This method leverages low-cost similarity measures to fast-track clustering, making it valuable as a pre-processing step in other clustering algorithms. Canopy clustering is used in the early stages of other clustering algorithms. Canopy training involves specifying two distance thresholds—T1 and T2, with the condition that T1 > T2. The original dataset X is classified with specific rules. Firstly, a data vector A is randomly chosen from X, and the distance d between the other sample data vectors in A and X is calculated using an estimated distance calculation technique. Sample data vectors with d less than T1 are mapped to a Canopy, while those with d less than T2 are put away from the candidate core vectors. This process repeats until no candidate vectors remain, indicating that X is completely mapped, completing the algorithm.

2.1.2. Hierarchical K-Means

The Hierarchical K-Means algorithm is an extension of the K-Means algorithm that proposes a hierarchical methodology to data cluster analysis, which is a sequence of sequential merges to group n objects based on distance. Unlike K-Means, this method does not require the prior specification of clusters; instead, it chooses clusters using trees or dendrograms [41]. A dendrogram is a tree-shaped graphical illustration that shows the clusters’ distribution, constructed by branches, each with one or more leaves, ordered according to the similarity (or dissimilarity) between them. Close branches at the same height show similarity, while branches at different heights show dissimilarity, with the greater the difference in height, the greater the dissimilarity [42]. Figure 2 shows the Hierarchical K-Means.
Starting with each data point in its own cluster, the hierarchical clustering process progressively joins clusters until it reaches a single cluster. The longest edge that does not cross a horizontal line is chosen as the minimum distance criterion in a dendrogram, which is frequently used to depict clusters. In the final model, clusters that cross this line are selected. The number of clusters produced is controlled by the cut height in the dendrogram, which functions as the K value in K-Means clustering. Hierarchical clustering aims to reduce variance in clusters by providing distinct and appropriate clusters [43]. There are two types of hierarchical clustering algorithms:
  • Agglomerative hierarchical clustering (from bottom to top), which operates as follows: It starts with n clusters, where each object is in its own cluster. The most similar objects are merged. Repeat step 2 until all objects are in the same cluster.
  • Divisive hierarchical clustering (top to bottom), which operates as follows: Starts with a cluster where all objects are together. The most dissimilar objects are divided. Repeat step 2 until all objects are in their own clusters.
In cluster analysis, the distance measure plays a crucial role in defining the similarity or dissimilarity between objects [43]. Several methods are used to calculate this distance, including the Euclidean distance, the Manhattan distance, the Minkowski distance, and the Pearson sample correlation distance [44]. Furthermore, we employ various cluster agglomeration techniques, also referred to as linkage techniques, to determine the separation between clusters. The Ward’s minimum variance method, centroid linkage clustering, maximum, minimum, and average stand out among them. These methodological decisions are essential since they have a direct bearing on the outcomes.

2.1.3. AGNES

Based on the agglomerative hierarchical approach, the Agglomerative Nesting algorithm (AGNES) is a clustering technique. Each object initially belongs to a cluster, and the algorithm approach is driven from bottom to top in a hierarchy based on the metrics of this method. To allow clusters to merge, the closest distance measurement is determined during the process. AGNES operates until an initial dissimilarity is reached, grouping data objects into different clusters until reaching the established dissimilarity criterion to finalize the process [45].
Figure 3 illustrates the single link algorithm, each cluster is characterized by the inclusion of all objects belonging to that cluster, with the similarity calculated based on the smallest distance between the data within the group. This procedure is iterated until the merging of all clusters is completed, with the number of clusters being determined by the user as a termination condition [46].
According to [47], five steps are required to update the AGNES algorithm:
  • Calculate the similarity matrix;
  • Allocate each example of the data into a group, creating leaf nodes of tree D;
  • As long as there is the possibility of merging groups, the algorithm will calculate;
  • The algorithm checks the distance between all pairs of groups, using the similarity matrix;
  • The algorithm finds the most similar pair of groups and transforms them into a single group, creating an entire node in the d-tree hierarchy.
The AGNES algorithm uses similarity measures, such as Euclidean distance and Manhattan distance, to calculate the proximity between objects. It is important to highlight that in the context of our study, we treated Hierarchical K-Means and AGNES as two distinct algorithms with conceptually different approaches to clustering.

2.1.4. Fuzzy

The Fuzzy algorithm addresses ranges of multiple ranges rather than data points, thus allowing accurate forecasting for all data points within the ranges of those ranges [48]. Fuzzy accuracy is influenced by human knowledge [49]. Mamdani and Sugeno are the two modules that comprise the Fuzzy algorithm. Whereas the Sugeno module’s input parameters have multiple ranges and its output parameters have data points, the Mamdani module’s input and output parameters are both divided into ranges. The Fuzzy algorithm is divided into two clauses: the first highlights the influential input parameters, while the second shows the output performance parameters [50]. Each input/output parameter’s entire range is separated into multiple smaller ranges, each of which is represented by a primitive shape, and it can be triangular, trapezoidal, sinusoidal, or Gaussian, as shown in Figure 4.
The pattern of variation in the data within each range determines which primitive form is used. Each strip is referred to as an association function along with its primitive form. The behavior of the imported input/output data determines the number of association functions and the range of limits for each one. Following the definition of the association functions, rules are created using the input/output parameter values in the rule editor of the Fuzzy module. To ensure the accuracy of the formulated model, the dataset is divided into two parts: training and validation datasets [51]. Rules connect input values to output values through “IF-THEN” statements and Boolean operators “AND”, “OR” or “NOT” [52]. As a result, rules act as the connection between matching input and output values. There are fewer rules when there are fewer data points, which may cause some imported input values to be predicted incorrectly. More data points mean more rules, which increases accuracy. However, overfitting, in which an imported input value may have multiple output values, can also result in inaccurate predictions. The Fuzzy module’s rules viewer, which is divided into two sections—one with all input parameters and their association functions, and the other with output parameters and their corresponding association functions—is where the rules are carried out.
The output values are predicted using the predetermined rules after the input values from the training dataset are imported. The defined rules are regarded as the best ones for the developed Fuzzy model for the training dataset if the expected and actual output values for each input value are close. Otherwise, the rules are adjusted in the rules editor to obtain more accurate results [53]. By importing the input values from the validation dataset, the Fuzzy model that has been developed with the optimized rules is used to predict the output values. The Fuzzy model can be extended to all potential ranges of each input parameter if it yields accurate predictions for the validation dataset. To determine the precise value within the range of the output parameter based on the imported input value and the rule, a defuzzification technique is applied [54].
There are several defuzzification techniques available, such as centroid, last maximum, mean of maximum, half of maximum, center of area, center of gravity, and area bisector, among others. Furthermore, the user can define their own defuzzification techniques and custom association functions (type, quantity, etc.) [55]. Numerous clustering algorithms have been developed with distinct goals in mind, aiming to address the different challenges that come up when clustering data. There are numerous well-known and widely recognized algorithms, mainly related to the Fuzzy C-Means (FCM) algorithm, including the Possibilistic Fuzzy C-Means (PFCM) algorithm, Possibilistic C-Means (PCM) algorithm, Robust Fuzzy C-Means (FCM-σ) algorithm, Noise Clustering (NC), Kernel Fuzzy C-Means (KFCM), Intuitionistic Fuzzy C-Means (IFCM), Robust Kernel Fuzzy C-Mean (KFCM-σ), Robust Intuitionistic Fuzzy C-Means (IFCM-σ), Kernel Intuitionistic Fuzzy C-Means (KIFCM), Robust Kernel Intuitionistic Fuzzy C-Means (KIFCM-σ), Credibilistic Fuzzy C-Means (CFCM), Size-insensitive Integrity-Based Fuzzy C-Means (siibFCM), and Size-insensitive Fuzzy C-Means (csiFCM) [55].
Fuzzy Clustering, also known as Fuzzy C-Means, is a well-known application in the context of data clustering and classification. The uncertainty in data point classification is reflected by Fuzzy C-Means, which allocates data points to several clusters with differing levels of membership. Fuzzy Clustering assigns degrees of membership by allowing points to partially belong to multiple clusters.
In recent years, the Fuzzy Logic and Fuzzy C-Means algorithms have been increasingly applied in the field of SCM to address the complexities and uncertainties within supply chains. Ref. [56] developed a Fuzzy C-Means (FCM)-based integrated order picking strategy for items’ warehouse layout planning.

2.2. Indices

The evaluation of clustering algorithms is crucial, and validation indices, such as the Average Proportion of Non-overlap (APN), Average Distance (AD), Average Distance Between Means (ADM), and Figure Of Merit (FOM), are commonly used. These indices, classified as clustering stability validation ones, were used in the present paper. It assesses the consistency of a clustering by comparing it with the clusters derived from eliminating each column individually, one by one [57].

2.2.1. Average Proportion of Non-Overlap (APN)

The APN value is the ratio of the total area covered by two clusters to the area of non-overlap between them. To put it another way, it involves comparing clustering with all data to clustering with one column excluded in order to determine the average percentage of observations that wind up in various clusters. APN values range from 0 to 1, with smaller values indicating more consistent clustering outcomes.

2.2.2. Average Distance

By adding up the distances between two points and dividing that total by the number of pairs in this data group, the AD is determined. Both with the full dataset and with one column removed, it determines the Average Distance between observations within the same cluster. The AD has a value between 0 and infinity, and smaller values are ideal.

2.2.3. Average Distance Between Means

The distances between each pair of group means are added up, and the result is divided by the total number of pairs to determine the ADM value. It allows one to observe how distinct clusters are from one another. Smaller values are preferred. It evaluates the mean distance between cluster centers for observations within the same cluster in both scenarios. The values range from 0 to 1.

2.2.4. Figure Of Merit

The FOM creates a unique measure by combining multiple performance metrics. When clustering depends on the remaining (non-removed) columns, it measures the average within-cluster variance of the removed column. It ranges from zero to infinity, with smaller values being better.
In summary, these indices are used to assess the clustering algorithms developed in this paper and select the most appropriate one.

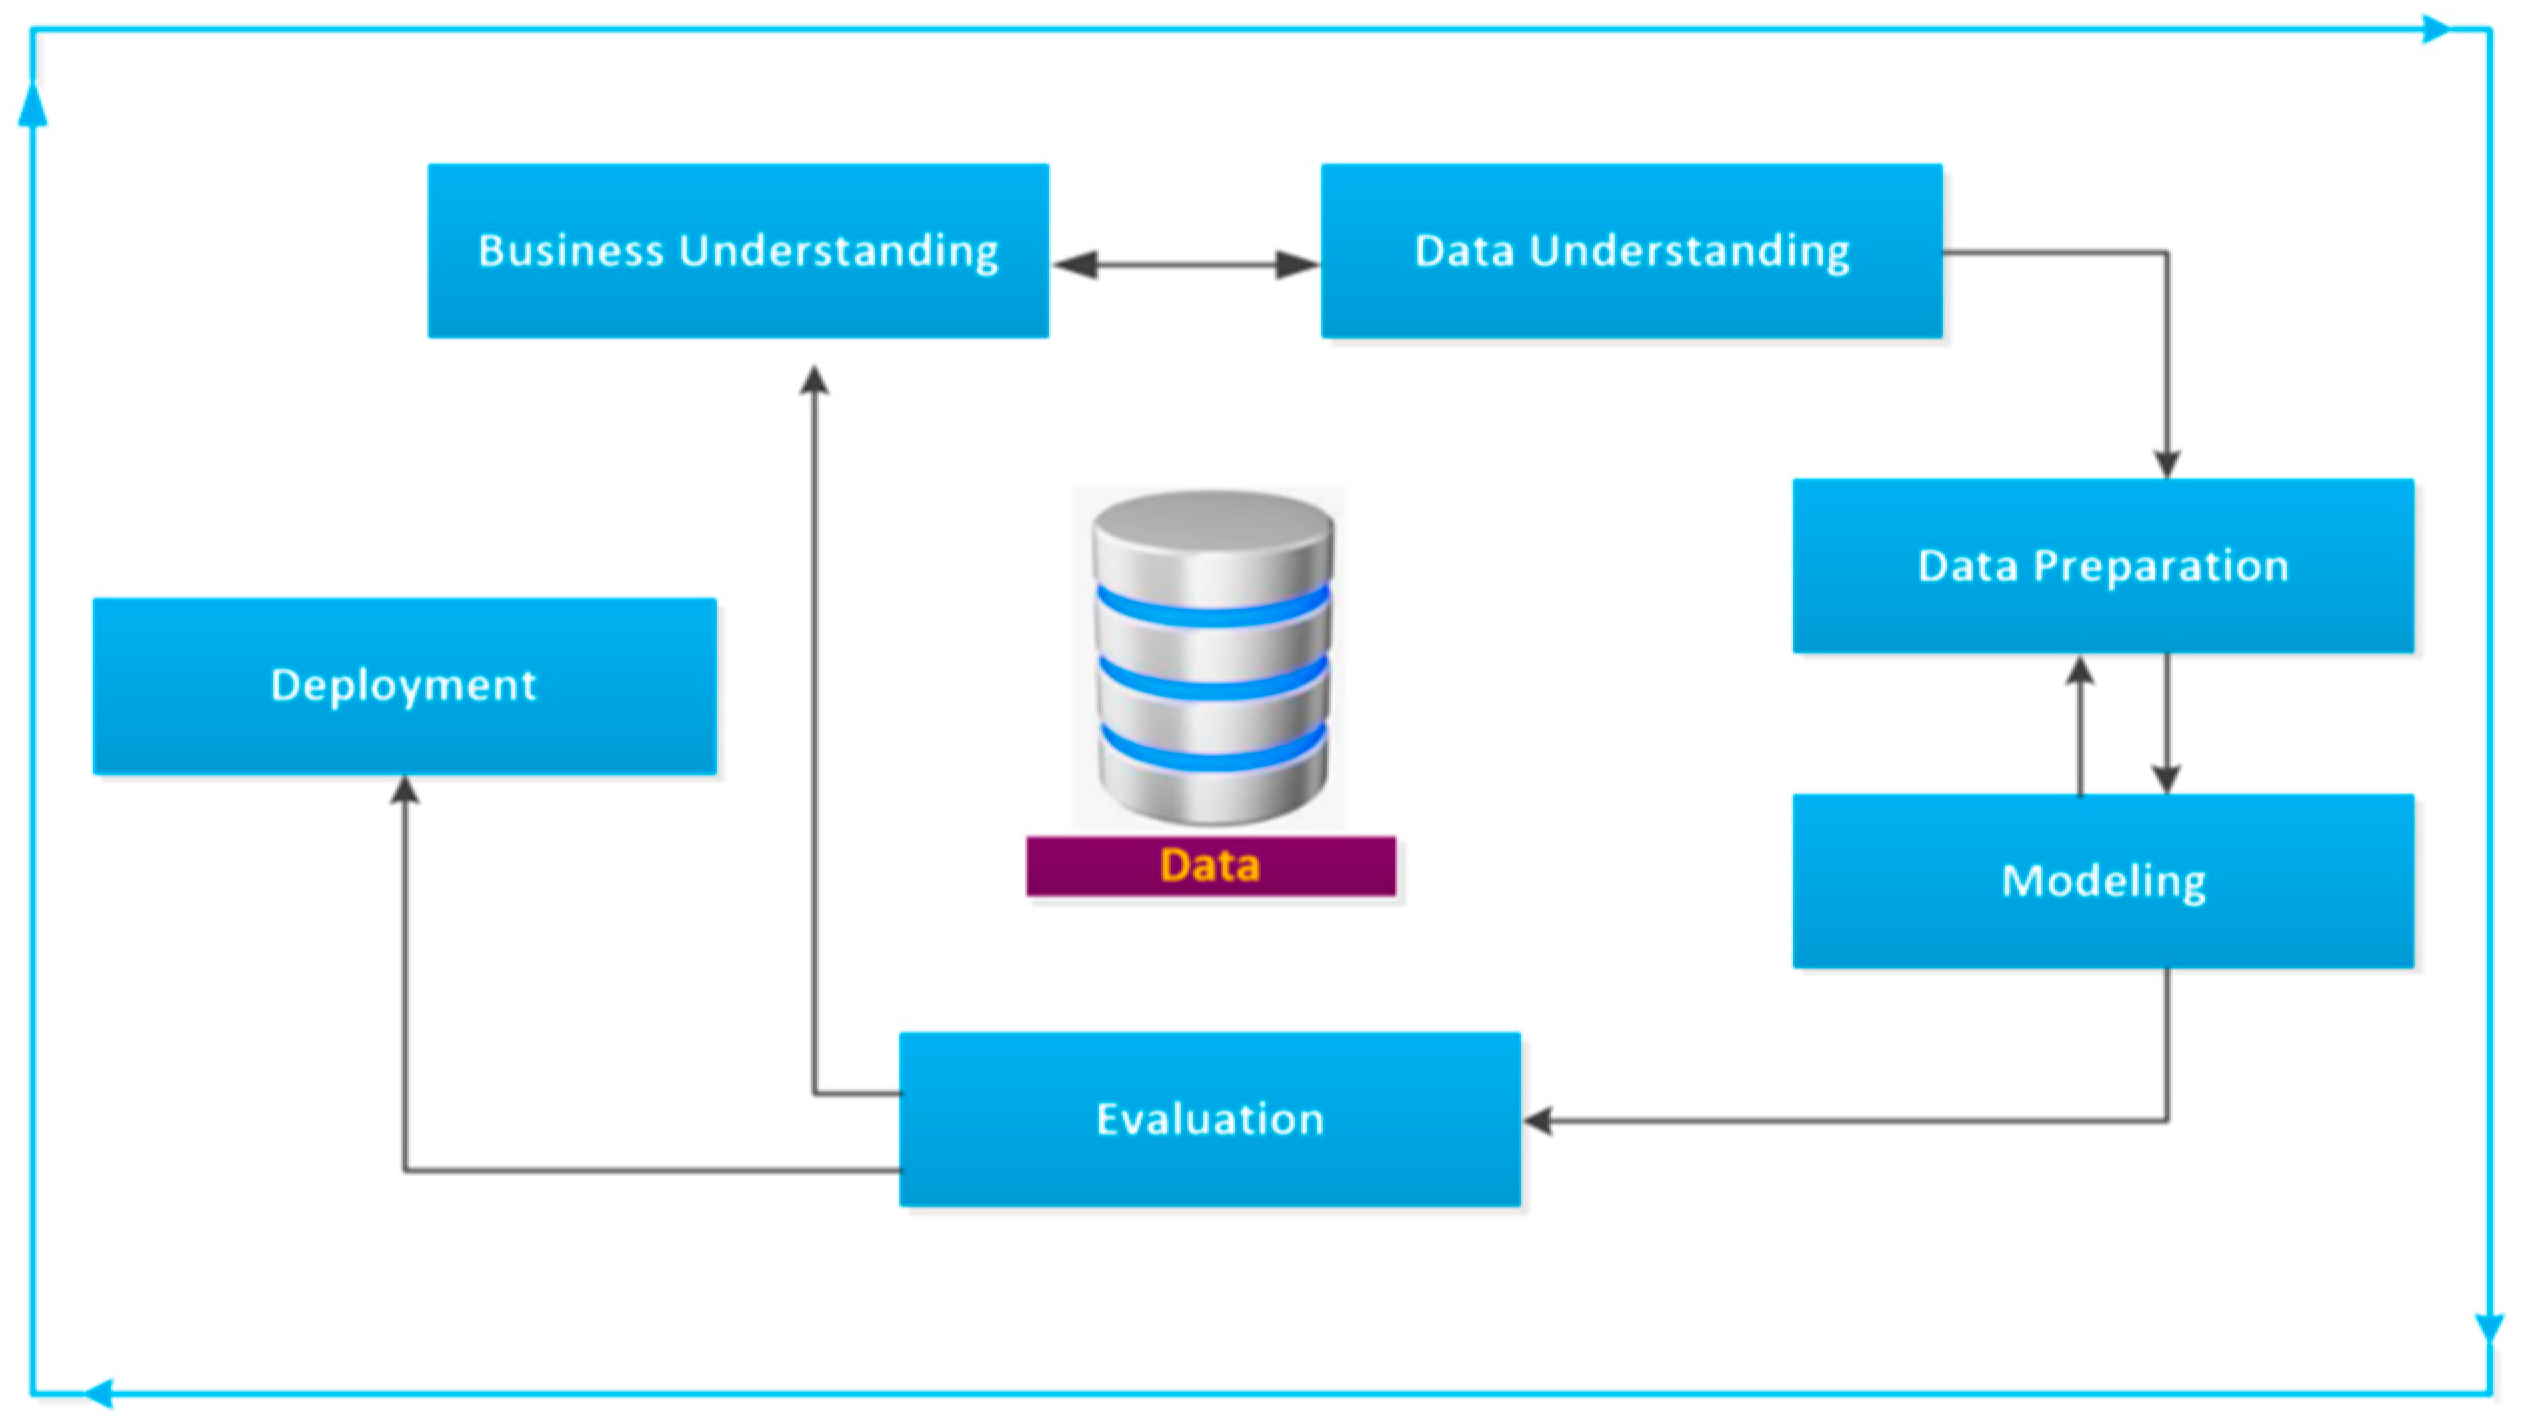
3. Materials and Methods

In this section, the methodology used in this work is presented. To guide the project, we applied the CRISP-DM (Cross-Industry Standard Process for Data Mining) framework, a widely adopted methodology in data science [58]. Originally developed by Shearer in 2000, CRISP-DM provides a structured approach through six interconnected stages: understanding business needs, analyzing data, preparing datasets, developing models, evaluating outcomes, and implementing solutions.
Generally speaking, the initial phase seeks a deep understanding of the business context and data mining objectives. The next step emphasizes analyzing and preparing the available data for upcoming processes. During modeling, suitable data mining techniques are selected and applied, while evaluation ensures the results’ accuracy and relevance. In the final Implementation phase, insights are integrated into operational workflows. Thanks to its modular and structured design, CRISP-DM provides a solid foundation for complex projects, including developing machine learning-based decision support systems for supplier selection (see Figure 5).
In the present work, once the database with information from the various suppliers was available, the continuation of the project was developed using the aforementioned methodology—CRISP-DM. In this way, the six steps were followed as described.

3.1. Business Understanding

The initial phase of CRISP-DM is called Business Understanding. In this work, we obtained an in-depth understanding of the study objectives, requirements, and challenges faced in classifying suppliers. This study aims to develop a tool to support supplier clustering. To manage these suppliers, companies generally use software characterized as Enterprise Resource Planning (ERP). In the specific case of the present work, the need for a decision-making support tool for classifying suppliers was shown.
Academics have similarly applied clustering techniques to improve the suppliers’ decision-making process. Ref. [59] applied the following algorithms: K-Means, Agglomerative Hierarchical Clustering (AHC), and Self-Organizing Maps (SOMs) in a real work environment in Mozambique. Ref. [60] presented a comparative study of three machine learning methods and two traditional projection techniques for demand forecasting in small-to-medium leather businesses, employing the K-Means algorithm among other approaches. This stage includes four steps:
  • Determine business objectives: The objective was understood, and expectations were aligned with the project. The objective of this work is to reduce costs related to supplier management and improve the decision-making process, since the supplier base is extensive and heterogeneous, and the process of managing these partners has proved to be costly in terms of time and financial resources. In the end, we hope to have a tool to support the clustering of suppliers for any company.
  • Assess the project start situation: The project requirements were determined, the risks were assessed, and a cost–benefit analysis related to the present work was carried out. The project requirements were based on mapping the current situation of suppliers, defining criteria for clustering suppliers, and defining the integration of information systems for data analysis (ERP, Excel, and R-Studio Software—version 2022.12.0+353). The risks raised were as follows: obtaining clusters with high-risk suppliers, excessive standardization of processes after clustering, changes in the business environment throughout the project, and results that lead to inflexible decisions since the sector studied is characterized as dynamic. Finally, the cost–benefit proved to be valid, as it would represent low costs for the company compared to the expected benefits.
  • Determine the objectives of the data science project: It was determined that the objective of the project would be to build a computational program that would obtain an accuracy of 80% in the results shown. The objective can be defined jointly with the managers involved, based on their experience in other similar projects.
Produce a project plan: Finally, the technologies and tools used were determined: R-Studio software, Excel, and SAP—version 8000.1.6.1162. The project phases were defined and are summarized as initialization, planning, execution, monitoring and control, and closure.

3.2. Data Understanding

In the Data Understanding phase of CRISP-DM, researchers examine and assess the data quality relevant to the project. Key data sources for supplier classification were identified and consolidated within an ERP system and an Excel spreadsheet. In summary, the data obtained from suppliers were as follows: coding, name, base city, country, group according to the company’s internal classification, evaluation tool, status (approved or blocked), qualification date, certification expiration date, periodicity, advance prediction of requalification, and final validity of the qualification. Regarding audits and non-conformities, the data obtained were as follows: supplier, supplier code, number of product non-conformities, number of non-conformities in the audit, and classification of non-conformities. Regarding purchases from these suppliers, the data obtained were as follows: material, purchasing document reference, type of purchasing document, brief text, item, group of buyers, document date, supplier, plant, warehouse, order quantity to be supplied, currency, expected quantity, net order value, quantity in stock, and tracking number.
Initially, the collected data was compiled and analyzed. The data generally concerns involvement of in-person or remote audits, cost and time involved with qualification and requalification, location of the supplier, group according to classification defined by the company, quality system certifications that the supplier has, quantity of non- product conformities, quantity and value of purchases over a period of one year, and other information considered relevant to this research.
At this stage, the four steps detailed below were completed:
  • Reevaluate data collection: The data was initially checked and found to be sufficient for the planned analyses.
  • Describe the data: Subsequently, the data were superficially examined. Formats were standardized, cells were formatted, and outliers and empty cells were detected. At this stage, any columns of duplicate and/or unnecessary information were also evaluated, such as anticipated requalification forecast, type of purchasing document, brief text, item, group of buyers, center, warehouse, quantity in stock, and tracking number. Adjustments were made so that we could move on to the next phase.
  • Explore the data: At this stage, the data was examined more deeply. A “flat table” was generated with the available data and graphs. Through this flat table, an assessment of the relationship between the data and a descriptive analysis of them were made.
  • Check the quality of the data: Finally, after the above phases, it was seen that there are no adjustments to be made and that the quality of the data meets the needs of the project. For confirmation, there was also interaction with experts to ensure an accurate interpretation of the data and the identification of significant variables.
The output of this step was an in-depth understanding of the dataset, setting the stage for subsequent steps such as Data Preparation and the selection of appropriate modeling techniques for the decision support system in question.

3.3. Data Preparation

The third step—Data Preparation—in CRISP-DM (often called “data munging”) guarantees data quality and relevance for the other steps. In this moment, we carried out data cleaning, missing values treatment, normalization, and transformation of variables. This stage includes five steps:
  • Select data: The dataset used was selected, which consisted of around 560 suppliers.
  • Clean data: Cleaning was carried out, and, in the end, 64 suppliers were maintained for the application of the model. The cleaning excluded suppliers classified as blocked and those that did not have some information considered mandatory for this research, such as the location of the supplier base. In addition, the information (columns) to be worked on are as follows: supplier code, name, base city, country, group according to the company’s internal classification, evaluation tool, status (approved or blocked), qualification date, expiration date of certifications, periodicity, final validity of qualification, number of product non-conformities, number of non-conformities in audit, classification of non-conformities, material, purchasing document reference, document date, order quantity to be supplied, currency, expected quantity, and net order value. The other columns were not considered for this research, as they do not contain relevant information.
  • Build data: The need to build new data was not identified.
  • Integrate data: A “flat table” was generated with the data to integrate all databases, originating from the ERP system and Excel spreadsheets.
  • Formatting data: Finally, the data was formatted again, with the standardization completed, which includes converting text to numbers.

3.4. Modeling

The Modeling phase is the central point of CRISP-DM, in which machine learning techniques are applied to build a model capable of classifying suppliers effectively. At this stage, the data was loaded into R-Studio software. Here, the data had to be normalized using the Gower coefficient. As a popular method for mixed types of data, as is the case in this research, it is a method that allows the simultaneous analysis of quantitative and qualitative data. It was created by Gower in 1971 and compares two datasets using continuous and discrete distributions.
This stage can be divided into four steps:
  • Model selection: Four algorithms (K-Means, Hierarchical K-Means, AGNES (Agglomerative Nesting), and Fuzzy Clustering) were selected to compose the model. Ref. [61] also used the K-Means and Hierarchical K-Means algorithms to support the demand management system and concluded that, with the proposed grouping method, different types of household appliances can be classified, selecting the appropriate characteristics for the proposed purpose. Ref. [62] used the combination of the AGNES algorithm with another and observed that a good performance was obtained for segmenting customers. It can then be seen that the work, when applying the algorithms chosen here, had good results.
  • Generate the test plan: The data was separated for training, testing, and validation. For training, 20% of the data were considered, and 100% of the available data were tested. The four algorithms were run with this division.
  • Build the model: The clustering model has been built. This phase involved choosing, implementing, and adjusting the algorithm to meet the specific objectives of the project. It followed the flowchart in Figure 6:
  • The execution of each of the phases is detailed below:
    • Algorithm Selection: Based on the nature of the data and the objectives of the project, as already mentioned, four algorithms were chosen: K-Means, Hierarchical K-Means, AGNES (Agglomerative Nesting), and Fuzzy Clustering.
    • Model Implementation: The following libraries were used to implement the model:
      K-Means algorithm: R-Studio base library, using the kmeans() function directly;
      Hierarchical K-Means algorithm: The hclust() and cutree() functions were used, included in the R-Studio standard library;
      AGNES: The cluster library was used;
      Fuzzy Clustering: The fclust library was used.
    • Data Normalization/Standardization: Data was normalized to ensure that all variables contribute equally to the formation of clusters.
    • Parameter Adjustment: The parameters related to the number of clusters were adjusted when the K-Means algorithm was tested.
    • Model Validation: The model was evaluated using specific metrics for clustering: Silhouette, Connectivity, and Dunn indices, in addition to the stability of the algorithms using the Average Proportion of Non-overlap (APN), Average Distance (AD), Average Distance Between Means (ADM), and Figure Of Merit (FOM).
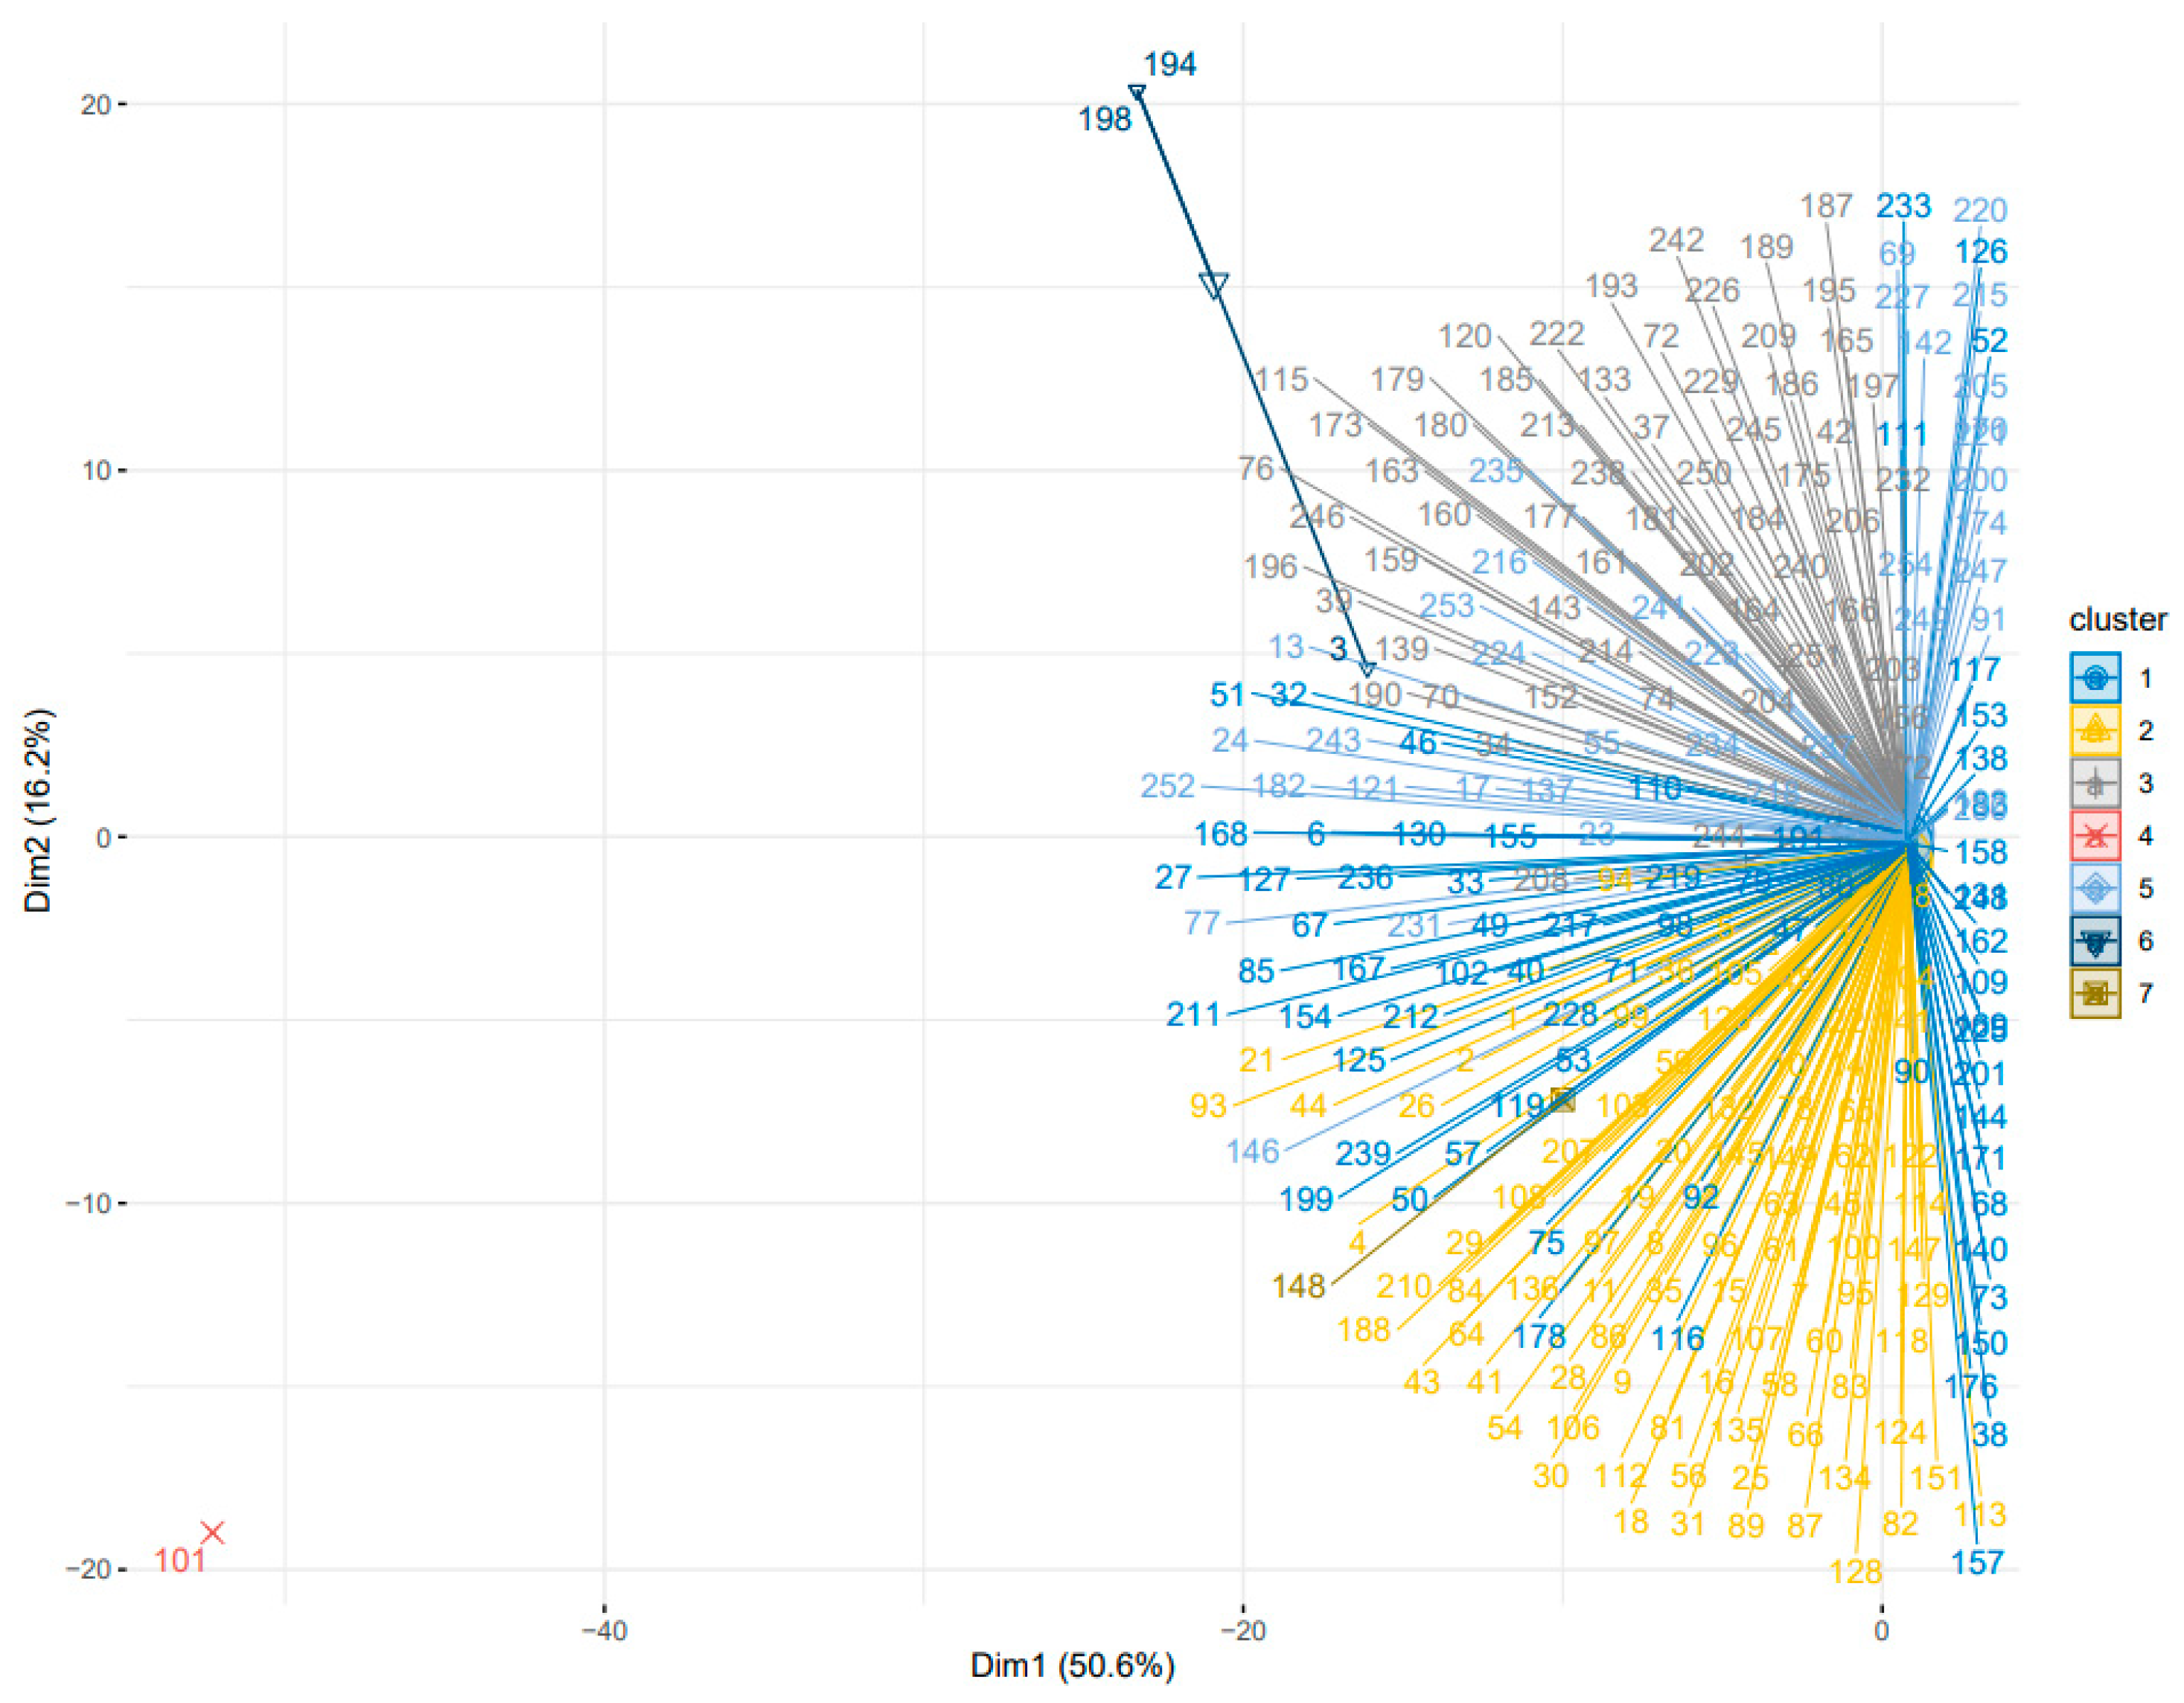
    • Interpretation of Results: Finally, the generated clusters were analyzed, and the results were interpreted. Details will be discussed later.
4.
Evaluate the model: The next step involved analyzing the results of the four models using the algorithms. In this analysis, the stability of the algorithms was validated, using the indicators Average Proportion of Non-overlap (APN), Average Distance (AD), Average Distance Between Means (ADM), and Figure Of Merit (FOM). The comparison between the algorithms was carried out by evaluating the values of such indicators, in addition to additional evaluations by experts so that it was possible to arrive at the model that would best meet the objective of the work: developing a model capable of evaluating and segregating suppliers based on the algorithm clustering system developed with a view to supporting the decision-making process, reducing costs and associated risks, and optimizing resources.
After this, we moved on to the next stage, which is “Evaluation”. This step consists of evaluating whether the model meets the company’s requirements and what the next steps are for implementing the model.

3.5. Evaluation

In the CRISP-DM Evaluation phase, researchers conducted a detailed assessment of the model’s performance. Metrics were not necessary to evaluate effectiveness, as this was addressed through direct input from managers engaged in the supplier grouping process, whose expertise provided context-specific insights and scenario-based evaluations. They assessed the quality of the forecasts and identified any areas for improvement.
During the practical phase of the evaluation, the researchers were faced with the need to adjust the model to optimize its performance. The analysis revealed weaknesses, leading to adjustments in the parameters of the algorithms used. These modifications were fundamental, ensuring that the system could group suppliers accurately and comprehensively.
It was then confirmed that the model meets the criteria established during the Business Understanding phase, and the next step was implementation, which will be described in the next topic. The practical approach adopted in the evaluation highlighted the importance of flexibility and adaptation of the model to the complexities of the business environment, reinforcing the effectiveness of the CRISP-DM methodology in developing practical and efficient solutions.

3.6. Implementation

The final CRISP-DM phase, Deployment, involves integrating the validated model into the organization’s operational environment. The supplier clustering model was implemented in a real-world setting, ensuring seamless interaction with existing processes.
As a support tool, a SOP (Standard Operating Procedure) was created so that it could be used as a guide by users. In addition, training sessions were held, and an instructor was trained to guarantee support to users in case of any needs. A system monitoring and maintenance plan was also mapped out to ensure the system’s performance over time, and in case of any needs, the company’s IT team will be ready to support and act.
As a deliverable, a report was also made detailing all the steps involved in the creation and implementation of the model, following the CRISP-DM methodology. In this, the difficulties of implementing and detailing each stage were also addressed in order to recapitulate these and point out improvements.
The Implementation phase ensured that the benefits of machine learning-based supplier classification were put into practice in the organization’s practical environment.

3.7. Numerical Results and Discussion

In this chapter, the results of the application of the initially proposed machine learning algorithms (K-Means, Hierarchical K-Means, AGNES (Agglomerative Nesting), and Fuzzy) in the segmentation of suppliers in a real case, following the CRISP-DM methodology, will be presented.
With this data in hand and with the support of software that uses an open source statistical programming language, modeling was carried out, and it was then possible to obtain results that led to data analysis, visualization, and statistical modeling. Firstly, the performance of each of the four algorithms was evaluated, using stability validation indices (Average Proportion of Non-overlap (APN), Average Distance (AD), Average Distance Between Means (ADM), and Figure Of Merit (FOM)) (Table 2 and Table 3).
Thorough evaluation of these metrics allowed us to compare the performance of different supplier segmentation algorithms and select the most appropriate one to meet the project objectives. With the above results in hand, the following was observed:
  • Hierarchical K-Means: The hierarchical K-Means approach produced satisfactory results, especially with regard to the APN and ADM indices, which are similar to the best indices returned by the software (value 0). According to the literature, for both indices, the value must be between 0 and 1, and the lower it is, the more consistent the generated cluster is. Furthermore, when comparing these two indices, generated by the Hierarchical K-Means method for the four cluster sizes, it is seen that the value for four clusters is the best.
The AD and FOM indices differ from the best values; however, the best values of these indices, for this method, would be for seven clusters. However, its effectiveness was surpassed by the performance of K-Means, as shown below.
2.
K-Means: This algorithm also showed promising results, with good supplier segmentation. Unlike Hierarchical K-Means, the AD and FOM indices were those that had results equal to the best indices shown by the software used, 215,488.81 and 35,971.72, respectively. Furthermore, according to the literature, for both indices, the value must be between 0 and infinity, and the lower it is, the more consistent the generated cluster is. Furthermore, when comparing these two indices, generated by the K-Means method for the four cluster sizes, it is seen that the value for seven clusters is the best.
The APN and ADM indices differ from the best values; however, the best values of these indices, for this method, would be for six and four clusters, respectively.
This was selected as the most appropriate method for the proposed work, as it presented excellent results for the APN and ADM indices, and also an expert judgment was integrated to ensure that the selected clustering solution was not only statistically sound but also operationally meaningful within the specific supply chain context analyzed. The corresponding two indices were selected for the selection of methods since they have a better ability to measure the quality of separation and consistency between clusters in addition to their effectiveness in dealing with intracluster and intercluster variability, overcoming the limitations of the AD and FOM indices. Although the AD and FOM indices were not classified as the best indices compared to the four tested methods, for the K-Means method, when compared with the Hierarchical K-Means in seven clusters, these two indices were better classified in the K-Means (0.0019 and 7294.7871, respectively).
Additionally, besides the performance of K-Means being superior in two of the four indices, the present paper also used a holistic evaluation, recognizing that no single index universally defines the “best” clustering solution. Different internal validation indices often emphasize different aspects of clustering quality, and their interpretation should be context-dependent.
Furthermore, through the graph generated (Figure 7), we can see a good division of suppliers into four large clusters (1, 2, 3, and 5), in addition to three other clusters (4, 6, and 7) that had the agglomeration of fewer suppliers per cluster, containing suppliers 3, 101, 148, 194, and 198. The latter were allocated to one of the other four clusters.
To simplify the analysis, samples were collected within each of the four large clusters generated, and then the following assessment was made (Table 4).
Suppliers 3, 101, 148, 194, and 198 were reallocated (Table 5) based on the characteristics evaluated for each of the current clusters.
Subjective analysis was carried out by experts in the four clusters and validated that this division was the most beneficial, since the adoption of this supplier segmentation presented substantial improvements that had a significant impact on several aspects of management. In real-world applications, such adjustments are often necessary to align clustering outcomes with strategic business priorities, context-specific knowledge, and operational constraints that may not be fully represented in the available data. The combination of algorithmic clustering with expert judgment reflects a hybrid decision-making approach, which has been widely advocated in the literature to enhance the practical applicability of data-driven models in complex supply chain contexts. In this vein, a 7% reduction in operational costs associated with supplier selection and monitoring was observed. K-Means has demonstrated a remarkable ability to identify complex patterns in the data provided, which has enabled more accurate and efficient supplier segmentation. As a result, companies were able to direct resources more strategically, optimizing investments and reducing waste.
Furthermore, the implementation of K-Means contributed to a significant reduction in the time and effort spent on analyzing and managing suppliers. By automating the segmentation process, the algorithm enabled faster and more accurate decision-making, eliminating the need for time-consuming and error-prone manual analyses. This resulted in a reduction of around 10% in the workload of professionals involved in supplier management, freeing up time and resources for more strategic activities with greater added value.
In addition to the tangible benefits in terms of costs and operational efficiency, the use of K-Means also contributed to mitigating risks and improving the quality of products and services provided. The precise segmentation of suppliers allowed a faster and more effective identification of possible problems or deficiencies, enabling the implementation of corrective measures proactively. This has resulted in a significant reduction in the risks associated with low-quality or unsatisfactory-performing suppliers, protecting the company’s reputation and ensuring operational continuity.
  • Fuzzy Clustering: Although it showed acceptable results, Fuzzy Clustering was unable to outperform K-Means in our experiments, when evaluating the APN, AD, ADM, and FOM indices.
  • AGNES (Agglomerative Nesting): Like Fuzzy Clustering, the AGNES algorithm was unable to outperform K-Means in our experiments, when evaluating the APN, AD, ADM, and FOM indices, despite its simplicity of use.
Therefore, the comparative analysis of the results revealed that K-Means stood out as the most effective algorithm for segmenting suppliers in this study. Its ability to handle complex datasets makes it a preferred choice for managers who want to assess the quality of their suppliers. The evaluation obtained through the indices generated by the software, combined with the experts’ evaluation, showed that the classification obtained is valuable and reliable.

4. Conclusions

This study presented a machine learning application with the purpose of clustering suppliers of a real company and aimed to build a model capable of segmenting suppliers and supporting the business decision-making process. To this end, the CRISP-DM methodology was used.
In the CRISP-DM Modeling phase, applied in this research to improve supply chain management through supplier clustering, detailed analyses, and the construction of robust models were carried out. Using advanced clustering algorithms (K-Means, Hierarchical K-Means, AGNES (Agglomerative Nesting), and Fuzzy Clustering), efficient groupings of suppliers with similar characteristics were identified. The modeling results revealed distinct patterns of behavior and performance among suppliers, enabling a more strategic approach to supply chain consolidation. Furthermore, the application of CRISP-DM in the Modeling phase provided valuable insights for the careful selection of variables and parameters, ensuring the robustness and generalization of the developed models.
In the CRISP-DM Evaluation phase, the clustering models developed were subjected to rigorous analysis to assess their effectiveness and practical relevance. Using specific performance metrics, such as the Average Proportion of Non-overlap (APN), Average Distance (AD), Average Distance Between Means (ADM), and Figure Of Merit (FOM), it was possible to quantify the quality of the clusters and identify possible adjustments. Of the four algorithms, K-Means was identified as the most beneficial for the intended objectives, as it presented the best rates compared to the others tested. Cross-validation and comparison with traditional supplier management methods contributed to the robustness and reliability of the results obtained. The Assessment phase, therefore, played a crucial role in selecting the most suitable models and ensuring that the benefits of clustering were substantially superior to conventional methods.
In the Implementation phase, the insights generated by the models were translated into tangible actions to improve supply chain management. Strategies derived from the clusters were implemented, including supplier consolidation. Internal processes were adjusted to accommodate the changes recommended by the models, and stakeholders were involved to ensure the correct transition. The CRISP-DM Implementation phase was, therefore, fundamental in transforming the modeling results into practical and measurable improvements in supply chain management.
With this, the model, based on the CRISP-DM methodology, proved capable of segmenting suppliers and supporting the management decision-making process, since, in general, companies have a large number and making decisions about each one of them proves to be costly or even unfeasible.
When comparing the results before and after the application of clustering in the selection and management of suppliers, notable improvements in the process were observed:
  • The results obtained in this research reveal significant improvements related to costs when implementing the supplier clustering strategy. A reduction of around 7% in the costs involved with initial qualifications and requalification was estimated, especially those involving international suppliers. Furthermore, qualifications and requalification considered not relevant could be canceled, positively impacting the saving of financial resources. The detailed analysis demonstrates a substantial reduction in operational expenses, resulting in an efficient optimization of financial resources. Furthermore, the consolidation of suppliers also showed positive impacts on purchasing, as it provided better price negotiations and contractual conditions. Additionally, the simplification of the supply chain resulted in logistical efficiencies, reducing costs associated with transportation and storage. These results suggest that supplier clustering not only promotes tangible savings but also represents an effective strategic approach for efficient cost management in the business context.
  • In terms of time, the implementation of supplier clustering revealed significant improvements in operational efficiency. The consolidation resulted in simplified processes, reducing the time involved in external missions for audits, face-to-face meetings, and activity setup in preparation for travel. This temporal optimization not only increased the company’s responsiveness but also allowed for better allocation of human resources in the supplier management process.
  • With regard to risk management, supplier clustering stood out as an effective approach in mitigating potential threats to the supply chain. Consolidation allowed greater visibility and control over risks, identifying areas of vulnerability and implementing preventive measures. Supplier diversification was replaced by a more focused and strategic approach, reducing exposure to risks. Ultimately, this approach has proven to be a solid foundation for operational sustainability in the face of challenges and uncertainty.
  • Regarding supplier performance, the results indicate substantial gains in the overall performance of the supply chain. Clustering allowed for better quality management, with suppliers more aligned with established standards. This resulted in more reliable products and services, meeting customer expectations. Performance analysis shows a notable increase in customer satisfaction, demonstrating the positive impact of this strategy on operational excellence.
As for the supplier management process in general, it can be conducted more assertively using a model that relies on technology, with no or fewer human biases.
In short, this study is beneficial, as it brings to light issues not yet addressed together and outlines important topics that managers can use to make decisions in supplier management in a more assertive way, with no or less human biases and with optimized targeting of resources, including cost, time, and risk analysis, becoming a facilitator of a company’s strategic processes. The academic contribution of this article is significant, providing insights into the application of different machine learning algorithms in supplier segmentation in an industrial context. Furthermore, it highlights the effectiveness of the K-Means algorithm compared to other widely used techniques, providing a solid basis for future research in this area, and shows that this combination of topics is seldom covered.
It is important to recognize some limitations of this study, such as the dependence of the results on specific datasets and algorithm configurations. Furthermore, future research can explore other segmentation algorithms and consider including more variables for a more comprehensive analysis. Also, to continue this research, the authors suggest that future investigations examine and indicate a tool aligned with the Analytical Hierarchical Process (AHP), which can also be used to detect clusters of suppliers in order to assist decision-making processes. Finally, further investigation into parameter optimization (e.g., distance metrics, linkage methods) or the application of alternative clustering algorithms (e.g., DBSCAN, spectral clustering) could potentially improve the model’s discriminative capacity.
Finally, the innovation of this work lies in the unique fusion between supplier clustering, the use of CRISP-DM as a methodological framework, and the lack of previous references that comprehensively address this interconnection. This study fills a gap in knowledge, presenting a novel approach to improving supplier management, standing out as a significant advance in the field of supply chain management. The absence of previous work that explores this specific link highlights the originality of this work, consolidating its innovative contribution to academia and business practice.

Author Contributions

A.C.A.F., M.B.F. and G.A.V.B.V. contributed to the conceptualization, formal analysis, investigation, methodology, visualization, and writing. L.A.d.S.J. and A.F.d.P. helped with data curation. A.F.d.P. and M.B.F. helped with funding acquisition, project administration, resources, and validation, and supervised the complete work. A.C.A.F., M.B.F., G.A.V.B.V., L.A.d.S.J. and A.F.d.P. contributed to the final version of the manuscript. All authors have read and agreed to the published version of the manuscript.

Funding

The authors would like to acknowledge the financial support from UNIFEI—Federal University of Itajubá.

Data Availability Statement

The data that support the findings of this study are available from the corresponding author upon reasonable request.

Conflicts of Interest

The authors declare that they have no conflicts of interest.

References

  1. Villegas-Ch, W.; Navarro, A.M.; Sanchez-Viteri, S. Optimization of inventory management through computer vision and machine learning technologies. Intell. Syst. Appl. 2024, 24, 200438. [Google Scholar] [CrossRef]
  2. Gámez-Albán, H.M.; Guisson, R.; De Meyer, A. Optimizing the organization of the first mile in agri-food supply chains with a heterogeneous fleet using a mixed-integer linear model. Intell. Syst. Appl. 2024, 23, 200426. [Google Scholar] [CrossRef]
  3. Brandenburg, M.; Gruchmann, T.; Oelze, N. Sustainable Supply Chain Management—A Conceptual Framework and Future Research Perspectives. Sustainability 2019, 11, 7239. [Google Scholar] [CrossRef]
  4. Liu, W.; Liu, Y.; Lee, P.T.-W.; Yuan, C.; Long, S.; Cheng, Y. Effects of supply chain innovation and application policy on firm performance: Evidence from China. Prod. Plan. Control. 2024, 1–13. [Google Scholar] [CrossRef]
  5. Deepu, T.S.; Ravi, V. A conceptual framework for supply chain digitalization using integrated systems model approach and DIKW hierarchy. Intell. Syst. Appl. 2021, 10–11, 200048. [Google Scholar] [CrossRef]
  6. Cui, L.; Wu, H.; Dai, J. Modelling flexible decisions about sustainable supplier selection in multitier sustainable supply chain management. Int. J. Prod. Res. 2021, 61, 4603–4624. [Google Scholar] [CrossRef]
  7. Ali, N.; Ghazal, T.M.; Ahmed, A.; Abbas, S.; Alzoubi, H.M.; Farooq, U.; Ahmad, M.; Khan, M.A. Fusion-Based Supply Chain Collaboration Using Machine Learning Techniques. Intell. Autom. Soft Comput. 2022, 31, 1671–1687. [Google Scholar] [CrossRef]
  8. Goodarzian, F.; Ghasemi, P.; Appolloni, A.; Ali, I.; Cárdenas-Barrón, L.E. Supply chain network design based on Big Data Analytics: Heuristic-simulation method in a pharmaceutical case study. Prod. Plan. Control 2024, 1–21. [Google Scholar] [CrossRef]
  9. Toorajipour, R.; Sohrabpour, V.; Nazarpour, A.; Oghazi, P.; Fischl, M. Artificial intelligence in supply chain management: A systematic literature review. J. Bus. Res. 2021, 122, 502–517. [Google Scholar] [CrossRef]
  10. Helo, P.; Hao, Y. Artificial intelligence in operations management and supply chain management: An exploratory case study. Prod. Plan. Control 2021, 33, 1573–1590. [Google Scholar] [CrossRef]
  11. Richey, R.G.; Chowdhury, S.; Davis-Sramek, B.; Giannakis, M.; Dwivedi, Y.K. Artificial intelligence in logistics and supply chain management: A primer and roadmap for research. J. Bus. Logist. 2023, 44, 532–549. [Google Scholar] [CrossRef]
  12. Suraraksa, J.; Shin, K.S. Comparative Analysis of Factors for Supplier Selection and Monitoring: The Case of the Automotive Industry in Thailand. Sustainability 2019, 11, 981. [Google Scholar] [CrossRef]
  13. Rahman, A.U.; Saeed, M.; Mohammed, M.A.; Majumdar, A.; Thinnukool, O. Supplier Selection through Multicriteria Decision-Making Algorithmic Approach Based on Rough Approximation of Fuzzy Hypersoft Sets for Construction Project. Buildings 2022, 12, 940. [Google Scholar] [CrossRef]
  14. Cavalcante, I.M.; Frazzon, E.M.; Forcellini, F.A.; Ivanov, D. A supervised machine learning approach to data-driven simulation of resilient supplier selection in digital manufacturing. Int. J. Inf. Manag. 2019, 49, 86–97. [Google Scholar] [CrossRef]
  15. Amiri, M.; Hashemi-Tabatabaei, M.; Ghahremanloo, M.; Keshavarz-Ghorabaee, M.; Zavadskas, E.K.; Banaitis, A. A new fuzzy BWM approach for evaluating and selecting a sustainable supplier in supply chain management. Int. J. Sustain. Dev. World Ecol. 2020, 28, 125–142. [Google Scholar] [CrossRef]
  16. Schmitt, M. Automated machine learning: AI-driven decision making in business analytics. Intell. Syst. Appl. 2023, 18, 200188. [Google Scholar] [CrossRef]
  17. Barrera, F.; Segura, M.; Maroto, C. Multicriteria sorting method based on global and local search for supplier segmentation. Int. Trans. Oper. Res. 2023, 31, 3108–3134. [Google Scholar] [CrossRef]
  18. Luan, J.; Yao, Z.; Zhao, F.; Song, X. A novel method to solve supplier selection problem: Hybrid algorithm of genetic algorithm and ant colony optimization. Math. Comput. Simul. 2019, 156, 294–309. [Google Scholar] [CrossRef]
  19. Bahadori, M.; Hosseini, S.M.; Teymourzadeh, E.; Ravangard, R.; Raadabadi, M.; Alimohammadzadeh, K. A supplier selection model for hospitals using a combination of artificial neural network and fuzzy VIKOR. Int. J. Heal. Manag. 2017, 13, 286–294. [Google Scholar] [CrossRef]
  20. Islam, S.; Amin, S.H.; Wardley, L.J. Machine learning and optimization models for supplier selection and order allocation planning. Int. J. Prod. Econ. 2021, 242, 108315. [Google Scholar] [CrossRef]
  21. Resende, C.H.; Geraldes, C.A.; Lima, F.R. Decision Models for Supplier Selection in Industry 4.0 Era: A Systematic Literature Review. Procedia Manuf. 2021, 55, 492–499. [Google Scholar] [CrossRef]
  22. Alavi, B.; Tavana, M.; Mina, H. A Dynamic Decision Support System for Sustainable Supplier Selection in Circular Economy. Sustain. Prod. Consum. 2021, 27, 905–920. [Google Scholar] [CrossRef]
  23. Lin, H.; Lin, J.; Wang, F. An innovative machine learning model for supply chain management. J. Innov. Knowl. 2022, 7, 100276. [Google Scholar] [CrossRef]
  24. Krieger, F.; Drews, P.; Funk, B. Automated invoice processing: Machine learning-based information extraction for long tail suppliers. Intell. Syst. Appl. 2023, 20, 200285. [Google Scholar] [CrossRef]
  25. Awaliyah, D.A.; Prasetyio, B.; Muzayanah, R.; Lestari, A.D. Optimizing Customer Segmentation in Online Retail Transactions through the Implementation of the K-Means Clustering Algorithm. Sci. J. Inform. 2024, 11, 539–548. [Google Scholar] [CrossRef]
  26. Yu, M.; Principato, L.; Formentini, M.; Mattia, G.; Cicatiello, C.; Capoccia, L.; Secondi, L. Unlocking the potential of surplus food: A blockchain approach to enhance equitable distribution and address food insecurity in Italy. Socio-Econ. Plan. Sci. 2024, 93, 101868. [Google Scholar] [CrossRef]
  27. Husna, A.U.; Ghasempoor, A.; Amin, S.H. A proposed framework for supplier selection and order allocation using machine learning clustering and optimization techniques. J. Data Inf. Manag. 2024, 6, 235–254. [Google Scholar] [CrossRef]
  28. Trianasari, N.; Permadi, T.A. Analysis of Product Recommendation Models at Each Fixed Broadband Sales Location Using K-Means, DBSCAN, Hierarchical Clustering, SVM, RF, and ANN. J. Appl. Data Sci. 2024, 5, 636–652. [Google Scholar] [CrossRef]
  29. Nhu, N.V.Q.; Van Hop, N. New fuzzy subtractive clustering approach: An application of order allocation in e-supply chain system. Int. J. Logist. Syst. Manag. 2024, 48, 279–295. [Google Scholar] [CrossRef]
  30. Rahiminia, M.; Razmi, J.; Farahani, S.S.; Sabbaghnia, A. Cluster-based supplier segmentation: A sustainable data-driven approach. Mod. Supply Chain Res. Appl. 2023, 5, 209–228. [Google Scholar] [CrossRef]
  31. Kamran, M.A.; Kia, R.; Goodarzian, F.; Ghasemi, P. A new vaccine supply chain network under COVID-19 conditions considering system dynamic: Artificial intelligence algorithms. Socio-Econ. Plan. Sci. 2022, 85, 101378. [Google Scholar] [CrossRef] [PubMed]
  32. Anand, M.C.J.; Kalaiarasi, K.; Martin, N.; Ranjitha, B.; Priyadharshini, S.S.; Tiwari, M. Fuzzy C-Means Clustering with MAIRCA -MCDM Method in Classifying Feasible Logistic Suppliers of Electrical Products. In Proceedings of the 2023 First International Conference on Cyber Physical Systems, Power Electronics and Electric Vehicles (ICPEEV), Hyderabad, India, 28–30 September 2023. [Google Scholar]
  33. Guan, Y.; Huang, Y.; Qin, H. Inventory Management Optimization of Green Supply Chain Using IPSO-BPNN Algorithm under the Artificial Intelligence. Wirel. Commun. Mob. Comput. 2022, 2022, 8428964. [Google Scholar] [CrossRef]
  34. Huang, W.; Ding, C.; Wang, S.; Hu, S. An efficient cluster mining algorithm for the internal motion target path based on the enhanced AGNES. In Proceedings of the 2015 Trustcom/BigDataSE/ISPA, Helsinki, Finland, 20–22 August 2015. [Google Scholar]
  35. Xu, B.; Choo, K.K.R.; Wang, J. Clustering and classification for graph data: A survey. ACM Comput. Surv. (CSUR) 2019, 52. [Google Scholar]
  36. Yuan, C.; Yang, H. Research on K-Value Selection Method of K-Means Clustering Algorithm. J. Multidiscip. Sci. J. 2019, 2, 226–235. [Google Scholar] [CrossRef]
  37. Ravindra, R.; Rathod, R.D.G. Design of electricity tariff plans using gap statistic for K-Means clustering based on consumers monthly electricity consumption data. Int. J. Energy Sect. Manag. 2017, 2, 295–310. [Google Scholar]
  38. Tibshirani, R.; Walther, G.; Hastie, T. Estimating the number of clusters in a data set via the gap statistic. J. R. Stat. Soc. Ser. B 2001, 63, 411–423. [Google Scholar] [CrossRef]
  39. Xiao, Y.; Yu, J. Gap statistic and K-Means algorithm. J. Comput. Res. Dev. 2007, 44, 176–180. [Google Scholar]
  40. Kaufman, I.; Rousseeuw, P.J. Finding Groups in Data: An Introduction to Cluster Analysis; John Wiley & Sons: Hoboken, NJ, USA, 1990. [Google Scholar]
  41. Waggoner, P.D. Unsupervised Machine Learning for Clustering in Political and Social Research; Cambridge University Press: Cambridge, UK, 2020. [Google Scholar]
  42. Géron, A. Hands-On Machine Learning with Scikit-Learn, Keras, and TensorFlow: Concepts, Tools, and Techniques to Build Intelligent Systems, 2nd ed.; O’Reilly: Sebastopol, CA, USA, 2019. [Google Scholar]
  43. Hu, H.; Liu, J.; Zhang, X.; Fang, M. An Effective and Adaptable K-means Algorithm for Big Data Cluster Analysis. Pattern Recognit. 2023, 139, 109404. [Google Scholar] [CrossRef]
  44. Nwanganga, F.; Chapple, M. Practical Machine Learning in R; Wiley: Hoboken, NJ, USA, 2020. [Google Scholar]
  45. Yuan, G.; Sun, P.; Zhao, J.; Li, D.; Wang, C. A review of moving object trajectory clustering algorithms. Artif. Intell. Rev. 2016, 47, 123–144. [Google Scholar] [CrossRef]
  46. Ramadan, H.S.; El Bahnasy, K. A Review of Clustering Algorithms for Determination of Cancer Signatures. Int. J. Intell. Comput. Inf. Sci. 2022, 22, 138–151. [Google Scholar] [CrossRef]
  47. Sano, A.V.D.; Imanuel, T.D.; Calista, M.I.; Nindito, H.; Condrobimo, A.R. The Application of AGNES Algorithm to Optimize Knowledge Base for Tourism Chatbot. In Proceedings of the 2018 International Conference on Information Management and Technology (ICIMTech), Jakarta, Indonesia, 3–5 September 2018. [Google Scholar]
  48. Chen, Y.-T.; Jhang, Y.-C.; Liang, R.-H. A fuzzy-logic based auto-scaling variable step-size MPPT method for PV systems. Sol. Energy 2016, 126, 53–63. [Google Scholar] [CrossRef]
  49. Danandeh, M.A. A new architecture of INC-fuzzy hybrid method for tracking maximum power point in PV cells. Sol. Energy 2018, 171, 692–703. [Google Scholar] [CrossRef]
  50. Yaïci, W.; Entchev, E. Adaptive Neuro-Fuzzy Inference System modelling for performance prediction of solar thermal energy system. Renew. Energy 2016, 86, 302–315. [Google Scholar] [CrossRef]
  51. Liu, Y.; Eckert, C.M.; Earl, C. A review of fuzzy AHP methods for decision-making with subjective judgements. Expert Syst. Appl. 2020, 161, 113738. [Google Scholar] [CrossRef]
  52. Wang, H.-Y.; Wang, J.-S.; Wang, G. A survey of fuzzy clustering validity evaluation methods. Inf. Sci. 2022, 618, 270–297. [Google Scholar] [CrossRef]
  53. Li, X.; Wen, H.; Hu, Y.; Jiang, L. A novel beta parameter based fuzzy-logic controller for photovoltaic MPPT application. Renew. Energy 2019, 130, 416–427. [Google Scholar] [CrossRef]
  54. Gupta, A.; Chauhan, Y.K.; Pachauri, R.K. A comparative investigation of maximum power point tracking methods for solar PV system. Sol. Energy 2016, 136, 236–253. [Google Scholar] [CrossRef]
  55. Askari, S. Fuzzy C-Means clustering algorithm for data with unequal cluster sizes and contaminated with noise and outliers: Review and development. Expert Syst. Appl. 2021, 165, 113856. [Google Scholar] [CrossRef]
  56. Küçükdeniz, T.; Erkal Sönmez, Ö. Integrated Warehouse Layout Planning with Fuzzy C-Means Clustering. In International Conference on Intelligent and Fuzzy Systems; Springer International Publishing: Cham, Switzerland, 2022. [Google Scholar]
  57. Brock, G.; Pihur, V.; Datta, S.; Datta, S. clValid: An R package for cluster validation. J. Stat. Softw. 2008, 25, 1–22. [Google Scholar] [CrossRef]
  58. Schröer, C.; Kruse, F.; Gómez, J.M. A Systematic Literature Review on Applying CRISP-DM Process Model. Procedia Comput. Sci. 2021, 181, 526–534. [Google Scholar] [CrossRef]
  59. Matshabaphala, N.S. Implementation of Clustering Techniques for Segmentation of Mozambican Cassava Suppliers. Ph.D. Dissertation, Stellenbosch University, Stellenbosch, South Africa, 2021. [Google Scholar]
  60. Purnamasari, D.I.; Permadi, V.A.; Saepudin, A.; Agusdin, R.P. Demand Forecasting for Improved Inventory Management in Small and Medium-Sized Businesses. J. Nas. Pendidik. Tek. Inform. 2023, 12, 56–66. [Google Scholar] [CrossRef]
  61. Simsar, S.; Alborzi, M.; Ghatari, A.R.; Varjani, A. Residential Appliance Clustering Based on Their Inherent Characteristics for Optimal Use Based K-Means and Hierarchical Clustering Method. J. Optim. Ind. Eng. 2023, 16, 119–127. [Google Scholar]
  62. Sun, Z.-H.; Zuo, T.-Y.; Liang, D.; Ming, X.; Chen, Z.; Qiu, S. GPHC: A heuristic clustering method to customer segmentation. Appl. Soft Comput. 2021, 111, 107677. [Google Scholar] [CrossRef]
Figure 1. K-Means illustration.
Computers 14 00271 g001
Figure 2. Hierarchical K-Means illustration.
Computers 14 00271 g002
Figure 3. AGNES illustration.
Computers 14 00271 g003
Figure 4. Various membership functions in Fuzzy modular.
Computers 14 00271 g004
Figure 5. CRISP-DM methodology. Source: The author.
Computers 14 00271 g005
Figure 6. Clustering model.
Computers 14 00271 g006
Figure 7. K-Means with seven clusters.
Computers 14 00271 g007
Table 1. Papers that study AI algorithms.
AuthorsClustering AlgorithmPaper Objective
[25]K-MeansThe main objective of this research is to optimize the use of customer segmentation using the Recency, Frequency, and Monetary (RFM) approach.
[26]AGNESTo identify factors that determine the volume and economic value of surplus food redistribution.
[27]K-Means Clustering, Gaussian Mixture Model, and Balance Iterative Reducing and Clustering using HierarchiesThis research proposes a new framework to address the challenges of supplier selection and order allocation (SS&OA) by introducing a two-phase combined approach.
[28]K-Means, DBSCAN, Hierarchical Clustering, SVM, RF, AND, and ANNThis research aims to develop an optimal product recommendation model for each sales location, using machine learning with a mixed method approach, with a combination method of clustering and classification, where the clustering method is used for the geographic segmentation stage.
[29]K-MeansThis study proposes a so-called new Fuzzy subtractive clustering (NFSC) algorithm to allocate orders to the appropriate hub with three criteria, namely, traveling distance, delivery time, and order quantity.
[30]K-MeansThis study aims to develop a clustering-based approach to sustainable supplier segmentation.
[31]Variable Neighborhood Search (VNS) and Whale Optimization Algorithm (WOA)A new stochastic multi-objective, multi-period, and multi-commodity simulation-optimization model has been developed for the COVID-19 vaccine’s production, distribution, location, allocation, and inventory control decisions.
[32]Fuzzy C-Means Clustering (FCM)The model uses a machine learning algorithm to classify the logistics suppliers of electrical products based on their feasibility in the first phase.
[33,34]Particle Swarm Optimization (PSO)The objective is to reduce the waste of resources in supply chain inventory management and provide better services for green supply chain management.
[4]Artificial Neural Network, Genetic Algorithm, and Particle Swarm AlgorithmThis article used three artificial intelligence (AI) algorithms to analyze the risk of financial services in the international trade supply chain of the energy industry.
Table 2. Validation indices.
Clustering MethodsValidation MeasuresCluster Size
4567
Hierarchical K-MeansAPN0.00000.00020.00090.0021
AD315,138.3323285,425.0805263,134.6146238,478.4101
ADM0.00001309.59453500.63369981.5808
FOM48,853.599045,858.793544,964.896244,249.6444
K-MeansAPN0.00070.00140.00060.0019
AD270,055.9391248,376.7107225,484.0109215,488.8132
ADM3268.68806109.70563805.21177294.7871
FOM47,206.338744,874.796838,584.458235,971.7238
FuzzyAPN0.04470.0562N/A0.0974
AD537,393.0755522,189.0211N/A444,587.5577
ADM24,766.707535,004.1902N/A33,169.3428
FOM213,731.6898213,223.0471N/A201,439.7572
AGNESAPN0.00000.00020.00090.0021
AD315,138.3323285,425.0805263,134.6146238,478.4101
ADM0.00001309.59453500.63369981.5808
FOM48,853.599045,858.793544,964.896244,249.6444
Table 3. Optimal scores.
Optimal Scores
Validation MeasuresScoreMethodCluster
APN0Hierarchical K-Means4
AD214,588.81K-Means7
ADM0Hierarchical K-Means4
FOM35,971.72K-Means7
Table 4. Cluster analysis.
ClusterSupplier CodeAnalysis
5220Suppliers may require auditing, are located in American countries, have a low rate of product non-conformities, have a low associated purchase value, are classified as medium risk for the company
69
227
215
142
1168Suppliers that do not require auditing, are located in countries in America and Europe, have a low rate of product non-conformities, have a high associated purchasing value, are classified as medium/high risk for the company
6
130
155
211
293Suppliers that do not require auditing, are located in countries in America and Europe, have a high rate of product non-conformities, have an average associated purchase value, are classified as low risk for the company
21
44
26
2
3242Suppliers may require auditing, are located in American countries, have a high rate of product non-conformities, have a high associated purchasing value, are classified as medium risk for the company
193
222
139
76
Table 5. Relocation of suppliers in clusters.
SupplierPrevious Cluster Current Cluster
363
10143
14873
19461
19863
Disclaimer/Publisher’s Note: The statements, opinions and data contained in all publications are solely those of the individual author(s) and contributor(s) and not of MDPI and/or the editor(s). MDPI and/or the editor(s) disclaim responsibility for any injury to people or property resulting from any ideas, methods, instructions or products referred to in the content.

