Abstract
Large-scale scene rendering faces challenges in managing massive scene data and mitigating rendering latency caused by suboptimal loading sequences. Although current approaches utilize Level of Detail (LOD) for dynamic resource loading, two limitations remain. One is loading priority, which does not adequately consider the factors affecting visual effects such as LOD selection and visible area. The other is the insufficient trade-off between rendering quality and loading latency. To this end, we propose a loading prioritization metric called Vision Degree (VD), derived from LOD selection, loading time, and the trade-off between rendering quality and loading latency. During rendering, VDs are sorted in descending order to achieve an optimized loading and unloading sequence. At the same time, a compensation factor is proposed to further compensate for the visual loss caused by the reduced LOD level and to optimize the rendering effect. Finally, we optimize the initial viewpoint selection by minimizing the average model-to-viewpoint distance, thereby reducing the initial scene loading time. Experimental results demonstrate that our method reduces the rendering latency by 24–29% compared with the existing Area-of-Interest (AOI)-based loading strategy, while maintaining comparable visual quality.
1. Introduction
The rapid development of the metaverse and Smart City infrastructures has led to exponential growth in the demand for large-scale scene rendering. Nevertheless, the inherent limitations of hardware resources—particularly memory constraints—pose significant challenges, leading to reduced data processing efficiency and compromised rendering smoothness [1,2,3]. Currently, the solutions addressing these challenges rely on LOD and AOI-based dynamic loading strategies [4,5,6,7]. AOI is defined as a dynamically bounded spatial domain where computational resources are preferentially allocated based on viewport relevance. Loading strategies primarily consist of two categories: spatial partitioning-based approaches and semantic-driven approaches. The former typically employs AOI as the spatial demarcation criterion, confining scene tile loading to geometrically defined boundaries (e.g., circular or sector regions) around viewpoints; the latter employs semantic-augmented AOI partitioning integrated with object detection algorithms to identify key objects bearing high-priority semantic labels for optimized loading sequencing. However, existing prioritization schemes inadequately incorporate visual saliency factors, resulting in a compromised trade-off between quality and efficiency during large-scale scene rendering.
To address the trade-off between rendering quality and loading latency in large-scale scene rendering, this study proposes a loading priority metric called VD, which achieves adaptive data reduction and loading sequence optimization through a dual optimization mechanism. Within real-time rendering frameworks, VD incorporates a compensation factor to mitigate visual degradation caused by data reduction. Furthermore, we design an optimized initial viewpoint selection algorithm that minimizes initial loading latency using average model-to-viewpoint distances as the spatial relevance criteria. The experimental results demonstrate that the proposed method not only enhances scene loading smoothness, but also achieves an average improvement of 10 FPS in real-time frame rates compared to existing AOI-based approaches.
2. Related Works
2.1. Traditional LOD-Based Approaches
The core principle of LOD algorithms involves determining the Level of Detail for object rendering based on the spatial positions and the importance of model nodes within the scene. This approach reduces the detail level of non-critical objects, thereby conserving computational resources. Since the 21st century, with the rapid advancement of GPU technology, increasing research efforts have integrated LOD with GPU–CPU heterogeneous architectures, building upon the framework proposed by Asirvatham et al. [8], to achieve rapid simplification of large-scale scenes. In 2018, Lucas et al. [9] proposed a novel GPU architecture technique named visibility rendering order (VRO). For BIM models, Zhang et al. [10] developed a digital twin-based framework that extended existing LOD definitions of Building Information Models (BIMs). Sun et al. [11] introduced a redundancy removal method combining Principal Component Analysis (PCA) and Hausdorff-based comparison algorithms to identify standardized steel structure components, and proposed a Web3D lightweight visualization approach for redundant instances. Additionally, they established an LOD model loading mechanism based on mesh simplification algorithms to enhance the rendering efficiency.
2.2. Spatial Partitioning-Based Approaches
These methods typically establish resource loading priorities by evaluating spatial correlations (e.g., distance and visibility) between AOI sub-regions and the view frustum. Jia et al. [12] extended the traditional AOI to a Multi-Layered and Incrementally Scalable Sector of Interest (MISSOI), enabling efficient P2P transmission. However, its MISSOI partitioning algorithm needs to partition 2n layers of MISSOI on top of a single AOI layer, incurring high computational overhead in large-scale scenes rendering. For the real-time Web3D visualization of underground scenes, Liu et al. [13,14] proposed a lightweight scene management framework that enhances the online rendering efficiency of large-scale scenes through hierarchical preprocessing and dynamic loading strategies based on the Sector of Interest. This method provides targeted solutions for lightweight Web3D visualization of enclosed environments such as underground constructions and pipelines. For WebBIM data, Liu et al. [15,16] proposed the I-Frustum of Interest based on voxel rendering with a boundary shell. Smooth loading and unloading of the scene is achieved through a lightweight boundary shell and loading strategy based on the Interest Degree (ID). However, its scene applicability remains limited, as external production extraction relies on building shadow structures, resulting in restricted effectiveness for large-scale scenes. Su et al. [17] proposed a fast display method for a large-scale 3D city model based on the rule of viewpoint movement, where the appropriate LOD model was selected on the basis of the distance from the entity to the viewpoint and eccentricity. The operating efficiency was greatly improved, and the frame rate was increased by 50%. Li et al. [18] further proposed a cloud–edge–browser collaborative multi-granularity interest loading scheduling algorithm for large-scale scenes, and introduced ID based on AOI to further optimize the loading sequence of large-scale scenes.
2.3. Semantic-Driven Approaches
These methods determine resource loading priorities within AOI by integrating semantic labels (e.g., object categories and interaction priorities) with geometric metrics. Li et al. [19] proposed a user-interest-driven cloud–edge–browser collaborative architecture that predicts potential high-priority regions through user behavior history. Building upon prior research, Li et al. [20] developed a semantic-driven method for BIM scenes that preloads critical areas by predicting future AOI from user trajectories. However, the rendering framework lacks integration of lighting techniques, which may compromise visual quality in high-fidelity applications such as VR presentations. For urban scene location-based services (LBS), Lin et al. [21] pioneered the integration of deep reinforcement learning into semantically-guided AOI segmentation, employing Markov decision processes modeling to optimize AOI boundaries, thereby enabling intelligent LBS management.
3. Methods
The overall pipeline illustrated in Figure 1 comprises three modules: a locally optimal initial viewpoint selection module that achieves rapid initial viewpoint rendering through viewpoint selection algorithms; a dynamic loading module that determines model loading/unloading priorities via VD; and an AO compensation module integrating VD with a compensation factor to achieve AO effects optimization.
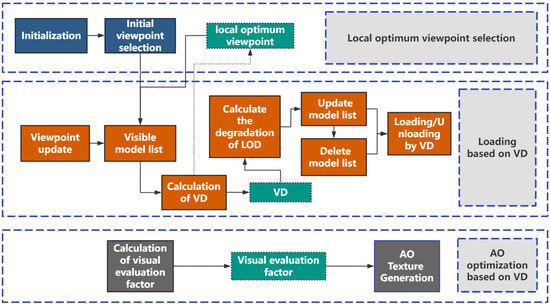
Figure 1.
Pipeline of VD-based loading strategy. The top row is a locally optimal initial viewpoint selection module achieving rapid initial viewpoint rendering through viewpoint selection algorithms. The middle row is a dynamic loading module determining model loading/unloading priorities via VD. The last row is an AO generation module integrating VD with a compensation factor to achieve AO effects optimization (The green boxes denote the primary output data generated by each module).
3.1. Vision Degree
Scene visual influence is quantified using three metrics: LOD level (LOD Degree, LD), loading latency (Transfer Degree, TD), and rendering area for loading latency (Vision Transfer Degree, VTD). These metrics form VD, which establishes quantitative criteria for model loading prioritization. The system maintains three core queues (update list, save list, delete list) dynamically prioritized by VD values), with parameters defined as follows:
Vision Degree (VD). VD is the weighted result of LD, TD and VTD which is defined as
where , , the weighting coefficients , , and correspond to distinct dimensions of , determined through experimental parameter tuning. Balancing rendering quality and loading overhead is critical for large-scale scenes. Scenes exhibiting higher ratios of rendering quality and loading latency are, therefore, prioritized, thus receiving higher values. also quantifies LOD degradation levels, with higher values indicating milder LOD degradation. The initial parameters are set as , with optimized configurations determined as .
LOD Degree (LD). LD is defined as the normalized ratio between the current LOD level and total LOD hierarchy, expressed as:
where denotes the currently selected model node, represents the node’s current LOD hierarchy level, and is the preset total LOD hierarchy count. quantifies the geometric detail level of scene LOD, where higher hierarchical values indicate finer geometric descriptions and lower LOD degradation.
Transfer Degree (TD). TD is defined as the ratio between the target model size and total model sizes within the current viewpoint, expressed as follows:
where and denote the currently selected model node and its parent node, respectively. computes the geometric volume of the target model, and represents the geometric volume of the parent node model. quantifies the volumetric ratio of the target model relative to its parent node, where increased coupled with decreased enhances visual saliency, consequently elevating both the loading priority and VD value.
Vision Transfer Degree (VTD). VTD is defined as the composite metric comprising Area Degree (AD) and Space Degree (SD). AD is calculated as the ratio of the model’s projected screen area to the total screen space in the current viewpoint, while SD quantifies the ratio of the model’s volumetric occupancy to the 3D spatial extent of the current viewpoint. VTD is formulated as the ratio of AD to SD, expressed as follows:
where
where and denote the currently selected model node and its parent node, respectively. and represent the volumes of the current model’s bounding box and its parent model’s bounding box. is the projected area of the model’s bounding box on the xoz-plane, while refers to the total screen space area. quantifies the model’s display proportion in screen space, directly influencing user visual perception. characterizes the volumetric proportion of the current model relative to its parent model. is defined as the ratio of to , measuring the projection efficiency from 3D space to screen space. An increased combined with a decreased enhances projection efficiency, thereby elevating the loading priority.
3.2. VD-Based Loading Strategy
The system implements a VD-based loading strategy as illustrated in Figure 2. First, the dynamic loading priority manages the update list(), save list(), and delete list(). After applying viewpoint transformation matrix updates, the system generates the current visible model set and dynamically maintains the three core lists using the optimize algorithm based on VD. As detailed in Algorithm 1, is optimized using loading priority metric VD. LOD degradation is triggered when the LOD degradation count exceeds zero and the model VD falls below the average VD. As Figure 3 shows, scene loading follows descending VD order. VD also controls model unloading in under the constraint , prioritizing models with minimal distances from the models to the viewpoint.
| Algorithm 1 Optimize update list based on VD |
| Require: Update list: , average VD: , maximum number of updates: , minimum fine level: |
| Ensure: Optimized update list: |
| 1: Number of updates: |
| 2: Number not traversed: |
| 3: while do |
| 4: |
| 5: if then |
| 6: if then |
| 7: if then |
| 8: |
| 9: |
| 10: |
| 11: else |
| 12: |
| 13: |
| 14: |
| 15: end if |
| 16: else |
| 17: |
| 18: end if |
| 19: end if |
| 20: end while |
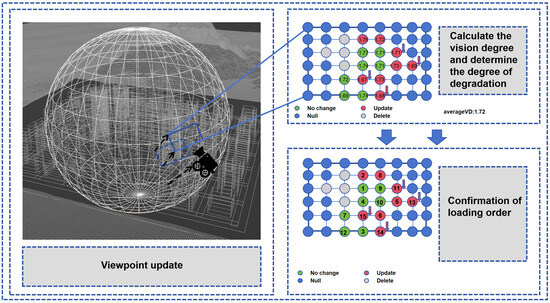
Figure 2.
Loading strategies based on VD. Individual models are represented through point primitives (blue). Subsequent computation derives VD and their mean for models within the update (red) list. The loading priority and LOD degradation are determined through analyzing the comparison between the VD values of models in the update (red) and save (green) lists and their respective average VD.
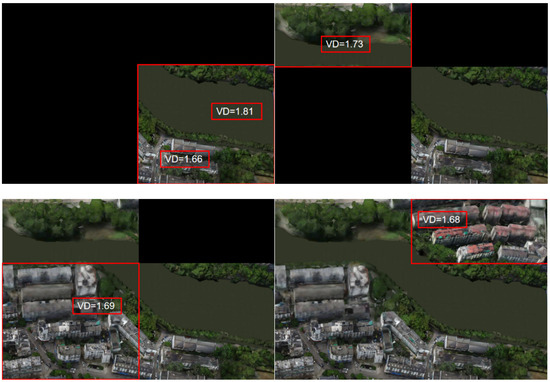
Figure 3.
Loading scenes based on VD. Load in descending order of VD starting from the left of the top row to the right of the bottom row.
3.3. Compensation Factor for AO Optimization
Urban scene visualization requires enhanced rendering quality for regions with high visual saliency. Building on Liu et al.’s visual attraction elements [22], we construct a compensation factor by the quantifying spatial distance parameter.
The spatial distance parameter D is quantified by the average distance between models and the viewpoint. D is defined as follows:
where denotes the average distance between each model and the camera viewpoint in the scene. and represent the maximum and minimum distances within the model list, respectively. is defined as the ratio of the normalized average distance to the actual average distance, quantifying the spatial enclosure of the scene relative to the user. A higher value indicates a denser model distribution within the viewpoint and broader AO coverage.
The compensation factor is determined by , which modulates the AO intensity and radius. The rendered results are presented in Section 4.
3.4. Local Optimal Initial Viewpoint Selection
Building on the optimal initial viewpoint selection algorithm proposed by Li et al. [18], our method workflow is illustrated in Figure 4, with the detailed steps outlined as follows:
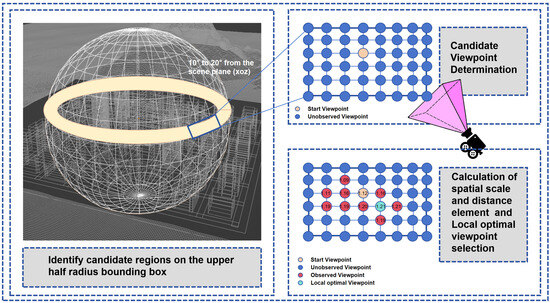
Figure 4.
Pipeline of initial viewpoint selection. First, the bounding sphere radius is reduced by 50%, and a sub-region (blue rectangle) with an azimuthal interval of 20 degrees is randomly selected within the candidate region (yellow circle) on the reduced sphere. This sub-region is parameterized as a rectangular window (left part of the figure). The window is subsequently divided into multiple candidate viewpoints, from which a single viewpoint (yellow circle) is randomly chosen as the initial position (upper-right sub-figure). The initial viewpoint selection algorithm identifies the optimal viewpoint (light-blue dot, lower-right sub-figure) that maximizes scene coverage in the vicinity of the viewpoint.
- The bounding sphere of the scene is initially computed based on its geometric characteristics. An optimized bounding sphere is then generated by reducing the initial radius by 50%.
- Select the upper hemisphere on a surface ring to from the xoz plane.
- A range of is randomly selected as a window on the surface ring and subdivided evenly into discrete viewpoints.
- The optimized initial viewpoint selection algorithm employs the average distance from scene objects to the viewpoint as a spatial relevance metric, aiming to maximize scene coverage in the vicinity of the viewpoint.
- Based on the computed locally optimal initial viewpoint, the model list within the viewpoint is retrieved, and model LOD and loading priorities are dynamically adjusted according to VD.
4. Results
To validate the effectiveness of the proposed method, we measured the initial loading time, frame rate, AO effects, PSNR, and SSIM as the performance metrics. All scenes were evaluated on an experimental platform equipped with an Intel Core i5-12490F CPU, 16 GB RAM, and an NVIDIA GeForce RTX3070 GPU.
4.1. Test Scenes
The test scenes selected in this study are listed in Table 1, with the visualizations of City A and City B presented in Figure 5a,b, respectively.

Table 1.
Test scenes information.

Figure 5.
Test scenes. The top row shows an aerial view of the scene. The bottom row shows the details of scenes (from red box).
4.2. Test Results
4.2.1. Initial Loading Time
Two test routes were conducted in City A and City B, respectively. The initial loading time is defined as the duration from the user’s first scene load until the LOD levels cease to update. Table 2 presents the initial loading time results under different loading strategies across scenes. Figure 6 provides a visual comparison of the initial loading process, while Figure 7 shows the visual comparison during roaming. The results demonstrate that VD-based loading strategy with an initial viewpoint selection achieves significant performance improvements. Compared to the ID-based method [18], VD strategy with initial viewpoint selection reduces the average loading time by 25.5% across scenes. Although the LOD of some models was reduced, their rendering quality remains comparable to the exiting AOI strategy. Each test route was applied with two distinct loading strategies, resulting in a total of four tests. For each test, 100 frames were sampled to compute the average PSNR and SSIM, with comparative results presented in Table 3. From Figure 6 and Figure 7, it can be observed that the VD method performs better in mixed scenes containing buildings, roads, and trees, with a clearer expression of scene details.

Table 2.
Initial loading time of different modes in each scene.
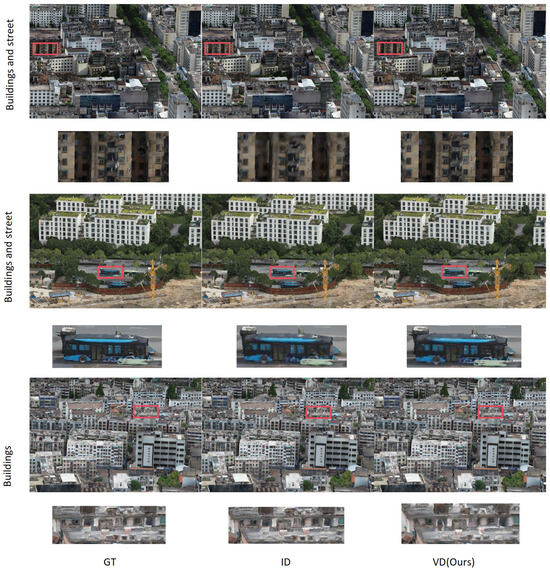
Figure 6.
Initial loading of different modes in each scene. The top and middle rows contain buildings and streets. The bottom row features a large number of buildings.
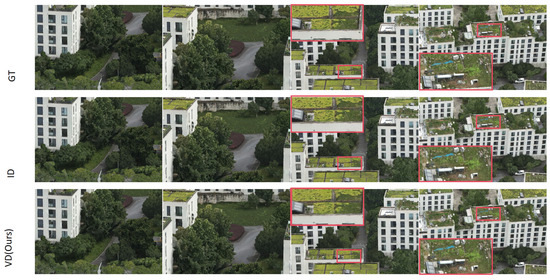
Figure 7.
Roaming of different modes in each scene. From left to right are the rendering effect comparisons at four test points along the test path in City B.

Table 3.
Rendering performance metrics comparison.
4.2.2. Frame Rate
Two test routes were conducted in City A and City B, respectively. Frame rate is positively correlated with scene navigation smoothness. A higher frame rate enhances visual continuity during user interaction. Navigation loading latency is defined as the time interval between viewpoint updates and scene LOD updates reaching level 21 or ceasing. Prolonged latency intensifies visual lag effects, leading to reduced frame rates. In this study, navigation loading latency is quantified by the average frame rate during the loading phase. The average frame rates for both initial loading and navigation loading phases across multiple scenes are demonstrated in the Table 3. Figure 8 presents the frame rate variation during roaming in the test scenes. Experimental results indicate that the proposed loading strategy achieves an average frame rate exceeding 30. Figure 8 demonstrates that during roaming, the VD method outperforms the ID method in frame rate (achieving real-time rendering) with smoother loading performance. Notably, at the onset of viewpoint transition, frame rate temporarily spikes due to loading delay before gradually stabilizing.
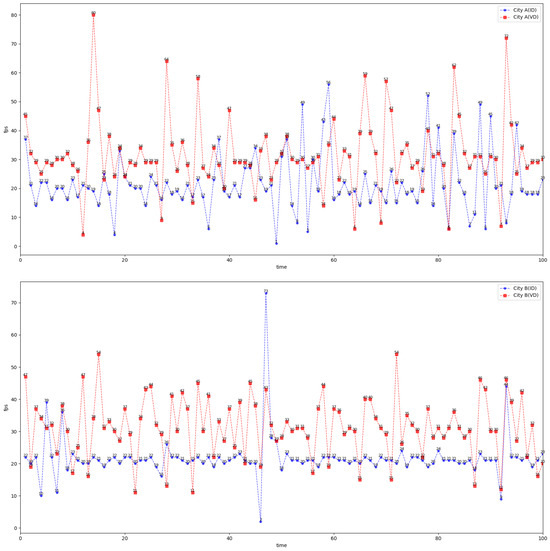
Figure 8.
Roaming frame rate of different modes in each scene. Top: City A; Bottom: City B.
4.2.3. Compensation Factor for AO Effects
An AO effect is a critical component of urban scene visualization. The rendering process is optimized through the joint application of VD and compensation factor to counteract quality degradation arising from LOD reductions. As shown in Figure 9, the upper part illustrates rendering results without VD and compensation factor, while the lower part presents the optimized results after applying these components. Experimental results demonstrate that implementing the compensation factor enhances visual effects by partially mitigating the perceptual degradation induced by LOD reduction.
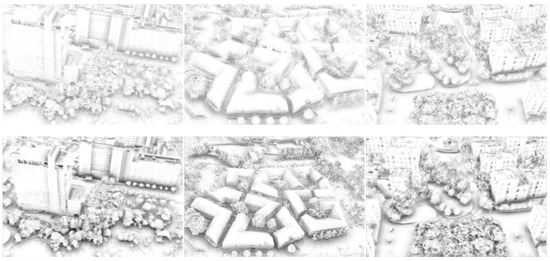
Figure 9.
Comparative analysis of rendering optimization. The top row displays the AO effect without compensation, while the bottom row presents the AO effect with compensation.
5. Conclusions
This paper proposes a VD-based optimization strategy for large-scale scene loading and rendering. Building upon exiting AOI methods, the strategy addresses efficient loading and rendering efficiency in large-scale scenes by optimizing loading priorities via VD and reducing scene data. Visual saliency parameters are quantified to compensate for rendering detail loss. Additionally, an initial viewpoint selection algorithm prioritizing model density in the viewpoint vicinity is introduced, significantly reducing the initial loading time. The experimental results demonstrate that the proposed strategy outperforms existing AOI-based approaches in mitigating low fluency and low rendering efficiency for large-scale scene visualization.
However, there are still difficulties in this field, particularly regarding computational demands. While the proposed loading strategy demonstrates a promising performance in large-scale scenes, limitations emerge when handling ultra-scale scenes. Future research will prioritize hybrid computing architectures integrating edge frameworks to leverage the computational capabilities of edge devices, thereby enhancing computational efficiency through distributed processing paradigms.
Moreover, current compensation factor quantification methodology exhibits limitations in flexibility due to its partial incorporation of visual attraction elements. Future research directions will focus on transitioning from single-element optimization to multi-element joint optimization frameworks, thereby enabling adaptive visual enhancement in large-scale scenes through dynamic parameter coordination.
Author Contributions
Y.D.: writing—original draft, visualization, methodology, investigation, formal analysis, conceptualization. Y.S.: supervision, visualization, investigation, suggestions, project administration. All authors have read and agreed to the published version of the manuscript.
Funding
The article processing charge was funded by the Zhejiang Provincial Key R&D Plan (No. 2023C01041 & 2023C01047).
Informed Consent Statement
Not applicable.
Data Availability Statement
Due to the nature of this research, participants of this study did not agree for their data to be shared publicly, so supporting data is not available.
Acknowledgments
The authors would also like to thank the respected editor and reviewer for their valuable discussions, insightful suggestions, and participation in the survey conducted for this paper.
Conflicts of Interest
All authors disclosed no relevant relationships.
Correction Statement
This article has been republished with a minor correction to the Funding statement. This change does not affect the scientific content of the article.
References
- Gholami, M.; Torreggiani, D.; Tassinari, P.; Barbaresi, A. Developing a 3D city digital twin: Enhancing walkability through a green pedestrian network (GPN) in the City of Imola, Italy. Land 2022, 11, 1917. [Google Scholar] [CrossRef]
- Yu, L. Design and Implementation of Scene Management Based on 3D Visualization Platform. Master’s Thesis, Shenyang Institute of Computing Technology, Chinese Academy of Sciences, Shenyang, China, 2020. [Google Scholar]
- Eriksson, H.; Harrie, L. Versioning of 3D city models for municipality applications: Needs, obstacles and recommendations. ISPRS Int. J.-Geo-Inf. 2021, 10, 55. [Google Scholar] [CrossRef]
- Abualdenien, J.; Borrmann, A. Levels of detail, development, definition, and information need: A critical literature review. J. Inf. Technol. Constr. 2022, 27, 363–392. [Google Scholar] [CrossRef]
- Biljecki, F.; Ledoux, H.; Stoter, J.; Zhao, J. Formalisation of the Level of Detail in 3D city modelling. Comput. Environ. Urban Syst. 2014, 48, 1–15. [Google Scholar] [CrossRef]
- Neuville, R.; Pouliot, J.; Poux, F.; Billen, R. 3D viewpoint management and navigation in urban planning: Application to the exploratory phase. Remote Sens. 2019, 11, 236. [Google Scholar] [CrossRef]
- Huang, A.; Liu, Z.; Zhang, Q.; Tian, F.; Jia, J. Fine-Grained Web3D Culling-Transmitting-Rendering Pipeline. In Proceedings of the Computer Graphics International Conference; Springer: Berlin/Heidelberg, Germany, 2023; pp. 159–170. [Google Scholar]
- Asirvatham, A.; Hoppe, H. Terrain rendering using GPU-based geometry clipmaps. GPU Gems 2005, 2, 27–46. [Google Scholar]
- De Lucas, E.; Marcuello, P.; Parcerisa, J.M.; Gonzalez, A. Visibility rendering order: Improving energy efficiency on mobile gpus through frame coherence. IEEE Trans. Parallel Distrib. Syst. 2018, 30, 473–485. [Google Scholar] [CrossRef]
- Zhang, J.; Cheng, J.C.; Chen, W.; Chen, K. Digital twins for construction sites: Concepts, LoD definition, and applications. J. Manag. Eng. 2022, 38, 04021094. [Google Scholar] [CrossRef]
- Sun, Z.; Wang, C.; Wu, J. Industry foundation class-based building information modeling lightweight visualization method for steel structures. Appl. Sci. 2024, 14, 5507. [Google Scholar] [CrossRef]
- Jia, J.; Wang, W.; Wang, M.; Fan, C.; Zhang, C.x.; Yu, Y. Multilayered Incremental & Scalable Sector of Interest (MISSOI) Based Efficient Progressive Transmission of Large-scale DVE Scenes. Chin. J. Comput. 2014, 37, 1324–1334. [Google Scholar]
- Liu, X.; Jia, J.; Zhao, J. Lightweight Scene Management for Real-Time Visualization of Underground Scene Based on Web3D. In Proceedings of the 2014 International Conference on Virtual Reality and Visualization, Shenyang, China, 30–31 August 2014; pp. 308–313. [Google Scholar]
- Liu, X.; Xie, N.; Jia, J. Web3D-Based Online Walkthrough of Large-Scale Underground Scenes. In Proceedings of the 2015 IEEE/ACM 19th International Symposium on Distributed Simulation and Real Time Applications (DS-RT), Chengdu, China, 14–16 October 2015; pp. 104–107. [Google Scholar]
- Liu, X.; Xie, N.; Jia, J. WebVis_BIM: Real time web3D visualization of big BIM data. In Proceedings of the 14th ACM SIGGRAPH International Conference on Virtual Reality Continuum and Its Applications in Industry, Kobe, Japan, 30 October–1 November 2015; pp. 43–50. [Google Scholar]
- Liu, X.; Xie, N.; Tang, K.; Jia, J. Lightweighting for Web3D visualization of large-scale BIM scenes in real-time. Graph. Model. 2016, 88, 40–56. [Google Scholar] [CrossRef]
- Su, M.; Guo, R.; Wang, H.; Wang, S.; Niu, P. View frustum culling algorithm based on optimized scene management structure. In Proceedings of the 2017 IEEE International Conference on Information and Automation (ICIA), Macau, China, 18–20 July 2017; pp. 838–842. [Google Scholar]
- Li, K.; Zhang, Q.; Jia, J. CEB-collaboratively multi-granularity interest scheduling algorithm for loading large WebBIM scene. J.-Comput.-Aided Des. Comput. Graph. 2021, 33, 1388–1397. [Google Scholar] [CrossRef]
- Li, K.; Zhang, Q.; Zhao, H.; Jia, J. User interests driven collaborative cloud-edge-browser architecture for WebBIM visualization. In Proceedings of the 25th International Conference on 3D Web Technology, Seoul, Republic of Korea, 9–13 November 2020; pp. 1–10. [Google Scholar]
- Li, K.; Zhao, H.; Zhang, Q.; Jia, J. CEBOW: A Cloud-Edge-Browser Online Web3D approach for visualizing large BIM scenes. Comput. Animat. Virtual Worlds 2022, 33, e2039. [Google Scholar] [CrossRef]
- Lin, Y.; Fu, J.; Wen, H.; Wang, J.; Wei, Z.; Qiang, Y.; Mao, X.; Wu, L.; Hu, H.; Liang, Y.; et al. DRL4AOI: A DRL Framework for Semantic-aware AOI Segmentation in Location-Based Services. arXiv 2024, arXiv:2412.05437. [Google Scholar]
- Liu, B.; Fan, R. Quantitative analysis of the visual attraction elements of landscape space. J. Nanjing For. Univ. 2014, 57, 149. [Google Scholar]
Disclaimer/Publisher’s Note: The statements, opinions and data contained in all publications are solely those of the individual author(s) and contributor(s) and not of MDPI and/or the editor(s). MDPI and/or the editor(s) disclaim responsibility for any injury to people or property resulting from any ideas, methods, instructions or products referred to in the content. |
© 2025 by the authors. Licensee MDPI, Basel, Switzerland. This article is an open access article distributed under the terms and conditions of the Creative Commons Attribution (CC BY) license (https://creativecommons.org/licenses/by/4.0/).