

EMGP-Net: A Hybrid Deep Learning Architecture for Breast Cancer Gene Expression Prediction


Abstract
1. Introduction
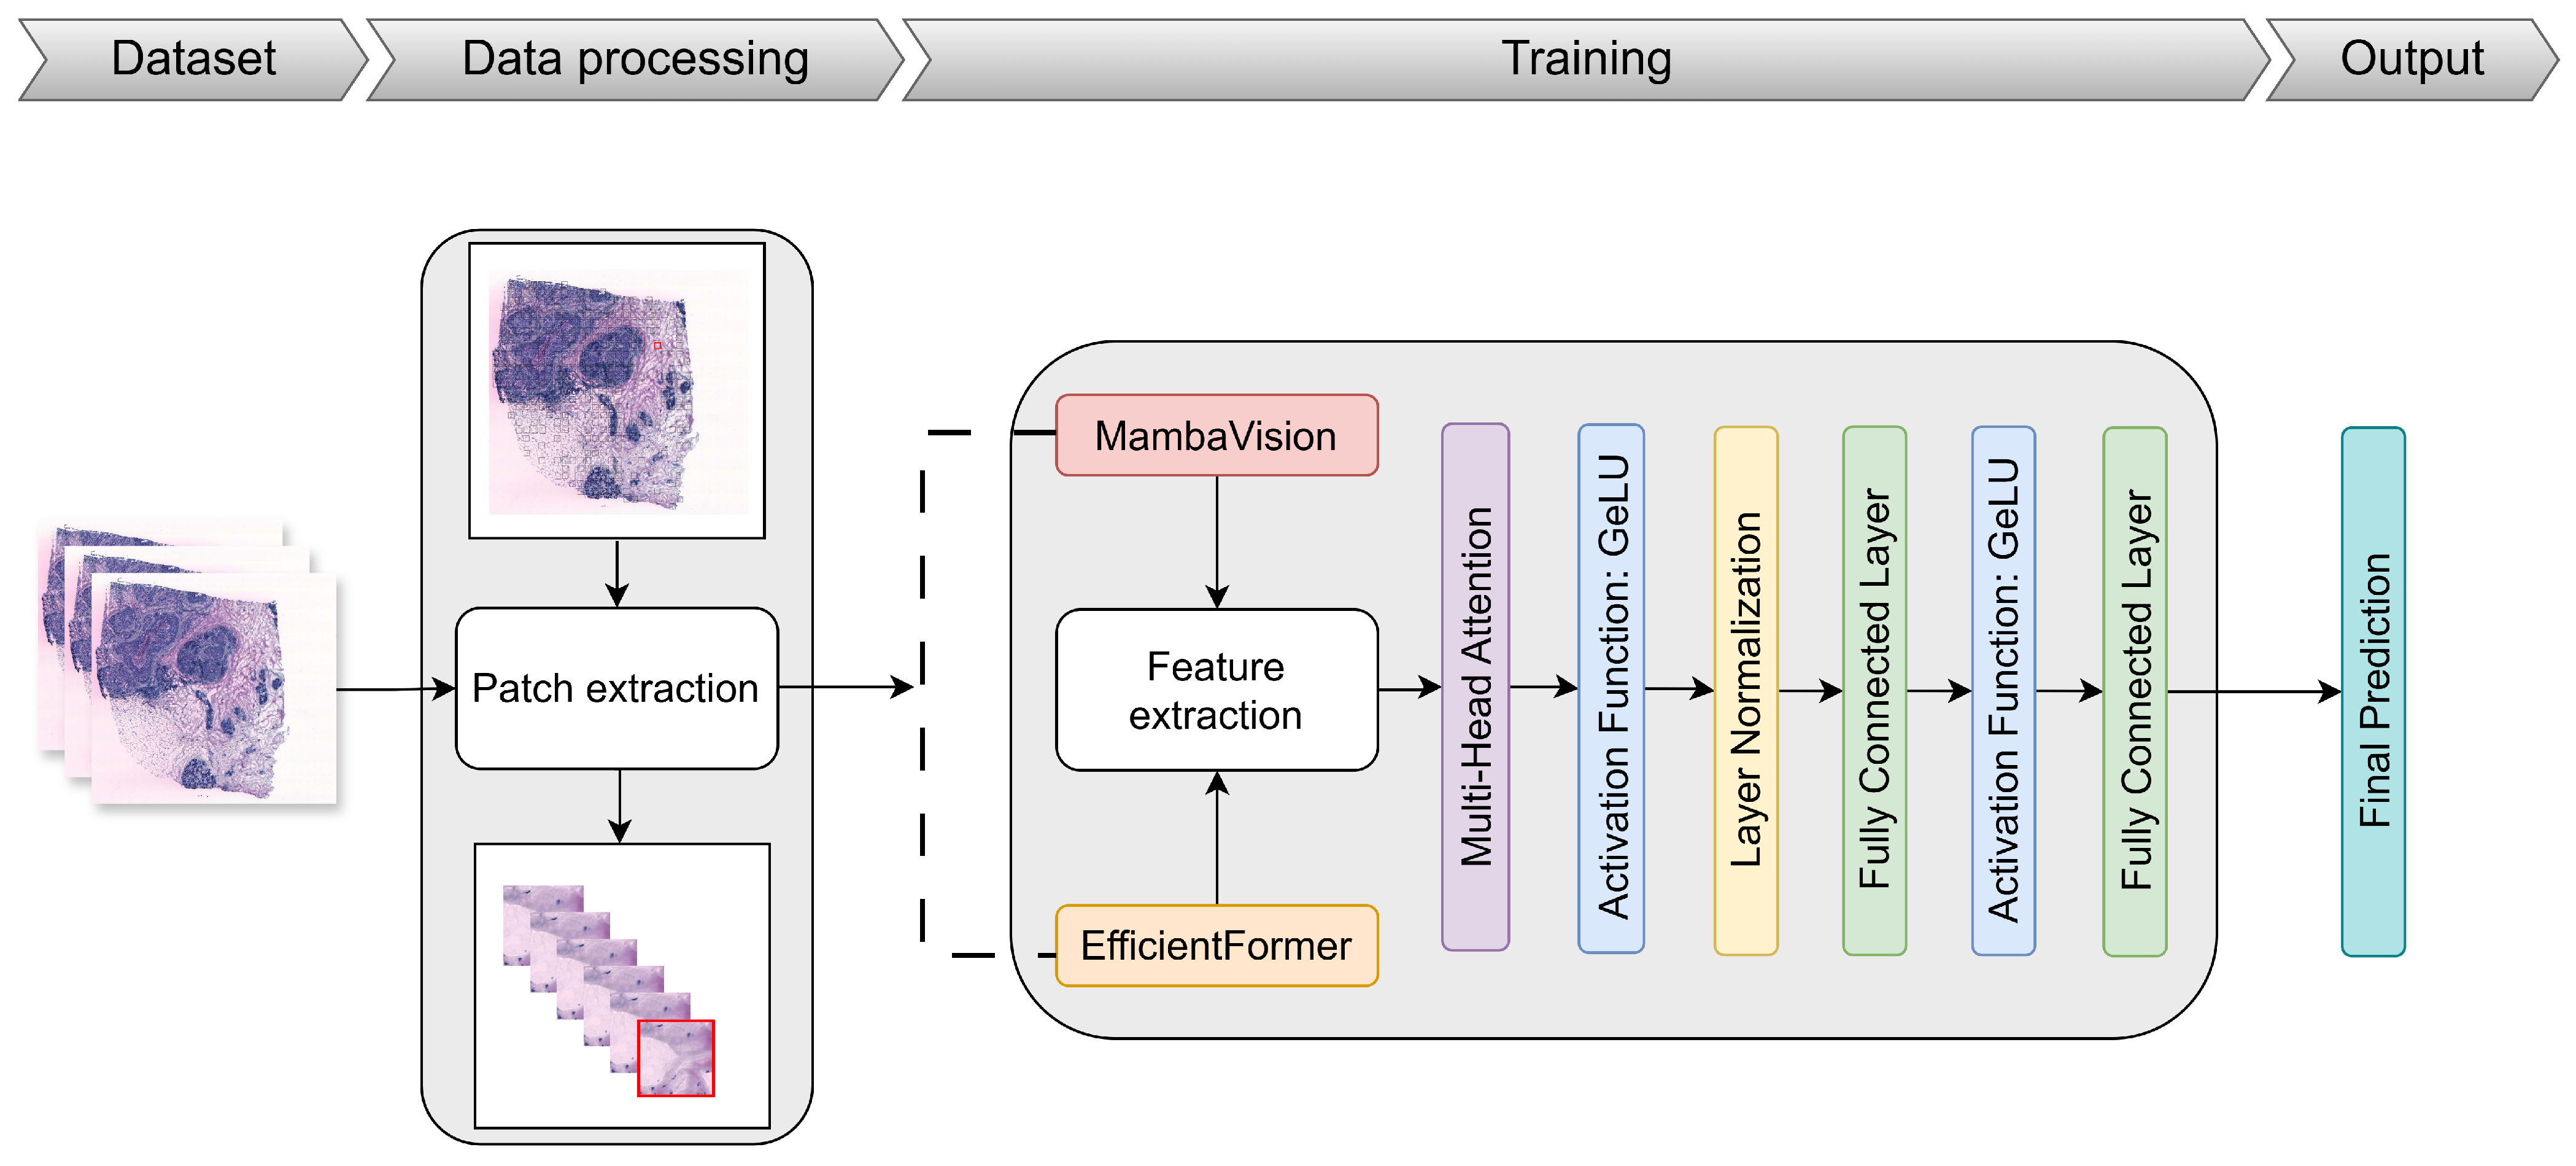
- Proposing EMGP-Net: We propose a hybrid model combining MambaVision and EfficientFormer to predict gene expression more effectively from WSIs.
- Performing exhaustive validation: We perform internal and external validation on the HER2+ and STNet datasets to ensure model robustness and generalizability.
- Demonstrating benefits of hybrid deep learning: We demonstrate the benefits of combining the latest powerful SOTA models and evaluate them on medical tasks, contributing to advances in breast cancer research, particularly in gene expression prediction for diagnosis.
2. Related Work
2.1. CNN-Based Approaches
2.2. Transformer-Based Approaches
2.3. Hybrid Transformer and GNN Approaches
2.4. Graph-Based and Relational Modeling Approaches
2.5. Exemplar-Guided Approaches
3. Materials and Methods
3.1. Dataset
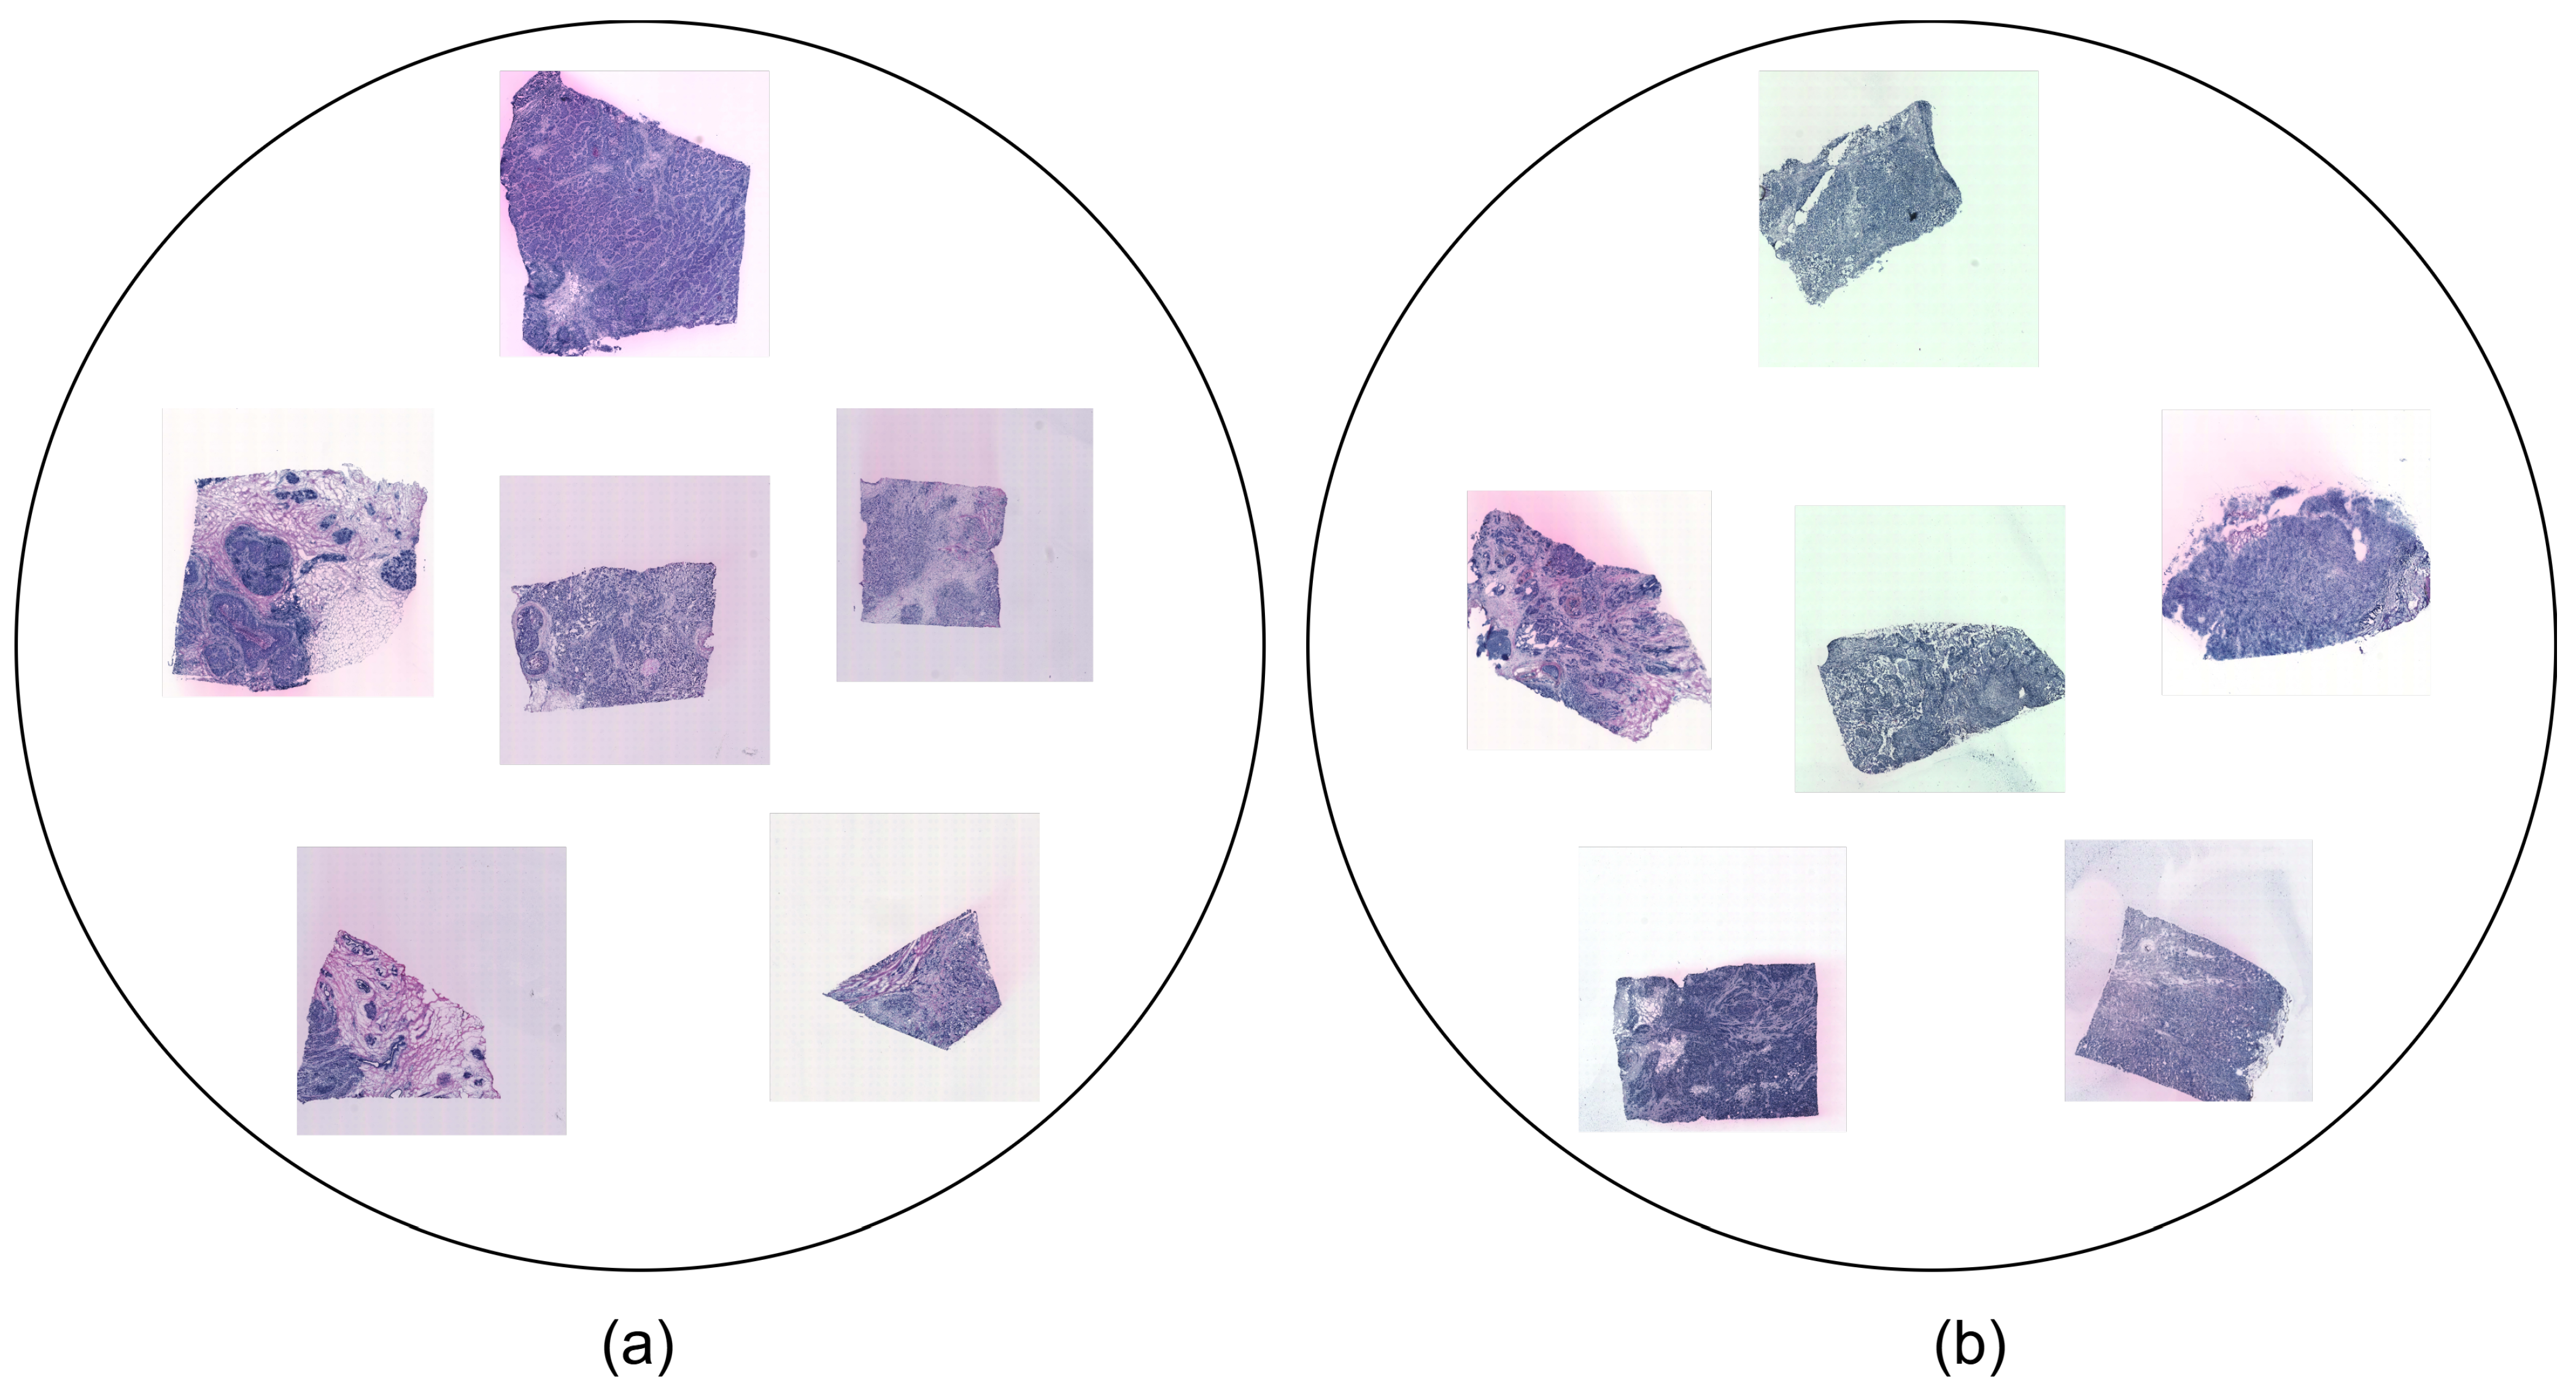
- HER2+ is the HER2 (human epidermal growth factor receptor)-positive breast cancer dataset that was investigated in [24]. It was collected from eight patients (A-H). A total of 36 sections comprise the samples in this dataset. Three or, alternatively, six replicates (sections from the same patient) were assigned to each patient and stained with H&E. Each sample is in JPG format and comes with associated ST data. The dataset may represent various tissue types, including invasive cancer, breast glands, immune infiltrate, cancer in situ, connective tissue, and adipose tissue.
- STNet is the fifth edition of the human breast cancer in situ capturing transcriptomics dataset, referred to as the STNet dataset, as was presented in [9]. It was obtained from 23 patients. It contains a total of 68 sections, with 3 sections per patient (except for 2 sections for 1 patient). The images are also stained with H&E and each sample is in JPG format and has corresponding ST data. The subtypes represented in the STNet dataset are luminal A, luminal B, triple negative, HER2 luminal, and non-luminal HER2.
3.2. Data Pre-Processing and Augmentation
3.3. Proposed Approach
3.3.1. Overview of the EMGP-Net Architecture
3.3.2. MambaVision
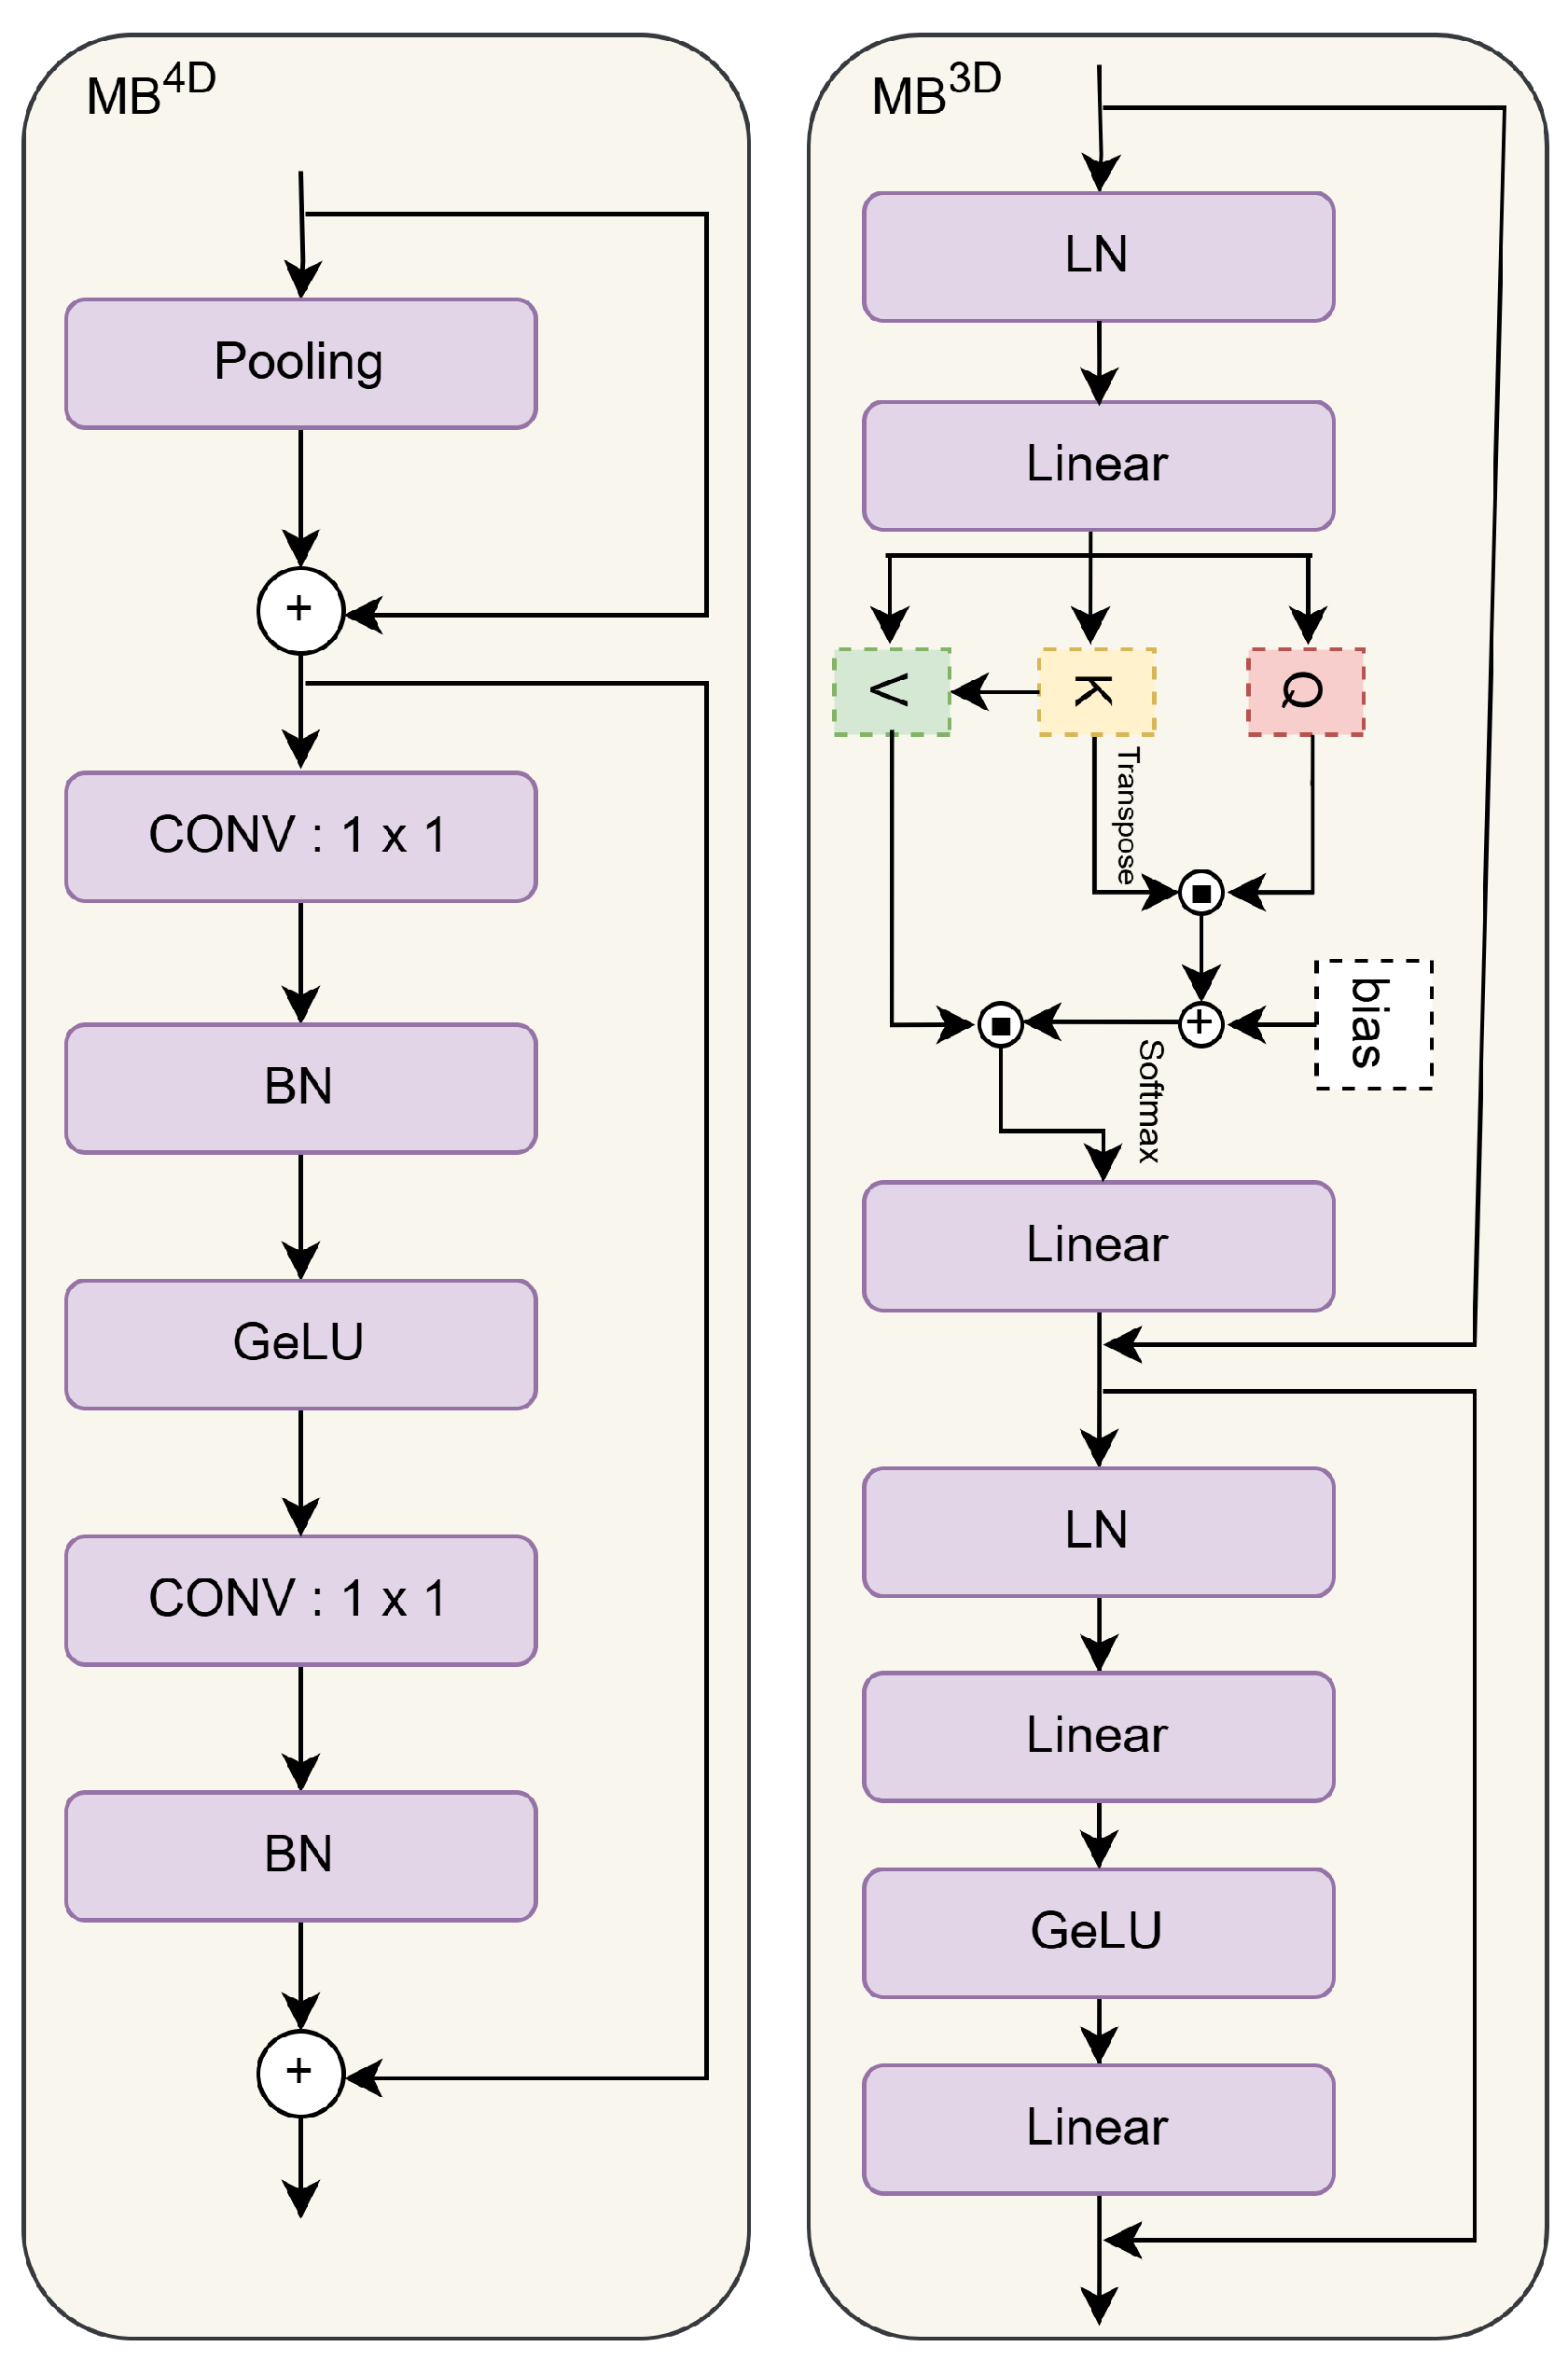
3.3.3. EfficientFormer
3.3.4. Multi-Head Attention Mechanism
3.4. Evaluation Metrics
- MAE (Mean Absolute Error): Measures the average of the absolute differences between the observed and predicted values with the following equation:
- RMSE (Root Mean Squared Error): Measures the square root of the average of the squared differences between the observed and predicted values with the following equation:
- PCC (Pearson Correlation Coefficient): A measure of the strong correlation between the observed and predicted values. It is defined by the following equation:
4. Experimental Results
4.1. Model Trained on the HER2+ Dataset
4.1.1. Comparison of Architectural Components by PCC for Top-Ranked Genes:
4.1.2. Comparison of Architectural Components by PCC for Common Genes
4.2. Quantitative Analysis of the Results
4.2.1. Analysis of EMGP-Net Results
4.2.2. Analysis of MambaVision Results
4.2.3. Analysis of EfficientFormer Results
4.2.4. Analysis of EMGP-Net-noAttn Results
4.3. External Validation
4.3.1. Model Evaluation on the STNet Dataset
4.3.2. Model Evaluation on the HER2+ Dataset
5. Discussion
- When trained on the HER2+ dataset and tested on the STNet dataset, our model outperformed GeNetFormer and ST-Net on all the 14 genes, with PCC values ranging from 0.6563 (KRT19) to 0.7145 (ERBB2) compared to the PCC values of GeNetFormer, which ranged from 0.5250 (KRT19) to 0.7069 (DDX5), and the PCC values of ST-Net, which ranged from 0.5749 (HLA-DRA) to 0.6708 (GNAS). On 9 common genes out of the 14 genes, our model outperformed ST-Net, including ACTG1, CALR, RPL23, GNAS, and PTPRF, while GeNetFormer only outperformed our model on 1 gene, which was DDX5.
- When trained on the STNet dataset and tested on the HER2+ dataset, our model outperformed GeNetFormer and ST-Net on all 14 genes, with PCC scores ranging from 0.5465 (GNAS) to 0.7285 (ERBB2) compared to the PCC values of GeNetFormer, which ranged from 0.5185 (COL1A2) to 0.6746 (ATP5E), and the PCC values of ST-Net, which ranged from 0.5287 (LASP1) to 0.6719 (ATP5E). Of the 7 common genes out of 14 genes, our model outperformed GeNetFormer on 6 genes, namely, ERBB2, S100A11, HSP90B1, LGALS3, PTPRF, and PSMB4, and only 1 gene, ATP5E, was well predicted with GeNetFormer. Our model also outperformed ST-Net on six other genes, namely, ERBB2, S100A11, ATP5E, HSP90B1, LGALS3, and PSMB4, and only PTPRF was well predicted by ST-Net.
6. Conclusions
Author Contributions
Funding
Institutional Review Board Statement
Informed Consent Statement
Data Availability Statement
Conflicts of Interest
Abbreviations
| APEG | Atypical Position Encoding Generator |
| AuxNet | Auxiliary Network |
| BN | Batch Normalization |
| CBAM | Convolutional Block Attention Module |
| CNN | Convolutional Neural Network |
| EB | Exemplar Bridging |
| EMGP-Net | EfficientFormer (E), MambaVision (M), gene expression prediction (GP) network (Net). |
| EMGP-Net-noAttn | EfficientFormer (E), MambaVision (M), gene expression prediction (GP) network (Net), no attention (noAtt). |
| ERM | Edge Relational Module |
| GAT | Graph Attention Network |
| GeLU | Gaussian Error Linear Unit |
| GEM | Gradient Enhancement Gradient |
| GNN | Graph Neural Network |
| HAM | Hypergraph Association Module |
| H&E | Hematoxylin and Eosin |
| LN | Layer Normalization |
| MAE | Mean Absolute Error |
| PCC | Pearson Correlation Coefficient |
| RMSE | Root Mean Squared Error |
| SOTA | State Of The Art |
| SSM | State-Space Model |
| ST | Spatial Transcriptomics |
| ViT | Vision Transformer |
| WAM | Window Attention Module |
| WSIs | Whole-Slide Images |
Appendix A. Lists of the 250 Genes Included in This Study Across the Two Datasets: HER2+ and STNet
Appendix A.1. List of the 250 Genes from the HER2+ Dataset

| Gene Name | Gene Name | Gene Name | Gene Name | Gene Name | Gene Name | Gene Name |
|---|---|---|---|---|---|---|
| PTMA | GNAS | B2M | HNRNPA2B1 | TPT1 | XBP1 | ACTG1 |
| HLA-B | TMSB10 | DDX5 | HLA-DRA | ACTB | S100A11 | CD24 |
| HSP90B1 | PSMB4 | COX6C | TUBA1B | EIF4G2 | PRDX1 | HLA-C |
| HLA-A | LAPTM4A | VMP1 | HSP90AA1 | UBC | ATP5E | CALM2 |
| SCGB2A2 | NACA | FTH1 | COX7C | CALR | CCT3 | FASN |
| PEBP1 | HSPB1 | PSAP | SPINT2 | BEST1 | PFN1 | PLXNB2 |
| ATP5B | SERF2 | LGALS3 | P4HB | MYH9 | CRIP2 | CHCHD2 |
| ATP1A1 | ERBB2 | KRT19 | CD74 | FN1 | GAPDH | HSP90AB1 |
| HSPA8 | PTPRF | FTL | LSM4 | KDELR1 | CFL1 | VCP |
| MIDN | PPP1CA | SLC9A3R1 | PABPC1 | APOE | GRB7 | RACK1 |
| EEF2 | TUBB | JTB | SH3BGRL3 | TXNIP | SCD | OAZ1 |
| LASP1 | ATG10 | SPDEF | SEPW1 | VIM | MDK | CTSB |
| SEC61A1 | GRINA | IDH2 | UBE2M | COPS9 | MMACHC | MZT2B |
| JUP | UBA52 | PSMD8 | SLC2A4RG | MLLT6 | SSR2 | DBI |
| TAPBP | CIB1 | PPDPF | CST3 | TSPO | CD63 | COL1A1 |
| PTBP1 | AES | TAGLN2 | ATP5G2 | MYL6 | NUCKS1 | GNAI2 |
| PLD3 | GNB2 | LMAN2 | HM13 | RALY | SNRPB | SDC1 |
| ENO1 | COPE | PHB | GRN | HLA-E | STARD10 | COL1A2 |
| A2M | ALDOA | NUPR1 | LAPTM5 | EIF3B | EDF1 | MAPKAPK2 |
| SERINC2 | FLNA | MIEN1 | SYNGR2 | MUC1 | COX4I1 | EIF4G1 |
| C3 | PERP | H1FX | GPX4 | C1QB | APOC1 | DHCR24 |
| PRSS8 | COX6B1 | IGLC2 | KRT18 | ERGIC1 | GUK1 | PGAP3 |
| IGLC3 | IGHG3 | FAU | UQCRQ | UQCR11 | ZYX | CLDN4 |
| CD81 | CD99 | NDUFA3 | CISD3 | RRBP1 | COX5B | S100A6 |
| LGALS3BP | PCGF2 | TYMP | TIMP1 | NDUFB9 | ATP6V0B | AP2S1 |
| COX8A | FNBP1L | COL3A1 | STARD3 | PTMS | IFI27 | KRT7 |
| PFKL | CTSD | RABAC1 | PSMB3 | PSMD3 | LMNA | H2AFJ |
| ARHGDIA | SPARC | EEF1D | SLC25A6 | INTS1 | ACTN4 | IGHA1 |
| CHPF | ELOVL1 | SSR4 | ATP6AP1 | CYBA | TAGLN | C1QA |
| PRRC2A | RHOC | IGHG1 | MMP14 | PPP1R1B | CALML5 | BSG |
| CLDN3 | AEBP1 | LY6E | TRAF4 | IGKC | BGN | NBL1 |
| FKBP2 | AP000769.1 | ROMO1 | COL6A2 | IGHM | C12orf57 | MYL9 |
| BCAP31 | SCAND1 | TCEB2 | PFDN5 | BST2 | KIAA0100 | NDUFB7 |
| MUCL1 | LGALS1 | POSTN | TFF3 | MGP | COL18A1 | NDUFA11 |
| IGFBP2 | KRT81 | SUPT6H | ORMDL3 | S100A9 | MUC6 | AZGP1 |
| S100A14 | S100A8 | IGHG4 | ADAM15 | ISG15 | * | * |
Appendix A.2. List of the 250 Genes from the STNet Dataset
| Gene Name | Gene Name | Gene Name | Gene Name | Gene Name | Gene Name | Gene Name |
|---|---|---|---|---|---|---|
| ERBB2 | ACTG1 | CALR | RPL23 | GNAS | PSMD3 | PTPRF |
| TMSB10 | GAPDH | TAGLN2 | DDX5 | HSPB1 | PTMA | KRT19 |
| P4HB | PRDX1 | PFN1 | HLA-C | S100A11 | RPL28 | ENSG00000203812 |
| B2M | HLA-DRA | CPB1 | NHERF1 | RPLP0 | S100A9 | RPL19 |
| HLA-B | C4B | CALML5 | ACTB | S100A8 | RPLP2 | TMSB4X |
| APOE | GRINA | ENO1 | RPL35 | MGP | TIMP1 | HLA-A |
| RPS11 | IGLL5 | PRSS8 | ENSG00000272196 | COX6C | ATP1A1 | CYBA |
| RPS19 | RPLP1 | RPS28 | RPS18 | JUP | RPS2 | UBA52 |
| TUBA1B | SELENOW | IFI27 | ELF3 | FTL | N/A | RPL13 |
| RPL9 | ATP5F1E | N/A | RPL10 | CST3 | RPS4X | RPL38 |
| TAPBP | SYNGR2 | RPS20 | CD74 | SERF2 | FASN | C1QA |
| CLDN3 | N/A | SPDEF | RACK1 | UBC | BCAP31 | PABPC1 |
| RPS6 | N/A | FLNA | RPS13 | H1-10 | SDC1 | EIF4G1 |
| FTH1 | RPS9 | CRIP2 | RPS27A | AEBP1 | CLU | S100A6 |
| RPL8 | FN1 | SEC61A1 | MYL6 | RPL15 | RPS17 | PPP1CA |
| GPX4 | RPS7 | BGN | RPL13A | ATP6V0B | BSG | TPT1 |
| A2M | BST2 | PPDPF | MYL9 | VIM | RPS15A | XBP1 |
| COL1A1 | RPS14 | STARD10 | RPS12 | RPS3 | ISG15 | RPS15 |
| ENSG00000169100 | MZT2A | HSP90AB1 | CD81 | LY6E | IFITM3 | MZT2B |
| EIF4A1 | PFDN5 | RPS8 | COX8A | UBB | LGALS3BP | RPL23A |
| EEF2 | RPL29 | N/A | TAGLN | EVL | N/A | RPL3 |
| MUC1 | SPARC | N/A | APOC1 | H3-3B | RPS23 | N/A |
| KRT8 | RPS21 | UQCR11 | TSPO | RPL27 | UQCRQ | GNB2 |
| RPL34 | ARHGDIA | LAPTM5 | SNHG25 | RPL5 | N/A | N/A |
| RHOC | TUFM | RPL35A | RPL14 | EDF1 | N/A | CFL1 |
| RPL18A | HLA-E | SSR2 | FXYD3 | H2AJ | FAU | AZGP1 |
| BEST1 | COL1A2 | LMNA | RPL12 | GUK1 | COX4I1 | OAZ1 |
| RPL37A | PLXNB2 | ELOB | GAS5 | N/A | GRN | MALAT1 |
| RPS24 | IGFBP2 | COX6B1 | CTSB | TFF3 | RPL24 | ALDOA |
| RPL32 | RPS16 | PRDX2 | EEF1D | RPL4 | RPL31 | CCND1 |
| NDUFA13 | RPL7A | RPL11 | RPL36 | NBEAL1 | EIF5A | PLD3 |
| RPL27A | CD63 | SH3BGRL3 | ATP6AP1 | PSAP | ZNF90 | TLE5 |
| RPS29 | RPL7 | RPS25 | KRT18 | RPS5 | NDUFA11 | CTSD |
| NDUFB9 | SSR4 | C3 | RPS27 | N/A | ENSG00000279274 | RPL37 |
| RPS3A | ENSG00000255823 | POLR2L | IFI6 | ENSG00000269028 | RPS10 | RPL30 |
| ENSG00000279483 | C12orf57 | GNAI2 | TFF1 | RPL18 | * | * |
References
- Obeagu, E.I.; Obeagu, G.U. Breast cancer: A review of risk factors and diagnosis. Medicine 2024, 103, e36905. [Google Scholar] [CrossRef]
- Thaalbi, O.; Akhloufi, M.A. Deep learning for breast cancer diagnosis from histopathological images: Classification and gene expression: Review. Netw. Model. Anal. Health Inform. Bioinform. 2024, 13, 52. [Google Scholar] [CrossRef]
- Al-Jabbar, M.; Alshahrani, M.; Senan, E.M.; Ahmed, I.A. Multi-Method Diagnosis of Histopathological Images for Early Detection of Breast Cancer Based on Hybrid and Deep Learning. Mathematics 2023, 11, 1429. [Google Scholar] [CrossRef]
- Obayya, M.; Maashi, M.S.; Nemri, N.; Mohsen, H.; Motwakel, A.; Osman, A.E.; Alneil, A.A.; Alsaid, M.I. Hyperparameter Optimizer with Deep Learning-Based Decision-Support Systems for Histopathological Breast Cancer Diagnosis. Cancers 2023, 15, 885. [Google Scholar] [CrossRef] [PubMed]
- Clement, D.; Agu, E.; Obayemi, J.; Adeshina, S.; Soboyejo, W. Breast Cancer Tumor Classification Using a Bag of Deep Multi-Resolution Convolutional Features. Informatics 2022, 9, 91. [Google Scholar] [CrossRef]
- Bagchi, A.; Pramanik, P.; Sarkar, R. A Multi-Stage Approach to Breast Cancer Classification Using Histopathology Images. Diagnostics 2022, 13, 126. [Google Scholar] [CrossRef]
- Bhausaheb, D.P.; Kashyap, K.L. Detection and classification of breast cancer availing deep canid optimization based deep CNN. Multimed. Tools Appl. 2023, 82, 18019–18037. [Google Scholar] [CrossRef]
- Yu, D.; Lin, J.; Cao, T.; Chen, Y.; Li, M.; Zhang, X. SECS: An effective CNN joint construction strategy for breast cancer histopathological image classification. J. King Saud Univ.-Comput. Inf. Sci. 2023, 35, 810–820. [Google Scholar] [CrossRef]
- He, B.; Bergenstråhle, L.; Stenbeck, L.; Abid, A.; Andersson, A.; Borg, Å.; Maaskola, J.; Lundeberg, J.; Zou, J. Integrating spatial gene expression and breast tumour morphology via deep learning. Nat. Biomed. Eng. 2020, 4, 827–834. [Google Scholar] [CrossRef]
- Rahaman, M.M.; Millar, E.K.; Meijering, E. Breast cancer histopathology image-based gene expression prediction using spatial transcriptomics data and deep learning. Sci. Rep. 2023, 13, 13604. [Google Scholar] [CrossRef]
- Thaalbi, O.; Akhloufi, M.A. GeNetFormer: Transformer-Based Framework for Gene Expression Prediction in Breast Cancer. AI 2025, 6, 43. [Google Scholar] [CrossRef]
- Pang, M.; Su, K.; Li, M. Leveraging information in spatial transcriptomics to predict super-resolution gene expression from histology images in tumors. BioRxiv 2021. [Google Scholar] [CrossRef]
- Mejia, G.; Cárdenas, P.; Ruiz, D.; Castillo, A.; Arbeláez, P. SEPAL: Spatial Gene Expression Prediction from Local Graphs. In Proceedings of the IEEE/CVF International Conference on Computer Vision, Paris, France, 1–6 October 2023; pp. 2294–2303. [Google Scholar] [CrossRef]
- Zeng, Y.; Wei, Z.; Yu, W.; Yin, R.; Yuan, Y.; Li, B.; Tang, Z.; Lu, Y.; Yang, Y. Spatial transcriptomics prediction from histology jointly through transformer and graph neural networks. Briefings Bioinform. 2022, 23, bbac297. [Google Scholar] [CrossRef] [PubMed]
- Jia, Y.; Liu, J.; Chen, L.; Zhao, T.; Wang, Y. THItoGene: A deep learning method for predicting spatial transcriptomics from histological images. Briefings Bioinform. 2024, 25, bbad464. [Google Scholar] [CrossRef]
- Niu, Y.; Liu, J.; Zhan, Y.; Shi, J.; Zhang, D.; Machado, I.; Crispin-Ortuzar, M.; Li, C.; Gao, Z. ST-Prompt Guided Histological Hypergraph Learning for Spatial Gene Expression Prediction. arXiv 2025, arXiv:2503.16816. [Google Scholar] [CrossRef]
- Li, B.; Zhang, Y.; Wang, Q.; Zhang, C.; Li, M.; Wang, G.; Song, Q. Gene expression prediction from histology images via hypergraph neural networks. Briefings Bioinform. 2024, 25, bbae500. [Google Scholar] [CrossRef]
- Yang, Y.; Hossain, M.Z.; Stone, E.A.; Rahman, S. Exemplar guided deep neural network for spatial transcriptomics analysis of gene expression prediction. In Proceedings of the IEEE/CVF Winter Conference on Applications of Computer Vision, Waikoloa, HI, USA, 2–7 January 2023; pp. 5039–5048. [Google Scholar] [CrossRef]
- Yang, Y.; Hossain, M.Z.; Stone, E.; Rahman, S. Spatial transcriptomics analysis of gene expression prediction using exemplar guided graph neural network. Pattern Recognit. 2024, 145, 109966. [Google Scholar] [CrossRef]
- Liu, Z.; Qian, S.; Xia, C.; Wang, C. Are transformer-based models more robust than CNN-based models? Neural Netw. 2024, 172, 106091. [Google Scholar] [CrossRef]
- Hatamizadeh, A.; Kautz, J. Mambavision: A hybrid mamba-transformer vision backbone. arXiv 2024, arXiv:2407.08083. [Google Scholar] [CrossRef]
- Chung, Y.; Ha, J.H.; Im, K.C.; Lee, J.S. Accurate Spatial Gene Expression Prediction by Integrating Multi-Resolution Features. In Proceedings of the 2024 IEEE/CVF Conference on Computer Vision and Pattern Recognition (CVPR), Seattle, WA, USA, 16–22 June 2024; pp. 11591–11600. [Google Scholar] [CrossRef]
- Chen, C.; Zhang, Z.; Tang, P.; Liu, X.; Huang, B. Edge-relational window-attentional graph neural network for gene expression prediction in spatial transcriptomics analysis. Comput. Biol. Med. 2024, 174, 108449. [Google Scholar] [CrossRef]
- Andersson, A.; Larsson, L.; Stenbeck, L.; Salmén, F.; Ehinger, A.; Wu, S.Z.; Al-Eryani, G.; Roden, D.; Swarbrick, A.; Borg, Å.; et al. Spatial deconvolution of HER2-positive breast cancer delineates tumor-associated cell type interactions. Nat. Commun. 2021, 12, 6012. [Google Scholar] [CrossRef] [PubMed]
- Gu, A.; Dao, T. Mamba: Linear-time sequence modeling with selective state spaces. arXiv 2023, arXiv:2312.00752v2. [Google Scholar] [CrossRef]
- Li, Y.; Yuan, G.; Wen, Y.; Hu, J.; Evangelidis, G.; Tulyakov, S.; Wang, Y.; Ren, J. Efficientformer: Vision transformers at mobilenet speed. Adv. Neural Inf. Process. Syst. 2022, 35, 12934–12949. [Google Scholar] [CrossRef]
- Vaswani, A. Attention is all you need. arXiv 2017, arXiv:1706.03762. [Google Scholar] [CrossRef]


| Genes | EfficientFormer | MambaVision | EMGP-Net-noAttn | EMGP-Net |
|---|---|---|---|---|
| Gene 1 | 0.7777 (PTMA) | 0.8049 (B2M) | 0.7791 (PTMA) | 0.7903 (PTMA) |
| Gene 2 | 0.7746 (B2M) | 0.7763 (GNAS) | 0.7768 (B2M) | 0.7843 (GNAS) |
| Gene 3 | 0.7661 (GNAS) | 0.7674 (PTMA) | 0.7700 (GNAS) | 0.7777 (B2M) |
| Gene 4 | 0.7266 (HNRNPA2B1) | 0.7363 (TPT1) | 0.7356 (TPT1) | 0.7532 (HNRNPA2B1) |
| Gene 5 | 0.7245 (TPT1) | 0.7198 (HNRNPA2B1) | 0.7331 (HNRNPA2B1) | 0.7360 (TPT1) |
| Gene 6 | 0.7075 (ACTG1) | 0.7089 (HLA-DRA) | 0.7271 (ACTG1) | 0.7339 (XBP1) |
| Gene 7 | 0.6965 (XBP1) | 0.7042 (ACTG1) | 0.7237 (XBP1) | 0.7318 (ACTG1) |
| Gene 8 | 0.6964 (HLA-DRA) | 0.7032 (HLA-B) | 0.7005 (HLA-B) | 0.7228 (HLA-B) |
| Gene 9 | 0.6938 (CD24) | 0.7010 (XBP1) | 0.6959 (HLA-DRA) | 0.7122 (TMSB10) |
| Gene 10 | 0.6929 (HLA-B) | 0.6921 (COX6C) | 0.6951 (ACTB) | 0.7085 (DDX5) |
| Gene 11 | 0.6868 (TMSB10) | 0.6832 (VMP1) | 0.6873 (TMSB10) | 0.7056 (HLA-DRA) |
| Gene 12 | 0.6859 (DDX5) | 0.6809 (ACTB) | 0.6826 (TUBA1B) | 0.7020 (ACTB) |
| Gene 13 | 0.6839 (ACTB) | 0.6789 (PSMB4) | 0.6826 (COX6C) | 0.7016 (S100A11) |
| Gene 14 | 0.6834 (S100A11) | 0.6780 (NACA) | 0.6799 (DDX5) | 0.7002 (CD24) |
| p-value | 0.0001 (<0.05) | 0.0009 (<0.05) | 0.0001 (<0.05) | N/A |
| Genes | ST-Net | GeNetFormer | EMGP-Net |
|---|---|---|---|
| Gene 1 | 0.6708 (GNAS) | 0.7069 (DDX5) | 0.7145 (ERBB2) |
| Gene 2 | 0.6592 (RPL23) | 0.6510 (ACTG1) | 0.7051 (ACTG1) |
| Gene 3 | 0.6503 (PTPRF) | 0.6384 (CPB1) | 0.7047 (CALR) |
| Gene 4 | 0.6460 (ACTG1) | 0.6235 (PTMA) | 0.6973 (RPL23) |
| Gene 5 | 0.6406 (DDX5) | 0.6130 (RPL23) | 0.6962 (GNAS) |
| Gene 6 | 0.6325 (PRDX1) | 0.5974 (PTPRF) | 0.6894 (PSMD3) |
| Gene 7 | 0.6274 (TAGLN2) | 0.5943 (GNAS) | 0.6867 (PTPRF) |
| Gene 8 | 0.6273 (CALR) | 0.5864 (CALR) | 0.6842 (TMSB10) |
| Gene 9 | 0.6235 (HSPB1) | 0.5840 (HSPB1) | 0.6835 (GAPDH) |
| Gene 10 | 0.6201 (PTMA) | 0.5701 (TMSB10) | 0.6814 (TAGLN2) |
| Gene 11 | 0.6144 (CPB1) | 0.5638 (TAGLN2) | 0.6724 (DDX5) |
| Gene 12 | 0.6027 (NHEERF1) | 0.5344 (P4HB) | 0.6645 (HSPB1) |
| Gene 13 | 0.5908 (ENSG00000203812) | 0.5307 (PRDX1) | 0.6588 (PTMA) |
| Gene 14 | 0.5749 (HLA-DRA) | 0.5250 (KRT19) | 0.6563 (KRT19) |
| p-value | 0.0001 (<0.05) | 0.0001 (<0.05) | N/A |
| Genes | ST-Net | GeNetFormer | EMGP-Net |
|---|---|---|---|
| Gene 1 | 0.6719 (ATP5E) | 0.6746 (ATP5E) | 0.7285 (ERBB2) |
| Gene 2 | 0.6620 (ERBB2) | 0.6434 (S100A11) | 0.6686 (S100A11) |
| Gene 3 | 0.6374 (S100A11) | 0.6141 (ERBB2) | 0.6650 (ATP5E) |
| Gene 4 | 0.6227 (PTPRF) | 0.6115 (PTPRF) | 0.6404 (HSP90B1) |
| Gene 5 | 0.5918 (LGALS3) | 0.5986 (HSP90B1) | 0.6347 (LGALS3) |
| Gene 6 | 0.5903 (HSP90B1) | 0.5967 (CST3) | 0.6262 (CD24) |
| Gene 7 | 0.5880 (CST3) | 0.5572 (ACTG1) | 0.6049 (PTPRF) |
| Gene 8 | 0.5812 (KRT19) | 0.5449 (MYH9) | 0.5927 (FN1) |
| Gene 9 | 0.5750 (PSMB4) | 0.5400 (PSMB4) | 0.5905 (PTMA) |
| Gene 10 | 0.5662 (GNAS) | 0.5393 (LGALS3) | 0.5832 (FTH1) |
| Gene 11 | 0.5353 (EEF2) | 0.5384 (KRT19) | 0.5763 (PSMB4) |
| Gene 12 | 0.5317 (ACTG1) | 0.5310 (CD24) | 0.5726 (ACTB) |
| Gene 13 | 0.5301 (IGLC2) | 0.5293 (FTH1) | 0.5642 (MYH9) |
| Gene 14 | 0.5287 (LASP1) | 0.5185 (COL1A2) | 0.5465 (GNAS) |
| p-value | 0.0001 (<0.05) | 0.0001 (<0.05) | N/A |
| Gene | EfficientFormer | MambaVision | EMGP-Net-noAttn | EMGP-Net |
|---|---|---|---|---|
| PTMA | 0.7777 | 0.7674 | 0.7791 | 0.7903 |
| GNAS | 0.7661 | 0.7763 | 0.7700 | 0.7843 |
| B2M | 0.7746 | 0.8049 | 0.7768 | 0.7777 |
| HNRNPA2B1 | 0.7266 | 0.7198 | 0.7331 | 0.7532 |
| TPT1 | 0.7245 | 0.7363 | 0.7356 | 0.7360 |
| XBP1 | 0.6965 | 0.7010 | 0.7237 | 0.7339 |
| ACTG1 | 0.7075 | 0.7042 | 0.7271 | 0.7318 |
| HLA-B | 0.6929 | 0.7032 | 0.7005 | 0.7228 |
| HLA-DRA | 0.6964 | 0.7089 | 0.6959 | 0.7056 |
| ACTB | 0.6839 | 0.6809 | 0.6951 | 0.7020 |
| Gene | ST-Net | GeNetFormer | EMGP-Net |
|---|---|---|---|
| ACTG1 | 0.6460 | 0.6510 | 0.7051 |
| CALR | 0.6273 | 0.5864 | 0.7047 |
| RPL23 | 0.6592 | 0.6130 | 0.6973 |
| GNAS | 0.6708 | 0.5943 | 0.6962 |
| PTPRF | 0.6503 | 0.5974 | 0.6867 |
| TAGLN2 | 0.6274 | 0.5638 | 0.6814 |
| DDX5 | 0.6406 | 0.7069 | 0.6724 |
| HSPB1 | 0.6235 | 0.5840 | 0.6645 |
| PTMA | 0.6201 | 0.6235 | 0.6588 |
| Gene | ST-Net | GeNetFormer | EMGP-Net |
|---|---|---|---|
| ERBB2 | 0.6620 | 0.6141 | 0.7285 |
| S100A11 | 0.6374 | 0.6434 | 0.6686 |
| ATP5E | 0.6719 | 0.6746 | 0.6650 |
| HSP90B1 | 0.5903 | 0.5986 | 0.6404 |
| LGALS3 | 0.5918 | 0.5393 | 0.6347 |
| PTPRF | 0.6227 | 0.6115 | 0.6049 |
| PSMB4 | 0.5750 | 0.5400 | 0.5763 |
Disclaimer/Publisher’s Note: The statements, opinions and data contained in all publications are solely those of the individual author(s) and contributor(s) and not of MDPI and/or the editor(s). MDPI and/or the editor(s) disclaim responsibility for any injury to people or property resulting from any ideas, methods, instructions or products referred to in the content. |
© 2025 by the authors. Licensee MDPI, Basel, Switzerland. This article is an open access article distributed under the terms and conditions of the Creative Commons Attribution (CC BY) license (https://creativecommons.org/licenses/by/4.0/).
Share and Cite
Thâalbi, O.; Akhloufi, M.A. EMGP-Net: A Hybrid Deep Learning Architecture for Breast Cancer Gene Expression Prediction. Computers 2025, 14, 253. https://doi.org/10.3390/computers14070253
Thâalbi O, Akhloufi MA. EMGP-Net: A Hybrid Deep Learning Architecture for Breast Cancer Gene Expression Prediction. Computers. 2025; 14(7):253. https://doi.org/10.3390/computers14070253
Chicago/Turabian StyleThâalbi, Oumeima, and Moulay A. Akhloufi. 2025. "EMGP-Net: A Hybrid Deep Learning Architecture for Breast Cancer Gene Expression Prediction" Computers 14, no. 7: 253. https://doi.org/10.3390/computers14070253
APA StyleThâalbi, O., & Akhloufi, M. A. (2025). EMGP-Net: A Hybrid Deep Learning Architecture for Breast Cancer Gene Expression Prediction. Computers, 14(7), 253. https://doi.org/10.3390/computers14070253