Abstract
In this work, an innovative process chain is set up for the regular provision of fertilization consultation services to farmers for a variety of crops, within a precision agriculture framework. The central hub of this mechanism is a geographic information system (GIS), while a 5 × 5 m point grid is the information carrier. Potential data sources include soil samples, satellite imagery, meteorological parameters, yield maps, and agronomic information. Whenever big data are available per crop, decision-making is supported by machine learning systems (MLSs). All the map data are uploaded to a farm management information system (FMIS) for visualization and storage. The recipe maps are transmitted wirelessly to variable rate technologies (VRTs) for applications in the field. To a large degree, the process chain has been automated with programming at many levels. Currently, four different service modules based on the new process chain are available in the market.
1. Introduction
Lately, precision agriculture has gained significant ground over traditional farming practices. The global precision farming market size was estimated at USD 11.67 billion in 2024 and is anticipated to grow at a compound annual growth rate of 13.1% from 2025 to 2030. Especially with regard to the services segment, it is anticipated to have a compound annual growth rate of 15.7%; the software segment will grow by over 15.5% during the same period [1].
Precision agriculture (or precision farming) aims at providing spatial information, enabling growers to make more precise management decisions [2]. For example, if nutrient variability within parcels, along with variation in the physical properties of the soil, are properly detected, this will allow variable treatment applications, optimizing nutrient supply to the crops and maximizing yields. Parcel segmentation takes place by matching zones within the parcel with particular requirements with different management treatments (Whelan & Taylor). In a simplified manner, precision agriculture is defined as the management practice that satisfies the needs of crops through differential applications in terms of location, time, and processes.
Despite the optimistic perspective, however, there is still a serious delay in the adoption of precision agriculture services by farmers across the world. This is partially because much of the research on PA adoption evaluates technologies independently without considering how farmers often pool complementary tools to create overarching PA systems. Failure to examine PA collectively provides an incomplete picture of the benefits of PA adoption [3]. For example, Schimmelpfennig and Ebel (2016) [4] have indicated that adopting VRT alone does not generate variable cost savings, but that it does if bundled with yield monitoring and soil mapping.
Furthermore, the advantages of integrating complementary technologies to improve productivity and input efficiency (even if they are applied) are eliminated if the potential adopters are not supported by dedicated service providers. The farmers alone do not have the necessary scientific or technical background—nor time availability—to carry out highly demanding data collection or analytical procedures. Having recognized this problem, the Common Agricultural Policy of the European Union has indicated the necessity of an ‘Advisory Service’ role in the agricultural chain [5].
Recently, two works have highlighted the potential of waiving farmers’ limitations in accessing the full potential of precision agriculture, which thus would facilitate its adoption:
- Iatrou et al. (2021) introduced machine learning systems (MLSs) in predictive modeling for nitrogen topdressing fertilization in rice cultivation using big data collected from a variety of data sources [6].
- Karydas et al. (2023a) achieved embedding data exchange and visualization modules for the precision fertilization of different crop types in a pre-existing farm management information system (FMIS) [7].
The former work offered a paradigm of a holistic approach in the most common precision farming practice, fertilization, while the latter work demonstrated the possibility of providing consultancy services from the experts to the farmers through a fully interactive approach.
The main aim of this work was to set up a process chain for the regular provision of fertilization consultation services to farmers, within a precision agriculture framework, for any type of crops. A process chain is a sequence of processes that wait in the background for an event; some of these processes trigger a separate event that can start other processes in turn [8].
Τhe process chain was designed with a view to meeting two principles:
- Generality, in terms of being used under different farming conditions, data availability, technological restrictions, and agronomic limitations.
- Flexibility, in terms of keeping the potential for changes at the process or interface level, for improvements of any service component, and for adaptation to new requirements and needs.
The above principles in combination allow for the integration of all possible precision agriculture technologies and methodologies in a holistic manner, as well as the possibility for the farmers to be part of the consultancy process in an open and understandable way.
The paradigm of this work is limited to fertilization. The design of the process chain, however, offers full potential for expansion to other farming practices.
2. Study Area
The process chain was set up through an interactive approach: the availability of few parcels at the beginning allowed for the development and testing of the service under true operational conditions, and throughout the process, successful precision agriculture applications attracted new farmers, which in turn contributed more data and feedback.
As a result, a total number of 1094 different parcels cultivated with nine different crops and covering an overall extent of 2667 hectares throughout mainland Greece were collected gradually over a period of ten consecutive years (2016–2025) (Figure 1).
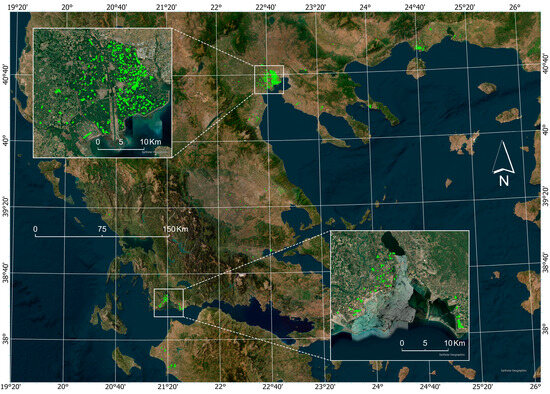
Figure 1.
Locations of the parcels (dispersed throughout mainland Greece), used for the setup of the new precision agriculture process chain; close view of two areas: Axios river plain and Acheloos-Evinos river plain in the top and bottom map insets, respectively.
A big portion of the parcels (about 67% of the total surface) were rice paddies; rice is one of the most intensive and mechanized crops in the country. Other arable crops included cotton, maize, wheat, and tomatoes. The tree plantations included olives, cherries, and kiwis. Noticeable numbers of vines for either wine or edible grapes were also included (Table 1).

Table 1.
Number of parcels that used the developed service and total surface area per crop.
A small portion of the surface area (15.8%) used for process chain development became available through some research projects funded by third parties (for details, see the “Funding” paragraph). The crops that were mostly related to the research activities were wheat, tomatoes, olives, vines, and cherries, whereas, rice, maize, cotton, and kiwis were mostly related to the market.
3. Data and Methods
3.1. Overall
The process chain of the precision fertilization service has been technologically arranged into data and process hubs, organized around a geographic information system (GIS). A GIS is a computer system that collects, processes, organizes, analyzes and displays geographically referenced information [9].
The ability of GISs to analyze and visualize agricultural environments and workflows has proven to be very beneficial to the farming industry. Balancing the inputs and outputs of a farm is fundamental to its success and profitability.
Eight different hubs have been recognized, each of which has been assigned a specific role (Figure 2):
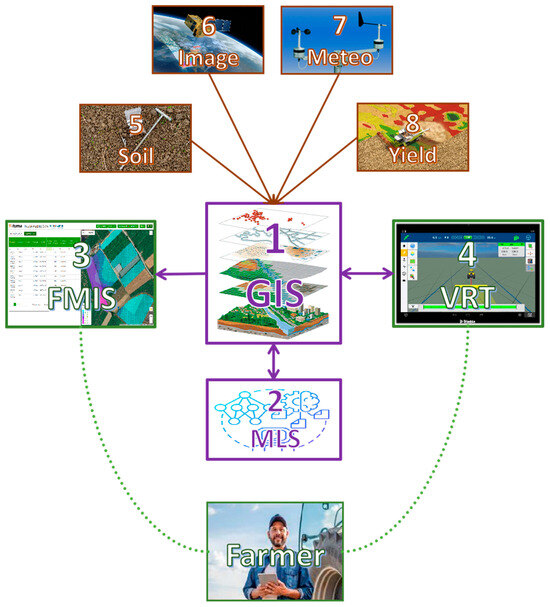
Figure 2.
The overall technological arrangement of the process chain, comprising eight different hubs (numbers link them with their description). These hubs are organized into three distinct components, discriminated by different colors: purple for the Process Component, green for the Farmer Component, and brown for the Data Component.
- The geographic information system (GIS) hub is where data from multiple sources are collected, ingested, and processed. From the GIS, the data may be transferred to a machine learning system (MLS) for analysis, while the output map data are exported to the following: (a) a farm management information system (FMIS) for storage and visualization or (b) variable rate technologies (VRTs) for application;
- The machine learning system (MLS) hub is where big data analysis with the following aims takes place: (a) developing prediction models for crop fertilization and (b) running the models for the applications. The MLS exchanges data exclusively with the GIS hub;
- The farm management information system (FMIS) hub is where the farmers can access their data, while they can also exchange data with the service managers; FMIS is the farmers’ interface to the service;
- The variable rate technologies (VRTs) hub (or application hub) is where the fertilization maps are transmitted from the GIS hub, for the applications;
- The soil data hub is where the soil properties required for crop nutrition assessments are extracted and measured from soil samples;
- The image data hub is where the required information for crop growth monitoring is extracted from earth observation data;
- The meteorological (or meteo) data hub is where weather record and anomaly predictions are collected to feed advanced fertilization prediction models;
- The yield data hub is where production data from different sources are collected for feeding advanced fertilization prediction models and for productivity assessments.
The different hubs described above can be organized according to their role into three distinct methodology components, namely the following:
- The Process Component, containing GIS and MLS hubs;
- The Farmer Component, containing the FMIS and VRT hubs;
- The Data Component, containing the soil, image, meteorological, and yield hubs.
Finally, three distinct sub-processes can be recognized in the arrangement in the process chain, according to their purpose, specifically the following:
- The Consultancy sub-process, targeting producing fertilization recipes derived from the prediction model runs per crop and growth stage. This sub-process groups GIS, MLS, and all the available data types (soil, imagery, meteorological, yield, agronomic, etc.) into a data processing and analysis entity;
- The Communication sub-process, targeting exchanging and visualizing the mapped data through an appropriate cloud-based platform. This sub-process takes place between the GIS and the FMIS, supporting data exchange and communication between the consultancy team and the farmers;
- The Application sub-process, targeting transferring fertilization maps to the application machinery using the appropriate data structures and formats. This sub-process is associated with the available agricultural machinery and equipment and alternative solutions provided by the consultancy team, dictated by farmer’s possible limitations.
The Consultancy process can be considered an internal process, as it takes place without any interference from the farmers. On the other hand, the Communication and Application processes may be considered external ones, because they are associated with the access and use of the outputs by the farmers. The overall process is described in a clear, integrated, and easy-to-follow protocol.
Furthermore, the analytical core of the Consultancy sub-process consists of predictive fertilization models (hereafter, ‘F-models’) developed to support consultancy on the fertilization of different crops. In their first stages of development, F-models remain simple and organized within the GIS, using their plethora of analytical capabilities. At the later stages, when the data set increases adequately, the F-models may use MLSs for advanced solutions.
3.2. GIS Hub
The GIS hub consists of the following: (a) two pieces of software, (b) a geodatabase, (c) the F-models, and (d) the specialists (people).
For the organization of the entire geodatabase and spatial analysis, ArcGIS Pro was selected as the main GIS tool. ArcGIS Pro 3.1.2 is a particularly friendly package, especially with regard to raster data processing and analysis. However, several tasks were found to be either easier or even necessary to carry out in QGIS, which is an open and free of charge full GIS software package. QGIS has been proven to manipulate the KML format better, which is required by the process chain. In addition to that, QGIS was found to be necessary in cases where the license of a specific command was missing from ArcGIS Pro.
The geodatabase was organized according to the parameters crop, year, and process, in a hierarchical structure. The processes are ordered temporally: soil maps–nutrient needs–fertilizer applications–monitoring–yield–profitability.
F-models consist of a series of procedures for carrying out fertilization consultancy for different crops. The core of these procedures takes place within the GIS, where they are described in detailed protocols. The F-models are as many as the different crops supported.
The GIS incorporates people by default, such as GIS operators and analysts, image analysts and photointerpreters, and data analysts. People are still irreplaceable for a series of management, processing, and analytical tasks; for example, data quality assurance, data ingestion and filtering, option of an appropriate analysis method, geometric corrections, selection of appropriate map projection systems, data re-scaling, etc.
Putting a geographic information system (GIS) in the role of the central hub of the process chain was necessary for the activities described below:
- Data collection, transformation, and analysis of all data types and origins (vector data, raster data, tabular data, historic records, etc.);
- Soil sampling design and preliminary zone delineation, according to detected variability in remote sensing or yield data;
- The ingestion of heterogeneous data, including reprojection, geometry repair, merging, unit conversions, filtering, cleansing, and calibration;
- Adaptation to farmer requirements and limitations, such as the extraction of particular spectral indices or alternative solutions where there is no available machinery, etc.;
- The scaling up and integration of data from different farmers for conducting studies on soil sustainability or yield performance and profitability in an entire area.
A 5 × 5 m point grid was created to be the information carrier of the process chain; thus, the spatial resolution of the service was set to 5 m (Figure 3). A 5 m cell size for all data layers was found to be necessary and efficient for precision agriculture applications for the majority of farming practices; exceptions could be applications functioning at the plant scale, e.g., spraying on a plant or leaf scale. The service’s resolution, however, can change by creating a new grid and transferring the entire dataset from the old to the new grid by scaling up or down.
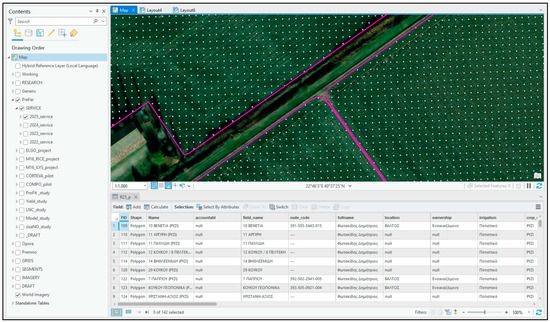
Figure 3.
An indicative snapshot of the ArcGIS interface: the list of the geodatabase layers grouped (left), the mapping environment (up, here showing the 5 × 5 m grid inside parcels, denoted by pink polygons), and some tabular data (bottom).
The CSV file format has been used for data analysis by the MLS, data exchange between the GIS and MLS, and map data transfer from the GIS to FMIS. The possibility of unlimited volume data in a CSV file is a great advantage for big data analysis, as is data visualization and storage in farm management platforms.
3.3. MLS Hub
Whenever the data cubes of a specific crop reach big data numbers, F-models may incorporate machine learning systems (MLSs) for the analysis of these data.
Machine learning is a branch of artificial intelligence (AI) focused on building applications that learn from data and experience, thus improving their accuracy in their decision-making capabilities over time. Machine learning algorithms are trained to find patterns and features in massive amounts of data to make decisions and predictions based on new data [10].
The MLS hub of the process chain comprises the following: (a) software, (b) programming languages, (c) open-access mathematical libraries, and (d) the model parameters.
The XGBoost, CatBoost, and LightGBM algorithms [11,12,13] were used for developing the service’s prediction model for rice crop topdressing fertilization [14].
Matplotlib (version 3.8.1) and Seaborn (version 0.13.0) were used to make visualizations [15,16,17]. The SHAP library was used for constructing visualizations of feature importance and SHAP dependence plots. Data analysis, model construction, and visualizations were carried out using Python [17].
The most advanced example of an F-model developed with MLS was the one for rice crop topdressing fertilization. The latest update of this model indicated seventeen significant input parameters from an original pool of about forty parameters (Table 2) [14].
Table 2.
The parameters indicated as significant in the latest update of the F-model for topdressing fertilization of rice.
3.4. FMIS Hub
Data exchange and communication between the consultancy team and the farmers is performed exclusively using a commercial Farm Management Information System (FMIS), namely the ifarma platform. The FMIS hub of the process chain comprises the following: (a) the ifarma platform, (b) the agronomic data, and (c) the map data.
Farm Management Information Systems (FMISs) are tools based on Information Communication Technology (ICT) for the decision support of farmers with regard to their farm operations [18].
The ifarma FMIS is able to handle multiple farms, where all assets such as crops, parcels, tasks, and inputs belong. The data model of ifarma integrates all the information relevant to farms: parcels, crops, farming activities on parcels, as well as inputs and resources used to plan and execute these activities, organized in a hierarchical manner, where the farm is at the top level [19].
Parcel boundaries and other agronomic data can be taken from the Land Parcel Identification System (LPIS) of the country. It must be noted, however, that many times, the true parcel boundaries may differ significantly from those recorded in the LPIS, as most of the farmers merge adjacent parcels of land to create bigger cultivated surfaces. As an alternative, parcel boundaries can be digitized in the GIS and then transferred to ifarma.
Four add-on service modules have been developed and embedded into the ifarma FMIS, operating autonomously. In parallel, the farmers have the possibility to take advantage of the broader management facilities offered by ifarma [7].
All the modules embedded in ifarma follow the same principles and architecture. Agronomic information, such parcel boundaries, varieties, farming practices, and critical dates, etc., is exchanged between the GIS and FMIS in the KML format, while map data are uploaded from the geodatabase to the FMIS as CSV files. They differentiate only for organization and marketing reasons (Figure 4).
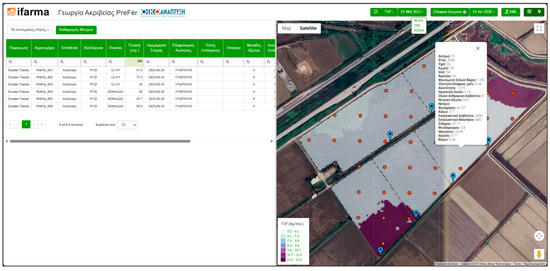
Figure 4.
An indicative view of the mapping environment of the PreFer module, embedded in the ifarma PC application, showing an example of a fertilizer application map with the soil samples overlaid; different colours correspond to variable rates of fertilizer, while orange dots correspond to the locations of the soil samples.
A demonstrative tour on PreFer and ProFit service modules of ifarma is provided on the following URL address: https://ifarmaweb.agrostis.gr/MIS/#/ (accessed date 1 April 2025) with the credentials: Username: prefer_10 and Password: prefer.
3.5. VRT Hub
Variable rate technology (VRT) is one of the pillars of precision agriculture, through which farmers vary the application rates of inputs to maximize crop output and minimize resource waste. When the rates are provided by a preliminary generated prescription map—as in this work—the method is called map-based [20].
The VRT hub of the process chain comprises the following: (a) ground VRT distributors, operated solely by the farmers, (b) multi-rotor aerial vehicles for spreading trace element fertilizers, operated by the service personnel, and (c) the application maps, transmitted from the GIS hub.
Four different types of variable rate technologies have been used by eight farmers for the application of the fertilization maps over the years. Each of the VRT systems employed in this work, however, has revealed several particularities with regard to importing the application maps created within the GIS environment. The particularities may concern the name or the structure of the application maps, the contained parcels, the name and arrangement of the computer files or the containing folders, as well as the map projection or coordinate system.
As it is understood, interoperability issues were the most serious technological obstacles in VRT applications. Furthermore, in many cases, the vendors of the machinery were not in a position to support the farmers in order to carry out smooth applications.
3.6. Soil Hub
The soil hub comprises the following: (a) the soil sampling design, (b) the surveys for soil sample collection, (c) the laboratory where the samples are sent for treatment and analysis, and (d) the measured soil properties.
According to the underlying methodology of the process chain, the soil is mapped from samples extracted in situ using the appropriate sampling scheme for every case. Usually, in the first attempts at soil mapping a parcel, the stratified sampling scheme is adopted; according to this scheme, the parcel is divided into zones following an object-based classification of satellite images acquired from previous seasons. In the later stages of crop monitoring, regular grid sampling may be followed in order to complement or intensify the original sampling network.
The soil sampling surveys are conducted by the field team of Ecodevelopment S.A. This team is trained to follow a detailed and strict protocol, as soil information is considered to be highly critical for fertilization consultancy at all crop growth stages. Following the same protocol, the soil samples are transferred and analyzed exclusively in the Soil and Water Resource Institute of the Hellenic Agricultural Organization (ELGO-DIMITRA), seated in Thessaloniki, Greece.
A total of 2333 soil samples have been extracted and eighteen soil properties were measured in every soil sample (exceptions were some repetitive samples), from which surface maps were created with interpolation for each of the measured properties. The average density of the soil samples is one sample per 1.04 hectares (Figure 5).
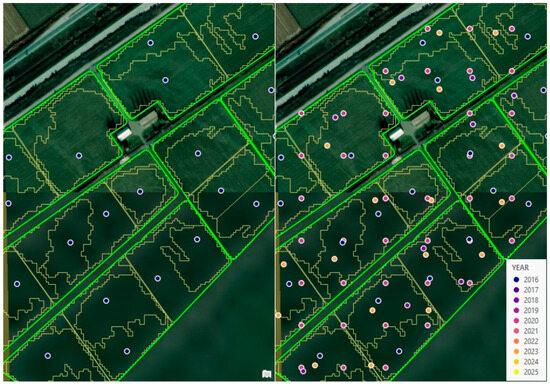
Figure 5.
An indicative close view of the soil sampling schemes evolving over time (2016–2025); left side: targeted soil sampling of 2016 (the original within-parcel zone delineation is denoted by yellow polygons); right side: soil samples of all years; borders are in green.
Eighteen (18) soil properties are regularly measured: soil texture, bulk density, soil acidity (pH), organic matter, total calcium carbonate, electric conductivity, nitrate nitrogen, phosphorus, potassium, calcium, magnesium, iron, zinc, copper, and boron, and, if necessary, some additional elements may be measured. The soil samples are mechanically crumbled, air-dried, and sieved with a 2 mm sieve. Soil analyses follow the international protocols (for more details, see [21]).
3.7. Image Hub
The process chain uses earth observation imagery from different sources, mainly satellite or air-borne. The image hub comprises the following: (a) satellite image data collection platforms, (b) image analysis algorithms, either embedded in software packages or contained in the GIS software, (c) image analysts (people), and (d) the unmanned aerial vehicles (UAVs) group, for designing and executing UAV flights and pre-processing the captured image data.
Satellite imagery is used for a two-fold purpose:
- The delineation of preliminary zones for soil sampling design with object-based image classification and occasionally, visual photointerpretation; the preliminary zones may change over time [22].
- Regular plant growth monitoring with spectral indices, specific for every crop; for example, the Leaf Nitrogen Concentration (LNC) index is used for nitrogen uptake in rice; the Modified Chlorophyll Absorption Reflectance Index (MCARI) is used for cotton growth; the Red-Edge Normalized Difference Vegetation Index (reNDVI) for maize growth; the Leaf Area Index (LAI) and Green Leaf Index (GLI) for monitoring tree plantations; the Normalized Difference Vegetation Index (NDVI) and Normalized Difference Red-Edge index (NDRE) are employed to monitor crop biomass at early and late growth stages, respectively; and the Shortwave Infrared Water Stress Index (SIWSI) and Global Vegetation Moisture Index (GVMI) are used for monitoring water stress and vegetation moisture, respectively [23].
For both purposes, freely and regularly available Sentinel-2 imagery offers an ideal data source. The Sentinel-2 spatial resolution (10, 20, or 60 m) is appropriate for detecting the within-parcel heterogeneity, while the less than 20 m resolution satisfies the requirements for VRT devices, as the operational fertilization width usually exceeds 20 m. The Synthetic Aperture Radar (SAR) data type of Sentinel-1 imagery is appropriate for monitoring crop growth at early stages.
For downloading satellite image data, Google Earth Engine (GEE) was selected as an appropriate computational cloud-based platform; GEE accesses and processes petabyte quantities of remotely sensed data on a worldwide scale. GEE employs JavaScript-based language and geospatial Python libraries to preprocess earth observation data [24].
Two scripts have been written for downloading the index values of preference at the predefined locations of every year’s grid: one for the optical and one for the SAR data. Alternatively, Sentinel images can be downloaded as complete scenes from the Copernicus Data Space Ecosystem/Sentinel Hub [25] (Figure 6).
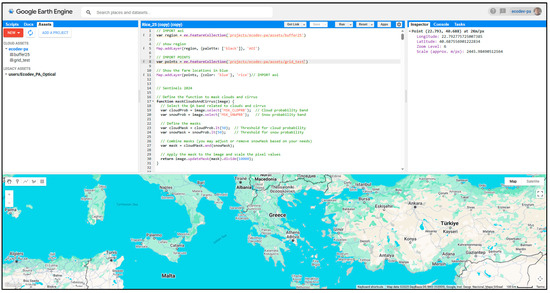
Figure 6.
A view of the Google Earth Engine environment, with the necessary scripts and assets loaded for obtaining the required satellite data for running the F-model for rice.
The unmanned aerial vehicles (UAVs) group consists of an adequate number of licensed operators with all the necessary equipment for designing and carrying out the smooth execution of UAV flights in any agricultural area of Greece. The group manages several types of UAVs, such as fixed-wing and multi-rotor vehicles, for cartographic and spraying purposes, respectively [26]. The currently available UAVs may carry RGB or multispectral cameras.
3.8. Meteorological Hub
The meteorological (meteo) hub uses two platforms, each of them for different purposes:
- The Google Earth Engine (GEE) platform, for downloading daily weather records at critical periods for crops and at a spatial resolution of 0.1 degrees [24]. The original source of the temperature records is the European Centre for Medium-range Weather Forecasts (ERA5 satellite), while the precipitation data are obtained from the integrated multi-satellite GPM (IMERG) gridded precipitation repository [27]. The script written for these data has been merged with the script written for downloading the Sentinel image indices, as both datasets concern the same locations.
- The Copernicus Climate Data Store, for downloading seasonal forecast anomalies in critical periods for the crops at a 9 km spatial resolution on a monthly step. These data are exported in the NetCDF format and are inserted to the GIS accordingly [28,29].
The exact set of the required meteorological parameters and their necessary temporal resolution have evolved over time, according to the findings during F-model development and improvement with machine learning systems (MLSs) [14].
Meteorological data are used mostly for the topdressing fertilization of arable crops, such as rice, cotton, or maize. The potential of these data lies in the fact that by knowing about possible extremes in advance, the fertilization strategy can be adapted so as to overcome harmful effects.
3.9. Yield Hub
Yield data from crops have been collected or estimated either (a) with yield monitors mounted on harvesters, (b) in situ, with manual harvesting at sample locations, or (c) from earth observation imagery with regression analysis and sample in situ measurements.
Yield monitors are available usually for arable crops, such as cereals, vegetables, or cotton; however, in other crops, such as tree plantations, vines, or vegetables, they are not widespread yet.
In all cases, however, the management of yield data consists of three consecutive steps:
- Data collection, including recording them in the field, transferring them, and inserting them into a geographic information system (GIS);
- Data ingestion, including possible geometry repair (when sourced from yield monitors), merging (when from different sources), homogenization (matching common properties, unit conversion, etc.), filtering (e.g., excluding values affected by unknown factors), cleansing (removal of abnormal values), and calibration (matching with in situ measurements);
- Data analysis, including descriptive statistics, correlation analysis (with other data types), and spatial auto-correlation (for spatial pattern recognition and classification).
4. Results and Discussion
4.1. Service History
The process chain started being developed in 2016, originally for rice cultivation, in a parcel complex of about 97 hectares owned by a single farmer. In the first year, the within-parcel heterogeneity was detected using RapidEye satellite imagery from the previous year (2015), acquired on three dates during the growing season, while some drone images supported further delineation [22]. Then, a soil survey was conducted based on the spatial patterns of the detected heterogeneity.
The fertilization recipes of 2016 were based on the soil analysis results using commercial software, namely SMART (http://www.smart-fertilizer.com/, 1 April 2025) [22]. However, the application zones were simplified into rectangles, so as to approximate the original preliminary zone delineation, with the mean zone size at 1.38 hectares. The applications were made manually, as there were no VRT systems available to the farmer at the time.
This first intervention was dedicated to recognizing and correcting long-term soil management problems, such as toxic concentrations of phosphorus in some zones or resilient patches of weed infestations. This phase can be characterized as experimental.
In the second year (2017), the farmer proceeded with the full mechanization of cultivation by introducing VRT machinery for precision applications and a yield monitor for harvesting. The cultivated extent increased to 111 hectares and the zones became a little more complicated. The mean zone size was lowered to 1.33 hectares. The occasional collection of leaf samples in the two first years supported the selection of appropriate spectral indices for monitoring rice cultivation with satellite imagery. This phase can be characterized as preparatory.
In 2018, the first fertilization service module, namely PreFer, entered the market and was trusted by many rice growers in four different rice growing plains in Greece, namely the Axios river plain, Nestos river plain, Acheloos river plain, and Evinos river plain. A total of 1119 hectares was then served by the fertilization recipes prepared for every single parcel. The recipes were provided to the farmers as KML files on the Google Earth application, together with similar files for parcel boundaries and soil samples. The mean zone size dropped to 0.95 hectares, resulting from the fact that Sentinel-2 imagery was introduced systematically in zone delineation.
This phase opened the door of the market to the service. However, most of the farmers followed manual applications of the recipes, as they did not have VRT machines available at the time. For the same reason, many of these farmers interrupted the use of the service in the following years. An important asset of the expansion, however, was the massive collection of soil data from Axios river plain—the most productive rice-growing area in Europe—thus scaling up the understanding of precision agriculture with regard to soil fertility [21].
In the period 2019–2020, precision applications were expanded to other arable crops, such as cotton and maize, and permanent crops, such as olives, cherries, and vines. The zone delineation method remained polygon-based, still following the site-specific soil sampling design.
In 2021, the zone delineation method changed from a polygon-based to a grid-based one; a 30 × 30 m point grid was selected as the information carrier. This resolution was in accordance with the average application width of the agricultural machinery, such as VRT fertilizers and yield monitors. At the stage of application map creation, the points were classified according to the fertilizer values, converted to unit polygons, and then merged according to their classes to form new polygons for the VRT terminals.
The shift from polygons to points allowed for a significant increase in the data volume, which in turn allowed for the introduction of machine learning systems (MLSs) in the prediction modeling for the estimation of the optimum fertilizer amounts, especially for nitrogen topdressing fertilization. New tools were then necessary for big data collection and manipulation, such as cloud-based platforms, programming languages, and machine learning libraries [6].
In 2022, a significant step towards bridging our service with farm management through the introduction of a farm management system came into play. In practice, the PreFer service module was embedded into ifarma, thus offering a cloud-based solution for storing, listing, and visualizing a series of farming data and information in tabular or map form [7].
The latter evolution allowed for the visualization of imagery data in layers (thus simulating a GIS mapping environment), which further dictated the enhancement of the mapping resolution. As a result, a new point grid of 5 m was selected as the information carrier of the service.
In 2023, the second service module, namely ProFit, was developed as an additional service, complementing the PreFer service, for profitability evaluation and mapping. ProFit allows for the creation of maps similar to the yield maps, which indicate the profitability rates in every pixel of the cultivated surfaces in pure monetary units [30].
During the same year (2023), the Opora service (for three plantations) was developed, as a twin of the PreFer service and with some additional facilities, such as the possibility to upload UAS images. Finally, in 2024, the Premno service, an Opora twin, was developed too.
The architecture of the ProFit service is designed as a vertical service fitting with all three other horizontal crop-oriented services, i.e., PreFer, Opora, and Premno.
Throughout the entire reported period, the F-models were regularly improved whenever adequate new datasets became available. Also, there is continuous care for enhancing details of the interface, according to feedback from the farmers and other interested parties.
A summary of the evolution of the process chain and the developed service modules is given in Table 3.
Table 3.
A summary on the evolution of the process chain and service modules.
4.2. Service Architecture
The architecture of the service was designed to support and maintain generality and flexibility, the two main principles set in advance of the development of the process chain. The same architecture has been maintained up until now.
According to this architecture, the entire process of decision support is organized together with data collection, geodatabase construction, and analysis within the GIS-server, which is managed by the service provider and expert team. As a result, the farmer is not necessarily engaged with data collection, data evaluation, data filtering, data entry, or data correction procedures, something that allows for the easier use of the service by farmers and more time available for their farming practices. This approach can be called expert-based.
In different architectures, the geodatabase and the analytical tools may be found embedded on cloud-based platforms, while the farmer needs to contribute substantially to data collection without any consultancy from experts. This fact, though, may delay—or even undermine—the procedure of decision support. This approach can be called platform-based (Figure 7).
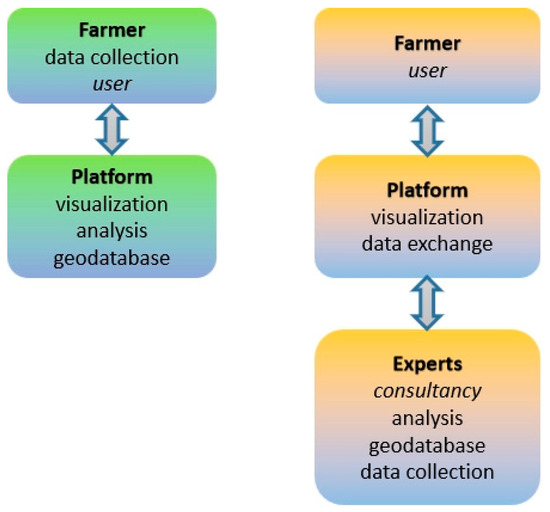
Figure 7.
The two different approaches in precision agriculture service development; left side: platform-based architecture (common approach); right-side: expert-based architecture (current approach).
In the architecture followed by all the developed services, the role of the platform is limited only to data exchange between the service provider and the farmer, and to data visualization. This discrimination empowers flexibility and service management, while it upgrades decision support to a true consultation procedure involving experts.
4.3. Service Protocol
4.3.1. Descriptors
The standardization of the process chain necessitated the compilation of a clear and strict protocol comprising distinct descriptors for each of the various sub-processes and concepts.
In an information retrieval system, a descriptor is a word or a characteristic feature used to identify an item (as a subject or document) [31]. An information retrieval system (IRS) is designed to help users search for, retrieve, and rank relevant data from large datasets; these systems are widely used in enterprise solutions among others [32].
A total of 24 protocol descriptors comprise the entire protocol, specifically the following:
- Nine (9) descriptors related to GIS processes, specifically symbols, formats, parcel layers, grid layers, soil layers, nutrient layers, fertilizer layers, VRT maps, and yield maps;
- Seven (7) descriptors related to F-model processes, specifically general instructions, scripts for broadcasting fertilization in rice, scripts for topdressing fertilization in rice, scripts for cotton fertilization, scripts for maize fertilization, database (CSV) fields, and scripts for Google Earth Engine;
- Eight (8) descriptors related to the ifarma FMIS, specifically agronomic attributes, crop libraries, fertilizer libraries, soil layers, nutrient needs layers, satellite monitoring layers, fertilizer application layers, and yield map layers.
The above descriptors can be split into two main categories: the primary descriptors, which concern requirements, methodology, and symbology; and the secondary descriptors, which cover data collection and ingestion rules, data types and formats, and software tools and commands. The service protocol is written in English and was set up in tabular form within a spreadsheet environment.
4.3.2. Requirements
The requirements descriptor provides an ensemble of potential data sources and suggested software tools to establish or update the geodatabase and carry out methodological tasks (Table 4).
Table 4.
The ensemble of technologies used by the service, split into three categories.
It also provides the rules and step-by-step actions for data collection and ingestion, and the appropriate data types, commands, and formats to guarantee functionality and interoperability.
Data collection concerns soil properties, crop yield, imagery, weather, and agronomic information (parcel boundaries, cultivars, seeding dates, farming practices, economics, etc.). Examples are the process steps for the digitization of the parcel boundaries and their transfer between software tools; the process of soil sampling design up to the creation of the soil property surfaces from the collected samples.
4.3.3. Methodology
The main methodology descriptors provide guidance with regard to the analytical steps necessary to run the different F-models for crop fertilization with machine learning systems (MLSs).
The main descriptor of the MLS protocol concerns agreement on the names and formats of all the properties in the machine learning analysis, so as to guarantee matching GISs with MLSs and avoid resetting and confusion.
Similarly, the FMIS protocol describes the exact fields that comprise the attributes of the parcels as they are set up in the ifarma platform, as well as their name and format. In addition to that, there is some standardization of the nomenclature of the fields of the grid maps uploaded to the platform.
Finally, the VRT protocol is a descriptor of transforming the application maps into the appropriate arrangement and format required by the specific distributors used by the farmers. In this process, some stand-alone conversion programs are necessary.
4.3.4. Symbology
The symbology descriptor provides the agreed terms, symbols, and attributes used in all GIS layers of the service (Table 5). The first alphanumeric part of the layer name indicates the crop or crops, followed by the cultivation year (e.g., ‘R25’), whereas the second part (that after an underscore) indicates the property mapped (e.g., ‘_p’ for parcels).
Table 5.
Symbols and data types of all possible layers, set up within the GIS of the service.
The crop names are denoted by one capital first letter for arable crops and two capital letters for permanent crops, derived from the Greek name of the crop with Latin characters, e.g., ‘S’ for wheat from the Greek ‘Sitos’, or ‘EL’ for olives from the Greek ‘Elia’.
In a complete example, the layer named ‘B21_f1’ denotes the first fertilization map (i.e., the broadcasting spread map) for cotton crop (‘B’ from ‘Vamvaki’) for the year 2021 (‘21’). Among the exceptions are the spectral index layers processed from the imagery, which are denoted by the index name followed by the date of image acquisition (e.g., LNC_20240712).
4.3.5. Automations
The standardization of all the processes, together with the development of a strict and detailed protocol, has assisted in the conversion of many important sub-processes of the service into automated algorithms.
First is the downloading of image data from the Google Earth Engine platform with scripting. The user only has to import the point grid of 5 × 5 m and then define the area of interest and the time period in which the data are requested. The script contains the definitions of specific spectral indices derived from Sentinel-2 imagery; possible new indices have to be added in the script. The same script contains similar algorithms for downloading appropriate SAR modes from Sentinel-1 imagery.
Second is the running of the F-models with scripting in python. The scripts call open-source MLS libraries from the cloud, which then resolve the predefined prediction problems of optimum fertilizers for every grid point recorded in a linked CSV file. The output maps are reviewed by the expert team for verification.
Third is the uploading of the 5 × 5 m grid maps to the ifarma FMIS platform. These maps are exported in one step from the service GIS as CSV files and then uploaded in one step to the platform.
Recently, additional process automation routines have been introduced, focusing on internal GIS functionalities and data exchange between the different process hubs.
4.4. Service Perspectives
The four developed services—based on the innovative process chain—have been offered to individual growers, teams of growers, or enterprises by Ecodevelopment S.A. since 2018, under distinct brand names: PreFer for arable crops, Opora for tree plantations, Premno for vines and other shrubs, and ProFit for profitability and in parallel with any of the above.
In the period 2020–2024, rice parcels where the PreFer service was used in the Axios river plain, Greece, were consistently reported to reach higher yields by +8.4% on average, compared to other parcels in the same area. Furthermore, the yields recorded for PreFer show a clear upward trend, whereas the other parcels show a downward one.
These absolutely quantitative and undisputed figures were collected by four grain yield monitors mounted on harvesters, covering approximately 500 to 1000 hectares of rice cultivation annually in the Axios river plain. These data are available for viewing to any interested reader (Figure 8).
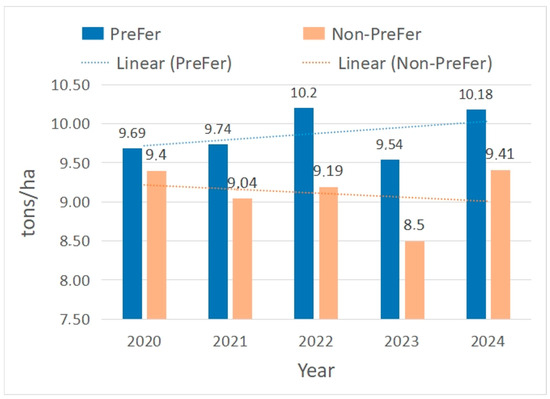
Figure 8.
The rice yield data collected from the Axios river plain, Greece, in the period 2020–2024, indicating steadily significantly higher yield rates for the parcels where PreFer service was used (denoted as PreFer) compared to other parcels in the same area (denoted as Non-PreFer).
In addition to the increased yield, PreFer users witnessed lower needs for fertilizers by up to 20% during the same period. Considering that about 60% of the yield value covers the cultivation cost, the above data correspond to a more than 30% increase in profitability terms. The same farmers have witnessed steadily increased yields by 10–15% compared to those before starting precision fertilization applications [33].
5. Conclusions
In this work, a new precision agriculture process chain was designed and developed, based on background research and pilot activities started systematically in 2016. The process chain is being tested continuously under true operational conditions on an annual basis.
The process chain evolved over time in parallel with data collection, method complexity, interface upgrade, and application efficiency. Noticeably, the feedback of farmers has been an essential asset for the success of the process chain.
The principles that were set in advance of development were fully met, specifically the following: (a) generality was met, as the process chain can be followed by the service for any type of crop, area, condition or limitation; (b) flexibility was met, as the process chain uses an open-source farm management information system as a storage, visualization, and communication platform and interface, allowing for an adaptable architecture.
Finally, the process chain was developed in line with the directions by Gebbers and Adamchuk (2010) [34] for the use of open systems, reusable services, and widely available agricultural platforms, which can serve as the basis for the development of new solutions adapted to different regions, different crops, and the available machinery, etc.
In order to satisfy the above directions, the process chain was considered innovative in two specific points: (a) in putting a GIS (including experts) in the role of the central hub of the process chain, which was shown to be irreplaceable; (b) in merging farming consultancy with precision agriculture methodologies, and thus creating the so called “prescription maps”.
In summary, the new precision agriculture process chain developed and maintained by Ecodevelopment S.A. is an innovative, generic, and flexible mechanism for scientifically sound, dynamic, operational, cost-effective, and easy-to-use precision agriculture services.
Author Contributions
Conceptualization, C.K. and M.I.; methodology, C.K. and M.I.; software, C.K. and M.I.; validation, C.K. and M.I.; formal analysis, C.K., S.M. and M.I.; investigation, C.K. and S.M.; resources, C.K., S.M. and M.I.; data curation, C.K. and M.I.; writing—original draft preparation, C.K.; writing—review and editing, M.I.; visualization, C.K.; supervision, S.M.; project administration, S.M.; funding acquisition, S.M. All authors have read and agreed to the published version of the manuscript.
Funding
This work was partially funded by the projects (concerning 15.8% of the cultivated surfaces that became available for the development of the service): 1. ‘Implementation of precision agriculture practices in rice farming with the aim of increasing production, improving the quality of the harvested product and reducing inputs’, Hellenic Ministry of Agriculture: M16SYN2-00073/PRECISION RICE. 2. ‘Optimizing the application of municipal sludge silt in agricultural lands in relation to its environmental and agronomical parameters’, Hellenic Ministry of Agriculture: M16SYN2-00258/ILYS. 3. “Management of cotton cultivation to reduce inputs, environmental impacts and production costs, using innovative precision agriculture methods and training of producers” of the National Center for Quality Control, Classification and Standardization of Cotton of the Institute of Industrial & Livestock Plants (CPV: 77100000-1). 4. ‘Precision agriculture service for the olive plantations of Western Greece’, Opora, ΔΕΡ6-0019641, RIS3/Agrofood, Region of Western Greece. 5. ‘Remote Sensing application in cherry cultivation for high level antioxidant fruits and management optimization of diseases caused by Rhagoletis cerasi and Drosophila suzukii’, Greek Secretary of Research-04341, CheRemote.
Data Availability Statement
The entire data set used in this work is available for viewing to any interested reader, under the prerequisites of local and international laws about personal data protection.
Acknowledgments
Cordial thanks to all the farmers who permitted the use of their data for this work, especially the pioneer rice farmers Konstantinos Kravvas and Panagiotis Goutas. Special thanks to George Iatrou, former Vice-President of Ecodevelopment S.A., for his ideas and support at the initial stages of the service development. Special thanks to Nikolaos Lazos, Agronomist, for his exceptional work in the conducted soil surveys as a Head of the field team of Ecodevelopment S.A. Special thanks to Xanthi Tseni, Geologist, former Head of the GIS team of Ecodevelopment S.A., for her significant contribution in F-model development. Special thanks to the team of ELGO-DIMITRA for their meticulous manipulation and analysis of the soil samples—particularly Vasilleios Aschonitis, Agronomist, Head of the Soil Laboratory. Special thanks to the team of Agrostis S.A., for their fruitful collaboration concerning the formation of the service platform—particularly Konstantinos Stamkopoulos, Programmer.
Conflicts of Interest
The authors declare no conflict of interest.
References
- Grand View Research. Available online: https://www.grandviewresearch.com/industry-analysis/precision-farming-market (accessed on 12 June 2025).
- PrecisionAG. ISPA Forms Official Definition of ‘Precision Agriculture’. 2019. Available online: https://www.precisionag.com/market-watch/ispa-forms-official-definition-of-precision-agriculture/ (accessed on 26 March 2021).
- DeLay, N.D.; Thompson, N.M.; Mintert, J.R. Precision agriculture technology adoption and technical efficiency. J. Agric. Econ. 2022, 73, 195–219. [Google Scholar] [CrossRef]
- David, S.; Robert, E. Sequential Adoption and Cost Savings from Precision Agriculture. J. Agric. Resour. Econ. West. Agric. Econ. Assoc. 2016, 41, 1–19. [Google Scholar]
- Labarthe, P.; Beck, M. CAP and Advisory Services: From Farm Advisory Systems to Innovation Support. EuroChoices 2022, 21, 5–14. [Google Scholar] [CrossRef]
- Iatrou, M.; Karydas, C.; Iatrou, G.; Pitsiorlas, I.; Aschonitis, V.; Raptis, I.; Mpetas, S.; Kravvas, K.; Mourelatos, S. Topdressing Nitrogen Demand Prediction in Rice Crop Using Machine Learning Systems. Agriculture 2021, 11, 312. [Google Scholar] [CrossRef]
- Karydas, C.; Chatziantoniou, M.; Stamkopoulos, K.; Iatrou, M.; Vassiliadis, V.; Mourelatos, S. Embedding a new precision agriculture service into a farm management information system—Points of innovation. Smart Agric. Technol. 2023, 4, 100175. [Google Scholar] [CrossRef]
- SAP Documentation. Available online: https://help.sap.com/doc/saphelp_nw75/7.5.5/en-US/8f/c08b3baaa59649e10000000a11402f/frameset.htm (accessed on 12 June 2025).
- Burrough, P.A.; McDonnell, R.A. Principles of Geographical Information Systems; Oxford University Press: Oxford, UK, 1998. [Google Scholar]
- Chlingaryan, A.; Sukkarieh, S.; Whelan, B. Machine Learning Approaches for Crop Yield Prediction and Nitrogen Status Estimation in Precision Agriculture: A Review. Comput. Electron. Agric. 2018, 151, 61–69. [Google Scholar] [CrossRef]
- Chen, T.; Guestrin, C. XGBoost: A Scalable Tree Boosting System. In Proceedings of the 22nd ACM SIGKDD International Conference on Knowledge Discovery and Data Mining, New York, NY, USA, 13–17 August 2016; ACM: New York, NY, USA, 2016; pp. 785–794. [Google Scholar]
- Dorogush, A.V.; Gulin, A.; Gusev, G.; Kazeev, N.; Prokhorenkova, L.O.; Vorobev, A. Fighting Biases with Dynamic Boosting. arXiv 2017, arXiv:1706.09516. Available online: http://arxiv.org/abs/1706.09516 (accessed on 27 May 2025).
- Ke, G.; Meng, Q.; Finley, T.; Wang, T.; Chen, W.; Ma, W.; Ye, Q.; Liu, T.-Y. LightGBM: A Highly Efficient Gradient Boosting Decision Tree. In Advances in Neural Information Processing Systems; Guyon, I., von Luxburg, U., Bengio, S., Wallach, H., Fergus, R., Vishwanathan, S., Eds.; Curran Associates, Inc.: Nice, France, 2017. [Google Scholar]
- Iatrou, M.; Karydas, C.; Tseni, X.; Mourelatos, S. Representation Learning with a Variational Autoencoder for Predicting Nitrogen Requirement in Rice. Remote Sens. 2022, 14, 5978. [Google Scholar] [CrossRef]
- Hunter, J.D. Matplotlib: A 2D Graphics Environment. Comput. Sci. Eng. 2007, 9, 90–95. [Google Scholar] [CrossRef]
- Waskom, M.; Botvinnik, O.; O’Kane, D.; Hobson, P.; Lukauskas, S.; Gemperline, D.C.; Augspurger, A.; Halchenko, Y.; Cole, J.B.; Warmenhoven, J.; et al. mwaskom/seaborn: V0.8.1 (September 2017). 3 September 2017. Available online: https://zenodo.org/record/883859 (accessed on 16 March 2022).
- Van Rossum, G.; Drake, F.L. The Python Tutorial; Python Software Foundation: Wilmington, DC, USA, 2010; Volume 42, pp. 1–122. Available online: http://docs.python.org/tutorial/ (accessed on 5 May 2022).
- Fountas, S.; Carli, G.; Sørensen, C.G.; Tsiropoulos, Z.; Cavalaris, C.; Vatsanidou, A.; Liakos, B.; Canavari, M.; Wiebensohn, J.; Tisserye, B. Farm management information systems: Current situation and future perspectives. Comput. Electron. Agric. 2015, 115, 40–50. [Google Scholar] [CrossRef]
- Paraforos, D.S.; Vassiliadis, V.; Kortenbruck, D.; Stamkopoulos, K.; Ziogas, V.; Sapounas, A.A.; Griepentrog, H.W. Multi-level automation of farm management information systems, Comput. Electron. Agric. 2017, 14, 504–514. [Google Scholar] [CrossRef]
- Fulton, J.; Hawkins, E.; Taylor, R.; Franzen, A. Yield Monitoring and Mapping. In Precision Agriculture Basics; American Society of Agronomy, Inc.; Crop Science Society of America, Inc.; Soil Science Society of America, Inc.: Madison, WI, USA, 2019; ISBN 978-0-89118-366-2/978-0-89118-367-9. [Google Scholar] [CrossRef]
- Aschonitis, V.G.; Karydas, C.G.; Iatrou, Μ.; Mourelatos, S.; Metaxa, I.; Tziachris, P.; Iatrou, G. An Integrated Approach to Assessing the Soil Quality and Nutritional Status of Large and Long-Term Cultivated Rice Agro-Ecosystems. Agriculture 2019, 9, 80. [Google Scholar] [CrossRef]
- Karydas, C.; Iatrou, M.; Iatrou, G.; Mourelatos, S. Management Zone Delineation for Site-Specific Fertilization in Rice Crop Using Multi-Temporal RapidEye Imagery. Remote Sens. 2020, 12, 2604. [Google Scholar] [CrossRef]
- Index Database. Available online: https://www.indexdatabase.de/ (accessed on 12 June 2025).
- Google Earth Engine (GEE). Available online: https://console.cloud.google.com/earth-engine/configuration/register?inv=1&invt=AbyDxQ&project=ecodev-pa&supportedpurview=project (accessed on 12 June 2025).
- Copernicus Climate Data Store (CCDS). 2025. Available online: https://cds.climate.copernicus.eu/#!/home (accessed on 12 June 2025).
- AUAV. 2025. Available online: https://www.auav.com.au/articles/drone-types/#1 (accessed on 12 June 2025).
- Skofronick-Jackson, G.; Petersen, W.A.; Berg, W.; Kidd, C.; Stocker, E.F.; Kirschbaum, D.B.; Kakar, R.; Braun, S.A.; Huffman, G.J.; Iguchi, T.; et al. The Global Precipitation Measurement (GPM) Mission for Science and Society. Bull. Am. Meteorol. Soc. 2017, 98, 1679–1695. [Google Scholar] [CrossRef] [PubMed]
- Copernicus Data Space Ecosystem/Sentinel Hub. Available online: https://www.sentinel-hub.com/explore/copernicus-data-space-ecosystem (accessed on 12 June 2025).
- European Centre for Medium-Range Weather Forecasts (ECMWF). Available online: https://www.ecmwf.int/ (accessed on 29 May 2025).
- Karydas, C.; Chatziantoniou, M.; Tremma, O.; Milios, A.; Stamkopoulos, K.; Vassiliadis, V.; Mourelatos, S. Profitability Assessment of Precision Agriculture Applications—A Step Forward in Farm Management. Appl. Sci. 2023, 13, 9640. [Google Scholar] [CrossRef]
- Cambridge University Press & Assessment. 2025. Available online: https://dictionary.cambridge.org/us/dictionary/english/descriptor (accessed on 12 June 2025).
- ML Journey. Available online: https://mljourney.com/information-retrieval-system-examples/ (accessed on 12 June 2025).
- Iatrou, M.; Karydas, C.; Iatrou, G.; Zartaloudis, Z.; Kravvas, K.; Mourelatos, S. Optimization of fertilization recommendation in Greek rice fields using precision agriculture. Agric. Econ. Rev. 2018, 19, 64–75. [Google Scholar]
- Gebbers, R.; Adamchuk, V.I. Precision Agriculture and Food Security. Science 2010, 327, 828–831. [Google Scholar] [CrossRef] [PubMed]
Disclaimer/Publisher’s Note: The statements, opinions and data contained in all publications are solely those of the individual author(s) and contributor(s) and not of MDPI and/or the editor(s). MDPI and/or the editor(s) disclaim responsibility for any injury to people or property resulting from any ideas, methods, instructions or products referred to in the content. |
© 2025 by the authors. Licensee MDPI, Basel, Switzerland. This article is an open access article distributed under the terms and conditions of the Creative Commons Attribution (CC BY) license (https://creativecommons.org/licenses/by/4.0/).