Abstract
Automating agricultural processes holds significant promise for enhancing efficiency and sustainability in various farming practices. This paper contributes to the automation of agricultural processes by providing a dedicated mushroom detection dataset related to automated harvesting, 3D pose estimation, and growth monitoring of the button mushroom produced using Agaricus Bisporus fungi. With a total of 2000 images for object detection, instance segmentation, and 3D pose estimation—containing over 100,000 mushroom instances—and an additional 3838 images for yield estimation featuring eight mushroom scenes covering the complete growth period, it fills the gap in mushroom-specific datasets and serves as a benchmark for detection and instance segmentation as well as 3D pose estimation algorithms in smart mushroom agriculture. The dataset, featuring realistic growth environment scenarios with comprehensive 2D and 3D annotations, is assessed using advanced detection and instance segmentation algorithms. This paper details the dataset’s characteristics, presents detailed statistics on mushroom growth and yield, evaluates algorithmic performance, and, for broader applicability, makes all resources publicly available, including images, code, and trained models, via our GitHub repository. (accessed on 22 March 2025).
1. Introduction
The integration of artificial intelligence (AI)-driven automation into agricultural processes has gained significant momentum, offering opportunities for increased efficiency and sustainability in various farming practices [1,2,3,4]. Among these, the automatic harvesting of edible mushrooms in large farms holds substantial potential for streamlining operations and reducing labor-intensive tasks.
While computer vision and object detection technologies have seen significant advancements, a major challenge remains—the lack of publicly available datasets specifically tailored for mushroom detection. This limitation impedes the systematic evaluation and comparison of different mushroom detection algorithms. Synthetic mushroom datasets [1,5] have been introduced to aid model pre-training; however, they often fail to capture real-world complexities—such as varied lighting conditions, diverse growth stages, and cluttered backgrounds—necessitating fine-tuning on real images for robust performance. Additionally, in practical agricultural settings, accurate 3D orientations can facilitate automated harvesting by providing robotic arms with precise information about the mushroom’s position and tilt [6,7,8]. Furthermore, reliable 3D pose data are essential for tasks involving volumetric measurements where a mushroom’s overall shape and orientation must be understood in detail. To the best of the authors’ knowledge, there are currently no other datasets on real mushrooms providing ground-truth data for various modalities and purposes, such as instance segmentation and object detection, yield estimation, and 3D pose estimation.
To address this gap, we present a comprehensive real-world mushroom dataset featuring 2000 images dedicated to object detection, instance segmentation, and 3D pose estimation, plus an additional 3838 images for yield estimation. The 2000 images contain over 100,000 mushroom instances, while the 3838 images used for yield estimation contain 8 different time-lapse images of unique scenes covering the entire growth period. The growth monitoring and yield estimation subset of our dataset is an augmented version of the data used in our previous work [9]. All images in the object detection subset are RGB-D pairs that were captured using an Intel RealSense D405 RGB-D camera, and the yield estimation subset’s images were captured by a TLC200 Pro time-lapse camera. The dataset focuses on two commonly cultivated varieties—white button mushrooms and baby bella (cremini) mushrooms—and includes detailed 3D pose annotations, generated first by manual labeling of a small subset of 50 images, followed by pseudo-labeling the remaining 3D instances through a trained pose estimation model proposed in [10], and a final round of manual 3D label refinement. Each image captures various lighting conditions and growth stages, covering a broad range of orientations and backgrounds. Additionally, the second subset of 3838 images includes repeated captures of the 8 different scenes for yield estimation, enabling measurement of growth rates over time and supporting a yield prediction model.
Figure 1 illustrates sample dataset images, corresponding ground-truth instance segmentation masks, and depth images for both baby bella (BB) and white button (WB) mushrooms. Figure 2 presents 3D point clouds of brown and white mushroom scenes, showing how our RGB-D data can be leveraged for 3D spatial and volumetric analyses.
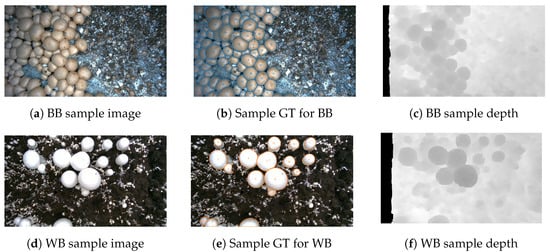
Figure 1.
Sample of dataset images, ground-truth (GT) instance segmentation masks, and depth images for baby bella (BB) and white button (WB) mushroom images.
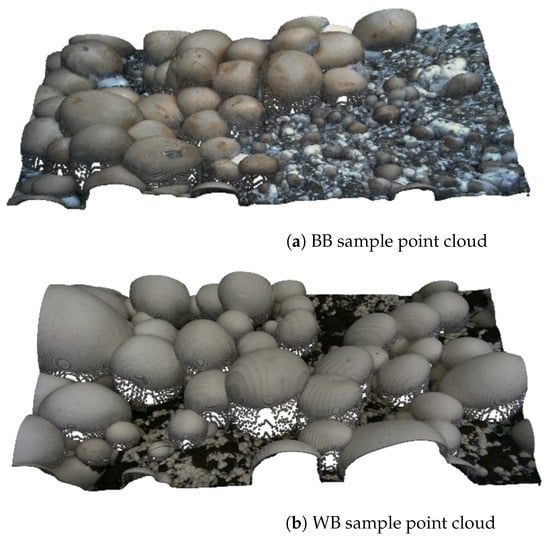
Figure 2.
Sample of dataset 3D point clouds for (a) baby bella mushrooms and (b) white button mushrooms.
Our main contributions are summarized as follows:
- We introduce a publicly available, real-world mushroom dataset comprising 2000 RGB-D images for detection-related tasks, instance segmentation, and 3D pose estimation, as well as 3838 images for growth monitoring.
- We provide comprehensive ground-truth labels for object detection, instance segmentation, 3D pose estimation, and time-series data for yield forecasting.
- We establish a benchmark by evaluating state-of-the-art mushroom detection algorithms, facilitating reliable performance comparison.
In the subsequent sections of this paper, we describe the annotation methodology in detail, present descriptive statistics of the dataset, evaluate benchmark algorithms, and discuss potential applications of our dataset for automated harvesting, growth estimation, and other smart farming tasks.
2. Literature Review
Several articles and papers have been published regarding the application of image processing and machine learning algorithms for mushroom detection, quality assessment, disease detection, growth monitoring, and automatic harvesting. These works can be grouped into three main categories as follows.
2.1. Mushroom Detection and Localization
There is a growing body of literature dedicated to mushroom detection and localization, each focusing on different algorithms for mushroom detection and localization, using techniques from classical image processing to advanced deep learning and computer vision.
The YOLO (you only look once) algorithm, a significant advancement introduced in 2016, is a cornerstone in this field. It simplified object detection into a single regression problem, directly predicting bounding boxes and class probabilities, thus enhancing efficiency in detection tasks. Several studies have adapted the YOLO algorithm for mushroom detection, yielding notable results.
Wei et al. [11] developed Recursive-YOLOv5, significantly surpassing the original YOLOv5 with 98% accuracy, though at the cost of almost doubling the network’s parameters. Wang et al. [12] introduced Mushroom-YOLO, an improved version of YOLOv5, achieving a mean average precision of 99.24% by integrating convolutional block attention module (CBAM) and bidirectional feature pyramid network (BiFPN) into the architecture. Olpin et al. [13] used region-based convolutional networks for mushroom detection, finding that the region-based convolutional neural network (RCNN) model was more accurate (92.162%) than the region-based fully convolutional network (RFCN) (87.631%), albeit slower. Yang et al. [14] enhanced Agaricus Bisporus recognition using Mask RCNN, achieving an average precision (AP50) of 95.061%, though the operation was slow. Retsinas et al. [15] created a vision module for 3D pose estimation of mushrooms, resulting in high retrieval scores (up to 99.80% mean average precision at 25% intersection over union) and accurate pose estimation (mean angle error as low as 8.70°). Lee et al. [16] automated the selective harvesting process, using the Faster R-CNN model for identification and a 3D point cloud for segmentation, achieving 70.93% accuracy in maturity identification. Baisa and Al-Diri [2] focused on robotic picking, detecting, and estimating the 3D pose of mushrooms with high precision (98.99%) and recall (99.29%), using RGB-D data. These studies demonstrate advancements in mushroom detection and localization, showcasing various algorithmic improvements. While they present significant progress, challenges remain, such as computational efficiency, dataset quality, and the need for further accuracy and speed enhancements.
2.2. Mushroom Growth Monitoring and Quality Assessment
Lu et al. [17] developed a system using YOLOv3 for monitoring mushroom growth in greenhouses. The system could estimate mushroom cap size, count, growth rate, and predict harvest times. It demonstrated effectiveness in identifying growth patterns and provided real-time updates via a mobile interface. Lu and Liaw [18] introduced an image measurement algorithm utilizing YOLOv3, coupled with a score-punishment algorithm for accurate mushroom cap diameter measurement. The method excelled in accuracy over traditional methods but faced challenges with unclear mushroom contours or soil particles on caps. Nadim et al.’s image processing system [19] assessed mushroom quality based on color, area, weight, and volume, using data mining, neural networks, and fuzzy logic. It achieved a 95.6% correct detection rate but required image pre-processing to counteract quality issues from normal imaging conditions.
Moysiadis et al. [20] automated the monitoring and classification of oyster mushrooms in greenhouses. They used YOLOv5 for detection and classification, and Detectron2 for tracking growth—demonstrating potential improvements in harvesting times—but faced difficulties in detecting small mushrooms. Wang et al. [21] developed an automatic sorting system for white button mushrooms, using image processing to measure the pileus diameter. The system achieved high grading speed and accuracy, significantly improving over manual grading methods.
Benhaddou et al. [9] implemented a computer vision system to estimate mushroom yield and quality in a commercial farm setting, utilizing the circular Hough transform algorithm. They achieved detailed tracking of mushroom growth across 1960 frames over 20 days, demonstrating the system’s ability to monitor size distribution and development trends. This technological application offers a promising tool for optimizing cultivation and harvesting strategies by providing precise data on mushroom growth patterns and potential yield estimations.
2.3. Mushroom Disease Detection
Zahan et al. [22] employed deep learning models to classify mushroom diseases, with ResNet15 showing the best performance in accuracy and precision. The study emphasized the potential of deep learning in agricultural management. Vizhanyo and Felfoldi [23] used advanced image analysis to distinguish diseased spots on mushroom caps. Their method showed an 85% correct classification ratio, effectively differentiating between brown blotch and ginger blotch diseases.
Jareanpon et al. [24] developed an intelligent farm system for real-time detection of fungal diseases in Lentinus. The system integrates environment control, an imaging robot, and a deep learning-based prognosis system, achieving high precision in maintaining optimal conditions and disease detection.
In conclusion, the literature review section of this paper highlights a range of innovative approaches to mushroom detection, quality assessment, growth monitoring, and disease detection using image processing and machine learning algorithms. Table 1 lists these studies and their results. The studies vary in focus, ranging from detection and localization to quality and disease detection, each contributing valuable insights and advancements in the field. Notably, while these works demonstrate significant progress, a gap remains in the standardization of methodologies and results comparison, compounded by the challenge of data drift [25]. This gap is primarily due to the lack of a publicly available benchmark dataset. Based on the current literature [26], and to the best of the authors’ knowledge, there are no publicly available annotated edible mushroom datasets. A standardized dataset would provide a common ground for evaluating different algorithms and techniques, ensuring comparability and consistency across studies. The availability of such a dataset would benefit the field, allowing for more robust and reliable comparisons of methods and results, driving forward the development of more efficient and effective solutions for mushroom cultivation and processing in the agricultural sector.

Table 1.
Summary of the tasks, methods, and results of similar studies leveraging mushroom detection.
3. Labeling Process
3.1. Detection and Segmentation
The images were initially labeled using the segment anything model (SAM) automatic mask generation feature [27]. This feature provides several configurations and post-processing steps to ensure the best quality of automatically generated masks for specific purposes. For instance, a grid of (with by default) positive points is placed on the original image and randomly cropped versions of it, and the generated masks are filtered by their confidence scores and stability within different confidence thresholds. The automatic mask generation algorithm considers a mask to be stable if thresholding the probability map at and results in similar masks. Additionally, masks can be filtered by their minimum and maximum areas, and a certain maximum intersection over union (IOU) threshold can be set to avoid the generation of overlapping masks. Nevertheless, these configurations do not guarantee the generation of perfect ground-truth masks and can only be used as a starting point.
These generated masks were meticulously edited manually during several steps to guarantee the quality of the dataset’s ground-truth masks. Initially, all the false-positive masks were removed, and the missing masks were added. Later, the intersection of all pairs of masks in the same image was calculated for all the images in the dataset, and the overlapping masks were removed manually.
3.2. 3D Pose Estimation
In addition to 2D instance segmentation, a subset of the images was labeled with 3D bounding boxes and rotation annotations. We began by manually labeling an initial subset of 50 images with precise 3D boxes; we then applied the pose estimation pipeline proposed by [10] to generate pseudo-labels for the remaining images. A final manual refinement phase ensured the accuracy of these 3D labels, particularly in cases where overlapping mushrooms or complex poses challenged the automated predictions.
Each 3D annotation contains the following:
- The object center in pixel coordinates of the depth image;
- The bounding-box dimensions in pixels (width, height, depth); and
- The object orientation in Euler angles —roll, pitch, and yaw in degrees.
Following [28], we convert the Euler angles to the 6D Gram–Schmidt (GS) representation before feeding them to the network and again after inference. Given roll , pitch , and yaw (in radians), we first form the rotation matrix:
where
The GS representation simply concatenates the first two columns of R:
At inference time, we recover the rotation by orthonormalizing :
yielding and, if needed, the corresponding Euler angles.
This 6D representation avoids the discontinuities and singularities of Euler angles, leading to smoother optimization during training and more stable pose predictions at inference.
3.3. Growth Monitoring
To facilitate the study of mushroom development over time, consecutive images of each mushroom were captured at multiple stages of growth. Each labeled instance retains a consistent ID across frames, allowing precise tracking and comparison of changes in shape and size throughout different growth phases. During annotation, we used manual inspections to refine the growth stage boundaries, ensuring accurate and reliable labeling for each mushroom across multiple developmental stages.
For the subset of images dedicated to yield estimation, we augmented and labeled the data from a similar work [9] and performed additional labeling to track mushroom growth over time. Specifically, the same scene was captured repeatedly, and each mushroom in the scene was assigned a consistent identifier across all time points to facilitate growth rate calculations. This subset of our dataset can be utilized to support the development of temporal models for yield forecasting and growth monitoring.
4. Data Description
Our dataset includes 2000 RGB-D images for object detection, instance segmentation, and 3D pose estimation, plus an additional 3838 RGB-D images for yield estimation and growth monitoring. In the main subset, we have both baby bella (BB) and white button (WB) mushroom images, whereas the yield estimation subset only consists of repeated captures of WB mushrooms over time. A sample of the main subset’s images, depth maps, and label masks is plotted in Figure 1. Both the RGB images and the depth images in the main subset have a resolution of 1280 × 720 pixels; hence, no alignment will be required for using the RGB and depth images as a single RGB-D input. Sample 3D point cloud images of WB and BB mushrooms are plotted in Figure 2. During image acquisition, the camera was positioned at vertical distances of 27 cm (about 10.63 in) and 15 cm (about 5.91 in) above the cultivation beds for baby bella and white button mushrooms, respectively.
The 2000-image subset contains approximately 70,000 WB mushroom instances and 30,000 BB instances. The additional 3838 images for yield estimation contain 8 different time-lapse scenes observed repeatedly with time steps of 15 min to track growth over time. These instances include a wide range of mushroom sizes for both categories, making our dataset suitable for training detection models for various tasks such as mushroom growth monitoring and automatic mushroom harvesting, as well as 3D pose estimation. Histograms of mask areas and bounding box diagonal lengths of mushroom instances are plotted in Figure 3, and scatter plots of instance mask area versus bounding box diagonal length are shown in Figure 4. As illustrated in the scatter plots, some instances lie above the overall trend line, indicating mushrooms that are partially occluded by neighboring mushrooms. These occlusions lead to crescent-shaped masks rather than fully convex shapes. Both Figure 3 and Figure 4 show comparatively larger mask areas for white button mushrooms, as explained by the shorter distance (15 cm) between the camera and the cultivation bed during WB image acquisition.
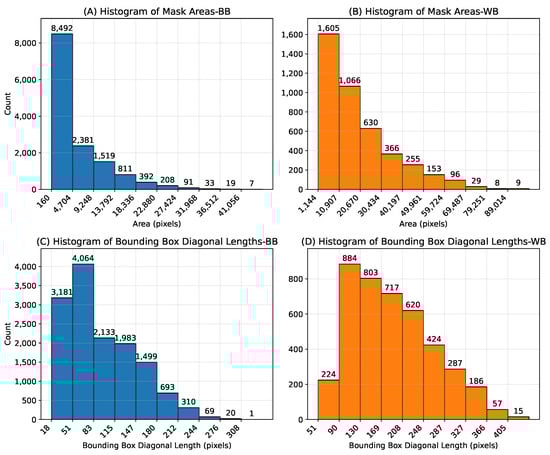
Figure 3.
Histograms of mask areas and bounding box diagonal lengths. (A,B) show pixel mask areas for baby bella (BB) and white button (WB) mushrooms, respectively, while (C,D) show bounding box diagonal lengths for BB and WB mushroom instances.
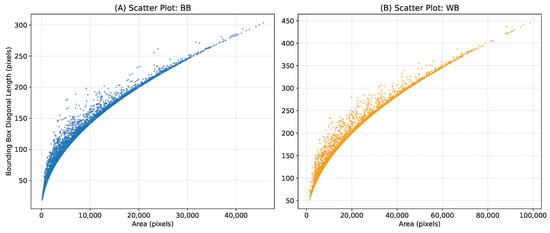
Figure 4.
Scatter plots of instance mask area vs. bounding box diagonal length for (A) baby bella mushrooms, and (B) white button mushrooms.
To study the separability of the two mushroom classes in different color spaces, we have plotted 3D scatter graphs (not shown here in detail) for RGB, HSV, and LAB in Figure 5, using the mean values of each instance’s mask in all color channels. The two clusters appear more intertwined in the RGB color space, whereas HSV and LAB yield more distinct separations of WB and BB mushrooms.
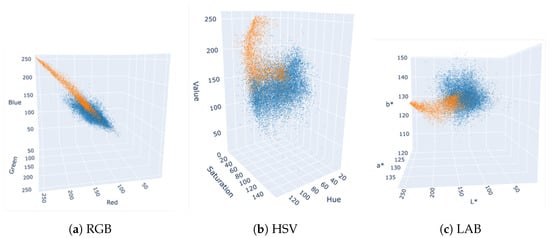
Figure 5.
Color distribution of mushroom instances in various color spaces; judging solely by the color distributions, LAB and HSV color spaces appear more suitable than RGB for distinguishing WB and BB instances. WB mushrooms are shown in orange, and BB mushrooms are shown in blue.
Furthermore, our main subset of 2000 images has been annotated with 3D bounding boxes and rotation information. These 3D labels extend the dataset’s utility for pose estimation tasks and enable the study of volumetric aspects of mushroom growth. For the additional yield estimation subset, repeated captures of the same scene allow researchers to investigate the temporal evolution of mushroom size and count, thus enabling more accurate yield forecasts.
Figure 6 illustrates two scatter plots showing the spread of rotation and dimension values for a randomly selected subset of our 3D labels comprising 2500 instances.
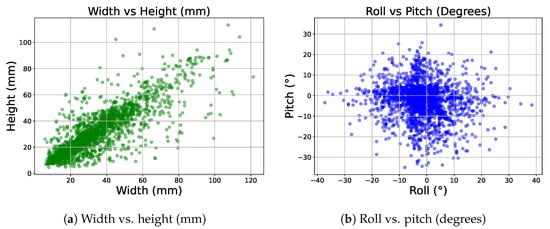
Figure 6.
Subfigure (a) shows the distribution of width vs. height in our 3D labels in millimeters, and subfigure (b) shows the distribution of roll vs. pitch in degrees.
The yield estimation subset of our dataset includes time-lapse images of eight different scenes. For each scene, the images start at the stage where the mushrooms have not appeared yet, until the time when there are no mushrooms left in the scene, with images taken every 15 min. These images were labeled using a trained YOLOv8 model, and each mushroom instance was assigned a unique identifier throughout the entire growth period. Figure 7 illustrates a time-series plot where the x-axis represents time and the y-axis represents mushroom size in millimeters; the average size for each of the eight scenes is shown, each with a different color. It can be observed that the average time required for a mushroom to reach full maturity is approximately five days. Furthermore, the abrupt decline in the size curve observed on the fifth day can be attributed to the partial harvesting of larger mushrooms. This intervention exposed smaller mushrooms that were previously occluded, thereby altering the recorded size distribution. A sample of the labeled growth monitoring data from a single scene is illustrated in Figure 8.
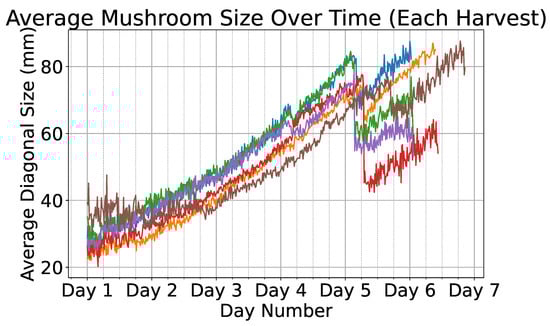
Figure 7.
Average diagonal size (in mm) of mushrooms over time across multiple harvest cycles. Each different scene is plotted using a different color.
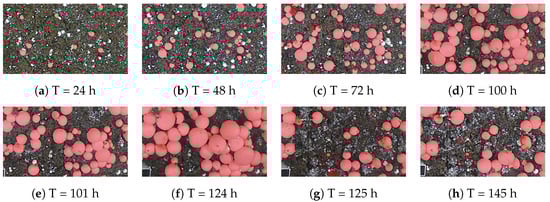
Figure 8.
Sample of labeled growth monitoring images from one of the 8 time-lapse scenes. Partial harvest of larger mushrooms is visible at hour 101 and hour 125.
5. Benchmarking and Results
In this section, we provide a detailed analysis of several object detection and instance segmentation algorithms tested on our mushroom dataset, along with the results of the pose estimation pipeline and analysis of the yield estimation data. The models were trained on a DGX-2 cluster equipped with sixteen NVIDIA V100 GPUs (32 GB each), providing ample computational resources for large-scale experiments.
For both detection and 3D pose estimation tasks, the data were split into 70%/10%/20% train, validation, and unseen test sets, respectively; all metrics reported below refer exclusively to the test split to ensure unbiased generalization estimates and guard against overfitting.
Every network (detection, segmentation, and pose) was optimized using AdamW with an initial learning rate of , and a cosine annealing scheduler that decayed the learning rate to zero over the full training horizon.
- Detection/segmentation. Instead of explicit weight regularization, we apply online data augmentation—random crops (up to 20% of area), in-plane rotations of , and random translations of along both axes—to diversify the training distribution and reduce overfitting.
- The 3D pose estimation. Following the protocol in [10], each mushroom instance’s point cloud is randomly downsampled to 1024 points at every iteration; this stochastic subsampling encourages robustness to point-density variation and further mitigates overfitting.
5.1. Object Detection and Instance Segmentation
All object detection and instance segmentation models underwent thorough evaluations, with their performance presented in Table 2. Our assessment utilized metrics such as F1 score, average precision (AP), and average recall (AR) for all models, regardless of the task being detection or instance segmentation.
Table 2.
Performance of different object detection and instance segmentation models on our dataset.
Table 2 presents the performance of various models with distinct backbone architectures, benchmarked on object detection and instance segmentation tasks. These models were trained on image resolutions of 640 × 360 and 1280 × 720. The Mask R-CNN with a ResNet-50 backbone surpassed the other networks in instance segmentation, achieving a mean average precision (mAP) of 0.866 and an average recall (AR) of 0.896 when processing 1280-sized RGB images. When adapted for RGB-D input, which resulted in a more than threefold increase in network parameters, there was no enhancement in performance. This lack of improvement may be attributed to the required reinitialization of weights following modifications to accommodate the added depth channel, which prevented the use of pre-trained weights that typically enhance performance via fine-tuning on a specific dataset. Furthermore, the expanded parameter count makes the network less suitable for real-time use where hardware resources are constrained. Due to the lack of improvement in performance while adding the depth channel, other networks were not tested with RGB-D images. Furthermore, the RT-DETR Large model exhibited superior object detection performance on 1280-sized images, with a mAP of 0.907 and an AR of 0.923. In contrast, both RT-DETR variants performed poorly on 640-sized images, potentially due to the network not being as effective at capturing the necessary details at a reduced resolution, given the small number of dataset images. Figure 9 provides a visual comparison of the prediction results between BB and WB images, generated by Mask R-CNN with a ResNet-50 backbone trained on RGB images of size 1280. Figure 9a,b show the prediction results on RGB images for BB (baby bella) and WB (white button) mushroom instances, respectively.
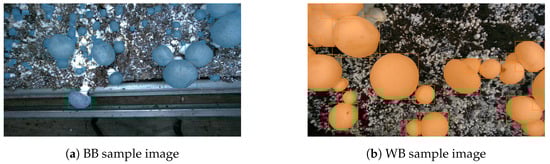
Figure 9.
Prediction results of Mask R-CNN-ResNet-50 architecture on (a) baby bella images, and (b) white button mushroom images.
Overall, the results indicate that while all models performed well across various metrics, the choice of backbone architecture and the balance between parameter count and input dimensionality play a significant role in the trade-off between accuracy and computational efficiency. These insights can guide the development and optimization of mushroom detection algorithms tailored for agricultural automation.
5.2. Inference–Time Performance Analysis
Real-time execution is essential for an autonomous harvester, so after evaluating accuracy, we measured how long each YOLOv8 segmentation model took to process a single image. All timings were collected on the same NVIDIA V100 (32 GB) used for training. The results, plotted in Figure 10, place average inference latency on the vertical axis and model size (parameters in millions) on the horizontal one; the solid yellow curve corresponds to input resolution , the orange curve to , and the red dashed line at 33.3 ms marks the 30 FPS real-time boundary.
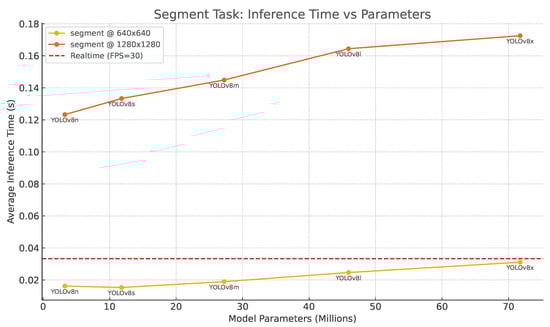
Figure 10.
Inference time versus parameter count for YOLOv8 segmentation models. Yellow: ; orange: ; red dashed: 30 FPS threshold.
Two clear trends emerge. First, every model—even the largest YOLOv8-X—comfortably meets the 30 FPS requirement at on the V100 GPU without any form of compression, confirming that our current hardware is sufficient for real-time operation at that resolution. Second, doubling the spatial resolution to roughly triples latency. The nano and small variants hover just above the real-time limit, whereas the medium, large, and extra-large versions fall short. Fortunately, this gap can be closed by exporting the networks through TensorRT or Torch-TensorRT with FP16 or INT8 quantization, converting them to ONNX, followed by dynamic quantization in ONNX Runtime, or using OpenVINO on Intel VPUs. Such optimizations typically halve—in some cases, even quarter—inference time, allowing high-resolution models to run smoothly on edge devices like the Jetson AGX Orin or Xavier.
5.3. 3D Pose Estimation
To assure the usability of our 3D data, we trained and evaluated a 3D pose estimation pipeline on the bounding boxes and rotation annotations. Our 3D pose pipeline (based on our previously published approach in [10]) predicts roll, pitch, and yaw angles for each mushroom instance. To measure the accuracy of these predictions, we used a mean metric, which averages the absolute degree differences between predicted and ground-truth angles across all mushrooms. Based on the findings of our previous study, we downsampled each mushroom instance’s point cloud to include 1024 points and used the Geodesic loss function [37] along with a 6D Gram–Schmidt rotation representation [28], and achieved a mean = , demonstrating the usability of our data and 3D annotations in tasks such as pose estimation. Figure 11 provides a visual comparison between ground-truth and predicted oriented bounding boxes on a randomly selected scene. The predictions closely match the ground-truth orientations, suggesting that the model successfully captures the poses of mushrooms in real-world scenes.
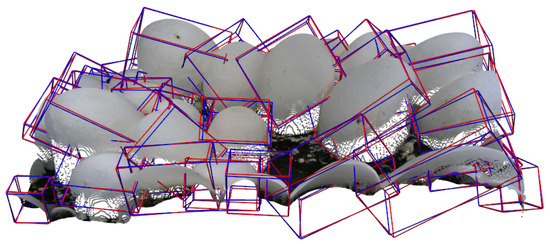
Figure 11.
Visualization of ground-truth (blue) vs. predicted (red) oriented bounding boxes on the point clouds.
5.4. Yield Estimation
To facilitate the development of yield estimation models, we provide a curated subset of 3838 images encompassing 8 distinct scenes that span the full growth cycle of mushrooms—from initial emergence from the soil to full maturity and harvest. Figure 12 presents the average mushroom size in millimeters over time, where the solid line represents the mean size and the shaded region denotes the minimum and maximum size bounds. We observe an abrupt drop in sizes around day five due to the partial harvesting of larger mushrooms, which enables the appearance of smaller, previously occluded mushrooms. Owing to the large volume of collected data, time-series models can be effectively employed to accurately predict future mushroom growth and estimate the optimal harvesting time.
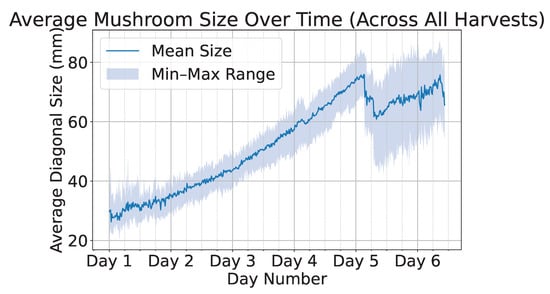
Figure 12.
Average mushroom size over time across all harvests, with the solid line indicating the mean size and the shaded region representing the minimum–maximum range.
6. Discussion and Future Works
Our experiments demonstrate that mushroom-specific computer-vision models now combine high accuracy with real-time speed on affordable hardware. The best Mask R-CNN reaches an mAP of 0.866 for instance segmentation at 1280 × 720, while YOLOv8-n processes the same resolution in only 16 ms on a single V100 GPU. These figures mean that, even without specialized optimization, off-the-shelf networks can already separate overlapping caps and guide a robotic arm at commercially acceptable rates. Consequently, growers and agri-start-ups with limited AI expertise need only a modest workstation—or an edge device such as the Jetson AGX Orin—to run detection, segmentation, and basic 3D pose estimation fast enough to keep pace with a moving conveyor.
The results also highlight three practical lessons. First, depth still holds untapped value; simply concatenating the raw D405 channel did not improve accuracy because weight reinitialization erased ImageNet pre-training, so future work should explore late fusion, self-supervised depth pre-training, or lightweight depth encoders that exploit the extra geometric cue without tripling the parameter count. Second, resolution influences latency far more than model size; doubling input dimensions roughly triples inference time, whereas scaling a YOLO from nano to medium adds only a few milliseconds. This suggests variable-resolution pipelines, where high resolution is reserved for quality-control snapshots, and lower resolution suffices for rapid picking. Third, the time-lapse subset reveals a predictable sigmoid growth curve with harvest-induced dips; simple time-series models can forecast when caps reach the 40–45 mm sweet spot, enabling farms to schedule labor and cooling more efficiently.
Looking ahead, several avenues can broaden the impact of this work. INT8 TensorRT builds already exceed 55 FPS on an AGX Orin, and additional pruning, knowledge distillation, or ultra-low-precision quantization could push battery-powered harvesters or camera-on-rail systems well beyond that mark. Pairing RGB-D data with hyperspectral or thermal imagery would support disease detection and quality grading in a single pass—a compelling prospect for premium-market start-ups. Because new farm layouts, lighting conditions, and mushroom varieties will inevitably cause model drift, an active or semi-supervised learning loop that fine-tunes detectors on a handful of user-validated masks could keep accuracy high with minimal effort. The pose annotations already allow gripper trajectories to be simulated in a physics engine. Combining these simulations with the yield-forecast curves opens the door to a full digital twin of a grow room, giving operators a sandbox for testing harvesting strategies before real-world deployment. Finally, the entire pipeline is largely crop-agnostic; replacing our dataset with images of strawberries, tomatoes, or leafy greens could bootstrap detection models for many other specialty crops.
Taken together, the dataset and benchmarks presented here provide more than academic insight—they offer a practical foundation for automating mushroom farming and, by extension, a range of other horticultural tasks. By making our data, code, and baseline models publicly available, we invite the broader agriculture community—research institutes and early-stage companies alike—to build on this work, accelerate the adoption of vision-guided harvesting, and ultimately reduce the labor and resource footprint of indoor crop production.
7. Conclusions
In this work, we presented a dedicated mushroom detection dataset tailored to train and evaluate object detection and instance segmentation methods for various purposes that require the localization of mushrooms in images, such as automated mushroom harvesting, mushroom quality assessment, and disease detection. Through comprehensive data collection and meticulous labeling processes, the dataset encompasses a wide spectrum of scenarios and challenges inherent in real-world mushroom growth environments, including clusters of mushrooms with a variety of densities, images with different lighting conditions, occasional occlusion of mushroom instances by soil particles, and mushrooms growing at the edge of cultivation beds. The diverse nature of the dataset, including instances of both white button and baby bella mushrooms, enables robust training and benchmarking of detection and instance segmentation algorithms.
Beyond 2D annotations, our dataset also provides 3D bounding boxes and rotation information for the main subset of mushrooms, enabling pose estimation tasks. Additionally, we introduced a separate subset dedicated to yield estimation, capturing the same scenes over time to facilitate growth forecasting and harvesting schedule optimization.
Our evaluation of nine different object detection and instance segmentation models highlights their respective strengths and weaknesses, shedding light on their suitability for mushroom detection and instance segmentation tasks. Furthermore, our exploration of color spaces provides insights into potential improvements in classification accuracy. By sharing this dataset and evaluation results, we hope to catalyze research and innovation in the domain of smart edible mushroom farming, fostering collaborations and accelerating progress in detection technologies. We anticipate that the integration of 3D pose estimation and yield forecasting components will further expand the dataset’s utility, supporting a broader range of applications in automated mushroom cultivation. The availability of this benchmark dataset, our code, and trained models contributes to the development of advanced mushroom detection techniques, pose estimation methods, and yield prediction models, paving the way for increased efficiency and sustainability in automated mushroom harvesting systems.
Author Contributions
Conceptualization, A.Z., M.F., D.B. and F.A.M.; methodology, A.Z. and M.F.; software, A.Z., M.F. and J.K.; validation, A.Z., M.F., B.K. and J.K.; formal analysis, A.Z., M.F., F.A.M. and D.B.; investigation, A.Z.; resources, W.Z., V.B. and F.A.M.; data curation, A.Z. and M.F.; writing—original draft preparation, A.Z.; writing—review and editing, M.F., B.K., J.K., V.B., W.Z., D.B. and F.A.M.; visualization, A.Z.; supervision, F.A.M., D.B., V.B. and W.Z.; project administration, F.A.M. and W.Z.; funding acquisition, W.Z. All authors have read and agreed to the published version of the manuscript.
Funding
The work was partially supported by the United States Department of Agriculture grant nos. 2021-67022-34889, 2022-67022-37867, and 2023-51300-40853, as well as the University of Houston Infrastructure grant.
Data Availability Statement
The dataset and code supporting the findings of this study are publicly available at our GitHub repository: https://github.com/abdollahzakeri/m18k (accessed on 22 March 2025).
Acknowledgments
We would like to acknowledge Kenneth Wood, Armando Juarez, and Bruce Knobeloch from Monterey Mushroom Inc. for allowing us to visit and obtain the necessary information from the mushroom farm in Madisonville, TX, USA.
Conflicts of Interest
The authors declare no conflicts of interest.
References
- Károly, A.I.; Galambos, P. Automated Dataset Generation with Blender for Deep Learning-based Object Segmentation. In Proceedings of the 2022 IEEE 20th Jubilee World Symposium on Applied Machine Intelligence and Informatics (SAMI), Poprad, Slovakia, 2–5 March 2022; pp. 000329–000334. [Google Scholar] [CrossRef]
- Baisa, N.L.; Al-Diri, B. Mushrooms Detection, Localization and 3D Pose Estimation using RGB-D Sensor for Robotic-picking Applications. arXiv 2022, arXiv:2201.02837. [Google Scholar]
- Arjun, A.D.; Chakraborty, S.K.; Mahanti, N.K.; Kotwaliwale, N. Non-destructive assessment of quality parameters of white button mushrooms (Agaricus bisporus) using image processing techniques. J. Food Sci. Technol. 2022, 59, 2047–2059. [Google Scholar] [CrossRef]
- Nguyen, V.; Ho, T.A.; Vu, D.A.; Anh, N.T.N.; Thang, T.N. Building Footprint Extraction in Dense Areas using Super Resolution and Frame Field Learning. In Proceedings of the 2023 12th International Conference on Awareness Science and Technology (iCAST), Taichung, Taiwan, 9–11 November 2023; pp. 112–117. [Google Scholar] [CrossRef]
- Anagnostopoulou, D.; Retsinas, G.; Efthymiou, N.; Filntisis, P.; Maragos, P. A Realistic Synthetic Mushroom Scenes Dataset. In Proceedings of the IEEE/CVF Conference on Computer Vision and Pattern Recognition (CVPR) Workshops, Vancouver, BC, Canada, 17–24 June 2023; pp. 6282–6289. [Google Scholar]
- Koirala, B.; Shen, G.; Nguyen, H.C.; Kang, J.; Zakeri, A.; Balan, V.; Merchant, F.; Benhaddou, D.; Zhu, W. Development of a Compact Hybrid Gripper for Automated Harvesting of White Button Mushroom. In Proceedings of the International Design Engineering Technical Conferences and Computers and Information in Engineering Conference, Washington, DC, USA, 25–28 August 2024; Volume 7: 48th Mechanisms and Robotics Conference (MR), p. V007T07A036. [Google Scholar] [CrossRef]
- Koirala, B.; Kafle, A.; Nguyen, H.C.; Kang, J.; Zakeri, A.; Balan, V.; Merchant, F.; Benhaddou, D.; Zhu, W. A Hybrid Three-Finger Gripper for Automated Harvesting of Button Mushrooms. Actuators 2024, 13, 287. [Google Scholar] [CrossRef]
- Koirala, B.; Zakeri, A.; Kang, J.; Kafle, A.; Balan, V.; Merchant, F.A.; Benhaddou, D.; Zhu, W. Robotic Button Mushroom Harvesting Systems: A Review of Design, Mechanism, and Future Directions. Appl. Sci. 2024, 14, 9229. [Google Scholar] [CrossRef]
- Benhaddou, D.; Balan, V.; Garza, A.D.L.; Merchant, F. Estimating Mushroom Yield and Quality Using Computer Vision. In Proceedings of the 2023 International Wireless Communications and Mobile Computing (IWCMC), Marrakesh, Morocco, 19–23 June 2023; pp. 562–567. [Google Scholar] [CrossRef]
- Zakeri, A.; Koirala, B.; Kang, J.; Balan, V.; Zhu, W.; Benhaddou, D.; Merchant, F.A. SMS3D: 3D Synthetic Mushroom Scenes Dataset for 3D Object Detection and Pose Estimation. Computers 2025, 14, 128. [Google Scholar] [CrossRef]
- Wei, B.; Zhang, Y.; Pu, Y.; Sun, Y.; Zhang, S.; Lin, H.; Zeng, C.; Zhao, Y.; Wang, K.; Chen, Z. Recursive-YOLOv5 Network for Edible Mushroom Detection in Scenes With Vertical Stick Placement. IEEE Access 2022, 10, 40093–40108. [Google Scholar] [CrossRef]
- Wang, Y.; Yang, L.; Chen, H.; Hussain, A.; Ma, C.; Al-gabri, M. Mushroom-YOLO: A deep learning algorithm for mushroom growth recognition based on improved YOLOv5 in agriculture 4.0. In Proceedings of the 2022 IEEE 20th International Conference on Industrial Informatics (INDIN), Perth, Australia, 25–28 July 2022; pp. 239–244. [Google Scholar] [CrossRef]
- Olpin, A.J.; Dara, R.; Stacey, D.; Kashkoush, M. Region-Based Convolutional Networks for End-to-End Detection of Agricultural Mushrooms. In Proceedings of the Image and Signal Processing, Cherbourg, France, 2–4 July 2018; Mansouri, A., El Moataz, A., Nouboud, F., Mammass, D., Eds.; Springer: Cham, Switzerland, 2018. Lecture Notes in Computer Science. pp. 319–328. [Google Scholar] [CrossRef]
- Yang, S.; Huang, J.; Yu, X.; Yu, T. Research on a Segmentation and Location Algorithm Based on Mask RCNN for Agaricus Bisporus. In Proceedings of the 2022 2nd International Conference on Computer Science, Electronic Information Engineering and Intelligent Control Technology (CEI), Nanjing, China, 23–25 September 2022; pp. 717–721. [Google Scholar] [CrossRef]
- Retsinas, G.; Efthymiou, N.; Anagnostopoulou, D.; Maragos, P. Mushroom Detection and Three Dimensional Pose Estimation from Multi-View Point Clouds. Sensors 2023, 23, 3576. [Google Scholar] [CrossRef]
- Lee, C.-H.; Choi, D.; Pecchia, J.; He, L.; Heinemann, P. Development of A Mushroom Harvesting Assistance System using Computer Vision. In Proceedings of the 2019 ASABE Annual International Meeting, Boston, MA, USA, 7–10 July 2019; Volume 1900505. [Google Scholar] [CrossRef]
- Lu, C.P.; Liaw, J.J.; Wu, T.C.; Hung, T.F. Development of a Mushroom Growth Measurement System Applying Deep Learning for Image Recognition. Agronomy 2019, 9, 32. [Google Scholar] [CrossRef]
- Lu, C.P.; Liaw, J.J. A novel image measurement algorithm for common mushroom caps based on convolutional neural network. Comput. Electron. Agric. 2020, 171, 105336. [Google Scholar] [CrossRef]
- Nadim, M.; Ahmadifar, H.; Mashkinmojeh, M.; Yamaghani, M.R. Application of Image Processing Techniques for Quality Control of Mushroom. Casp. J. Health Res. 2019, 4, 72–75. [Google Scholar] [CrossRef]
- Moysiadis, V.; Kokkonis, G.; Bibi, S.; Moscholios, I.; Maropoulos, N.; Sarigiannidis, P. Monitoring Mushroom Growth with Machine Learning. Agriculture 2023, 13, 223. [Google Scholar] [CrossRef]
- Wang, F.; Zheng, J.; Tian, X.; Wang, J.; Niu, L.; Feng, W. An automatic sorting system for fresh white button mushrooms based on image processing. Comput. Electron. Agric. 2018, 151, 416–425. [Google Scholar] [CrossRef]
- Zahan, N.; Hasan, M.Z.; Uddin, M.S.; Hossain, S.; Islam, S.F. Chapter 10 - A deep learning-based approach for mushroom diseases classification. In Application of Machine Learning in Agriculture; Khan, M.A., Khan, R., Ansari, M.A., Eds.; Academic Press: Cambridge, MA, USA, 2022; pp. 191–212. [Google Scholar] [CrossRef]
- Vıézhányó, T.; Felföldi, J. Enhancing colour differences in images of diseased mushrooms. Comput. Electron. Agric. 2000, 26, 187–198. [Google Scholar] [CrossRef]
- Jareanpon, C.; Khummanee, S.; Sriputta, P.; Scully, P. Developing an Intelligent Farm System to Automate Real-time Detection of Fungal Diseases in Mushrooms. Curr. Appl. Sci. Technol. 2024, 24, e0255708. [Google Scholar] [CrossRef]
- Mirza, S.; Nguyen, V.D.; Mantini, P.; Shah, S.K. Data Quality Aware Approaches for Addressing Model Drift of Semantic Segmentation Models. In Proceedings of the VISIGRAPP (3: VISAPP), Rome, Italy, 27–29 February 2024; pp. 333–341. [Google Scholar]
- Yin, H.; Yi, W.; Hu, D. Computer vision and machine learning applied in the mushroom industry: A critical review. Comput. Electron. Agric. 2022, 198, 107015. [Google Scholar] [CrossRef]
- Kirillov, A.; Mintun, E.; Ravi, N.; Mao, H.; Rolland, C.; Gustafson, L.; Xiao, T.; Whitehead, S.; Berg, A.C.; Lo, W.Y.; et al. Segment Anything. arXiv 2023, arXiv:2304.02643. [Google Scholar]
- Zhou, Y.; Barnes, C.; Lu, J.; Yang, J.; Li, H. On the Continuity of Rotation Representations in Neural Networks. In Proceedings of the 2019 Conference on Computer Vision and Pattern Recognition (CVPR), Long Beach, CA, USA, 15–20 June 2019. [Google Scholar]
- Ren, S.; He, K.; Girshick, R.; Sun, J. Faster R-CNN: Towards Real-Time Object Detection with Region Proposal Networks. In Advances in Neural Information Processing Systems, Proceedings of the Twenty-Eighth Annual Conference on Neural Information Processing Systems (NIPS 2015), December 7–12 2015, Palais des Congrès de Montréal, Montréal, Canada; Curran Associates, Inc.: Red Hook, NY, USA, 2015; Volume 28, Available online: https://proceedings.neurips.cc/paper_files/paper/2015/file/14bfa6bb14875e45bba028a21ed38046-Paper.pdf (accessed on 13 May 2025).
- Howard, A.; Sandler, M.; Chu, G.; Chen, L.C.; Chen, B.; Tan, M.; Wang, W.; Zhu, Y.; Pang, R.; Vasudevan, V.; et al. Searching for MobileNetV3. In Proceedings of the IEEE/CVF International Conference on Computer Vision (ICCV), Seoul, Republic of Korea, 27 October–2 November 2019. [Google Scholar]
- He, K.; Zhang, X.; Ren, S.; Sun, J. Deep Residual Learning for Image Recognition. In Proceedings of the IEEE Conference on Computer Vision and Pattern Recognition (CVPR), Las Vegas, NV, USA, 27–30 June 2016. [Google Scholar]
- He, K.; Gkioxari, G.; Dollar, P.; Girshick, R. Mask R-CNN. In Proceedings of the IEEE International Conference on Computer Vision (ICCV), Venice, Italy, 22–29 October 2017. [Google Scholar]
- Tan, M.; Le, Q.V. EfficientNet: Rethinking Model Scaling for Convolutional Neural Networks. arXiv 2020, arXiv:1905.11946. [Google Scholar]
- Lv, W.; Xu, S.; Zhao, Y.; Wang, G.; Wei, J.; Cui, C.; Du, Y.; Dang, Q.; Liu, Y. DETRs Beat YOLOs on Real-time Object Detection. arXiv 2023, arXiv:2304.08069. [Google Scholar]
- Wang, C.Y.; Liao, H.Y.M.; Wu, Y.H.; Chen, P.Y.; Hsieh, J.W.; Yeh, I.H. CSPNet: A New Backbone That Can Enhance Learning Capability of CNN. In Proceedings of the IEEE/CVF Conference on Computer Vision and Pattern Recognition (CVPR) Workshops, Seattle, WA, USA, 13–19 June 2020. [Google Scholar]
- Wang, C.Y.; Yeh, I.H.; Liao, H.Y.M. YOLOv9: Learning What You Want to Learn Using Programmable Gradient Information. arXiv 2024, arXiv:2402.13616. [Google Scholar]
- Huynh, D.Q. Metrics for 3D Rotations: Comparison and Analysis. J. Math. Imaging Vis. 2009, 35, 155–164. [Google Scholar] [CrossRef]
Disclaimer/Publisher’s Note: The statements, opinions and data contained in all publications are solely those of the individual author(s) and contributor(s) and not of MDPI and/or the editor(s). MDPI and/or the editor(s) disclaim responsibility for any injury to people or property resulting from any ideas, methods, instructions or products referred to in the content. |
© 2025 by the authors. Licensee MDPI, Basel, Switzerland. This article is an open access article distributed under the terms and conditions of the Creative Commons Attribution (CC BY) license (https://creativecommons.org/licenses/by/4.0/).