Abstract
X-ray imaging, as a technique of non-destructive testing, has demonstrated considerable promise in COVID-19 diagnosis, particularly if supplemented with artificial intelligence (AI). Both radiologic technologists and AI researchers have raised the alarm about having to use increased doses of radiation in order to get more refined images and, hence, enhance diagnostic precision. In this research, we assess whether the disparity in exposure to the radiation dose considerably influences the credibility of AI-based diagnostic systems for COVID-19. A heterogeneous dataset of chest X-rays acquired at varying degrees of radiation exposure was run through four convolutional neural networks: VGG16, VGG19, ResNet50, and ResNet50V2. Results indicated above 91% accuracies, demonstrating that greater radiation exposure does not appreciably enhance diagnostic accuracy. Low radiation exposure sufficient to be utilized by human radiologists is therefore adequate for AI-based diagnosis. These findings are useful to the medical community, emphasizing that maximum diagnostic accuracy using AI does not need increased doses of radiation, thus further guaranteeing the safe application of X-ray imaging in COVID-19 diagnosis and possibly other medical and veterinary applications.
1. Introduction
X-rays are a non-destructive imaging technique [1] essential for a wide range of applications across the medical field [1,2,3,4,5,6,7,8,9,10,11,12,13,14,15,16,17]. In medicine, X-rays play a critical role as an in vivo diagnostic method, which is important to detect various diseases and injuries and guide medical interventions [1,18,19,20,21,22,23,24,25,26,27,28,29,30]. For example, the last four years have seen a rising trend of radiologists analyzing digital images of chest X-rays to detect COVID in patients’ lungs [31,32,33,34,35,36,37,38,39]. However, if this application is not administered correctly by radiologists or radiologic technologists during COVID testing, it can lead to excessive radiation dose exposure, which can cause nausea, anemia, cataracts, leukopenia, sterility, hemorrhage, necrosis, erythema, leukemia, cancer, solid tumors or genetic effects in the patients [40].
Recent trends in COVID testing have led to a proliferation of studies describing the use of digital images of chest X-rays by Artificial Intelligence (AI)-based tools [41] to diagnose COVID [31,32,33,34,35,36,42,43]. These studies apply AI to different datasets comprised of chest X-ray images obtained from different countries [37,44,45,46]. Although these studies strived to discuss COVID testing and diagnoses as globally as possible, they were limited by the range of images that were available at the time their research was conducted (2020 and 2021). During this period, many chest X-rays were performed, but few of them were made available for scientific research purposes due to ethical reasons [47]. Furthermore, none of these studies described any investigation into COVID testing and diagnosis in the context of non-destructive testing (NDT) methods.
The rising trend towards using digital images of chest X-rays by AI-based tools to detect COVID has also seen a rising trend for some beliefs. For example, nowadays, some radiologic technologists are concerned about increasing patient exposure to radiation doses, aiming to obtain X-ray results in more detailed [48,49]. This fact is due to the belief that AI-based tools need images with a higher level of detail to detect diseases. Similarly, to help encourage this belief, some computer scientists, in turn, attribute the low accuracy achieved by their AI-based tools for COVID detection to a supposed low level of detail present in current chest X-ray images. At the center of this controversy is the patient who may sometimes be receiving unnecessary doses of radiation [50,51,52,53].
Questions have been raised about increasing patient exposure to radiation doses with the aim of influencing the level of detail in chest radiographic images [54], thereby leading us to develop two hypotheses. If these radiologic technologists and computer scientists are correct in believing that X-rays with a higher level of detail are mandatory for AI-based tools to achieve high levels of accuracy in diagnosing COVID [48], then (1) these tools can only recognize COVID from X-rays related to high levels of radiation but not lower levels and (2) only advanced versions of AI-based tools would be capable to achieve high accuracy in the diagnosis of COVID from these types of datasets, excluding experimental tools. This study is motivated by the possibility of finding answers to these two hypotheses.
There is no precise or pre-established limit to a patient’s level of radiation exposure while performing images to correctly diagnose COVID [55]. It depends on many variables, such as the brand and model of X-ray equipment, adjustment and maintenance of the equipment, recommendations from local, regional, or national organizations linked to radiology, and radiologic technologists’ selection criteria [54,56,57,58]. The characteristics of the observed patient also greatly influence the degree of this exposure, for example, gender, age, size, skin thickness, history of diseases, body mass index, etc. [57]. These variables indicate that there is great diversity in a patient’s exposure levels to radiation doses represented by digital images of chest X-rays from datasets obtained from different regions of the same country or in different countries [59,60]. Therefore, the more diverse the dataset, ideally containing images of numerous patients with different characteristics and obtained from different countries, the greater the tendency for this same dataset to have been performed not only at high levels of patient exposure to radiation doses [61,62]. A systematic understanding of whether the diversity of patient exposure levels to radiation doses influences the accuracy of AI-based tools (including experimental versions) while diagnosing COVID from chest X-rays is still lacking in order to find the responses to our hypotheses.
This study aims to investigate whether the diversity of patient exposure levels to radiation doses influences the accuracy achieved by some computational tools that use AI to diagnose COVID from digital images of chest X-rays and whether experimental versions of an AI-based tool would be able to achieve high accuracy in COVID diagnosis.
This study uses recent data from a diversified dataset to investigate our hypothesis. This dataset provides chest X-ray images from a wide range of patients across the globe, achieving a more international perspective on the issue [63]. Therefore, these images were performed not only at high levels of patient exposure to radiation doses [61,62]. In developing and applying an AI-based, experimental tool that can diagnose COVID, this study employed an empirical approach to all related research. The idea is to investigate whether our experimental tool is able to achieve high accuracy in COVID diagnosis when analyzing this diversified dataset. The results achieved are compared with the results obtained by other AI-based tools that also diagnose COVID [34,35,36,64,65].
The innovation of this paper is that, to the knowledge of the authors, this is the first work to describe a study about COVID testing and diagnosis that takes the context of NDT methods into consideration.
Furthermore, the two main contributions of this paper are: (1) Patients do not need to be exposed to more than the minimum radiation necessary to produce an adequate image in order to allow radiologists or computer scientists to perform their respective work. (2) This paper is a reference for computer scientists, radiologic technologists, and physicians to ensure that X-rays will actually be used as an NDT method by AI-based tools to analyze digital images of chest X-rays in order to detect COVID in the lungs of patients.
The remainder of this paper is organized as follows: Section 2 presents the main concepts used in the development of this study. Section 3 describes the methodology in detail, including image selection and preparation and the implementation of neural networks. Section 4 presents the results obtained, including an analysis of the accuracy of each neural network tested. Section 5 presents the conclusions of this study, as well as suggestions for future work.
2. Background
The background presents important concepts featured in this paper, such as (1) The use of non-destructive testing using X-rays in medicine. (2) A brief introduction to COVID-19 and the use of imaging testing to detect it. (3) The definition of digital image processing and its stages. (4) The concepts of machine learning, neural networks, and their elements are presented, along with an introduction to the neural networks used in this work: VGG16, VGG19, ResNet50, and ResNet50V2.
2.1. Non-Destructive Testing Using X-Ray in Medicine
Inappropriate use of radiation for testing is more dangerous than the radiation itself. The advantages of X-ray testing are much greater than the risks involved, but still require caution. The risk of a single radiographic imaging exam is very minimal as long as medical practice standards are properly followed to the letter. Therefore, to be non-destructive, testing using X-rays in medicine is subject to adherence to the following guidelines: (1) Recommendations from the World Health Organization (WHO) [66]. (2) ALARA protocol (As Low As Reasonably Achievable) [55]. (3) Diagnostic Reference Levels (DRL) [67]. (4) Exposure index [68].
Regarding X-ray-based testing, the WHO [66] recommends that: (1) The patient be subjected to the lowest dose of radiation that allows radiographs of sufficient quality to provide an adequate diagnosis of the disease or injury presented by the patient. (2) Repeating examinations due to interpretation errors caused by the presence of undesirable structures on radiographs should be avoided as much as possible, as this doubles the radiation dose in the same patient.
ALARA is a protocol that recommends doses as low as reasonably achievable [55]. The ALARA protocol is a regulatory requirement for radiological protection programs and must be used in all activities involving the application of radiation. When it comes to disease testing in patients, the ALARA protocol aims to minimize patient exposure to radiation doses. Therefore, consistent application of the ALARA protocol can help prevent overexposure or unnecessary exposure of patients to radiation doses.
DRL are values that serve as reference levels for X-ray testing because they indicate whether the dose to be applied to a patient during the testing is abnormally high or abnormally low [67]. These values are defined by certain patient characteristics such as age, gender, and Body Mass Index. Patients with similar characteristics are classified within the same group, which is then assigned a specific DRL. DRL is associated with X-ray examination modalities rather than individual patients.
In digital radiology, controlling the patient’s exposure to radiation doses must also consider the exposure index, which is related to the image quality for an accurate disease diagnosis [68]. This exposure index is calculated by the values of the pixels of the anatomical regions present in the image and is used by the image processing algorithm to achieve the gray scale tone considered ideal for each of these regions. Therefore, the exposure index is obtained by considering the average value calculated based on the pixels restricted to the anatomical limits and, therefore, correlated to the clinical region of interest. The average value of the radiation exposure index can be calculated based on the correct positioning of the structure to be tested and adequate collimation (the process used to make the X-ray beams’ trajectories more precisely parallel, reduce scattered radiation, and as a result, minimize the volume of the patient’s exposed tissue, while also improving image contrast). This index is important for radiology because it can indicate the most appropriate radiation exposure for each case. Additionally, it can be used as a reference for patient dose management and quality assurance programs.
2.2. COVID-19
In December 2019, an outbreak of pneumonia of unknown origin was reported in Wuhan, Hubei province, China [69]. Its origin was discovered shortly afterward when it was found that the disease was caused by the SARS-CoV-2 virus. Subsequently, the disease was named coronavirus (COVID-19). On 12 March 2020, the global spread of SARS-CoV-2 and the thousands of deaths it caused led the WHO to declare a pandemic [70].
Images Use in COVID-19 Diagnosis
Imaging exams were initially used as the primary tool for diagnosing COVID-19 due to the high cost of other diagnostic methods and the high incidence rate of the disease around the world. Currently, one of the main protocols for urgent diagnosis in suspected cases of the disease is the use of Computed Tomography (CT) or chest X-ray images. The main advantage of using these exams is their easy accessibility, as they are already used in diagnosing various other diseases [71].
Another reason imaging exams are used in diagnosis is that approximately 59% of infected patients show changes in imaging exams. However, an exam that shows no alterations cannot be used as the sole source to confirm that a person is not infected, as a clear imaging exam is not an exclusion factor [71]. For illustration purposes, Figure 1a shows a chest X-ray with indications of COVID-19, and Figure 1b shows an exam with no indications of the disease.
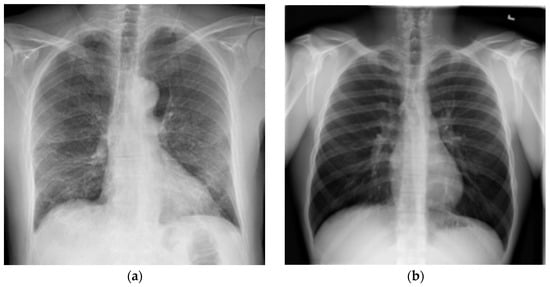
Figure 1.
Chest X-ray examples: (a) Test with COVID-19 evidence; (b) Test without COVID-19 evidence (Source: [63]).
2.3. Digital Image Processing
Digital image processing (DIP) is a set of techniques for processing multidimensional data that take an image as input. In most cases, DIP is not a trivial task as it involves a series of interconnected tasks ranging from image capture to the interpretation and recognition of objects. DIP can be linked to machine learning techniques and pattern recognition, making the process automated.
2.4. Machine Learning
Machine learning (ML) is the science that aims to analyze data and create computational learning models. It is considered a branch of computational algorithms designed to emulate human intelligence by learning from the surrounding environment [72].
ML algorithms can be classified as “soft-coded”, meaning they do not need to be programmed to achieve the desired task and reach a result. This classification can be explained by the fact that such algorithms adapt or alter their architecture through repetition to become increasingly better at performing the task. This process is known as training, where input data and desired results are produced. The algorithm then configures itself to try to achieve the expected results [72].
To learn from the surrounding environment, the ML can use several learning algorithms. An example of a learning method is linear regression. This method “learns” which line best represents the data dispersion on the plane. Additionally, artificial neural networks can also be mentioned.
2.4.1. Artificial Neural Network
An Artificial Neural Network (ANN) is an artificial intelligence method that processes data in a way inspired by the human brain. Within machine learning, this process is called deep learning and uses interconnected nodes or neurons in a layered structure, similar to the human brain. A neuron is an object in a neural network that receives data and the weights of each connection [73]. The management of these weights is carried out by a process called training, which is responsible for extracting and classifying the characteristics of the network’s input data.
In implementing an ANN, it is necessary to identify and define some variables, such as:
- The number of nodes (neurons) in the input layer, which are responsible for receiving the input data and providing it to the rest of the neural network;
- The number of hidden layers and the number of neurons to be placed in these layers, which are responsible for processing the data;
- The number of neurons in the output layer, which are responsible for producing the final output of the neural network and obtaining a result.
Figure 2 graphically represents an example of an artificial neural network, which contains two inputs, two hidden layers with four neurons each, and two outputs.
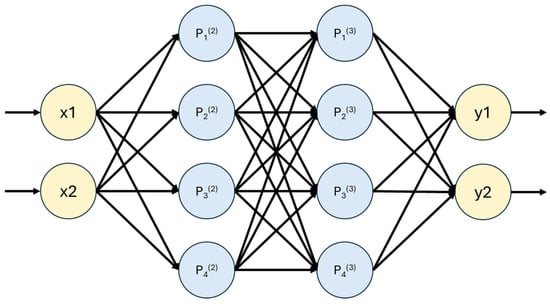
Figure 2.
Graphical representation of an Artificial Neural Network.
Artificial neural networks are typically used to solve problems in which the behavior of the variables is not completely known. One of their main characteristics is the ability to learn through examples and generalize the learned information [16].
2.4.2. Convolutional Neural Network
A Convolutional Neural Network (CNN) is a type of neural network specifically designed to facilitate image analysis. It is currently regarded as the most accurate model for data classification in this domain. This effectiveness is attributed to its ability to reduce the high dimensionality of images without losing essential information, all of which is achieved through output optimization [74].
A CNN is similar to a classical neural network in terms of data manipulation, but it presents additional benefits. The most beneficial aspect of CNNs is the reduction of the number of parameters to be trained [70]. This skill allows more complex tasks to be addressed with CNN models, which was not possible with classical neural networks.
As well as neural networks, CNNs are composed of an input layer, an output layer, and several hidden layers between them. In Figure 3, one can observe the graphical architecture of a CNN with its different layers.
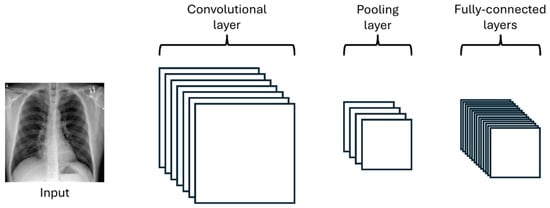
Figure 3.
Graphical representation of a Convolutional Neural Network architecture.
The convolutional layer is a fundamental part of the operation of a CNN. In this layer, small matrices, usually smaller than the input image, filled with weights, are defined. These matrices are called kernels. The output of a convolutional layer is first calculated by overlaying the kernel on the input and then by summing the multiplication of the kernel values with the corresponding pixel of the image. In Figure 4, one can more clearly observe the operation of the layer being applied to an image of size 3 × 3 with a smaller kernel of size 2 × 2.
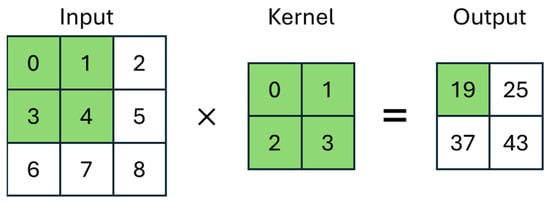
Figure 4.
Graphical representation of the Convolutional Neural Network layer.
The pooling layer’s function is a filter used to reduce the size of the image, thus reducing the computational processing required to work with it [33]. There are several types of pooling, with max pooling and average pooling being the most popular filters. In the case presented in Figure 5, the two 2 × 2 filters (Max-Pool and Average-Pool) are applied to a 4 × 4 input image. The filter size determines the region of the input image where it will be applied and the size of the output image. In max pooling, the algorithm seeks the maximum value among those found in the region of the input image that is delimited by the filter, and in average pooling, the average of the found values is calculated.
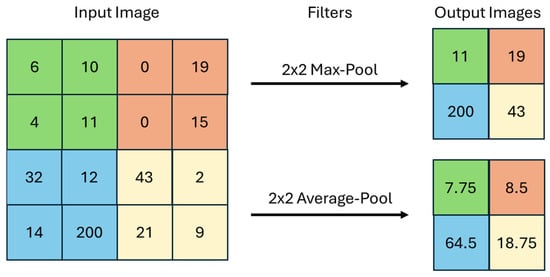
Figure 5.
Graphical representation of a max pooling and an average pooling.
Finally, the fully connected layers perform the same tasks found in classical neural networks: the classification of input data.
2.4.3. Hyperparameters
Hyperparameters are external parameters that determine the structure and behavior of a neural network, influencing how the model is trained and how it learns from input data. Unlike the parameters of the neural network, which are adjusted during training, hyperparameters are defined before training and are usually empirically optimized to improve the model’s accuracy [75]. Examples of hyperparameters include the activation function, the cost function, the learning rate, and the batch size.
Activation Function
Activation functions are used to introduce non-linearity into the CNN model so that the network can progressively learn more effective feature representations [76]. In a CNN, activation functions transform an input signal into an output signal, which is then fed as input to the next layer of the network [77]. Activation is applied to the weighted sum of the input and corresponding weights. Examples include Linear, Sigmoid, Rectified Linear Unit (ReLU), and Softmax. ReLU and Softmax functions were used in the development of this work.
ReLU is a widely used activation function. Its main advantage is that it helps prevent the vanishing gradient problem, which is common in deep neural networks, as it keeps the gradient constant in positive regions [78]. Additionally, ReLU deactivates a neuron when the output of the linear transformation is less than or equal to zero, which helps reduce computational complexity [79]. This is because the output of the function is zero for all negative input values, and the output is equal to the input for positive values. Equation (1) mathematically represents ReLU [79].
Softmax is an activation function commonly used for classifying the output results of a neural network. It returns values in the range of 0 to 1 that can be interpreted as probabilities of the analyzed data belonging to a certain class. Equation (2) mathematically represents Softmax [79].
Cost Function
The cost function measures the discrepancy between the outputs predicted by the neural network and the corresponding actual values in the training data. The main objective of the cost function is to quantify how well the network is making its predictions, allowing optimization techniques, which are responsible for efficiently adjusting the weights, to minimize this discrepancy.
An example of a cost function is Categorical Crossentropy, which is one of the main functions used in the literature for multi-class problems. Equation (3) mathematically represents Categorical Crossentropy [75].
Learning Rate
The learning rate determines how quickly the neural network adjusts weights during the training process. A low learning rate results in smaller weight adjustments with each iteration. This can lead to a more accurate convergence. However, a very low learning rate can slow down training, requiring a greater number of iterations to reach convergence. On the other hand, a high learning rate allows the weights to be adjusted in large steps with each iteration. This can speed up the training process, but it can also result in oscillations or even cause the model to not reach the correct convergence [80].
Batch Size
The batch size defines the number of training samples used in each weight update, directly interfering with the network’s learning speed. A small batch size provides more accurate gradient estimates but can increase training time as it requires more weight updates. On the other hand, a larger batch size speeds up training as it allows us to perform more examples in parallel, optimizing the use of available computational resources. However, this requires more memory to be performed [75].
2.5. VGG
The Visual Geometry Group (VGG) is a research group in computer vision and machine learning based at the University of Oxford, United Kingdom [81]. VGG is known for several groundbreaking works in CNNs, including VGGNet (or VGG16), which is one of the first deep CNNs with many layers. Following VGG16, several other models were developed, including VGG19.
2.5.1. VGG16
VGG16 is a CNN model developed by the researchers A. Zisserman and K. Simonyan from the University of Oxford [81]. The model consists of 16 layers, including 13 convolutional layers and 3 fully connected layers. VGG16 is capable of classifying images into 1000 different categories of objects, animals, vehicles, foods, and more. Figure 6 graphically represents the architecture of VGG16.

Figure 6.
Graphical representation of the VGG16 model (Source: Adapted from [81]).
The CNN takes as input an image of size 224 × 224 pixels and then applies a series of convolutional layers with a kernel size of 3 × 3, 64 filters, and ReLU activation, interspersed with max pooling layers to reduce the image size. Following this, several fully connected layers with ReLU activation are added to classify the data, followed by a layer with the Softmax activation function to calculate the probability of each class and classify the input image [80].
2.5.2. VGG19
VGG19 is a CNN model with a concept very similar to that of VGG16. The main difference between them is that VGG19 supports 19 layers, consisting of 16 convolutional layers and 3 fully connected layers, with the layer characteristics being identical. VGG19 was proposed in 2014 and is widely used as a reference in image classification tasks. Figure 7 graphically represents the architecture of VGG19.

Figure 7.
Graphical representation of the VGG19 model (Source: Adapted from [81]).
2.6. ResNet
Residual Neural Network (ResNet) is a CNN architecture developed by Microsoft Research in 2015 [82], and it has two versions, ResNet and ResNetV2. It was designed to address the vanishing gradient problem, which occurs when the network becomes very deep, causing the weight updates during training to become progressively smaller. The solution to this problem was proposed using residual blocks that allow inputted information to flow directly to the output layers, bypassing the intermediate layers [82].
The structure of the residual block differs according to the version of the model. In the first version, represented in Figure 8a, the main path of the residual block consists of three convolutional layers, usually with a reduced number of filters, followed by a ReLU activation layer. Figure 8b represents the structure of the residual block in the ResNetV2 version, where the ReLU activation precedes the convolutional layers.
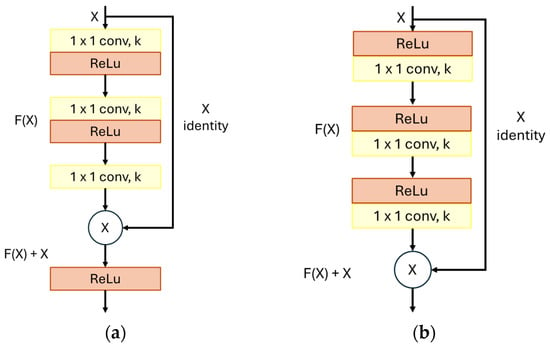
Figure 8.
Graphical representation of ResNet block: (a) ResNet block; (b) ResNetV2 block. (Source: Adapted from [82]).
In both versions, in addition to the main path, the residual block has a shortcut, allowing information to flow directly from the input to the output of the block. In practice, the shortcut enables the neural network to skip one or more convolutional layers in the main path, thereby accelerating the training process and improving the model’s accuracy [82].
2.6.1. ResNet50
ResNet50 is a CNN model designed to facilitate the training of deeper networks by avoiding the accuracy degradation problem that occurs as network depth increases. It achieves this using the previously mentioned residual blocks. This model supports 50 layers and was trained on a large dataset of images. It is commonly used as a foundation for more complex networks with many categories. Figure 9 graphically represents the architecture of ResNet50.
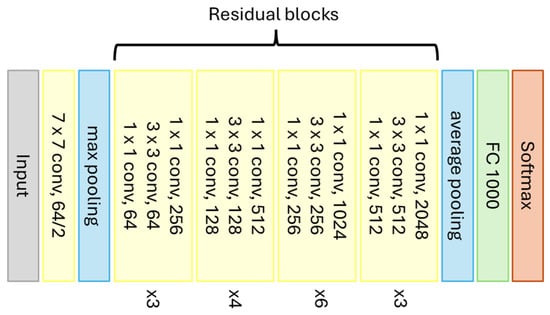
Figure 9.
Graphical representation of the ResNet50 model (Source: Adapted from [82]).
The architecture of ResNet50 also starts with the input of a 224 × 224 pixel image and is then divided into five stages as follows [82]:
- Stage 1: Consists of a single convolutional layer with 64 filters and a kernel size of 7 × 7. This layer is used to reduce the size of the input image;
- Stage 2: Consists of three residual blocks, each containing three convolutional layers: two with 64 filters and one with 256 filters. These layers further reduce the image size and extract low-level features;
- Stage 3: Consists of four residual blocks, each containing three convolutional layers: two with 128 filters and one with 512 filters. These layers are used to extract mid-level features;
- Stage 4: Consists of six residual blocks, each containing three convolutional layers: two with 256 filters and one with 1024 filters. These layers are used to extract high-level features;
- Stage 5: Consists of three residual blocks, each containing three convolutional layers: two with 512 filters and one with 2048 filters. These layers are used to further refine the extracted features.
Between Stages 1 and 2, the CNN goes through a max pooling layer. After Stage 5, the network goes through an average pooling layer, followed by a fully connected layer, and finally, the Softmax function to classify the output data.
2.6.2. ResNet50V2
ResNet50V2 is a CNN model considered the evolution of ResNet50. Despite having similar concepts, the more updated version of the model offers better efficiency and accuracy.
Although they have similar architectures, the main difference between ResNet50V2 and its predecessor is the use of the updated version of the residual block, which includes an activation layer before the convolutional layer in each residual block. Additionally, ResNet50V2 uses a different weight initialization scheme and an activation attenuation technique to further improve the model’s accuracy [82].
3. Materials and Methods
3.1. Materials
This research was carried out using the “COVID-19 Radiography Database”, which has more than 15,000 chest X-ray images that highlight a host of varying characteristics, including whether there is evidence of COVID-19, Pneumonia or if there are no signs of any diseases
Table 1 presents the description of the dataset, including the source of the images, patient characteristics, and the range of radiation doses.

Table 1.
Description of the dataset, including the source of the images, patient characteristics, and the range of radiation doses.
In Table 1, body mass index (BMI) is an international measure used to calculate whether an individual is at an ideal weight. BMI is determined by dividing an individual’s mass by the square of their height, where mass is given in kilograms and height in meters. It is expressed in kg/m2 [90].
The BMI value is important because it influences the choice of radiation doses applied to each patient. Radiation doses can be expressed using three radiological parameters (exposure factors): kilovolt peak (in kVp), milliampere-seconds (in mAs), and source-to-image distance (SID, in cm) [91,92,93].
Regarding other resources used during the research, both the free and Pro versions of Google Colab were used. These environments provided access to cloud-based NVIDIA GPUs, such as Tesla T4 or P100, depending on availability. While the exact GPU model varied throughout the development, the hardware was sufficient for efficient training.
3.2. Methods
Figure 10 presents a flowchart that summarizes and exemplifies non-destructive testing using X-rays to diagnose COVID-19 by artificial intelligence. The flowchart presents the four main steps of the methodology: Non-Destructive Taking of X-rays, Image Selection, Pre-processing, and Neural Networks Application.

Figure 10.
Flowchart of non-destructive testing using X-rays to diagnose COVID by AI.
3.2.1. Non-Destructive Taking of X-Rays
The first step presented in the Flowchart represents an ideal situation, i.e., how the testing should be conducted so that it is considered truly non-destructive. Taking into account that the image dataset used in this study is quite diverse in terms of countries and regions where these images were obtained, it is assumed that not all X-rays were taken in accordance with the WHO, ALARA, DRL, or Exposure index. However, this is of minor importance for this study because the content of the image dataset used is suitable for investigating our research questions.
3.2.2. Image Selection
The dataset images were captured in different ways since they come from different sources. For example, the dataset contains frontal and lateral X-ray images. However, only images from frontal exams were selected for classification in this work.
Following the mentioned steps and considering that data balancing techniques across classes are necessary when minority classes are more important [65], 1000 images were selected, 500 of which present signs of COVID-19 and the other 500 without any evidence of the disease. Figure 11 shows some exam images from both classes selected for classification.
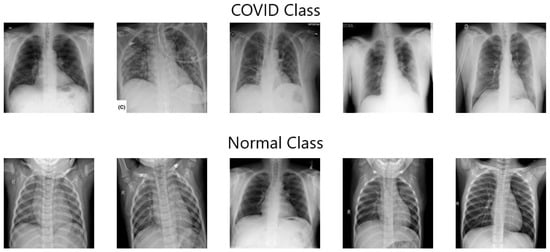
Figure 11.
Example of the dataset used for classification (Source: [63]).
3.2.3. Pre-Processing
In Computed Radiology, image processing is commonly performed by the radiology systems themselves in order to display the image in an optimal manner. The rendering of an image should not change due to different levels of exposure as it would for analog systems. For this reason, the ALARA (As Low As Reasonably Achievable Doses) principles and good radiographic techniques should be followed. The image will not appear darker because it has been overexposed [58,94].
In the sequence, to enable the use of the images as input for the neural networks, it was necessary to carry out a pre-processing step using the OpenCV library in Python 3.9. In this process, all images were resized to 224 × 224 pixels to standardize the inputs. Furthermore, intensity normalization was applied to the images by scaling pixel values to the [0, 1] range. The images did not receive any enhancement pre-processing steps, such as noise reduction.
After that, the images were split according to their class. Then, we named one class “COVID” since it contained images of exams with signs of COVID-19 and the other class “Normal” since it contained images of exams without signs of the disease.
Next, the dataset was split using the simple split approach, also known as the hold-out approach [95]. In this way, the images were separated into three sets: 70% belong to the training set, 10% to the validation set, and 20% to the test set. The training set is used for training the neural network. The validation set is used to evaluate the effectiveness of the network during the training process with a different set from the training set. The test set is used after training the network to calculate the accuracy obtained by the trained model.
3.2.4. Neural Networks Application
The CNN models chosen to be implemented were VGG16, VGG19, ResNet50, and ResNet50V2. All of them are pre-trained networks implemented with Python programming language and Keras library [96], both of which are widely used in the construction of deep neural networks. In the end, the networks were performed using the open-source library Tensorflow through a virtual machine provided by Google Colaboratory (Colab) [97].
All neural networks were pre-trained with weights provided by ImageNet [98], a large image dataset developed to be used in computer vision tasks, such as object recognition and detection and image classification. Using these weights can significantly improve CNN accuracy on a specific task, thereby reducing the training time needed to achieve good results.
The weights directly affect the number of parameters in the model, which can influence the amount of memory and power required to run the model during training. Models with more parameters generally have a greater capacity to learn and memorize complex patterns, but they can be more difficult to train and require more computational resources, such as memory and processing power. On the other hand, models with fewer parameters may be easier to train, but they may not have the same ability to capture the complexity of the input data. Table 2 presents the amount of memory required by each CNN model during training, expressed in megabytes (MB).

Table 2.
Amount of memory required by each CNN model during training.
The models were configured with specific hyperparameters to meet the needs of the problem in question, which has two distinct classes. Softmax activation function was chosen for the output layer, as it is widely used when assigning a probability to each class. As for the cost function, we opted for Categorical Crossentropy, which is one of the main functions used in the literature to obtain the cost value in problems with multiple classes.
Some of the hyperparameters were defined through testing during the model training process to achieve good accuracy across all networks. Adaptive Moment Estimation (ADAM) optimization technique was employed, and a dropout value of 0.6 was used to avoid overfitting, which occurs when a model adapts too much to the training data and is unable to generalize patterns and useful features for test data [99].
The learning rate determines how quickly the model adjusts weights during training and was set to 1 × 10⁻³. The batch size defines the number of training samples used in each weight update and was defined as 32. These chosen values were selected to seek a balance between accuracy and necessary computational power. The choice of hyperparameters was based on configurations widely used in the literature for image classification tasks using convolutional neural networks [100,101,102].
Tests were carried out with values of 75, 100, and 150 to determine the appropriate number of epochs. The objective was to choose the value that presented the best accuracy for the CNN models tested. Tests with a greater number of epochs were also carried out, but it was found that there was no significant accuracy improvement that would justify the increase in computational power required.
After completing the definition of the hyperparameters, the process of training the neural networks started using the training and validation sets. Subsequently, to evaluate the accuracy of the trained models, the test set was used to generate the values of the evaluation metrics.
4. Results
4.1. Metrics
In evaluating the accuracy of a neural network, it is necessary to define the metrics to be used. These metrics are crucial because they allow for an assessment of how well the neural network is functioning with respect to the training and testing data. There are many different evaluation metrics, and their use depends on the type of problem being solved. In the subject-matter literature, the most commonly used metrics are confusion matrices, accuracy, precision, recall, and F1 score.
4.1.1. Confusion Matrix
The confusion matrix is a table that shows the frequency with which the model’s predictions match or do not match the actual classes of the examples. Other metrics can be calculated using the values obtained from the confusion matrix.
Table 3 shows where the actual and predicted outputs should be placed to be classified. The possible classifications are true positive (TP), true negative (TN), false positive (FP), and false negative (FN).

Table 3.
Confusion matrix.
4.1.2. Accuracy
Accuracy is the proportion of correct predictions made by the neural network, whether they are positive or negative. It is normally used to express the quality of the classification [103]. The calculation of accuracy is performed as shown in Equation (4).
4.1.3. Precision
Precision is a measure that indicates the proportion of positive cases that were correctly classified from input data [103]. The calculation of precision is performed as shown in Equation (5).
4.1.4. Recall
Recall is a measure used to evaluate the neural network’s ability to detect all samples of a specific class; in other words, it indicates how well the classifier labels positive cases that are actually positive [103]. The calculation of recall is performed as shown in Equation (6).
4.1.5. F1 Score
The F1 score is an important measure to evaluate the quality of a classification model, especially when the classes are imbalanced. A high F1 score indicates that the model performs well in classifying samples into their respective classes. It is the harmonic mean of Recall and Precision metrics [103]. The calculation of the F1 score is performed as shown in Equation (7).
4.2. Presentation, Analysis, and Comparison of Results
The results of this work are presented in three stages. First, the results of the training process for each model are presented. Next, the results of the testing process for each model are shown. Finally, the results are analyzed, and a comparison between the selected models is conducted.
4.2.1. Training Process Results
All RNN models were trained three times, with 75, 100, and 150 epochs, allowing for a more precise analysis of accuracy variation over time. In evaluating which number of epochs achieved the highest accuracy, the used criterion was training and validation accuracy. Table 4 presents the average training and validation accuracies.

Table 4.
Average training and validation accuracy values.
By analyzing the average accuracy of all RNN models studied here, we found that training with 150 epochs achieved the highest accuracy. Therefore, we used the models trained with 150 epochs for the remaining procedures in this work. Figure 12 provides a more detailed breakdown of the training and validation accuracy of the models trained with 150 epochs, shown through accuracy per epoch graphs.
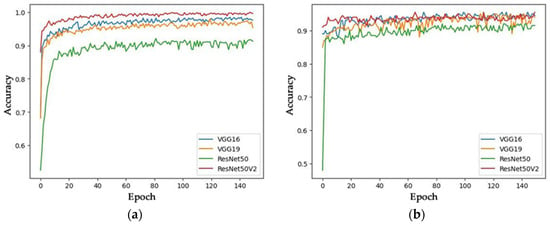
Figure 12.
Training and Validation Accuracy of Models Trained with 150 Epochs: (a) Training accuracy; (b) Validation accuracy.
4.2.2. Tests Results
The accuracy of the RNN models was measured through the testing process, which received 200 images as input—104 from the Normal class and 96 from the COVID class—and predicted the class to which each image belongs. After all images were tested, the process results from the confusion matrix for each model, which is represented in Figure 13.
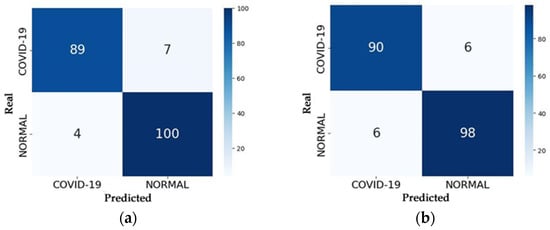
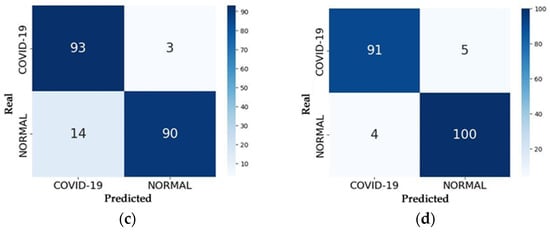
Figure 13.
Confusion Matrices of the Models: (a) VGG16; (b) VGG19; (c) ResNet50; (d) ResNet50V2.
With the confusion matrix in hand, one can analyze the number of correct predictions made by the model by summing up the values along the main diagonal and the number of errors by summing the values along the secondary diagonal. Evaluation metrics such as accuracy, precision, recall, and F1 score can be calculated using the equations provided in Section 4.1. Table 5 presents the accuracy values of each model in the testing process, representing the percentage of correct predictions on the test set compared to values obtained by other studies.

Table 5.
Accuracy values of the trained models compared to values obtained by other studies.
Table 6 presents the values of the other evaluation metrics. These metrics are calculated for both classes of images in the test set.

Table 6.
Precision, recall, and F1 score values of the trained models.
4.2.3. Analysis of Results
The accuracy analysis of the RNN models considered the results from the training, validation, and testing processes presented in Section 4.2.1 and Section 4.2.2. The aim of the analysis is to draw general conclusions from the presented results and determine which of the implemented RNN models is best suited for classifying chest X-ray images in the used dataset.
During the training and validation process, the ResNet50V2 model achieved the fastest convergence and the highest average accuracy. This is likely due to the use of residual blocks in its architecture, which allowed the network to retain information across layers, thus enabling more efficient and accurate training.
Similar to the training process, the ResNet50V2 model achieved the highest accuracy during the testing process among the implemented models. It correctly predicted 191 out of the 200 tested images, achieving an accuracy of 95.55% and F1 scores of 95% and 96% for the COVID and Normal classes, respectively. The most frequent error the model made was predicting an image as Normal when it belonged to the COVID class, which is also known as a false-Normal. Figure 14 presents two examples of predictions made by the ResNet50V2 model.
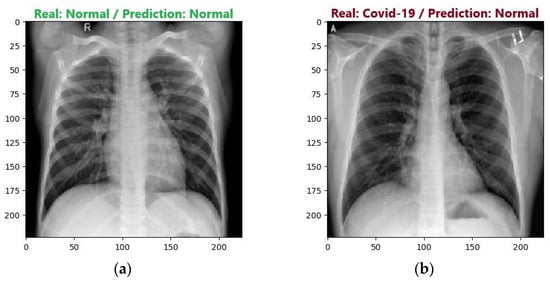
Figure 14.
Examples of ResNet50V2 model predictions: (a) Correct prediction; (b) Incorrect prediction.
During the testing process, the VGG16 and VGG19 models achieved accuracies of 94.50% and 94%, respectively. However, when evaluating the metrics, the VGG16 model demonstrated a slightly superior accuracy. The main difference between the models’ results is the most commonly made error. While the VGG16 model had more errors in predicting the Normal class, the VGG19 model had more errors in predicting the COVID class. Figure 15 presents the most common errors of the models.
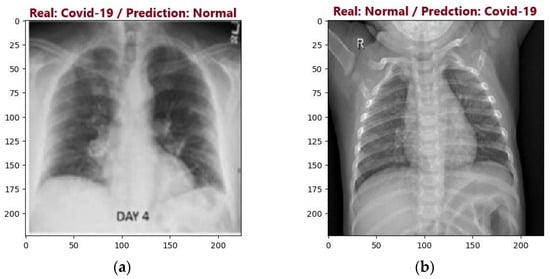
Figure 15.
Examples of VGG16 and VGG19 models incorrect predictions: (a) Incorrect VGG16 model prediction; (b) Incorrect VGG19 model prediction.
One possible explanation for the slight advantage of the VGG16 model compared to the VGG19 model could be a better adaptation of the model to the dataset used in this work. Additionally, another possible explanation is that the VGG19 model may have experienced more overfitting on the training data, thereby resulting in lower accuracy in the validation and testing processes.
The ResNet50 model achieved the lowest accuracy among the implemented networks, correctly predicting 183 out of the 200 tested images, resulting in an accuracy of 91.50%. When the metrics are analyzed, they reveal an important class imbalance. Among the implemented models, ResNet50 had the highest number of false-COVID errors but also the lowest number of false-Normal errors, with only 3.
Based on the results obtained and analyzed using the available images in the dataset and the pre-configured hyperparameters, it was found that considering accuracy alone, the ResNet50V2 model is the most suitable for classification. During the training process, the model achieved the fastest convergence, along with the best F1 score and accuracy during the testing process.
However, since this problem involves the diagnosis of a disease, the accuracy analysis of the models should not consider only accuracy. It is also necessary to analyze the two types of errors. In a real situation, a false-Normal error can have more severe consequences compared to a false-COVID error. A patient who is ill but receives a negative test result may not be treated correctly, thus potentially worsening their health over time. Conversely, a healthy patient who receives a positive test result may undergo a more detailed medical evaluation, which could include additional diagnostic tests to correct the error.
This analysis can be performed by examining the recall values for both classes for each model, which refers to the model’s ability to correctly detect samples of images from each class. In other words, the higher the recall for the Normal class, the lower the occurrence of false-COVID errors. Conversely, the higher the recall for the COVID class, the lower the occurrence of false-Normal errors.
In this regard, the ResNet50 model can be considered the most suitable for classification, even though it achieved the lowest accuracy among the implemented models. This is because the model obtained the highest recall percentage for the COVID class (97%), thereby reducing the chance of false-Normal errors, which are considered the most severe in a real-world scenario.
On the other hand, it can be stated that the least reliable model for classification is the VGG16. Although it achieved strong accuracy and F1 scores, the model had the worst recall for the COVID class (93%) and consequently recorded the highest number of false-Normal errors, totaling 7.
Analyzing the confusion matrices presented in Figure 13, it is possible to note that a neural network can obtain a higher number of one type of error compared to other neural networks while obtaining the lowest number in another type of error. For example, in the testing process, the VGG16 network obtained the highest number of false negative errors but also obtained the lowest number of false positive errors. On the other hand, ResNet50 obtained the highest number of false positive errors, while the number of false negative errors was the lowest among the tested networks. These discrepancies that occur between the types of errors can be justified by the different internal structures of each neural network, such as the residual blocks existing in the architecture of ResNet networks.
When comparing the results obtained with the proposed methodology with other studies in the literature (Table 5), it is possible to observe that there are significant differences in the results obtained between the different papers. In general, the differences in accuracy values for each proposal are justified by the diversity between the images and the number of images present in the datasets used in each work or even by the pre-processing steps performed on the images. It is worth mentioning that in this work, no pre-processing steps were performed to enhance the images and that the dataset used is composed of lung X-ray images of the COVID and NORMAL classes, while other studies use different classes, such as COVID and PNEUMONIA [34].
5. Conclusions
One of the objectives of this study was to investigate the possibility of patient exposure to different levels of radiation doses influencing the accuracy achieved by computational tools that use AI to diagnose COVID from chest X-ray images. During our investigation, we found different studies describing the use of machine learning to detect COVID from X-ray images in the scientific literature. Those studies applied various AI-based techniques to different datasets of images obtained from diversified levels of patient exposure to radiation doses. Although they present differing results, such as (1) 94.7% accuracy using ResNet50 and SVN [31]; (2) 93% accuracy using VGG16 and 94% adding CheXpert [32]; (3) 91.4% accuracy concatenating Xception and ResNet50V2 [33], these results provide compelling evidence that they have achieved high accuracy to diagnose COVID when analyzing images obtained with diversified patient exposure levels to radiation doses.
This study also aimed to investigate whether experimental versions of an AI-based tool would be able to achieve high accuracy in COVID diagnosis. For this purpose, we performed a comparative analysis of the accuracy of the neural network models VGG16, VGG19, ResNet50, and ResNet50V2 in detecting possible positive COVID-19 diagnoses through chest X-ray images. Moreover, a dataset of images obtained from diversified levels of patient exposure to radiation doses was selected and split into training and test data.
When solely analyzing accuracy, it was observed that the model with the best accuracy is ResNet50V2, which achieved an accuracy of 95.55%. The VGG16 and VGG19 models obtained very similar results, with accuracies of 94.50% and 94%, respectively. Finally, the ResNet50 model obtained the worst results, with an accuracy of 91.50%, which, even so, are still considered highly accurate results. Therefore, the results achieved by our experimental versions of an AI-based tool presented in this paper compare well with the results presented by the advanced versions of AI-based tools presented in the scientific literature, such as [31,32,33,34,35,36,64,65].
When analyzing false-Normal errors, it was observed that the ResNet50 can be considered the best model to classify the X-ray images looking for COVID, because it has a low number of false-Normal errors. The false-Normal error can be considered relevant in health studies since this error can induce a physician to discharge even a very sick patient. Despite having achieved the lowest accuracy value, the model ResNet50 reached 97% recall with only three false-Normal errors. It has also been found that the VGG16 model is less reliable for performing the classification because it presented the worst recall, 93% (COVID), and the number of false-Normal errors was seven, which, even so, are also considered high accuracy results.
An outcome achieved in this study is that the average accuracy rate achieved by AI-based computational tools for COVID diagnosis is high. This high accuracy is present even in our developed AI-based experimental tool. Regarding the detection of COVID by AI-based tools, this fact implies that it is not necessary to expose patients to radiation doses higher than the minimum necessary to obtain adequate chest radiographic images, just as if the diagnoses were made by a radiologist.
We can conclude that the diversity of patient exposure levels to radiation doses does not influence the accuracy achieved by AI-based tools that diagnose COVID from digital images of chest X-rays. Patient exposure to radiation doses does not change the contrast of digital radiological images. That is the possible reason why the diversity of patient exposure levels to radiation doses does not interfere with the accuracy achieved by properly developed AI-based tools that diagnose COVID from digital images of chest X-rays. Furthermore, unlike analog systems, digital systems maintain the same representation of the image for different patients’ exposure levels to radiation doses because digital image processing displays the image optimally.
Therefore, the two main findings of this study are: (1) Although Weiss et al. state that X-ray is a non-destructive imaging technique in [1], this truth is not unconditional because in the medical field, X-rays are deemed to be non-destructive testing methods so long as they maintain the integrity of patients’ health by following the guidelines from the: World Health Organization (WHO) [66], ALARA protocol (As Low As Reasonably Achievable) [55], Diagnostic Reference Levels (DRL) [67], and Exposure Index [68]. (2) The diversity of patient exposure levels to radiation doses does not influence the accuracy achieved by properly developed computational tools that use AI to diagnose diseases from digital images of chest X-rays.
Although this research uses the diagnosis of COVID as a case study, the two main findings of this study are expected to remain steady to other pulmonary diseases. Therefore, a possible area of future research should be to investigate whether the approach could be applied to other pulmonary diseases.
Future studies will propose new neural network models to perform the same classification, such as DenseNet, with the goal of comparing the results of the new models with those of the pre-trained networks used in this study. Additionally, more detailed analyses should be performed on the characteristics of the unproperly developed AI-based tools that influence the accuracy of the neural network models.
It is expected that this study will provide the guidelines for: (1) Serving as a reference base for future studies that will continue to investigate the use of X-rays as a non-destructive imaging technique important to perform diagnoses when testing for diseases or injuries; (2) Enabling computer scientists to develop AI-based tools which are capable of achieving accurate COVID detection when analyzing images obtained without exposing patients to excessive radiation doses; (3) Exposing patients only to safe radiation during COVID testing implemented by radiologists and radiologic technologists. Beyond Medicine, these guidelines can be applied to a wide range of applications in many other scientific areas such as dentistry, veterinary, etc.
Author Contributions
Conceptualization, G.P.C., C.B.R.N. and M.A.D.; methodology, G.P.C., C.B.R.N. and M.A.D.; software, C.B.R.N.; validation, W.C., R.G.N. and E.A.d.S.; formal analysis, F.C.C. and R.J.d.S.; investigation, G.P.C., C.B.R.N., H.P.C. and M.A.D.; resources, E.A.d.S. and R.J.d.S.; data curation, W.C., R.G.N. and F.C.C.; writing—original draft preparation, G.P.C., C.B.R.N., H.P.C. and M.A.D.; writing—review, and editing, E.S.N., G.P.C., H.P.C. and M.A.D.; visualization, G.P.C. and M.A.D.; supervision, G.P.C. and M.A.D.; project administration, G.P.C. and M.A.D. All authors have read and agreed to the published version of the manuscript.
Funding
The APC was supported by UNESP PROPG through Edital PROPG 1/2025—Proposal 11321.
Data Availability Statement
The images used in this work were obtained from the public dataset available at [63].
Acknowledgments
The authors thank the UNESP PROPG to support the APC.
Conflicts of Interest
The authors declare no conflicts of interest.
References
- Weiss, M.; Brierley, N.; von Schmid, M.; Meisen, T. Simulation Study: Data-Driven Material Decomposition in Industrial X-Ray Computed Tomography. NDT 2024, 2, 1–15. [Google Scholar] [CrossRef]
- Ribeiro, M.R.; Dias, M.A.; de Best, R.; da Silva, E.A.; Neves, C.D.T.T. Enhancement and Segmentation of Dental Structures in Digitized Panoramic Radiography Images. Int. J. Appl. Math. 2014, 27. [Google Scholar] [CrossRef]
- Dharman, N.; Moses, J.C.; Olivete, C.J.; Dias, M.A. Survey on Different Bone Age Estimation Methods. Int. J. Adv. Res. Comput. Sci. Softw. Eng. 2014, 4, 1128–1131. [Google Scholar]
- Weiss, M.; Meisen, T. Reviewing Material-Sensitive Computed Tomography: From Handcrafted Algorithms to Modern Deep Learning. NDT 2024, 2, 286–310. [Google Scholar] [CrossRef]
- Brown, J.G. X-Rays and Their Applications; Springer: Boston, MA, USA, 1975; ISBN 978-1-4613-4400-1. [Google Scholar]
- Lftta, J.G.J.; Zahra, A.N.A.A.; Ashour, A.H.J.; Nasser, A.H.K.; Shanawa, A.N. X-Rays and Their Uses on The Human Body. Curr. Clin. Med. Educ. 2024, 2, 91–115. [Google Scholar]
- Rao, N.; Ament, B.; Parmee, R.; Cameron, J.; Mayo, M. Rapid, Non-Destructive Inspection and Classification of Inhalation Blisters Using Low-Energy X-Ray Imaging. J. Pharm. Innov. 2018, 13, 270–282. [Google Scholar] [CrossRef]
- Pessanha, S.; Braga, D.; Ensina, A.; Silva, J.; Vilchez, J.; Montenegro, C.; Barbosa, S.; Carvalho, M.L.; Dias, A. A Non-Destructive X-Ray Fluorescence Method of Analysis of Formalin Fixed-Paraffin Embedded Biopsied Samples for Biomarkers for Breast and Colon Cancer. Talanta 2023, 260, 124605. [Google Scholar] [CrossRef]
- Urban, T. Dark-Field Chest Radiography—Image Artifacts and COPD Assessment. Ph.D. Thesis, Technical University of Munich, Munich, Germany, 2023. [Google Scholar]
- Brunet, J.; Walsh, C.; Tafforeau, P.; Dejea, H.; Cook, A.; Bellier, A.; Engel, K.; Jonigkf, D.D.; Ackermann, M.; Lee, P. Hierarchical Phase-Contrast Tomography: A Non-Destructive Multiscale Imaging Approach for Whole Human Organs. In Proceedings of the Developments in X-Ray Tomography XV, San Diego, CA, USA, 18–23 August 2024; Müller, B., Wang, G., Eds.; SPIE: Bellingham, WA, USA, 2024; p. 40. [Google Scholar]
- Seifert, M.; Gallersdörfer, M.; Ludwig, V.; Schuster, M.; Horn, F.; Pelzer, G.; Rieger, J.; Michel, T.; Anton, G. Improved Reconstruction Technique for Moiré Imaging Using an X-Ray Phase-Contrast Talbot–Lau Interferometer. J. Imaging 2018, 4, 62. [Google Scholar] [CrossRef]
- Ludwig, V.; Seifert, M.; Hauke, C.; Hellbach, K.; Horn, F.; Pelzer, G.; Radicke, M.; Rieger, J.; Sutter, S.-M.; Michel, T.; et al. Exploration of Different X-Ray Talbot–Lau Setups for Dark-Field Lung Imaging Examined in a Porcine Lung. Phys. Med. Biol. 2019, 64, 065013. [Google Scholar] [CrossRef]
- Liu, J.T.C.; Glaser, A.K.; Bera, K.; True, L.D.; Reder, N.P.; Eliceiri, K.W.; Madabhushi, A. Harnessing Non-Destructive 3D Pathology. Nat. Biomed. Eng. 2021, 5, 203–218. [Google Scholar] [CrossRef]
- Dejea, H.; Garcia-Canadilla, P.; Cook, A.C.; Guasch, E.; Zamora, M.; Crispi, F.; Stampanoni, M.; Bijnens, B.; Bonnin, A. Comprehensive Analysis of Animal Models of Cardiovascular Disease Using Multiscale X-Ray Phase Contrast Tomography. Sci. Rep. 2019, 9, 6996. [Google Scholar] [CrossRef]
- Kourra, N.; Warnett, J.M.; Attridge, A.; Dibling, G.; McLoughlin, J.; Muirhead-Allwood, S.; King, R.; Williams, M.A. Non-Destructive Examination of Additive Manufactured Acetabular Hip Prosthesis Cups. In Proceedings of the Radiation Detectors in Medicine, Industry, and National Security XIX, San Diego, CA, USA, 19–23 August 2018; Grim, G.P., Barber, H.B., Furenlid, L.R., Koch, J.A., Eds.; SPIE: Bellingham, WA, USA, 2018; p. 14. [Google Scholar]
- du Plessis, A.; le Roux, S.G.; Guelpa, A. Comparison of Medical and Industrial X-Ray Computed Tomography for Non-Destructive Testing. Case Stud. Nondestruct. Test. Eval. 2016, 6, 17–25. [Google Scholar] [CrossRef]
- Velez-Cruz, A.J.; Farinas-Coronado, W. Review-Bone Characterization: Mechanical Properties Based on Non- Destructive Techniques. Athenea 2022, 3, 16–29. [Google Scholar] [CrossRef]
- Katsamenis, O.L.; Olding, M.; Warner, J.A.; Chatelet, D.S.; Jones, M.G.; Sgalla, G.; Smit, B.; Larkin, O.J.; Haig, I.; Richeldi, L.; et al. X-Ray Micro-Computed Tomography for Nondestructive Three-Dimensional (3D) X-Ray Histology. Am. J. Pathol. 2019, 189, 1608–1620. [Google Scholar] [CrossRef]
- Kamali Moghaddam, K.; Taheri, T.; Ayubian, M. Bone Structure Investigation Using X-Ray and Neutron Radiography Techniques. Appl. Radiat. Isot. 2008, 66, 39–43. [Google Scholar] [CrossRef]
- Uo, M.; Wada, T.; Sugiyama, T. Applications of X-Ray Fluorescence Analysis (XRF) to Dental and Medical Specimens. Jpn. Dent. Sci. Rev. 2015, 51, 2–9. [Google Scholar] [CrossRef]
- Potter, K.; Sweet, D.E.; Anderson, P.; Davis, G.R.; Isogai, N.; Asamura, S.; Kusuhara, H.; Landis, W.J. Non-Destructive Studies of Tissue-Engineered Phalanges by Magnetic Resonance Microscopy and X-Ray Microtomography. Bone 2006, 38, 350–358. [Google Scholar] [CrossRef]
- Alomari, A.H.; Wille, M.-L.; Langton, C.M. Bone Volume Fraction and Structural Parameters for Estimation of Mechanical Stiffness and Failure Load of Human Cancellous Bone Samples; in-Vitro Comparison of Ultrasound Transit Time Spectroscopy and X-Ray ΜCT. Bone 2018, 107, 145–153. [Google Scholar] [CrossRef]
- Hoffman, E.A. Origins of and Lessons from Quantitative Functional X-Ray Computed Tomography of the Lung. Br. J. Radiol. 2022, 95, 20211364. [Google Scholar] [CrossRef]
- Jiang, C.; Cheng, Y.; Cheng, B. Diagnosis of Osteoporosis by Bone X-Ray Based on Non-Destructive Compression. IEEE Access 2024, 12, 93946–93956. [Google Scholar] [CrossRef]
- Bardelli, F.; Brun, F.; Capella, S.; Bellis, D.; Cippitelli, C.; Cedola, A.; Belluso, E. Asbestos Bodies Count and Morphometry in Bulk Lung Tissue Samples by Non-Invasive X-Ray Micro-Tomography. Sci. Rep. 2021, 11, 10608. [Google Scholar] [CrossRef] [PubMed]
- Silva, J.M.; Zanette, I.; Noël, P.B.; Cardoso, M.B.; Kimm, M.A.; Pfeiffer, F. Three-Dimensional Non-Destructive Soft-Tissue Visualization with X-Ray Staining Micro-Tomography. Sci. Rep. 2015, 5, 14088. [Google Scholar] [CrossRef] [PubMed]
- Nakamura, S. Micro-CT and Lungs. In Multidisciplinary Computational Anatomy; Springer: Singapore, 2022; pp. 323–327. [Google Scholar]
- Nakamura, S.; Mori, K.; Iwano, S.; Kawaguchi, K.; Fukui, T.; Hakiri, S.; Ozeki, N.; Oda, M.; Yokoi, K. Micro-Computed Tomography Images of Lung Adenocarcinoma: Detection of Lepidic Growth Patterns. Nagoya J. Med. Sci. 2020, 82, 25–31. [Google Scholar] [CrossRef]
- Reichmann, J.; Verleden, S.E.; Kühnel, M.; Kamp, J.C.; Werlein, C.; Neubert, L.; Müller, J.-H.; Bui, T.Q.; Ackermann, M.; Jonigk, D.; et al. Human Lung Virtual Histology by Multi-Scale x-Ray Phase-Contrast Computed Tomography. Phys. Med. Biol. 2023, 68, 115014. [Google Scholar] [CrossRef] [PubMed]
- Wevers, M. X-Ray Computed Tomography for Non-Destructive Testing. In Proceedings of the 4th Conference on Industrial Computed Tomography (iCT), Wels, Austria, 19–21 September 2012; e-Journal of Nondestructive Testing: Wels, Austria, 2012. [Google Scholar]
- Ismael, A.M.; Şengür, A. Deep Learning Approaches for COVID-19 Detection Based on Chest X-Ray Images. Expert. Syst. Appl. 2021, 164, 114054. [Google Scholar] [CrossRef]
- Rajaraman, S.; Antani, S. Weakly Labeled Data Augmentation for Deep Learning: A Study on COVID-19 Detection in Chest X-Rays. Diagnostics 2020, 10, 358. [Google Scholar] [CrossRef]
- Rahimzadeh, M.; Attar, A. A Modified Deep Convolutional Neural Network for Detecting COVID-19 and Pneumonia from Chest X-Ray Images Based on the Concatenation of Xception and ResNet50V2. Inf. Med. Unlocked 2020, 19, 100360. [Google Scholar] [CrossRef]
- Shazia, A.; Xuan, T.Z.; Chuah, J.H.; Usman, J.; Qian, P.; Lai, K.W. A Comparative Study of Multiple Neural Network for Detection of COVID-19 on Chest X-Ray. EURASIP J. Adv. Signal Process. 2021, 2021, 50. [Google Scholar] [CrossRef]
- Narin, A.; Kaya, C.; Pamuk, Z. Automatic Detection of Coronavirus Disease (COVID-19) Using X-Ray Images and Deep Convolutional Neural Networks. Pattern Anal. Appl. 2021, 24, 1207–1220. [Google Scholar] [CrossRef]
- Abbas, A.; Abdelsamea, M.M.; Gaber, M.M. Classification of COVID-19 in Chest X-Ray Images Using DeTraC Deep Convolutional Neural Network. Appl. Intell. 2021, 51, 854–864. [Google Scholar] [CrossRef]
- Ugas-Charcape, C.F.; Ucar, M.E.; Almanza-Aranda, J.; Rizo-Patrón, E.; Lazarte-Rantes, C.; Caro-Domínguez, P.; Cadavid, L.; Pérez-Marrero, L.; Fazecas, T.; Gomez, L.; et al. Pulmonary Imaging in Coronavirus Disease 2019 (COVID-19): A Series of 140 Latin American Children. Pediatr. Radiol. 2021, 51, 1597–1607. [Google Scholar] [CrossRef]
- Furtado, A.; Andrade, L.; Frias, D.; Maia, T.; Badaró, R.; Nascimento, E.G.S. Deep Learning Applied to Chest Radiograph Classification—A COVID-19 Pneumonia Experience. Appl. Sci. 2022, 12, 3712. [Google Scholar] [CrossRef]
- Spina, S.V.; Campos Vieira, M.L.; Herrera, C.J.; Munera Echeverri, A.G.; Rojo, P.; Arrioja Salazar, A.S.; Vázquez Ortiz, Z.Y.; Arellano, R.B.; Reyes, G.; Millán, R.A.; et al. Cardiopulmonary Imaging Utilization and Findings among Hospitalized COVID-19 Patients in Latin America. Glob. Heart 2022, 17, 49. [Google Scholar] [CrossRef] [PubMed]
- Wilkins, R.; Abrantes, A.M.; Ainsbury, E.A.; Baatout, S.; Botelho, M.F.; Boterberg, T.; Filipová, A.; Hladik, D.; Kruse, F.; Marques, I.A.; et al. Radiobiology of Accidental, Public, and Occupational Exposures. In Radiobiology Textbook; Springer International Publishing: Cham, Switzerland, 2023; pp. 425–467. [Google Scholar]
- Clement David-Olawade, A.; Olawade, D.B.; Vanderbloemen, L.; Rotifa, O.B.; Fidelis, S.C.; Egbon, E.; Akpan, A.O.; Adeleke, S.; Ghose, A.; Boussios, S. AI-Driven Advances in Low-Dose Imaging and Enhancement—A Review. Diagnostics 2025, 15, 689. [Google Scholar] [CrossRef]
- Redie, D.K.; Sirko, A.E.; Demissie, T.M.; Teferi, S.S.; Shrivastava, V.K.; Verma, O.P.; Sharma, T.K. Diagnosis of COVID-19 Using Chest X-Ray Images Based on Modified DarkCovidNet Model. Evol. Intell. 2023, 16, 729–738. [Google Scholar] [CrossRef]
- Ibragimov, B.; Arzamasov, K.; Maksudov, B.; Kiselev, S.; Mongolin, A.; Mustafaev, T.; Ibragimova, D.; Evteeva, K.; Andreychenko, A.; Morozov, S. A 178-Clinical-Center Experiment of Integrating AI Solutions for Lung Pathology Diagnosis. Sci. Rep. 2023, 13, 1135. [Google Scholar] [CrossRef]
- Cohen, J.P.; Morrison, P.; Dao, L.; Roth, K.; Duong, T.; Ghassem, M. COVID-19 Image Data Collection: Prospective Predictions Are the Future. Mach. Learn. Biomed. Imaging 2020, 1, 1–38. [Google Scholar] [CrossRef]
- Moodley, S.; Sewchuran, T. Chest Radiography Evaluation in Patients Admitted with Confirmed COVID-19 Infection, in a Resource Limited South African Isolation Hospital. S. Afr. J. Radiol. 2022, 26, 7. [Google Scholar] [CrossRef]
- Benmessaoud, M.; Dadouch, A.; Abdelmajid, M.; Abir, A.; El-Ouardi, Y.; Lemmassi, A.; Nouader, K.; Chibani, I. Diagnostic Accuracy of Chest Computed Tomography for Detecting COVID-19 Pneumonia in Low Disease Prevalence Area: A Local Experience. Adv. Life Sci. 2021, 8, 355–359. [Google Scholar]
- Malone, J. X-Rays for Medical Imaging: Radiation Protection, Governance and Ethics over 125 Years. Phys. Medica 2020, 79, 47–64. [Google Scholar] [CrossRef]
- Ryan, J.L. Ionizing Radiation: The Good, the Bad, and the Ugly. J. Investig. Dermatol. 2012, 132, 985–993. [Google Scholar] [CrossRef] [PubMed]
- Darcy, S.; Rainford, L.; Kelly, B.; Toomey, R. Decision Making and Variation in Radiation Exposure Factor Selection by Radiologic Technologists. J. Med. Imaging Radiat. Sci. 2015, 46, 372–379. [Google Scholar] [CrossRef] [PubMed]
- Ria, F.; Bergantin, A.; Vai, A.; Bonfanti, P.; Martinotti, A.S.; Redaelli, I.; Invernizzi, M.; Pedrinelli, G.; Bernini, G.; Papa, S.; et al. Awareness of Medical Radiation Exposure among Patients: A Patient Survey as a First Step for Effective Communication of Ionizing Radiation Risks. Phys. Medica 2017, 43, 57–62. [Google Scholar] [CrossRef]
- Singh, N.; Mohacsy, A.; Connell, D.A.; Schneider, M.E. A Snapshot of Patients’ Awareness of Radiation Dose and Risks Associated with Medical Imaging Examinations at an Australian Radiology Clinic. Radiography 2017, 23, 94–102. [Google Scholar] [CrossRef]
- Ko, J.; Kim, Y. Evaluation of Effective Dose during X-Ray Training in a Radiological Technology Program in Korea. J. Radiat. Res. Appl. Sci. 2018, 11, 383–392. [Google Scholar] [CrossRef]
- Karavas, E.; Ece, B.; Aydın, S.; Kocak, M.; Cosgun, Z.; Bostanci, I.E.; Kantarci, M. Are We Aware of Radiation: A Study about Necessity of Diagnostic X-Ray Exposure. World J. Methodol. 2022, 12, 264–273. [Google Scholar] [CrossRef]
- Oglat, A.A. Comparison of X-Ray Films in Term of KVp, MA, Exposure Time and Distance Using Radiographic Chest Phantom as a Radiation Quality. J. Radiat. Res. Appl. Sci. 2022, 15, 100479. [Google Scholar] [CrossRef]
- Atci, I.B.; Yilmaz, H.; Antar, V.; Ozdemir, N.G.; Baran, O.; Sadillioglu, S.; Ozel, M.; Turk, O.; Yaman, M.; Topacoglu, H. What Do We Know about ALARA? Is Our Knowledge Sufficient about Radiation Safety? J. Neurosurg. Sci. 2017, 61, 597–602. [Google Scholar] [CrossRef]
- Mahesh, M. Essential Role of a Medical Physicist in the Radiology Department. RadioGraphics 2018, 38, 1665–1671. [Google Scholar] [CrossRef]
- Dance, D.R.; Christofides, S.; Maidment, A.D.A.; McLean, I.D.; Ng, K.-H. Diagnostic Radiology Physics: A Handbook for Teachers and Students; International Atomic Energy Agency: Vienna, Austria, 2014; ISBN 9789201310101. [Google Scholar]
- Seeram, E. Digital Radiography: Physical Principles and Quality Control, 2nd ed.; Springer: Singapore, 2019; ISBN 978-981-13-3243-2. [Google Scholar]
- Smith-Bindman, R.; Wang, Y.; Chu, P.; Chung, R.; Einstein, A.J.; Balcombe, J.; Cocker, M.; Das, M.; Delman, B.N.; Flynn, M.; et al. International Variation in Radiation Dose for Computed Tomography Examinations: Prospective Cohort Study. BMJ 2019, 364, k4931. [Google Scholar] [CrossRef]
- Candemir, S.; Antani, S. A Review on Lung Boundary Detection in Chest X-Rays. Int. J. Comput. Assist. Radiol. Surg. 2019, 14, 563–576. [Google Scholar] [CrossRef] [PubMed]
- Brambilla, M.; Vassileva, J.; Kuchcinska, A.; Rehani, M.M. Multinational Data on Cumulative Radiation Exposure of Patients from Recurrent Radiological Procedures: Call for Action. Eur. Radiol. 2020, 30, 2493–2501. [Google Scholar] [CrossRef] [PubMed]
- Tsapaki, V.; Ahmed, N.A.; AlSuwaidi, J.S.; Beganovic, A.; Benider, A.; BenOmrane, L.; Borisova, R.; Economides, S.; El-Nachef, L.; Faj, D.; et al. Radiation Exposure to Patients During Interventional Procedures in 20 Countries: Initial IAEA Project Results. Am. J. Roentgenol. 2009, 193, 559–569. [Google Scholar] [CrossRef]
- Rahman, T.; Chowdhury, M.; Khandakar, A. COVID-19 Radiography Database; Kaggle: San Francisco, CA, USA, 2022. [Google Scholar]
- Apostolopoulos, I.D.; Mpesiana, T.A. COVID-19: Automatic Detection from X-Ray Images Utilizing Transfer Learning with Convolutional Neural Networks. Phys. Eng. Sci. Med. 2020, 43, 635–640. [Google Scholar] [CrossRef]
- Punn, N.S.; Agarwal, S. Automated Diagnosis of COVID-19 with Limited Posteroanterior Chest X-Ray Images Using Fine-Tuned Deep Neural Networks. Appl. Intell. 2021, 51, 2689–2702. [Google Scholar] [CrossRef]
- World Health Organization. International Basic Safety Standards for Protection Against Ionizing Radiation and for the Safety of Radiation Sources; World Health Organization: Geneva, Switzerland, 1994. [Google Scholar]
- Damilakis, J.; Frija, G.; Brkljacic, B.; Vano, E.; Loose, R.; Paulo, G.; Brat, H.; Tsapaki, V. How to Establish and Use Local Diagnostic Reference Levels: An ESR EuroSafe Imaging Expert Statement. Insights Imaging 2023, 14, 27. [Google Scholar] [CrossRef]
- Erenstein, H.G.; Browne, D.; Curtin, S.; Dwyer, R.S.; Higgins, R.N.; Hommel, S.F.; Menzinga, J.; Pires Jorge, J.A.; Sauty, M.; de Vries, G.; et al. The Validity and Reliability of the Exposure Index as a Metric for Estimating the Radiation Dose to the Patient. Radiography 2020, 26, S94–S99. [Google Scholar] [CrossRef]
- Ciotti, M.; Ciccozzi, M.; Terrinoni, A.; Jiang, W.-C.; Wang, C.-B.; Bernardini, S. The COVID-19 Pandemic. Crit. Rev. Clin. Lab. Sci. 2020, 57, 365–388. [Google Scholar] [CrossRef]
- World Health Organization Coronavirus Disease (COVID-19) Pandemic. Available online: https://www.who.int/emergencies/diseases/novel-coronavirus-2019 (accessed on 11 January 2023).
- De Carvalho, É.; Malta, R.; Coelho, A.; Baffa, M. Automatic Detection of COVID-19 in X-Ray Images Using Fully-Connected Neural Networks. In Proceedings of the Anais do XVI Workshop de Visão Computacional (WVC 2020), Sociedade Brasileira de Computação—SBC, Uberlandia, Brazil, 7–8 October 2020; pp. 41–45. [Google Scholar]
- Tecuci, G. Artificial Intelligence. WIREs Comput. Stat. 2012, 4, 168–180. [Google Scholar] [CrossRef]
- Wang, S.-C. Artificial Neural Network. In Interdisciplinary Computing in Java Programming; Springer: Boston, MA, USA, 2003; pp. 81–100. [Google Scholar]
- O’Shea, K.; Nash, R. An Introduction to Convolutional Neural Networks. arXiv 2015, arXiv:1511.08458. [Google Scholar]
- Nielsen, M. Neural Networks and Deep Learning; Springer: Berlin/Heidelberg, Germany, 2019. [Google Scholar]
- Banerjee, C.; Mukherjee, T.; Pasiliao, E. An Empirical Study on Generalizations of the ReLU Activation Function. In Proceedings of the 2019 ACM Southeast Conference, Kennesaw, GA, USA, 18–20 April 2019; ACM: New York, NY, USA, 2019; pp. 164–167. [Google Scholar]
- Fleck, L.; Tavares, M.H.F.; Eyng, E.; Helmann, A.C.; Andrade, M.A. de M. Redes Neurais Artificiais: Princípios Básicos. Rev. Eletrônica Científica Inovação Tecnol. 2016, 7, 47. [Google Scholar] [CrossRef]
- Maas, A.L. Rectifier Nonlinearities Improve Neural Network Acoustic Models. In Proceedings of the 30th International Conference on Machine Learning, Atlanta, GA, USA, 16–21 June 2013. [Google Scholar]
- Sharma, S.; Sharma, S.; Athaiya, A. Activation Functions in Neural Networks. Int. J. Eng. Appl. Sci. Technol. 2020, 4, 310–316. [Google Scholar] [CrossRef]
- Theckedath, D.; Sedamkar, R.R. Detecting Affect States Using VGG16, ResNet50 and SE-ResNet50 Networks. SN Comput. Sci. 2020, 1, 79. [Google Scholar] [CrossRef]
- Simonyan, K.; Zisserman, A. Very Deep Convolutional Networks for Large-Scale Image Recognition. arXiv 2015, arXiv:1409.1556. [Google Scholar]
- He, K.; Zhang, X.; Ren, S.; Sun, J. Deep Residual Learning for Image Recognition. In Proceedings of the 2016 IEEE Conference on Computer Vision and Pattern Recognition (CVPR), Las Vegas, NV, USA, 27–30 June 2016; IEEE: Piscataway, NJ, USA, 2016; pp. 770–778. [Google Scholar]
- Institute for Diagnostic and Interventional Radiology; Hannover Medical School COVID-19 Image Repository. Available online: https://github.com/ml-workgroup/covid-19-image-repository/blob/master/readme.md (accessed on 12 April 2025).
- Haghanifar, A.; Majdabadi, M.M.; Choi, Y.; Deivalakshmi, S.; Ko, S. COVID-CXNet: Detecting COVID-19 in Frontal Chest X-Ray Images Using Deep Learning. Multimed. Tools Appl. 2020, 81, 30615–30645. [Google Scholar] [CrossRef]
- Anouk Stein, M.D.; Wu, C.; Carr, C.; Shih, G.; Dulkowski, J.; kalpathy; Chen, L.; Prevedello, L.; Marc Kohli, M.D.; McDonald, M.; et al. RSNA Pneumonia Detection Challenge; Kaggle: San Francisco, CA, USA, 2018. [Google Scholar]
- Kermany, D.; Zhang, K.; Goldbaum, M. Labeled Optical Coherence Tomography (OCT) and Chest X-Ray Images for Classification. Available online: https://data.mendeley.com/datasets/rscbjbr9sj/2 (accessed on 12 April 2025).
- European Society of Radiology Eurorad. Available online: https://www.myesr.org/ (accessed on 1 January 2025).
- de la Iglesia Vayá, M.; Saborit-Torres, J.M.; Montell Serrano, J.A.; Oliver-Garcia, E.; Pertusa, A.; Bustos, A.; Cazorla, M.; Galant, J.; Barber, X.; Orozco-Beltrán, D.; et al. BIMCV COVID-19-: A Large Annotated Dataset of RX and CT Images from COVID-19 Patients; IEEE: Piscataway, NJ, USA, 2021. [Google Scholar]
- Società Italiana di Radiologia Medica e Intervenntistica SIRM. Available online: https://sirm.org/ (accessed on 1 January 2025).
- Hamd, Z.Y.; Alrebdi, H.I.; Osman, E.G.; Awwad, A.; Alnawwaf, L.; Nashri, N.; Alfnekh, R.; Khandaker, M.U. Optimization of Chest X-Ray Exposure Factors Using Machine Learning Algorithm. J. Radiat. Res. Appl. Sci. 2023, 16, 100518. [Google Scholar] [CrossRef]
- Brady, Z.; Scoullar, H.; Grinsted, B.; Ewert, K.; Kavnoudias, H.; Jarema, A.; Crocker, J.; Wills, R.; Houston, G.; Law, M.; et al. Technique, Radiation Safety and Image Quality for Chest X-Ray Imaging through Glass and in Mobile Settings during the COVID-19 Pandemic. Phys. Eng. Sci. Med. 2020, 43, 765–779. [Google Scholar] [CrossRef]
- Junda, M.; Muller, H.; Friedrich-Nel, H. Local Diagnostic Reference Levels for Routine Chest X-Ray Examinations at a Public Sector Hospital in Central South Africa. Health SA Gesondheid 2021, 26, 8. [Google Scholar] [CrossRef]
- Yacoob, H.Y.; Mohammed, H.A. Assessment of Patients X-Ray Doses at Three Government Hospitals in Duhok City Lacking Requirements of Effective Quality Control. J. Radiat. Res. Appl. Sci. 2017, 10, 183–187. [Google Scholar] [CrossRef]
- Jones, A.K.; Heintz, P.; Geiser, W.; Goldman, L.; Jerjian, K.; Martin, M.; Peck, D.; Pfeiffer, D.; Ranger, N.; Yorkston, J. Ongoing Quality Control in Digital Radiography: Report of AAPM Imaging Physics Committee Task Group 151. Med. Phys. 2015, 42, 6658–6670. [Google Scholar] [CrossRef]
- Michelucci, U. Model Validation and Selection. In Fundamental Mathematical Concepts for Machine Learning in Science; Springer International Publishing: Cham, Switzerland, 2024; pp. 153–184. [Google Scholar]
- Keras Keras Webpage. Available online: https://keras.io/ (accessed on 13 June 2024).
- COLAB. COLAB Website. Available online: https://colab.research.google.com/notebooks/intro.ipynb (accessed on 16 April 2023).
- IMAGENET. IMAGENET Website. Available online: https://www.image-net.org/ (accessed on 16 April 2023).
- Ying, X. An Overview of Overfitting and Its Solutions. J. Phys. Conf. Ser. 2019, 1168, 022022. [Google Scholar] [CrossRef]
- Sen, S.Y.; Ozkurt, N. Convolutional Neural Network Hyperparameter Tuning with Adam Optimizer for ECG Classification. In Proceedings of the 2020 Innovations in Intelligent Systems and Applications Conference (ASYU), Istanbul, Turkey, 15–17 October 2020; IEEE: Piscataway, NJ, USA, 2020; pp. 1–6. [Google Scholar]
- Khaire, U.M.; Dhanalakshmi, R. High-Dimensional Microarray Dataset Classification Using an Improved Adam Optimizer (IAdam). J. Ambient. Intell. Humaniz. Comput. 2020, 11, 5187–5204. [Google Scholar] [CrossRef]
- Bock, S.; Weis, M. A Proof of Local Convergence for the Adam Optimizer. In Proceedings of the 2019 International Joint Conference on Neural Networks (IJCNN), Budapest, Hungary, 14–19 July 2019; IEEE: Piscataway, NJ, USA, 2019; pp. 1–8. [Google Scholar]
- Foody, G.M. Challenges in the Real World Use of Classification Accuracy Metrics: From Recall and Precision to the Matthews Correlation Coefficient. PLoS ONE 2023, 18, e0291908. [Google Scholar] [CrossRef] [PubMed]
Disclaimer/Publisher’s Note: The statements, opinions and data contained in all publications are solely those of the individual author(s) and contributor(s) and not of MDPI and/or the editor(s). MDPI and/or the editor(s) disclaim responsibility for any injury to people or property resulting from any ideas, methods, instructions or products referred to in the content. |
© 2025 by the authors. Licensee MDPI, Basel, Switzerland. This article is an open access article distributed under the terms and conditions of the Creative Commons Attribution (CC BY) license (https://creativecommons.org/licenses/by/4.0/).