1. Background
The advent of Industry 4.0 has pushed significant advancements in monitoring and maintaining complex industrial systems through integrating digital technologies such as digital twins (DTs). These virtual replicas of physical assets provide real-time insights into system behavior, enabling prognostics and health management (PHM) strategies that minimize downtime, optimize maintenance schedules, and extend asset lifespans [
1,
2]. The nexus between the analytics developed for PHM applications and a digital twin (DT) of an asset highlight how DTs can enable PHM applications (see
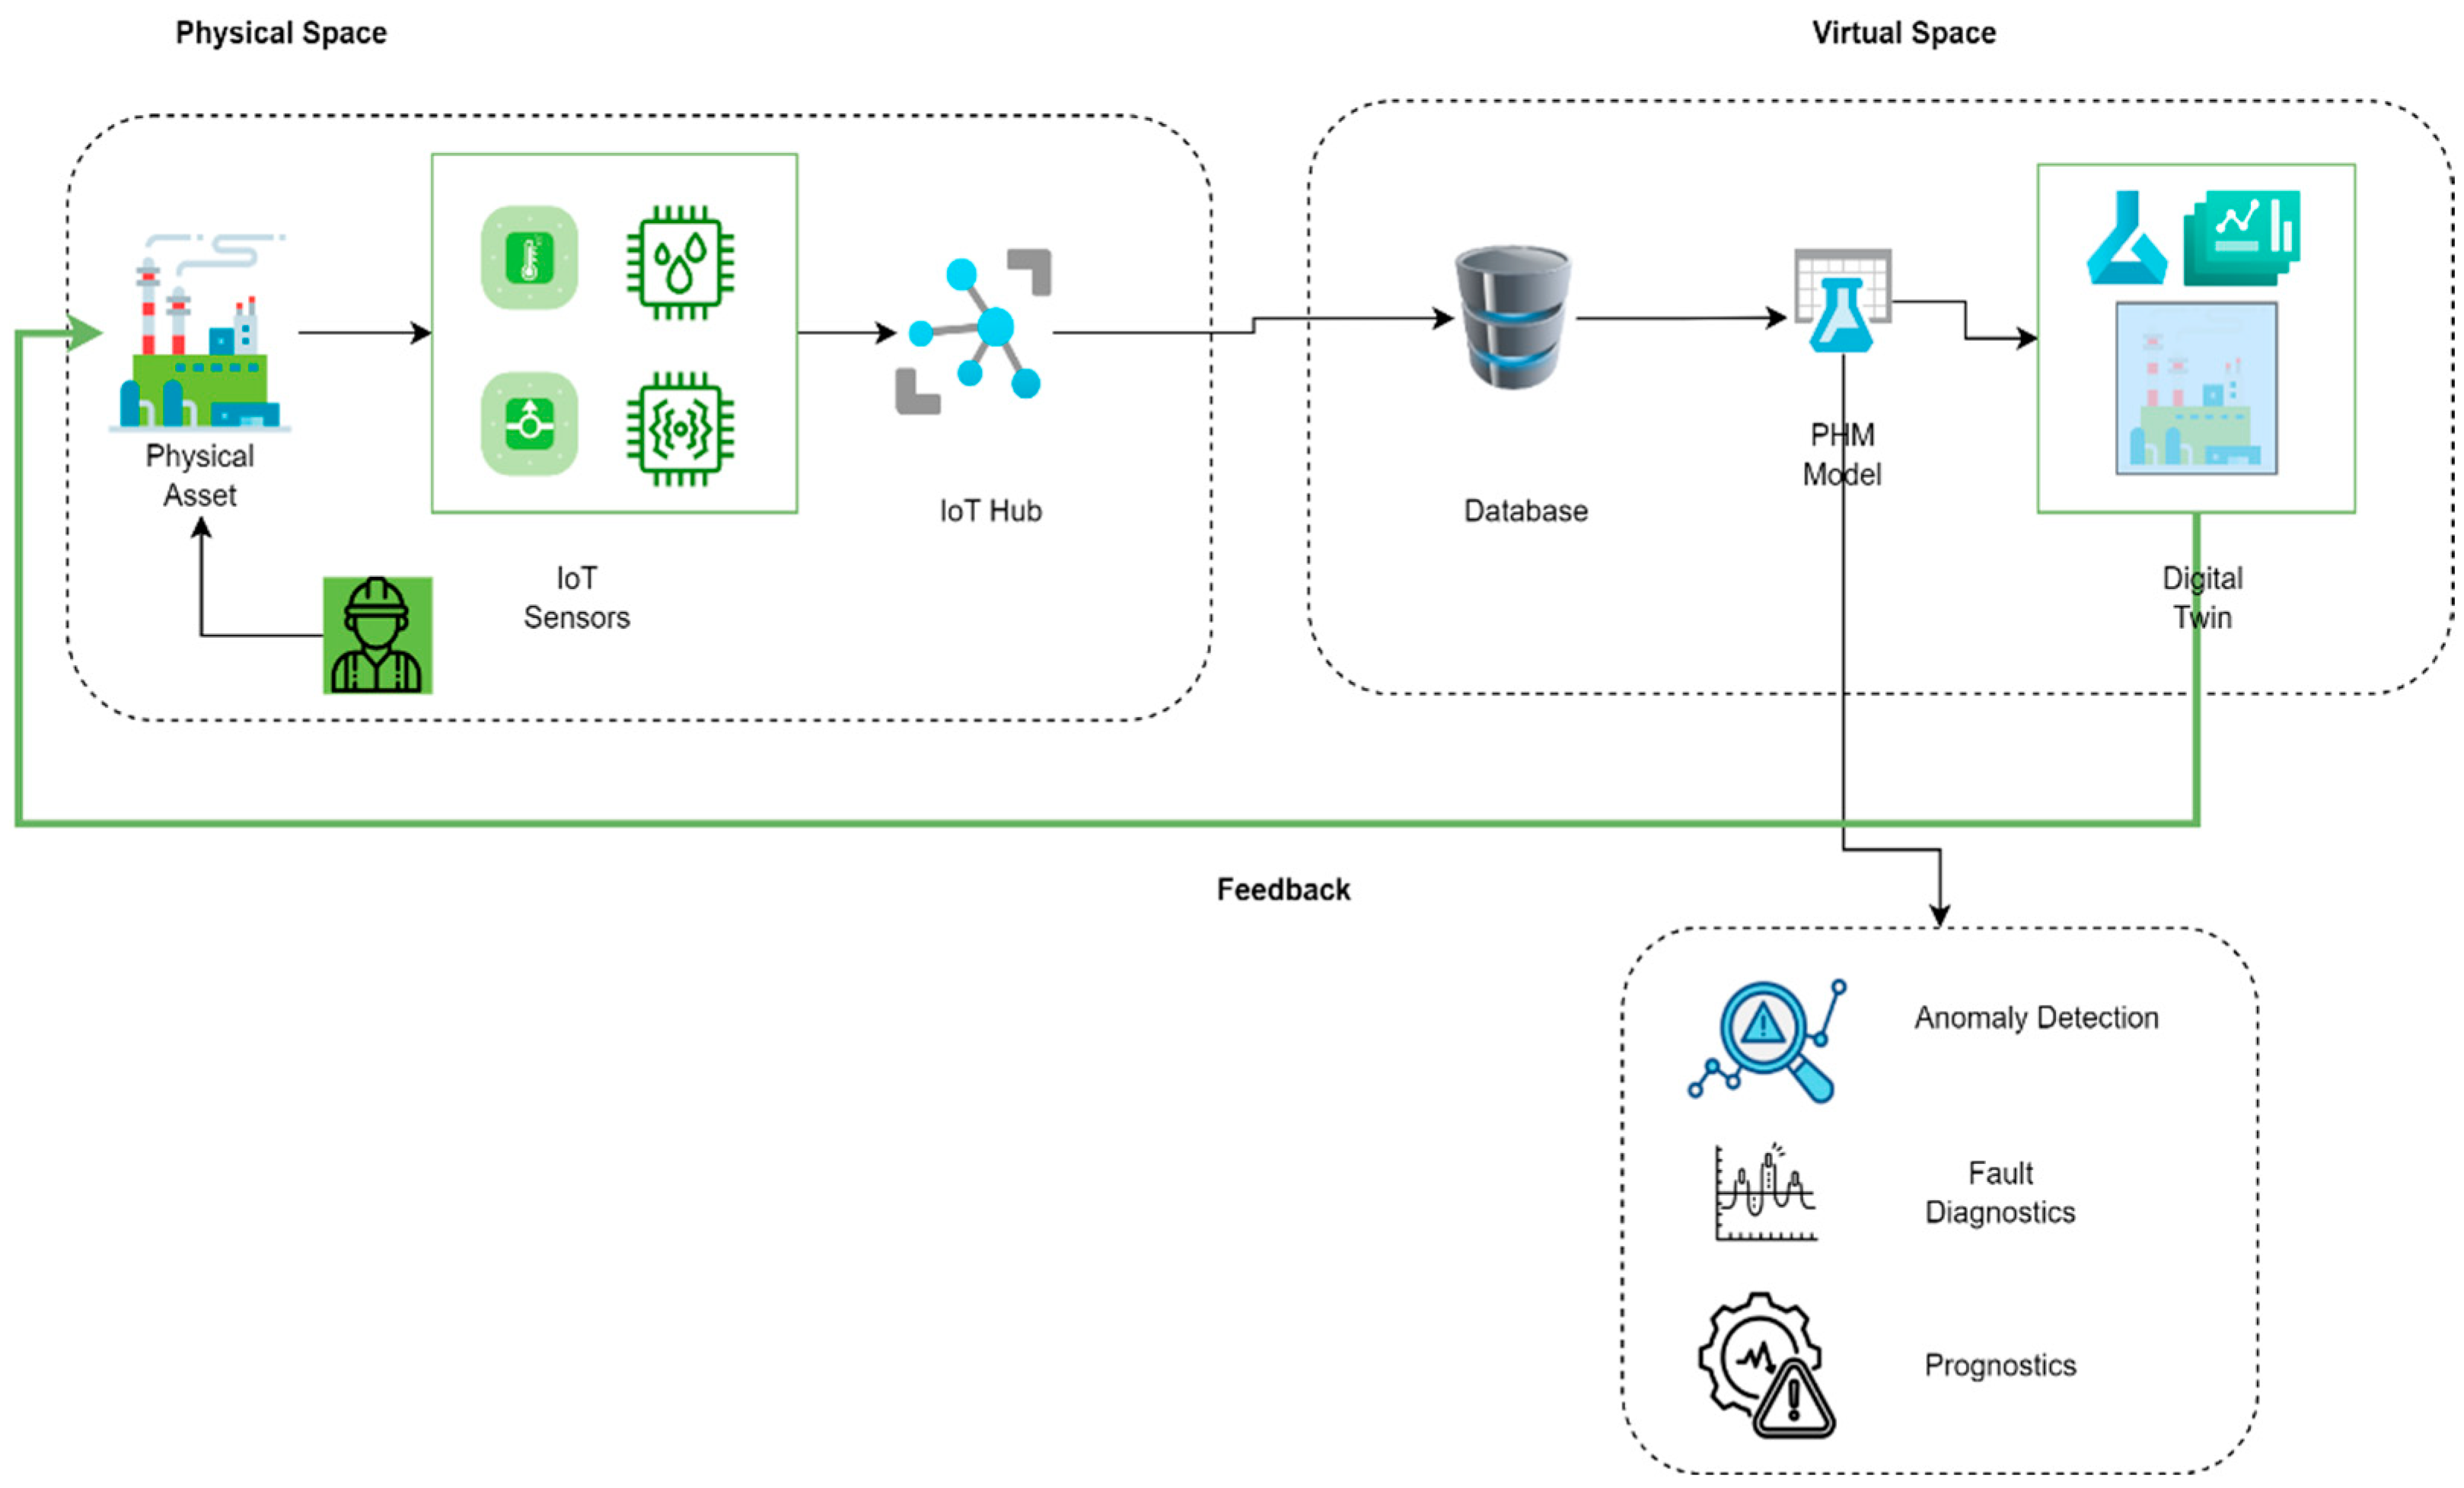
Figure 1). However, building DT models requires different components to enable data integration and deploy sophisticated algorithms. Bhatti et al. [
3] and Lo et al. [
4] show the conceptual overview and components of enabling digital twins for industrial applications. For complex systems with a lot of sub-systems with different operating conditions, obtaining asset degradation data can be expensive, time-consuming, and often requires specialized equipment, sensors, or monitoring systems for developing DT intelligence models to drive PHM applications [
5].
Physics-Informed Neural Networks (PINNs) within DT frameworks provide an approach for tackling the challenge of limited training data in complex systems [
5]. PINNs can generalize well with limited data [
6] and have applications in various fields [
7], making them valuable for tackling complex, multi-physics problems [
8] by reducing computational costs and providing insights [
9]. Physics-Informed Neural Networks (PINNs) in characterizing complex systems for predictive purposes integrate the physics of an asset into their training process, enforcing physical constraints alongside data-driven learning. Complex systems such as hydraulic systems, essential in various industrial processes [
10] ranging from manufacturing to aerospace, are prone to wear and degradation due to their operational demands. The complexity of these systems, coupled with the high costs associated with unplanned downtime, necessitates the development of advanced predictive maintenance strategies. DT-enabled PHM systems address these challenges by integrating real-time sensor data, predictive analytics, and physical models to detect anomalies, predict failures, and recommend optimal maintenance actions.
Despite the promise of DTs in PHM, achieving scalability and adaptability in intelligence models remains a critical challenge. Scalability is particularly vital for transferring models trained on smaller, isolated systems to larger, more complex ones. Furthermore, the limited availability of high-quality degradation data exacerbates the challenge of scaling DT models to other complex systems, making it difficult to train models that can generalize across diverse operational scenarios [
5]. This paper therefore investigates scalable data transformation models that facilitate PINN-enabled DT analytics to generalize MCD patterns across hydraulic systems. The proposed approach employs a commercial off-the-shelf (COTS) platform, PTC ThingWorx™ 9.2.1, to accommodate DTs for components in three hydraulic systems. The platform facilitates real-time data integration and visualization, while containerized PINN models deployed on a Kubernetes cluster ensure flexible resource management and efficient scaling. A ThingWorx™ API is developed to enable seamless communication between the DT platform and the containerized models, supporting a microservices-based DevOps lifecycle for robust testing and deployment.
The remainder of this paper is structured as follows:
Section 2 reviews the scalability of DT models and identifies gaps in the current methodologies.
Section 3 details the proposed deployment methodology, including the microservices approach, scalable data models, and DT intelligence models.
Section 4 presents a case study transitioning from asset-level to fleet-level management. Finally,
Section 5 discusses the findings and their implications, concluding with directions for future research.
2. Scalability of DT Models—Review and Gaps
2.1. Introduction
Digital twin (DT) technology has transformed asset management across industries by enabling real-time monitoring, predictive analytics, and decision support. However, as the complexity of systems grows, ensuring scalability in DT models becomes a pressing challenge for deploying DT models at scale. Scalable DT models are essential for transferring solutions from single assets to fleet-wide applications, allowing for the seamless integration of diverse operational scenarios. Addressing scalability requires not only robust data transformation models but also the incorporation of physics-informed methods and uncertainty quantification to enhance generalizability and reliability.
2.2. Digital Twin Applications
A digital twin is a virtual replica of a physical asset, system, or process that continuously updates and mirrors its real-world counterpart using real-time data [
11]. This technology integrates several advanced fields, including the Internet of Things (IoT), Artificial Intelligence (AI), and cloud computing, to create a dynamic, data-driven model capable of accurately predicting future states and potential failures of physical systems [
3,
12,
13].
Figure 2 shows the connection between a physical asset and its virtual representation and the corresponding high-level processes. Components enabling digital twins are primarily a physical reality, a virtual representation, and interconnections that exchange information between the physical reality and virtual representation [
14]. Digital twin modeling for a physical asset requires technologies in aspects of construction, assembly, fusion, verification, correction, and management [
15]. The components and aspects of a digital twin are its core characteristics, as several definitions of digital twins often lead to misconceptions of it as a digital model as it is a nascent field [
16].
Fuller et al. [
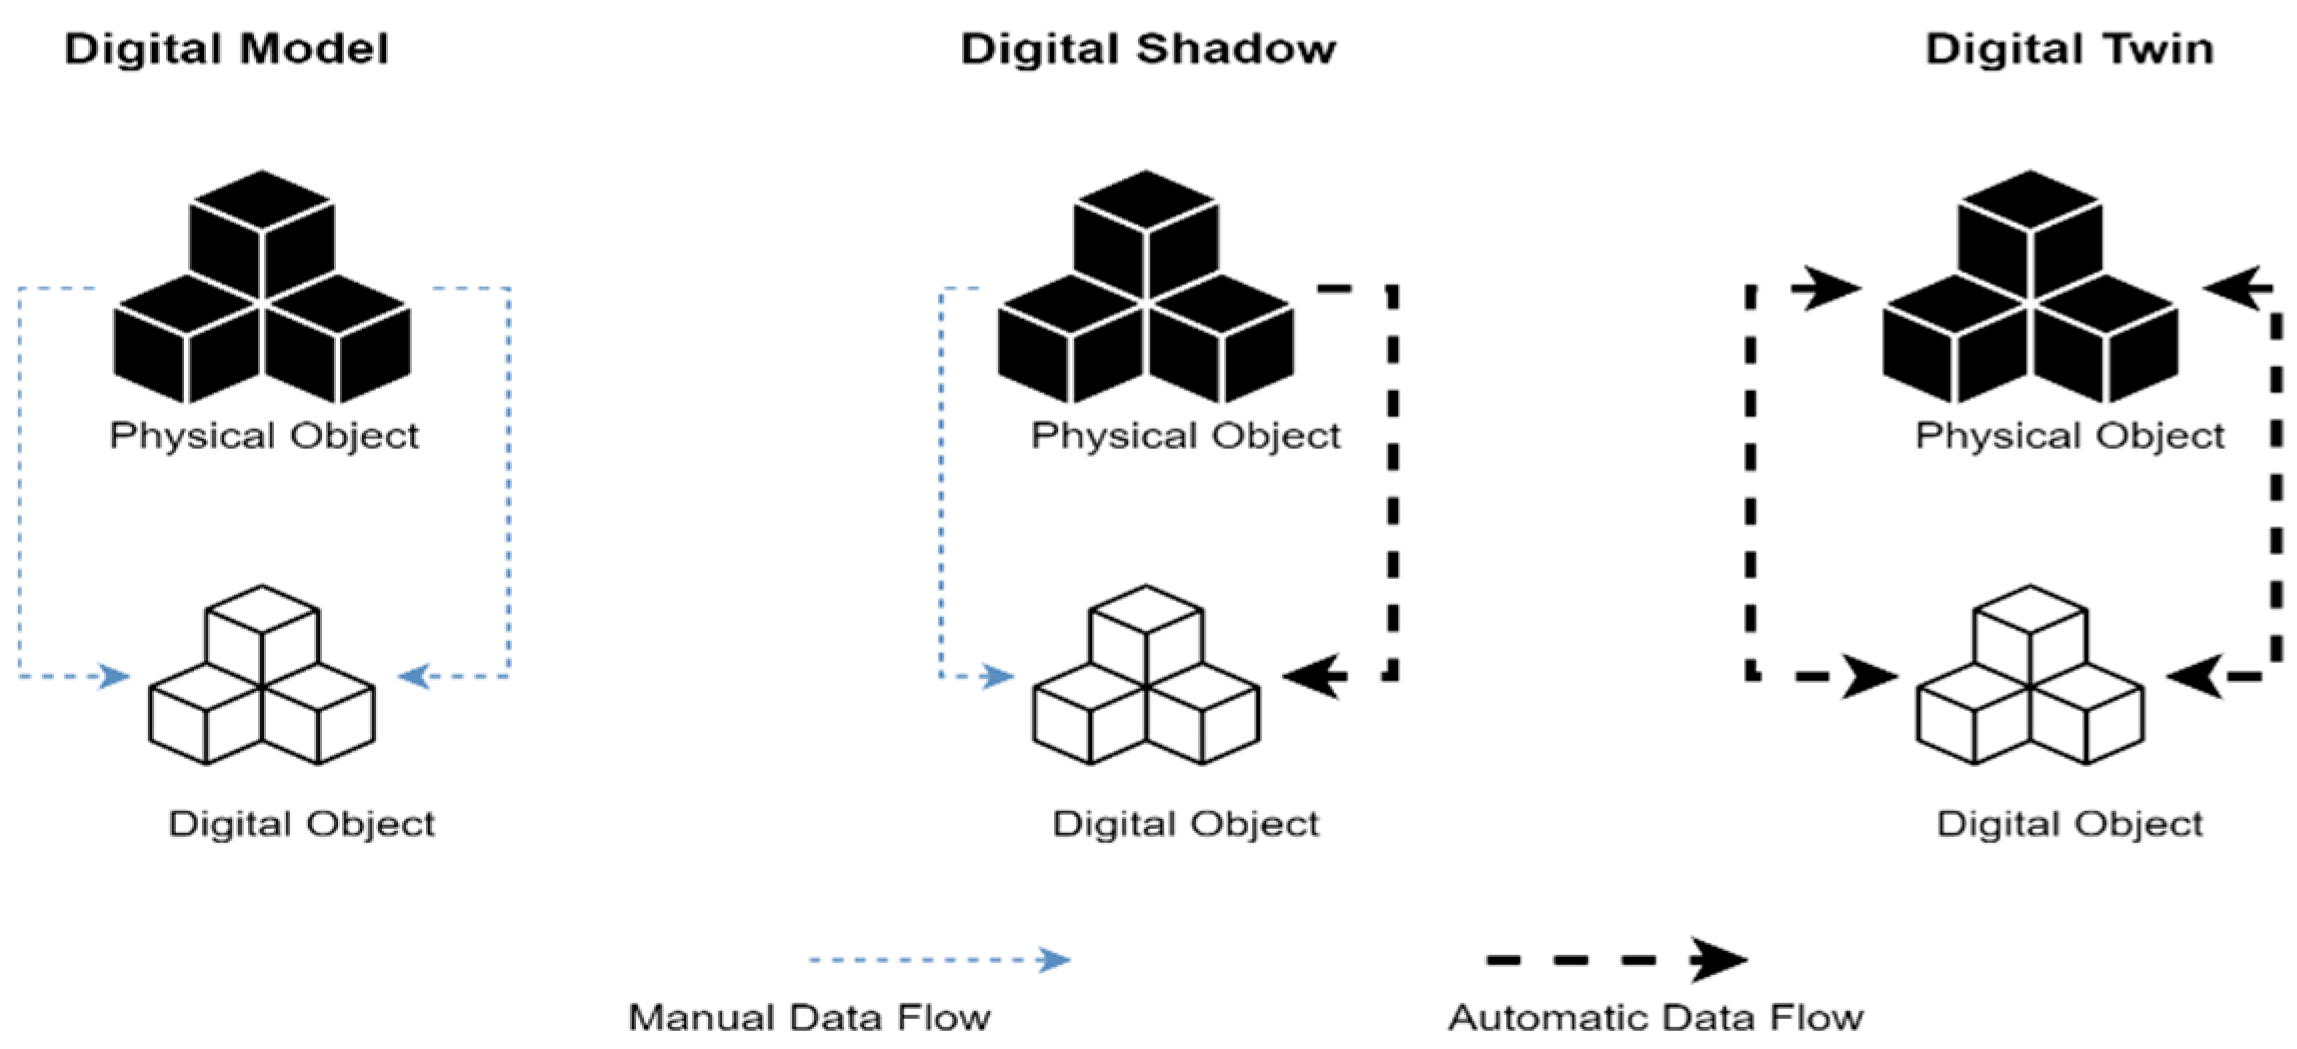
17] described the differences between a digital twin, a digital shadow, and a digital model. A digital model is a virtual representation of a physical object; there is no automatic data exchange between the physical model or object and the virtual representation or digital model. Digital model examples include computer-aided design (CAD) models used for buildings and product development. Changes to digital models do not affect the physical reality and vice versa. Digital shadows build on digital models and incorporate one-directional information flow.
Figure 3 shows the difference in connections between digital models and digital shadows. A change in the state of the physical reality or object leads to a change in the digital object; however, a change in the digital object does not affect the physical reality [
16]. A digital twin fully integrates information exchange between physical reality and virtual representations. A change in either causes a change in the other [
14].
Digital twin technology within the context of prognostics and health management (PHM) is emerging as a transformative force in modern industrial practices; in particular, PHM focuses on predicting the future health of components, machines, or systems by analyzing real-time and historical data [
17]. This approach has traditionally relied on a range of methodologies, including data-driven analytics, statistical methods, and physics-based modeling, to assess the current and future condition of an asset, estimate its remaining useful life (RUL), and identify impending faults [
18]. Digital twins incorporating PHM represent a significant advancement, enabling real-time monitoring and predictive maintenance and providing unprecedented insights into system health and performance [
10]. In PHM applications, digital twins offer several unique advantages. They enable enhanced fault detection and isolation (FDI) by providing a comprehensive virtual representation that allows for the continuous analysis of real-time data against established operational benchmarks [
18,
19]. This capability facilitates the early detection of anomalies and the identification of potential faults before they escalate into critical failures. Moreover, digital twins support condition-based maintenance strategies, moving beyond traditional time-based or usage-based approaches. By leveraging real-time data streams from connected sensors and devices, digital twins can predict equipment failures more accurately and optimize maintenance schedules, thereby minimizing downtime and reducing maintenance costs [
20,
21].
Additionally, digital twins integrate seamlessly with cloud computing platforms to enhance scalability, flexibility, and accessibility. This integration allows for the deployment of digital twin applications as cloud-based services, enabling remote monitoring and diagnostics, which is particularly valuable in industries where assets are geographically dispersed or operate in harsh environments [
22,
23]. Such a model, often referred to as Digital Twin as a Service (DTaaS), leverages cloud-native data analytics and supports decision-making processes by providing a platform for running advanced algorithms and machine learning models [
24]. The convergence of digital twin technology with PHM is also driving new research directions and industrial applications. For instance, leveraging data-driven analytics and predictive models allows for more accurate forecasting of equipment health and operational efficiency. As digital twins continue to evolve, their application in PHM will likely expand, incorporating more sophisticated models and analytical techniques to further enhance their predictive capabilities and operational benefits [
25,
26].
2.3. Scalability of Digital Twin Models for Complex Systems
Scalability is a key requirement for the widespread adoption of any technology, and DTs are no exception, particularly in industries managing complex systems. A scalable DT model must accommodate varying system sizes, from individual assets to entire fleets, without compromising performance or accuracy [
15]. Achieving this requires modular and flexible architectures, such as microservices-based designs, allowing seamless integration and deployment across diverse environments [
15]. For example, containerized DT applications deployed on Kubernetes clusters enable dynamic resource allocation, ensuring the efficient handling of computational workloads for large-scale systems [
27]. Moreover, data transformation models play a critical role in scaling DTs by standardizing inputs from heterogeneous sources and enabling models to generalize across different system configurations. Physics-Informed Neural Networks (PINNs) further enhance scalability by embedding physical constraints into data-driven models, improving their robustness under limited data conditions [
6,
28].
2.4. Uncertainty Quantification
Uncertainty quantification (UQ) is vital for ensuring the reliability and robustness of DT models, particularly in critical applications such as healthcare and aerospace. UQ methods assess the confidence in model predictions by quantifying the impact of data quality, model assumptions, and operational variability [
29]. Bayesian approaches are commonly employed to model uncertainty in PHM applications, enabling adaptive decision-making under uncertain conditions [
30]. In DT-enabled PHM, UQ is particularly relevant for MCD scenarios, where complex interactions between components can amplify prediction errors. By incorporating UQ, DT models can provide probabilistic forecasts, offering operators actionable insights with associated confidence levels [
31]. Advanced techniques, such as Monte Carlo simulations and Gaussian processes, further enhance UQ by exploring a wide range of potential outcomes based on system variability and data uncertainty [
32,
33]
2.5. Gaps
While significant progress has been made in DT development, several gaps hinder their scalability and reliability.
Table 1 below provides identified gaps in the literature on DT development.
3. Proposed Digital Twin Deployment Methodology
3.1. Microservices Approach
The container containing the code for the components of the hydraulic testbed is orchestrated with Kubernetes. Kubernetes is a container orchestration tool that allows the scalability of containerized applications. The Kubernetes infrastructure and block diagram are shown in
Figure 4 and
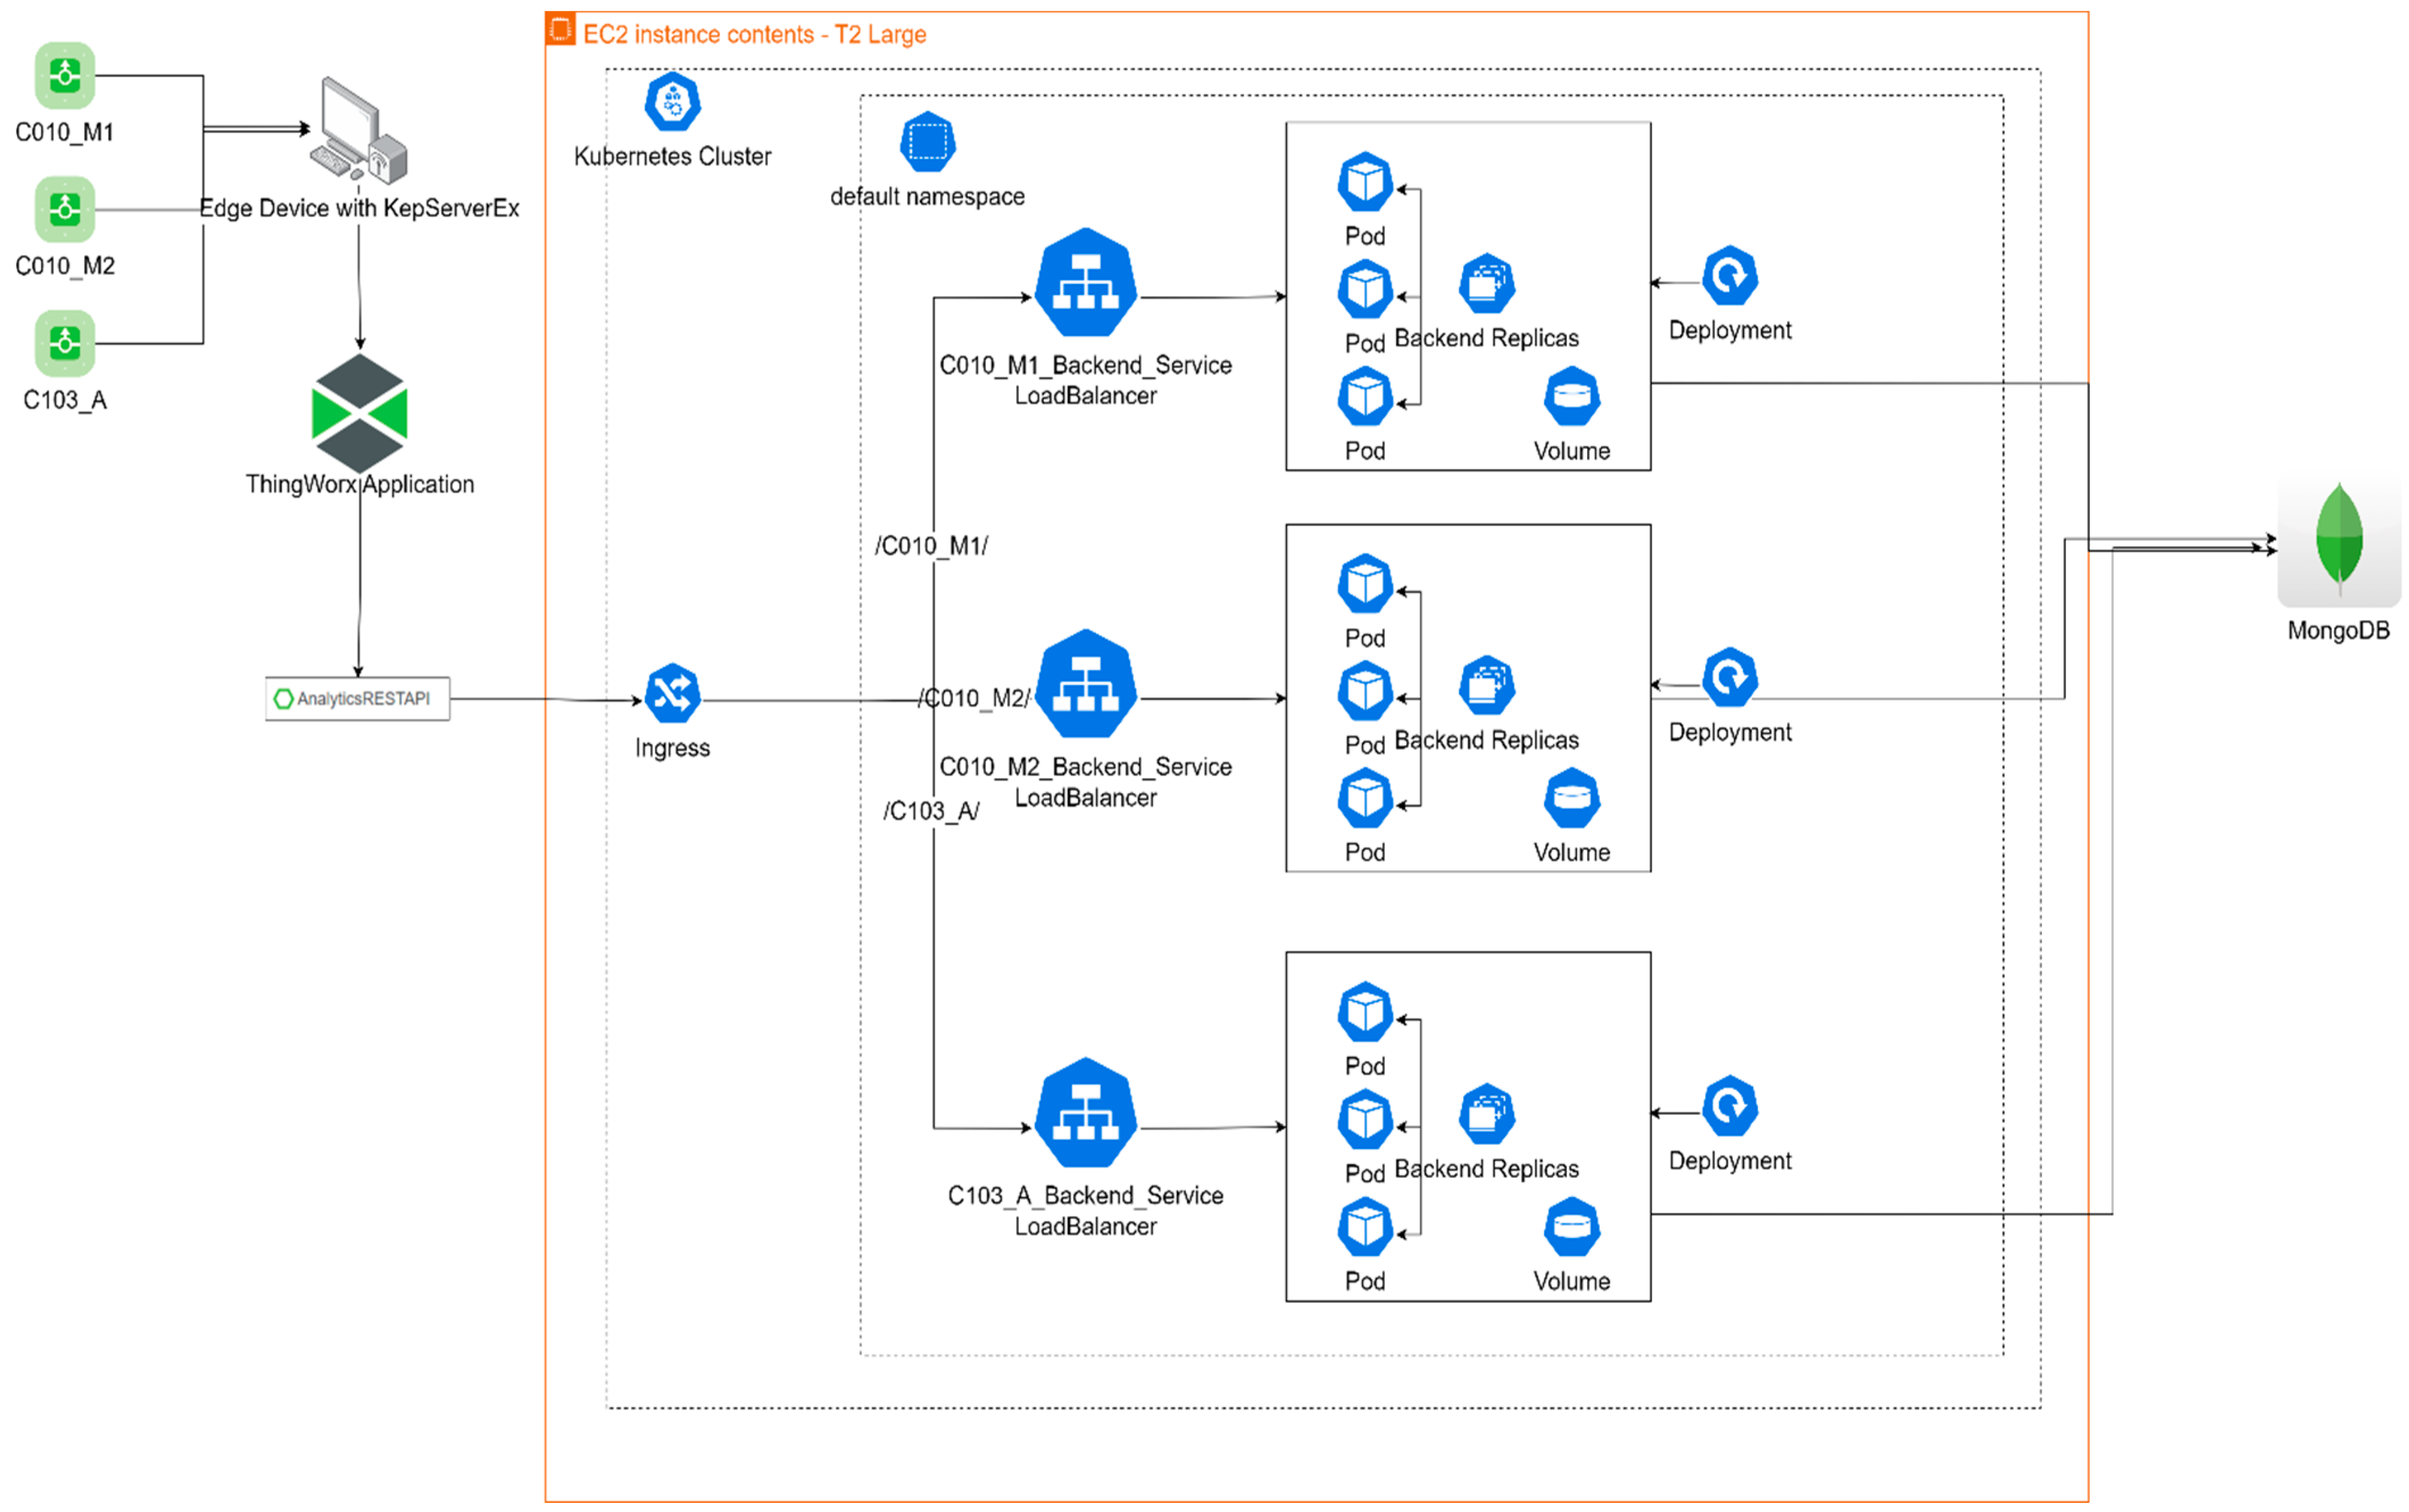
Figure 5. The block diagram of the Kubernetes orchestration architecture depicts incoming requests from the ThingWorx™ 9.2.1 application calling on the Analytics Rest API thing, which connects to the Kubernetes ingress controller that directs and controls the traffic to the containers in the cluster. The ingress component is responsible for managing the external HTTP/HTTPS access to the services within the cluster. It routes the incoming traffic to the appropriate service based on predefined path-based rules. The prognostics model for the different testbeds is deployed as a service for each testbed. Thus, the ingress controller directs the traffic to the specific prognostic model for a hydraulic testbed as shown in
Figure 5. A load balancer manages the traffic between the pods that contain the containerized prognostics models for the hydraulic testbed components. Each Kubernetes pod has five prognostic model containers corresponding to the cumulative unique components within the testbeds—pump, pipe, nozzle, filter, and valve. Kubernetes management of containers in pods allows for the scalability of the analytics service and ensures the resiliency of service within the clusters.
A pod in Kubernetes is the smallest deployable unit, encapsulating one or more containers that share the same network and storage resources. Each pod has five containers: pump, nozzle, valve, pipe, and filter containers. These containers enable a microservice architectural style to the analytics application. The containers are modular components that collectively contribute to the overall functionality of the system. Each container handles a distinct task in predicting the health status of each component within a hydraulic testbed. Kubernetes deployments facilitate the replication of pods, enabling horizontal scaling (increased number of pods) to manage increased system load and ensure high availability. Replication ensures redundancy by distributing the workload across multiple pods, thereby mitigating the risk of service disruption due to individual pod failure. The architecture of the Kubernetes environment implements a microservice architecture and combines ingress, services, load balancers, and pods, a highly scalable and fault-tolerant system, capable of managing multiple hydraulic systems dynamically and efficiently. This allows for multi-asset management and the ease of integration of new assets to leverage the prognostic model and predict the degradation and health of components within each hydraulic testbed.
3.2. Scalable Data Model
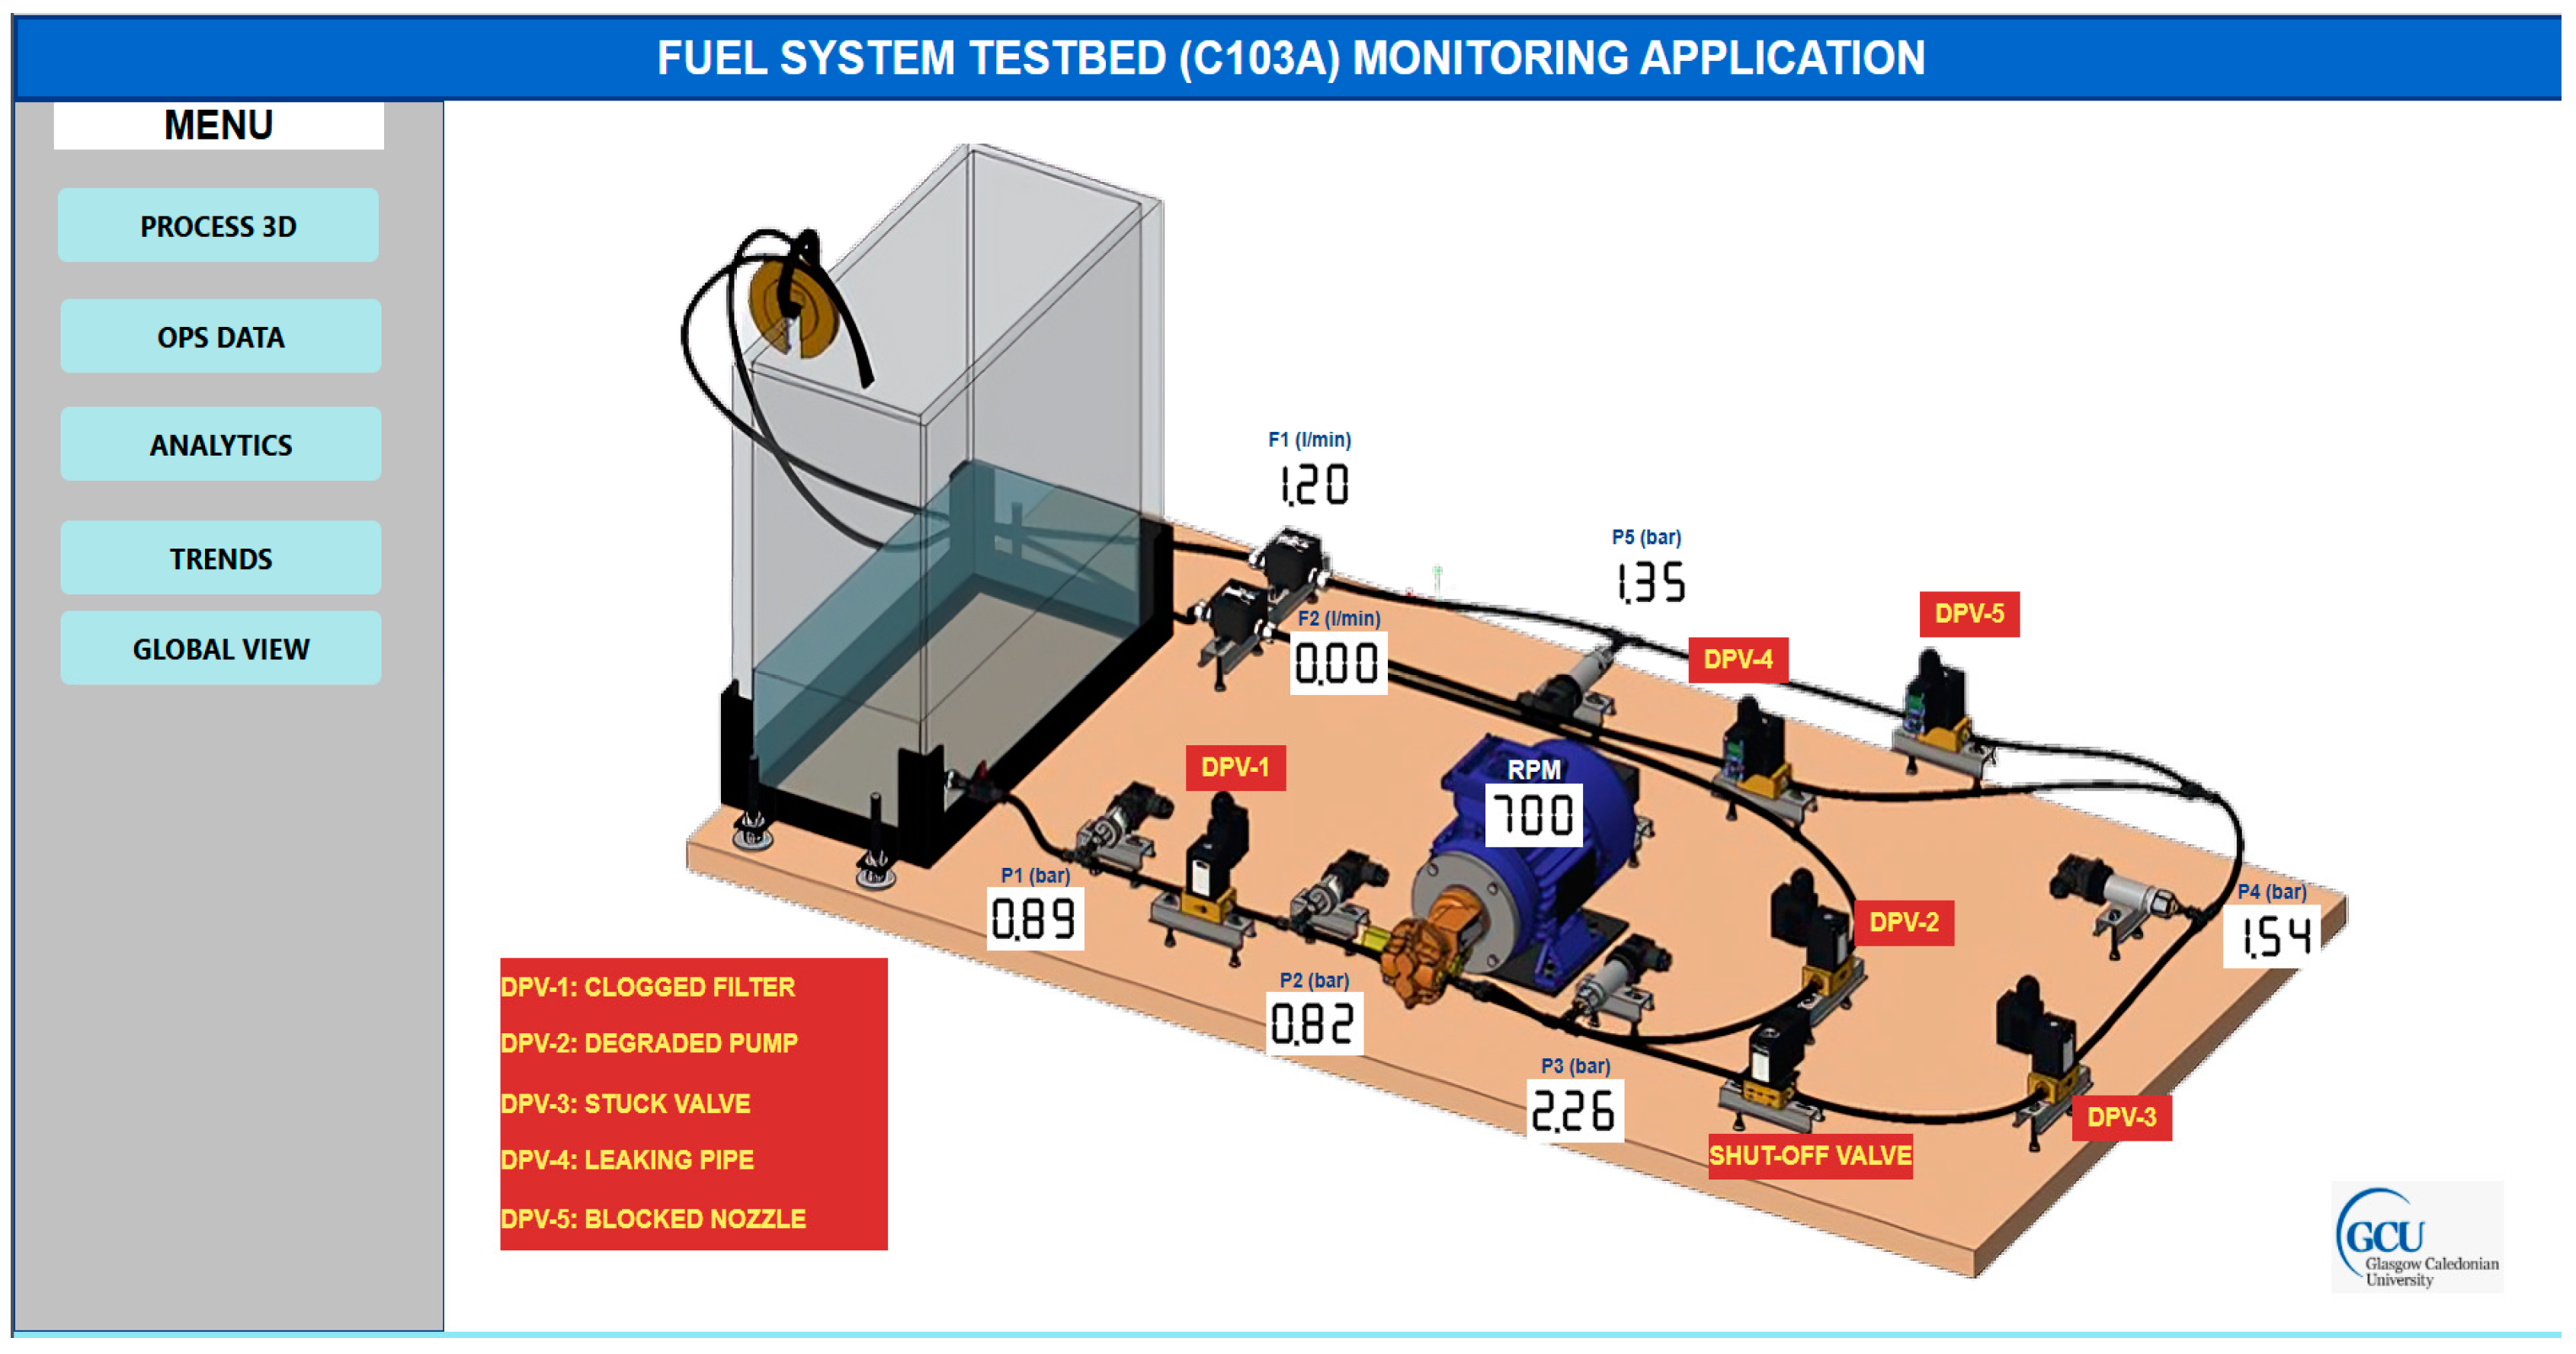
3.2.1. System Description
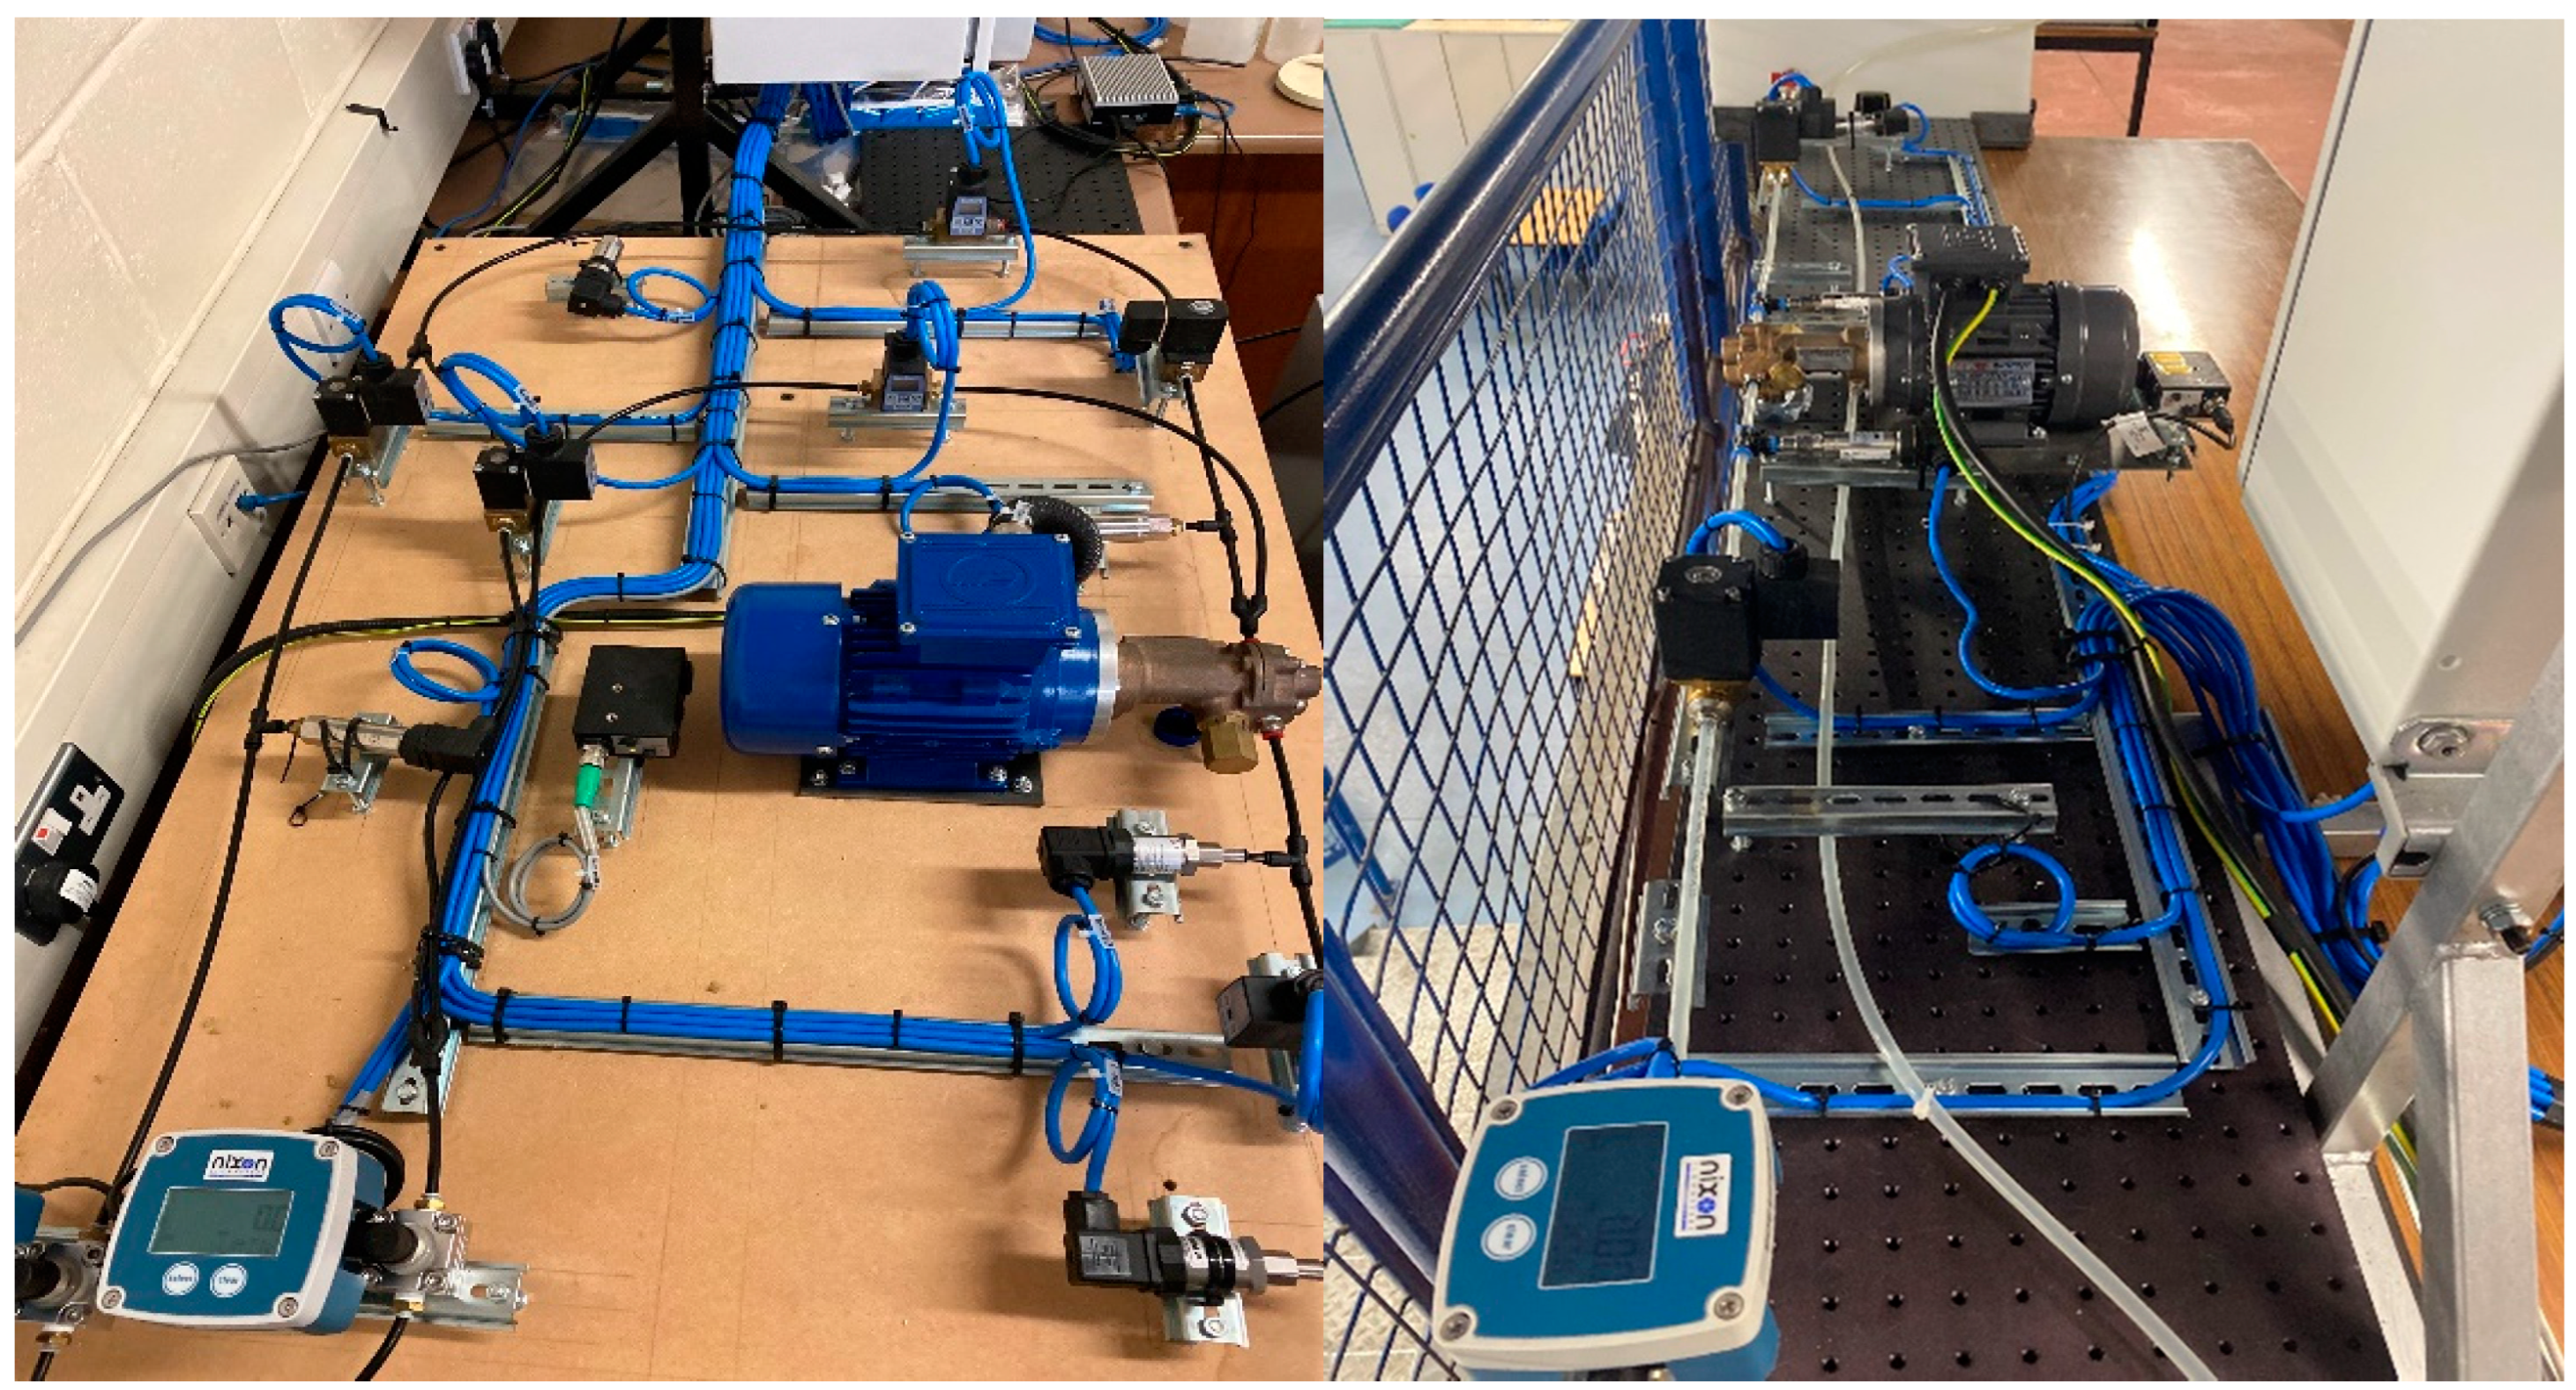
A hydraulic system with a pipe internal diameter (ID) of 4 mm (Testbed-1-C103A) which comprises critical components, including a main supply tank, an external gear pump, and an induction motor responsible for driving the pump, is used as a reference system. The rotational speed of both the motor and the pump is regulated by a Variable Speed Drive (VSD). The system also features a solenoid shut-off valve (SHV) and five direct proportional valves (DPV1 to DPV5) with an orifice diameter of 4 mm for fluid flow control. Data collection is facilitated by pressure transmitters (P1, P2, P3, P4, and P5), turbine flow meters (F1 and F2), and a laser sensor to measure the pump’s speed. System components are connected with PVC tubing, and a finger valve is used for tank isolation when needed. In the context of fault simulation, specific control valves were manipulated to emulate fault conditions. For instance, DPV1 represented a clogged suction filter, fully open at 0% fault severity, while DPV2 simulated pump discharge side leakage and was fully closed at 0% fault severity. The SHV solenoid valve remained open, and DPV3, emulating a blocked or degraded shut-off valve, was fully open at 0% fault severity. DPV4 represented a clogged fuel nozzle, also fully open at 0% fault severity, while DPV5, simulating downstream pipe leakage, was fully closed with 0% fault severity (see
Figure 6). For clarity,
Table 2 summarizes the default operational states of the system’s control valves in a healthy condition and provides their corresponding fault codes for Testbed-1-C103A.
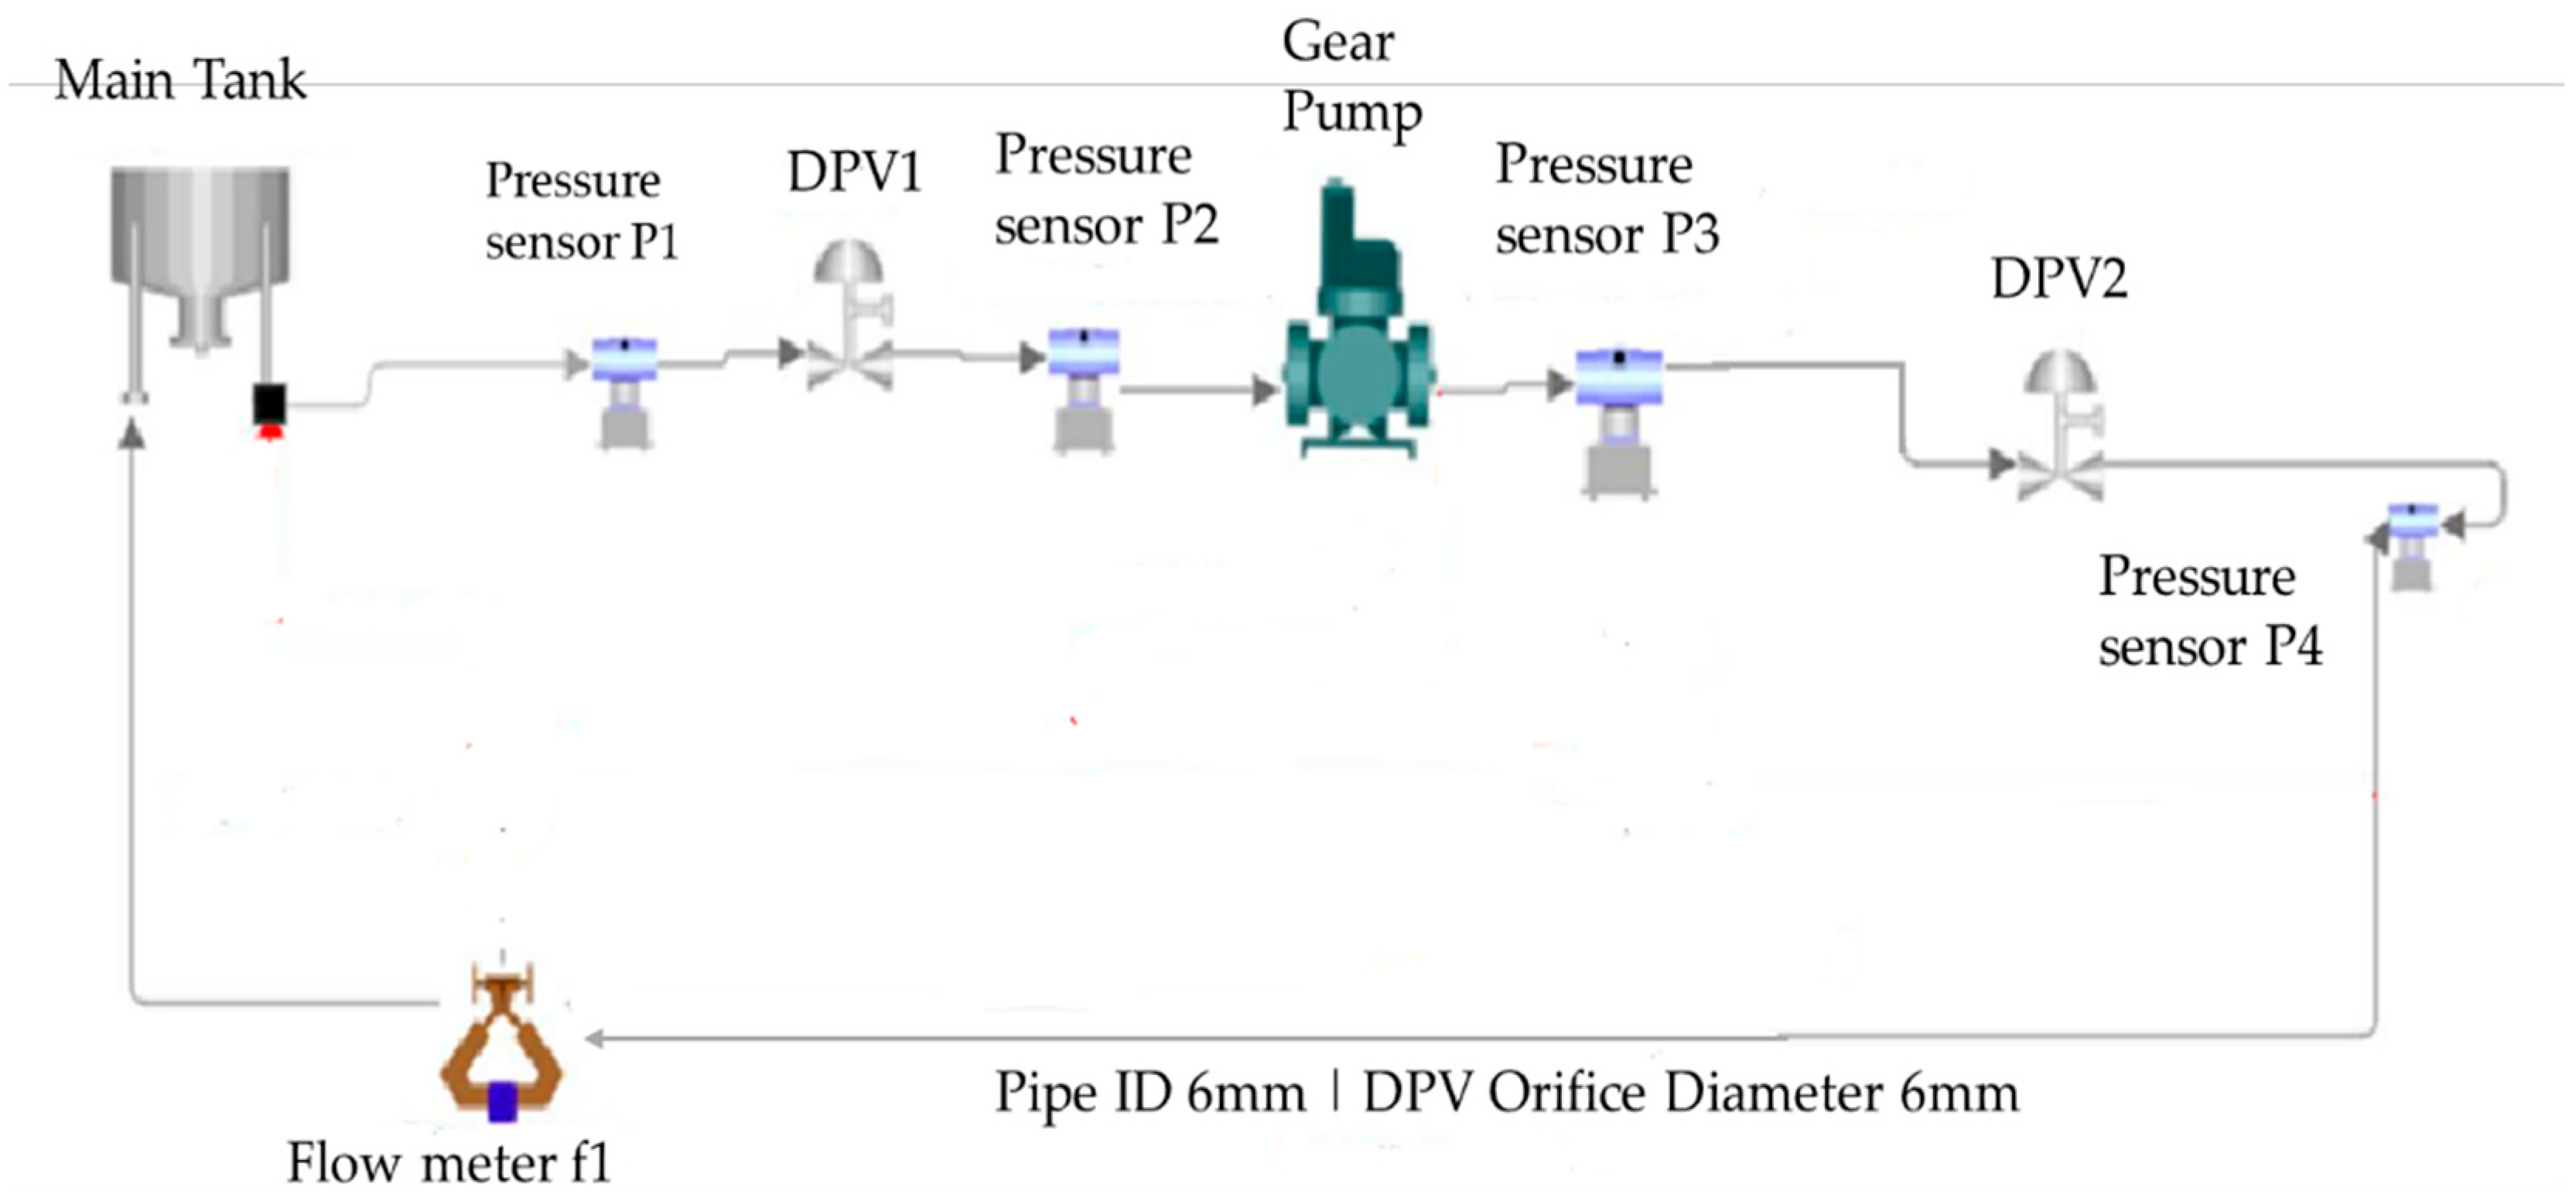
A second testbed (Testbed-2-C010A) with similar degradation characteristics but with a pipe ID of 6 mm is used as a target system. The testbed is used to investigate different combinations of pump and filter degradations and how the DT predictive models developed can identify them. The components on this testbed are larger than that of Testbed-1-C103A. The schematic of the second testbed (Testbed-2-C010A), as shown in
Figure 7, highlights the following components:
Main supply tank;
Sump tank;
External gear pump;
Induction motor (driving gear pump);
Variable Speed Drive (VSD) for controlling the speed of the motor;
Two (2) proportional control valves (PCV01 and PCV02);
Four (4) 2-wire loop-powered gauge pressure transmitters (PT01 to PT04);
A positive displacement flowmeter (FM01) with display;
Laser Tachometer;
Plastic tubing (pipe);
Finger valve (for flow isolation from the main supply tank).
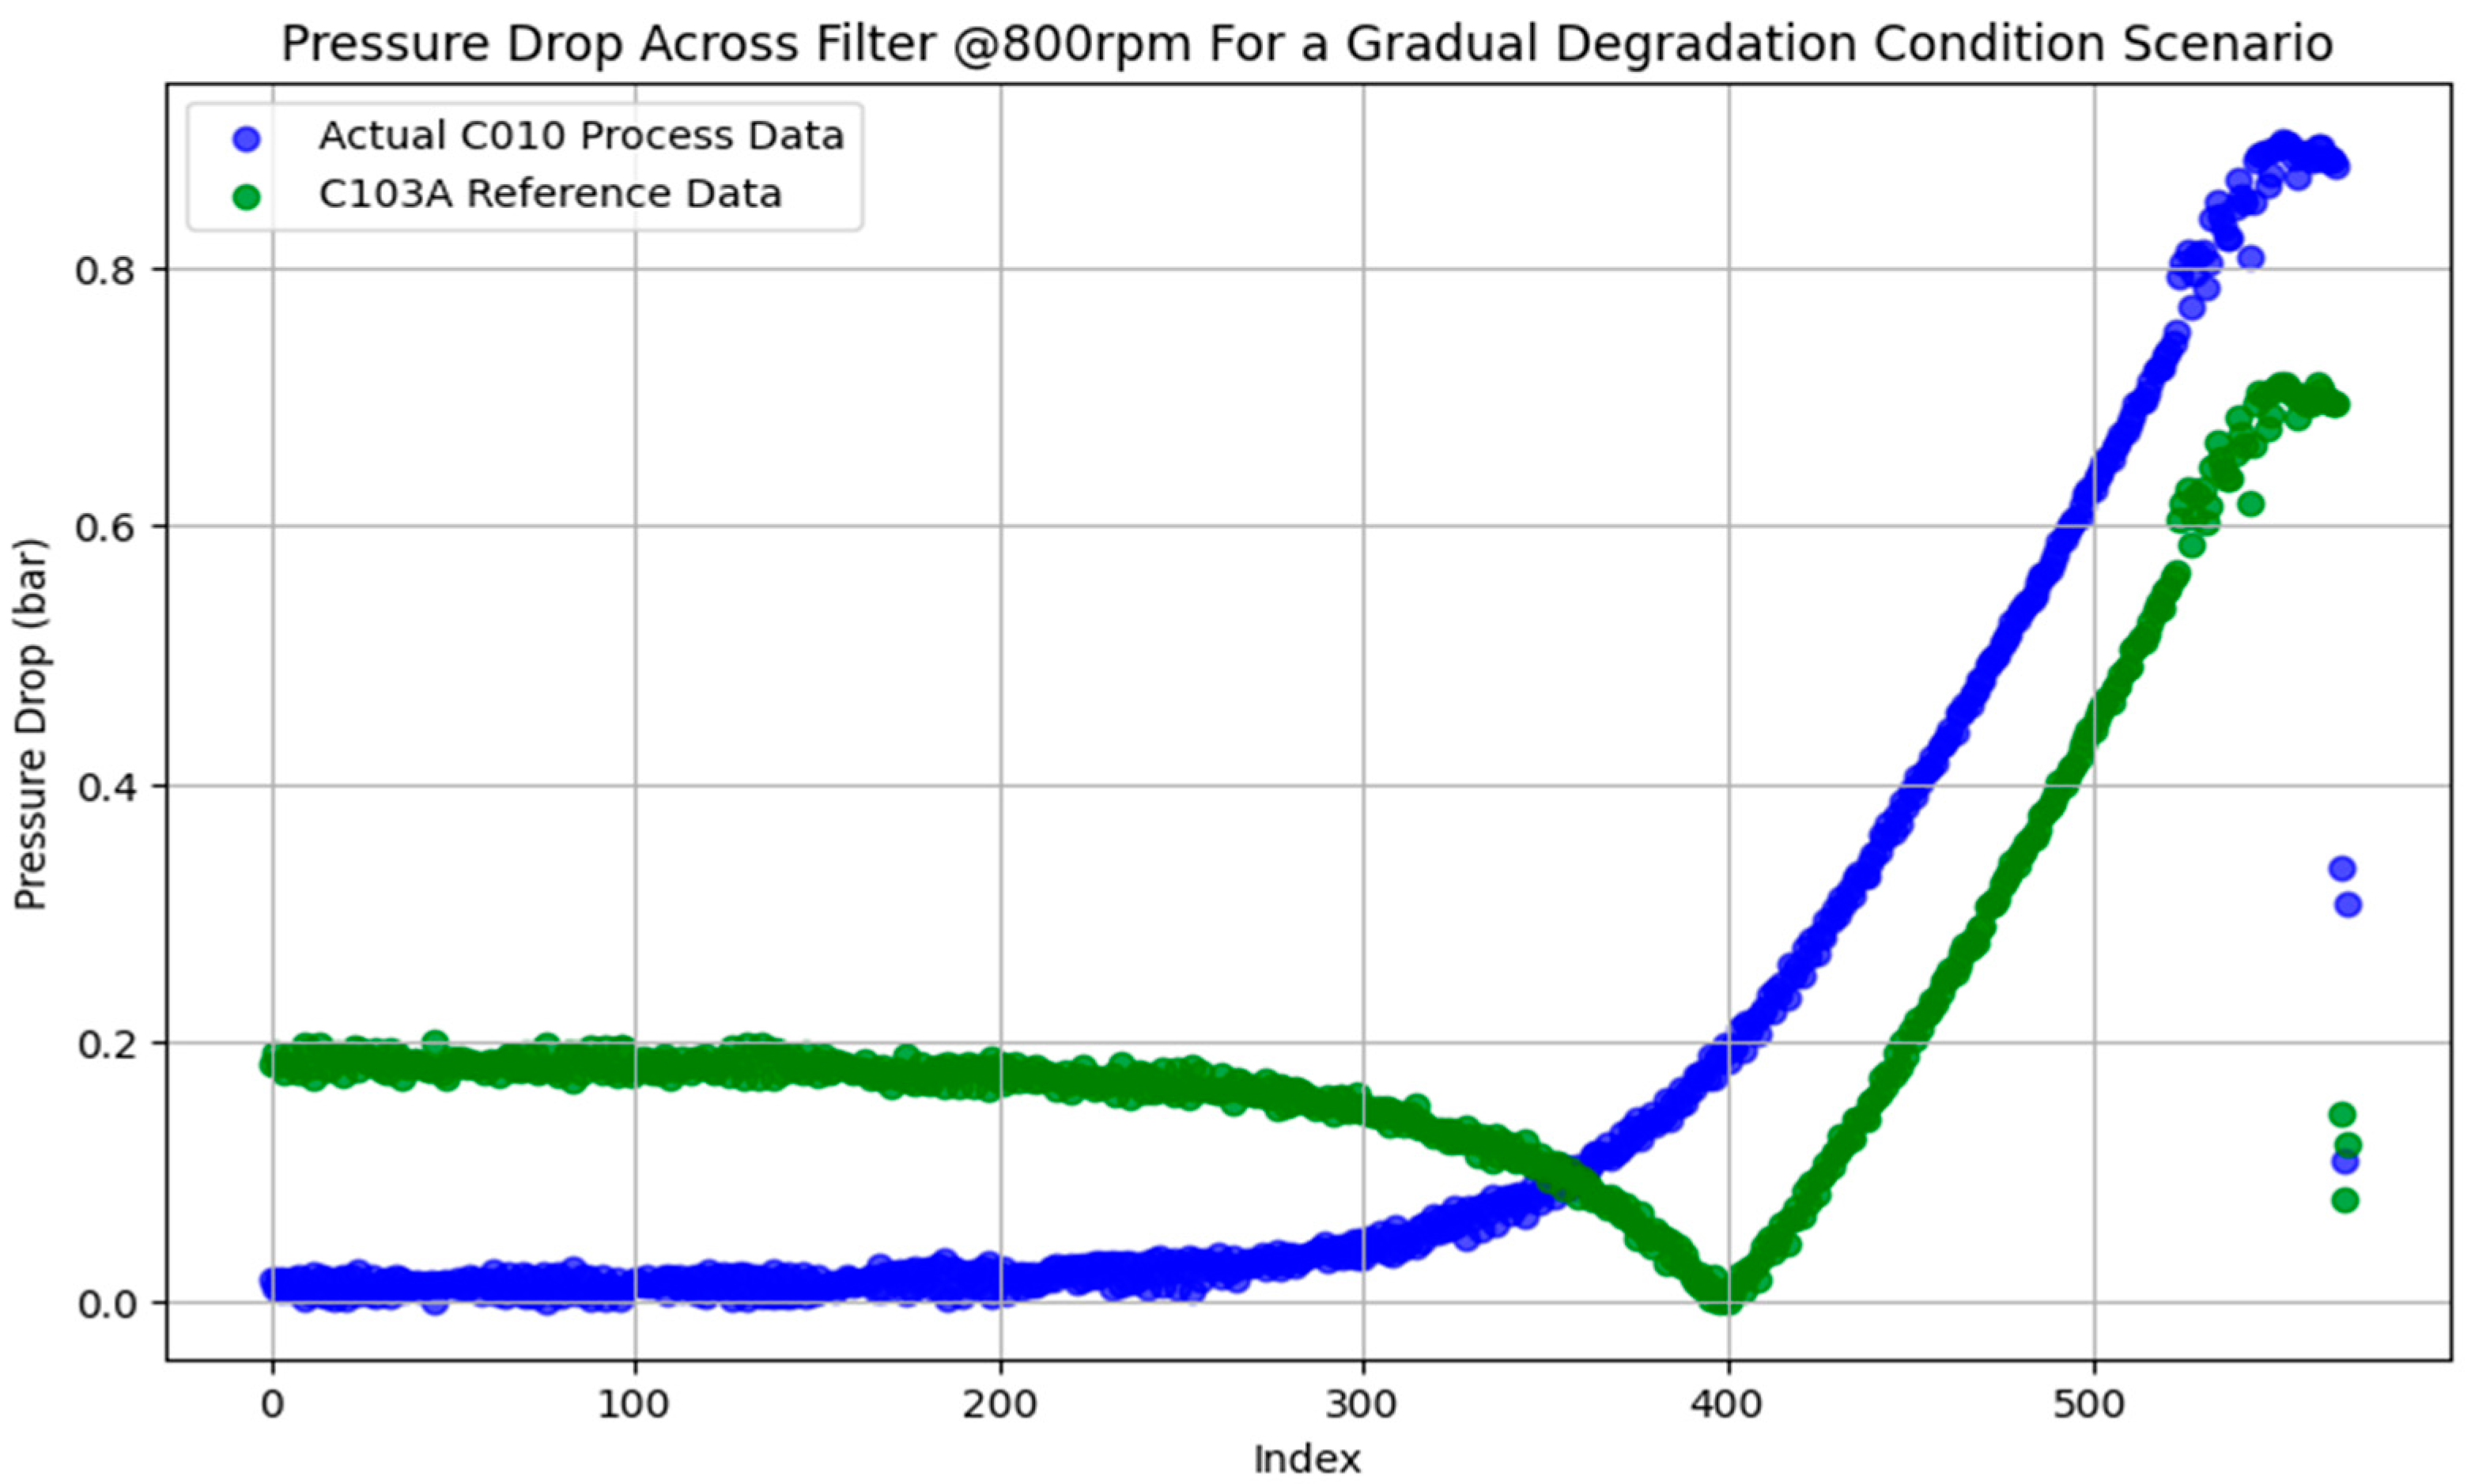
In this paper, the DT intelligence model developed using limited training data from Testbed-1-C103A will be used to predict degradation in the filter on Testbed-2-C010A in a single component degradation scenario. This filter is larger than its counterpart on Testbed-1-C103A and also has different degradation dynamics due to its size.
Figure 8 and
Figure 9 show this difference in dynamics when the pressure drop across the filter on both testbeds is compared.
Figure 10 highlights the differences between the two testbeds which influence the distribution of the sensor measurements from each system.
Table 3 compares operational states of Testbed-2-C010A control valves in a healthy condition as well as their degradation state.
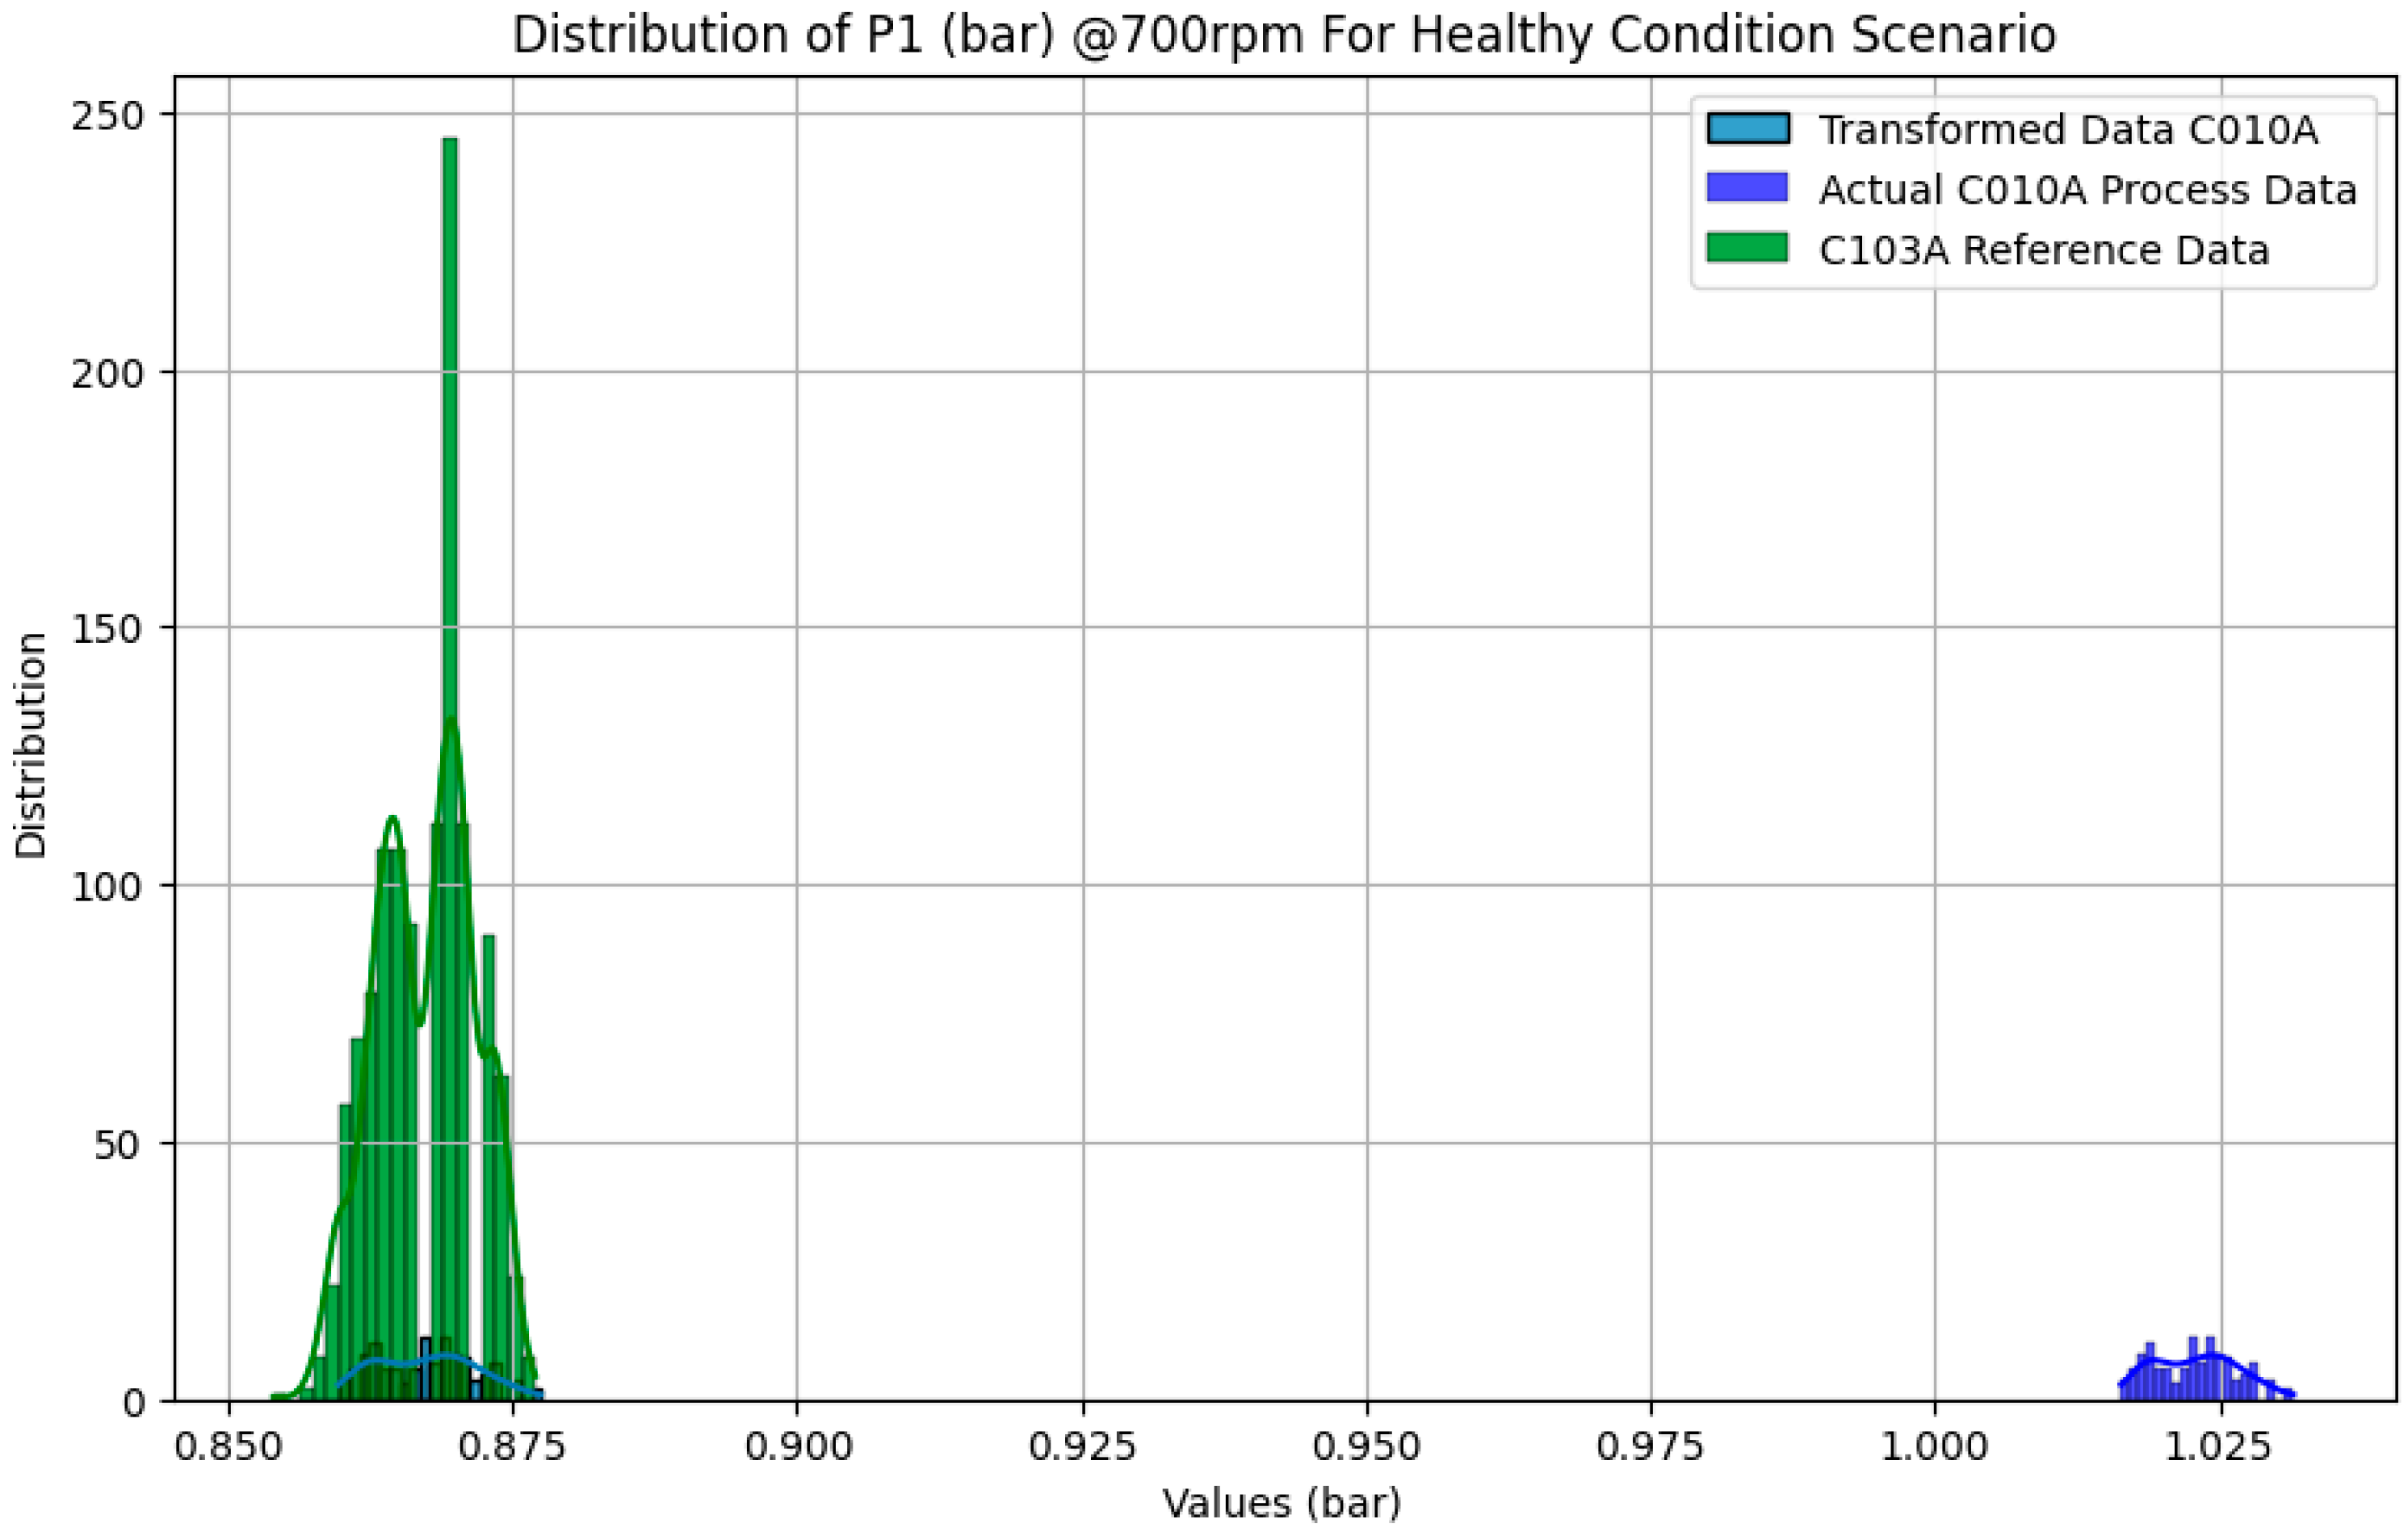
3.2.2. Data Transformation Model
This study employs a standardization and scaling approach to transform the statistical properties of the process data from the system (C010A) to match those of a reference system operating under the same operating conditions at a particular pump speed. This transformation allows for scaling the intelligence DT model developed using data from the reference system (C103A) to predict the degradation in the second, much larger system. The healthy condition data for sensor measurements X from the target system and sensor measurements from the reference system Y at the same operating conditions are used.
Equation (1). Target system data.
Equation (2). Reference system data.
The transformation of process data from C010A into that of C103A is achieved in two steps: standardization and scaling. First, X is standardized by converting it into a z-score representation, ensuring a mean of zero and a standard deviation of one:
where
is the mean of the target distribution X, given by the following:
and
is the standard deviation of X, computed as follows:
This transformation ensures that
has a mean of zero and a standard deviation of one. Now
is rescaled to match the statistical properties of the reference distribution Y:
where
and
are the mean and standard deviation of the reference system data Y, given by the following:
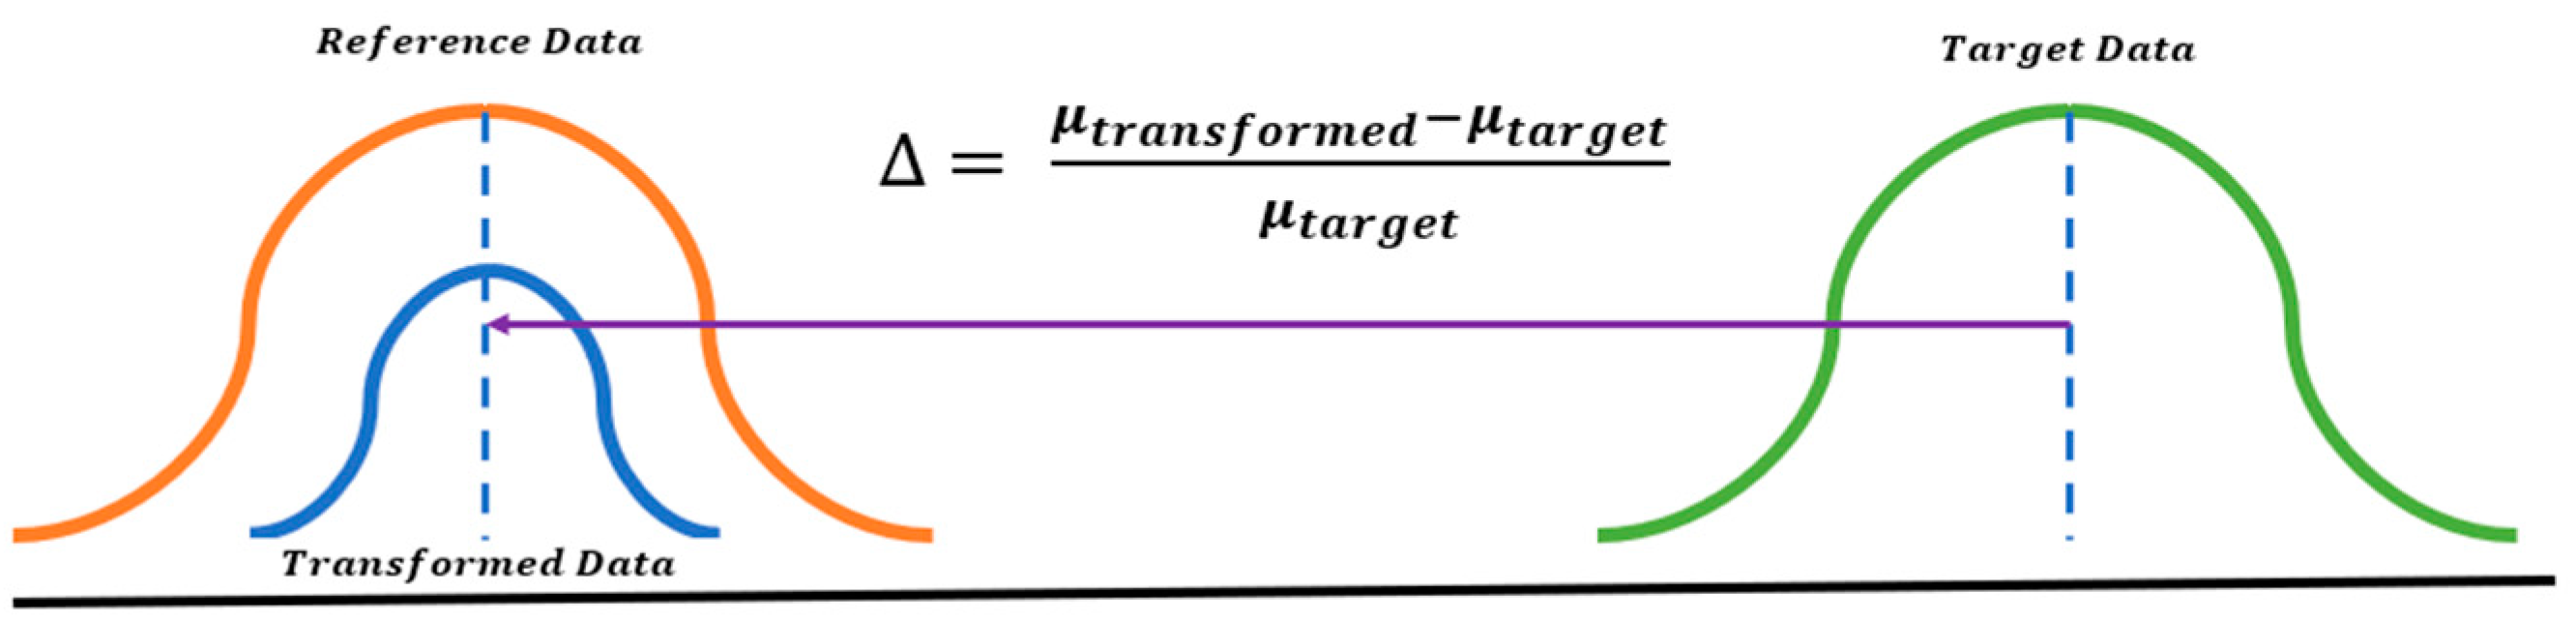
Now, a scaling factor (SF) is determined using the percentage change in the means of the transformed data, and the reference data are calculated (see
Figure 11) below. The SF for each sensor measurement is then multiplied by its respective measurement from the degradation data coming from the larger system (Testbed-2-C010A), resulting in the scaled degradation data (see Equation (10)).
Equation (9). Data scaling factor.
Equation (10). Transformed degradation data.
3.3. PINN-Enabled DT Intelligence Model
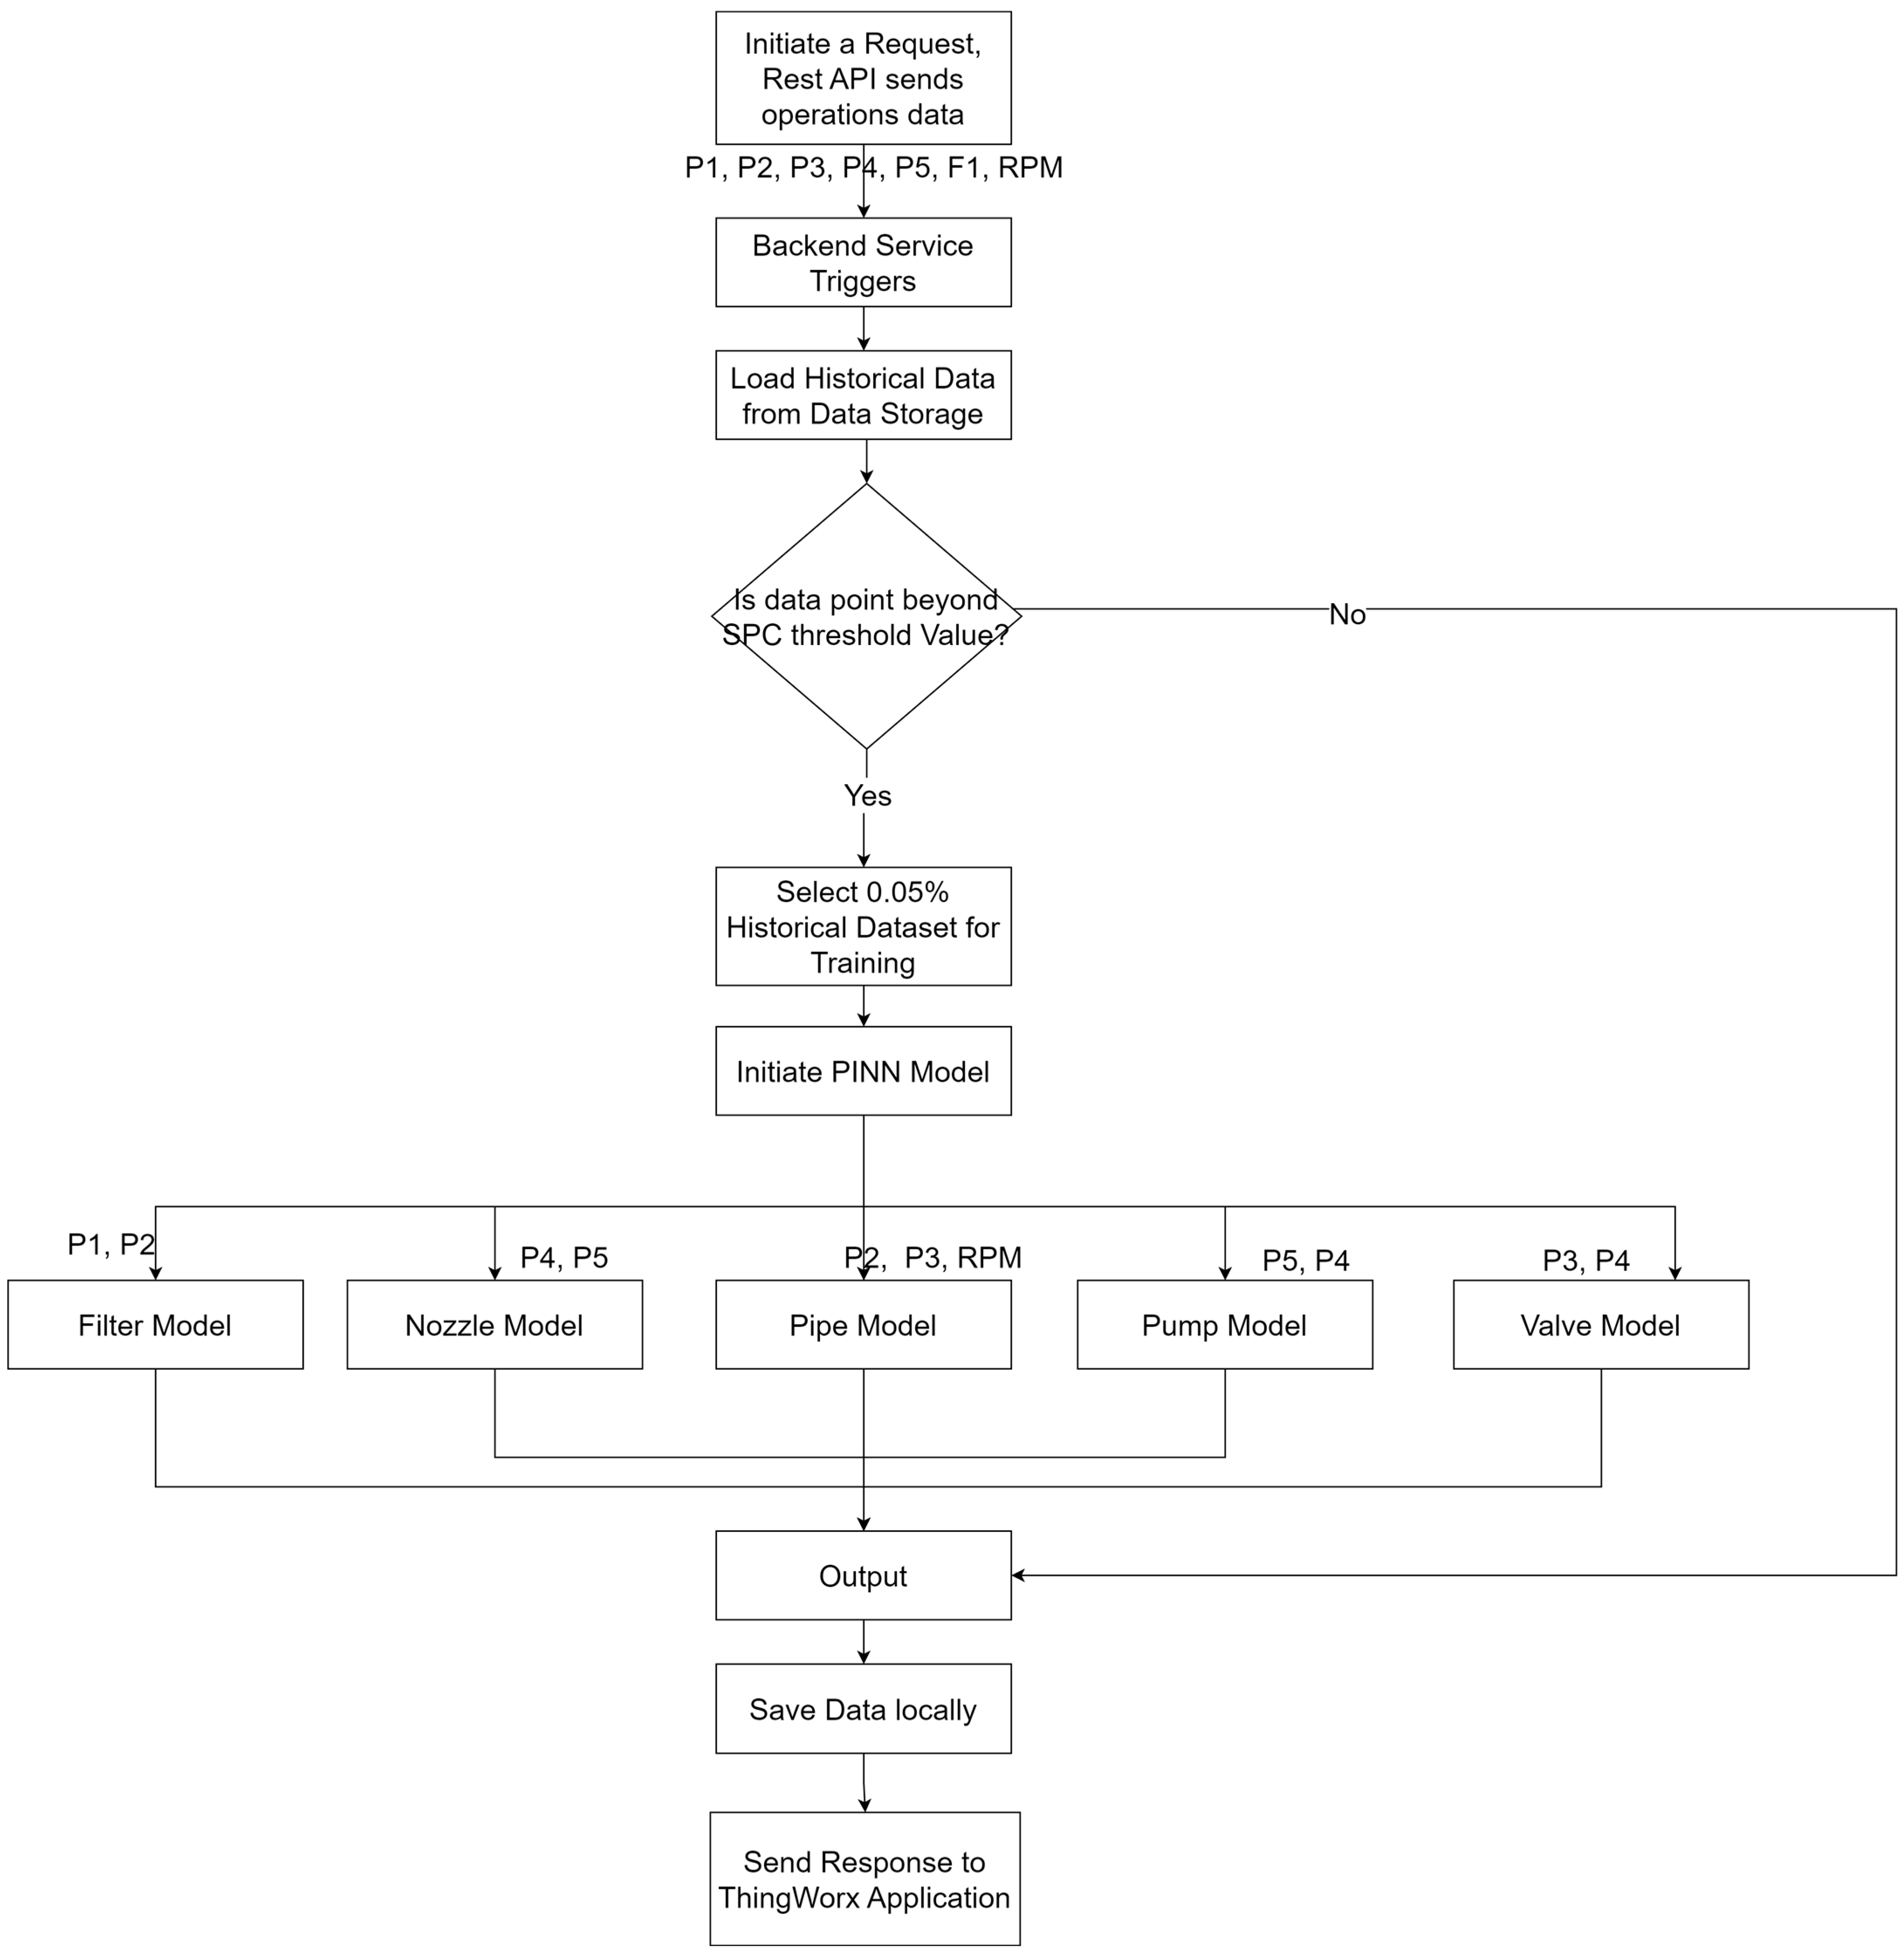
The application logic for the containerized application of the predictive analytics service compares the process values from the hydraulic testbeds to a set of values derived from healthy operational conditions. The process values are compared with a statistical process control (SPC) algorithm that checks if the process values are within bounds or out of bounds of normal operating conditions. A decision is made: if the process values are beyond the threshold of the SPC algorithm, this indicates the system is faulty and triggers the PINN-Enabled DT intelligence model of the analytics service. The result of the output is saved and returned to the ThingWorx™ 9.2.1 platform. The flow chart representing the application logic is shown in
Figure 12 and
Figure 13.
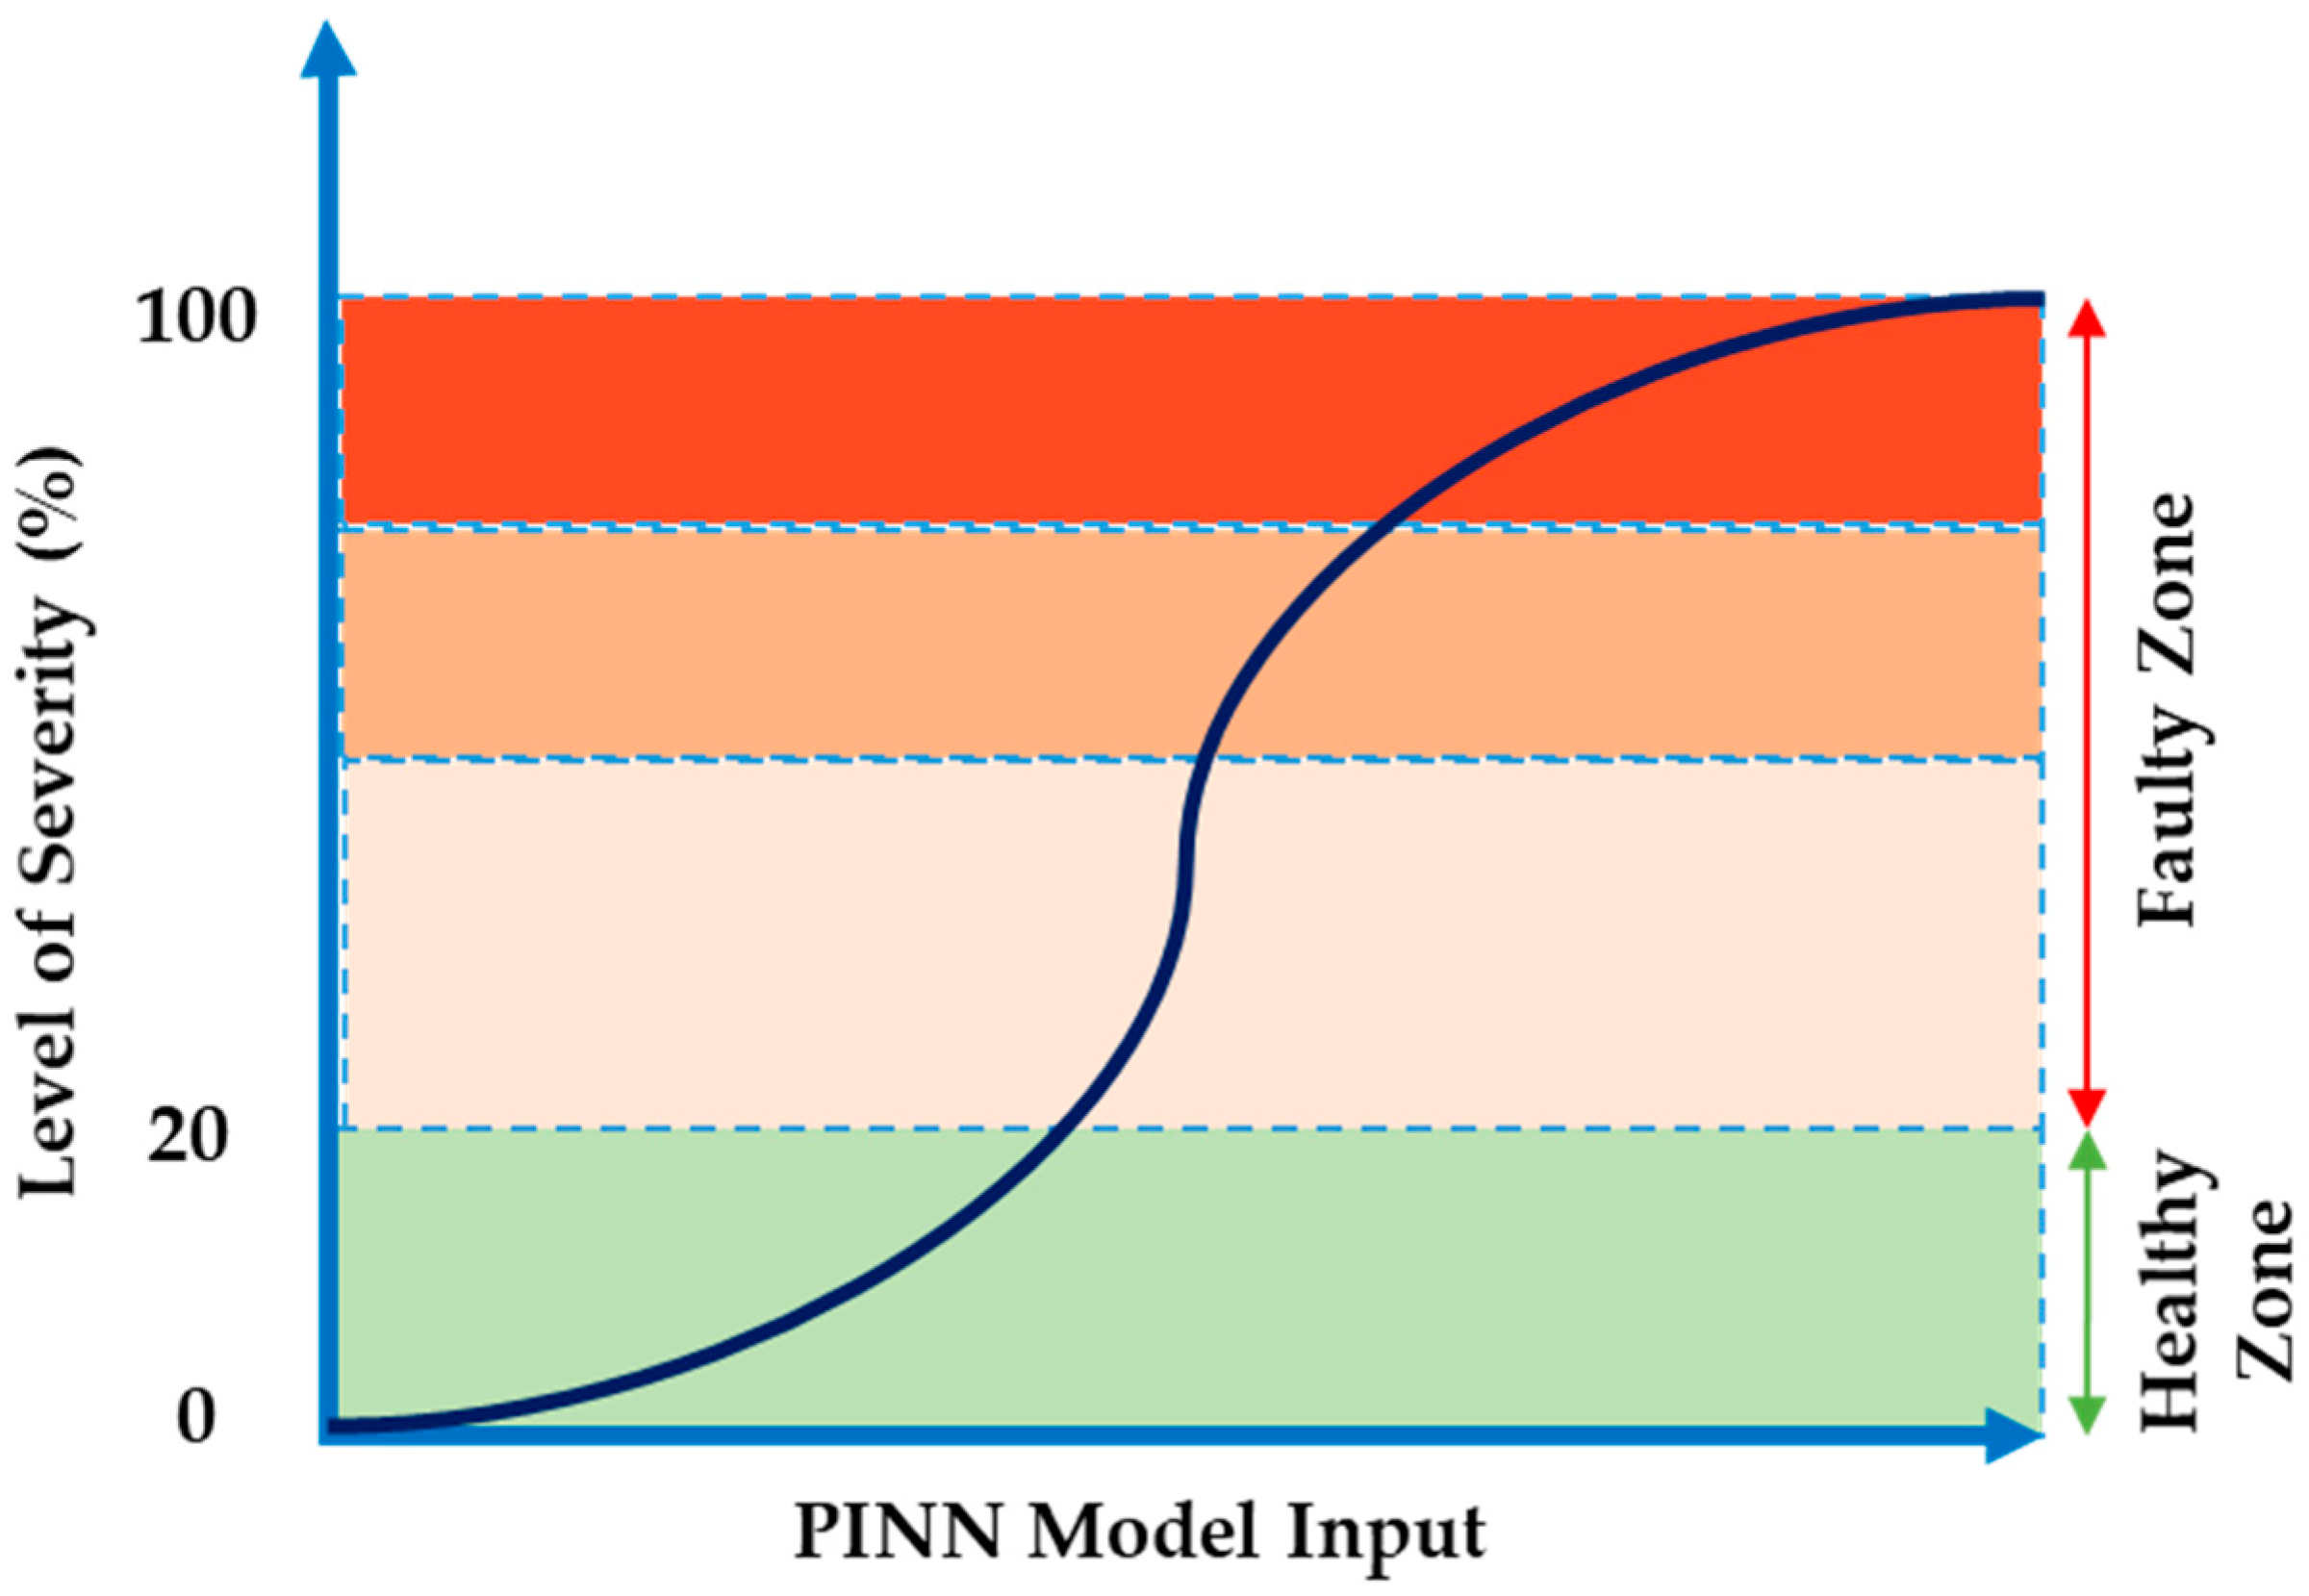
3.3.1. Component Physics
The hydraulic behavior of individual direct proportional valves (DPVs) was modeled using Equation (11), which governs orifice-based fluid flow dynamics. In this formulation,
denotes a normalized valve position function
, while
characterizes the valve’s flow capacity [
35]. Fault severity quantification was implemented through distinct metrics: Equations (12) and (13) evaluate the progression
for obstruction-type faults (filter blockages, valve wear, and nozzle clogging) and piping system leaks, respectively. For the pump, Equation (14) is used to determine the severity level in a leaking pump scenario, where deviations in the volumetric
and mechanical
efficiency coefficients correlate with degradation severity. The parameter S follows a standardized scale, where
indicates healthy operation and
corresponds to a degradation scenario. All components on the testbed share this degradation interval of
(see
Figure 14).
Equation (11). Fluid flow through a valve.
Equation (12). Level of severity for blockages (filter, valve, nozzle).
Equation (13). Level of severity for leaks (pipe).
Equation (14). Level of severity for pump leaks.
3.3.2. Limited Data Modeling
The limited data approach by Barimah et al. [
5] is adapted in this paper. In Case A, a portion of the live process data is incorporated into the overall distribution of the sampled data. In Case B, the live process data represent only a subset of this distribution, depicting a non-ideal situation. In contrast, Case C reflects the ideal scenario, where the degradation data available are truly limited. The rationale behind using a random sampling approach is to intentionally restrict both the quantity and diversity of the degradation data used for model training and development for the reference system (C103A). This approach allows for a focused investigation into how limited data conditions affect the performance of the DT intelligence model.
Figure 15 illustrates the random sampling of degradation data.
3.3.3. Physics-Informed Neural Network Model
The structure of the physics-informed neural network, which was deployed on AWS, is shown in
Figure 16 below. Equations (12)–(14) above are used as physical constraints in constructing the loss function in the training process for the physics-informed neural network (PINN). The PINN model architecture used consists of a fully connected feedforward neural network with a Leaky version of the rectified linear unit (LeakyReLU) activation function to prevent any potential dying ReLU problem during the training process. The network has one input and output node and three hidden layers with 100 neurons in each layer. The Nadam optimizer is used for its good coverage and faster training time [
36]. A Mean Squared Error (MSE) Loss function of the PINN model
used is shown below, where
is a hyperparameter manually set to 1, ensuring the resulting model does not overly favor data-driven learning or physics-based regularization. The total loss for the PINN model, which consists of the data and physics loss, is shown in Equation (15).
Table 4 below also shows the various parameters used for the PINN model and the associated loss functions in Equations (16)–(18), where
and
are treated as trainable parameters in the training process. The input values of the model for each component are also shown in
Table 4 below with the output S of the PINN model between 0 and 1, with 1 representing functional failure and 0 representing healthy conditions. The intelligence model then returns 1 when the degradation threshold is more than 20%, which is when a component is less than 80% healthy.
3.3.4. Uncertainty Quantification (UQ)
The physics-informed neural network (PINN) model developed in [
5] is updated by computing the uncertainty associated with each prediction using Monte Carlo dropout. The predictive distribution
is approximated using
stochastic forward passes
, and the predictive mean
and uncertainty
are computed as follows:
where
denotes the
forward pass with dropout masks. This captures epistemic uncertainty arising from the model parameters [
37]. The implementation of the Monte Carlo dropout is shown in
Appendix A.1. The uncertainty model is used to develop an alert system from the severity of blockages and degradation of the components of both hydraulic systems predicted by the DT intelligence model. The upper and lower bounds of the model prediction are used as low and high alerts, respectively, for the DTs.
3.4. Digital Twin (DT) Intelligence Model Implementation Steps
Step 1: DT Intelligence Model Training
Implementing the DT intelligence model for the digital twin starts with training predictive models for each asset on the reference testbed Testbed-1-C103A (see
Figure 16). The training data for the DT intelligence models are sampled from the full degradation data to create the limited availability of degradation data scenario (see
Section 3.3.2 and
Figure 15). The PINN-enabled DT intelligence models for each asset (see
Section 3.3.3) are used as the models for building containerized applications using Docker to be deployed in a Kubernetes cluster. The uncertainty of the output of each asset model will be determined using Monte Carlo dropout (see
Section 3.3.4), where the bounds of the model prediction are used as an alarm system.
Step 2: DT Modeling
The digital twin for each testbed (Testbed-1-C103A and Testbed-2-C010A) is developed using ThingWorx™ 9.2.1 (see
Figure 4 and
Figure 5). The sensor data from each testbed are routed through a Thingworx
TM API to the Kubernetes cluster to obtain the output of the DT intelligence models. The returned analytics are used to update the DTs on the Thingworx
TM platform for each asset.
Step 3: Scaling DT Predictive Models
The DT intelligence models developed for assets on Testbed-1-C103A are scaled to predict the dynamics of the larger system (Testbed-2-C010A) using the approach defined in
Section 3.2.2 to scale all its sensor data. This allows models developed using limited degradation training data from Testbed-1-C103A to be scaled for similar assets in larger, much more complex systems.
Step 4: Deployment and Monitoring
Figure 17 below summarizes the methodology for the scalable data transformation model for the digital twin intelligence model. The monitoring of the Kubernetes cluster for the DT intelligence model is performed by using Prometheus and Grafana. Using Prometheus and Grafana provides real-time insights into system performance, resource utilization, and potential issues. Prometheus collects and stores data, scraping metrics from Kubernetes components. Grafana connects to Prometheus to display the collected metrics in customizable dashboards, enabling better observability of CPU, memory, network usage, and application health.
4. Transition from Asset to Fleet Asset Management: A Case Study
To ensure the DT developed is functional and monitors existing connected C103A assets in Thingworx
TM, a previous user interface was updated for end-to-end integration with the newly developed Thingworx
TM application user interface. The integration of the C103A hydraulic testbed with the global dashboard is shown in
Figure 18. The integration allows the new application to monitor all assets connected to the Thingworx
TM platform and allows for a more flexible integration of features across all assets in the future. To test out the new predictive analytics deployment in Thingworx
TM, an API service thing is created, and an endpoint to the AWS server is provided, which returns a multi-component status response for the hydraulic testbeds.
Figure 19 and
Figure 20 show the PINN model API endpoint and its response.
The response for hydraulic Testbed-1-C103A, as simulated shown in
Figure 20 above, indicates that the system is faulty and that the following components—pump and nozzle—have started degrading and have a healthy status of less than 80%. The performances of the testbed and its components are noted and thus provide insights into the system’s health. Integration and user testing are performed to ensure the application user interfaces are connected to existing hydraulic assets and Testbed-1-C103A and that the predictive analytics services are integrated into the hydraulic systems, enabling the prognostic features within a digital twin platform after the assets connection to Thingworx
TM via the edge device.
Figure 21 shows the transformed healthy condition data for Pressure Sensor 1 (see
Figure 7).
Table 5 also shows the test degradation scenarios investigated for the larger system (Testbed-2-C010A).
The performance of the scaled DT intelligence model showed improved performance on the test process data from the C010A hydraulic system. The component considered was the filter on the C010A hydraulic testbed with gradual degradation from 0% severity to 100% at three pump speeds: 700 rpm, 800 rpm, and 900 rpm. At 800 rpm, the first alarm (A1) developed using the upper bound of the scaled model showed a model performance of 71.74% as compared to 64.13% for the unscaled predictive model, where an unscaled scenario means passing the degradation data through the predictive model developed using limited training data from Testbed-1-C103A. This trend is seen in other alarms as well (see
Table 6 and
Figure 22) below. This shows the impact that a scaled predictive model of an asset can have on the predictive performance when the degradation data for that asset are very limited or not available, with only health condition data being available.
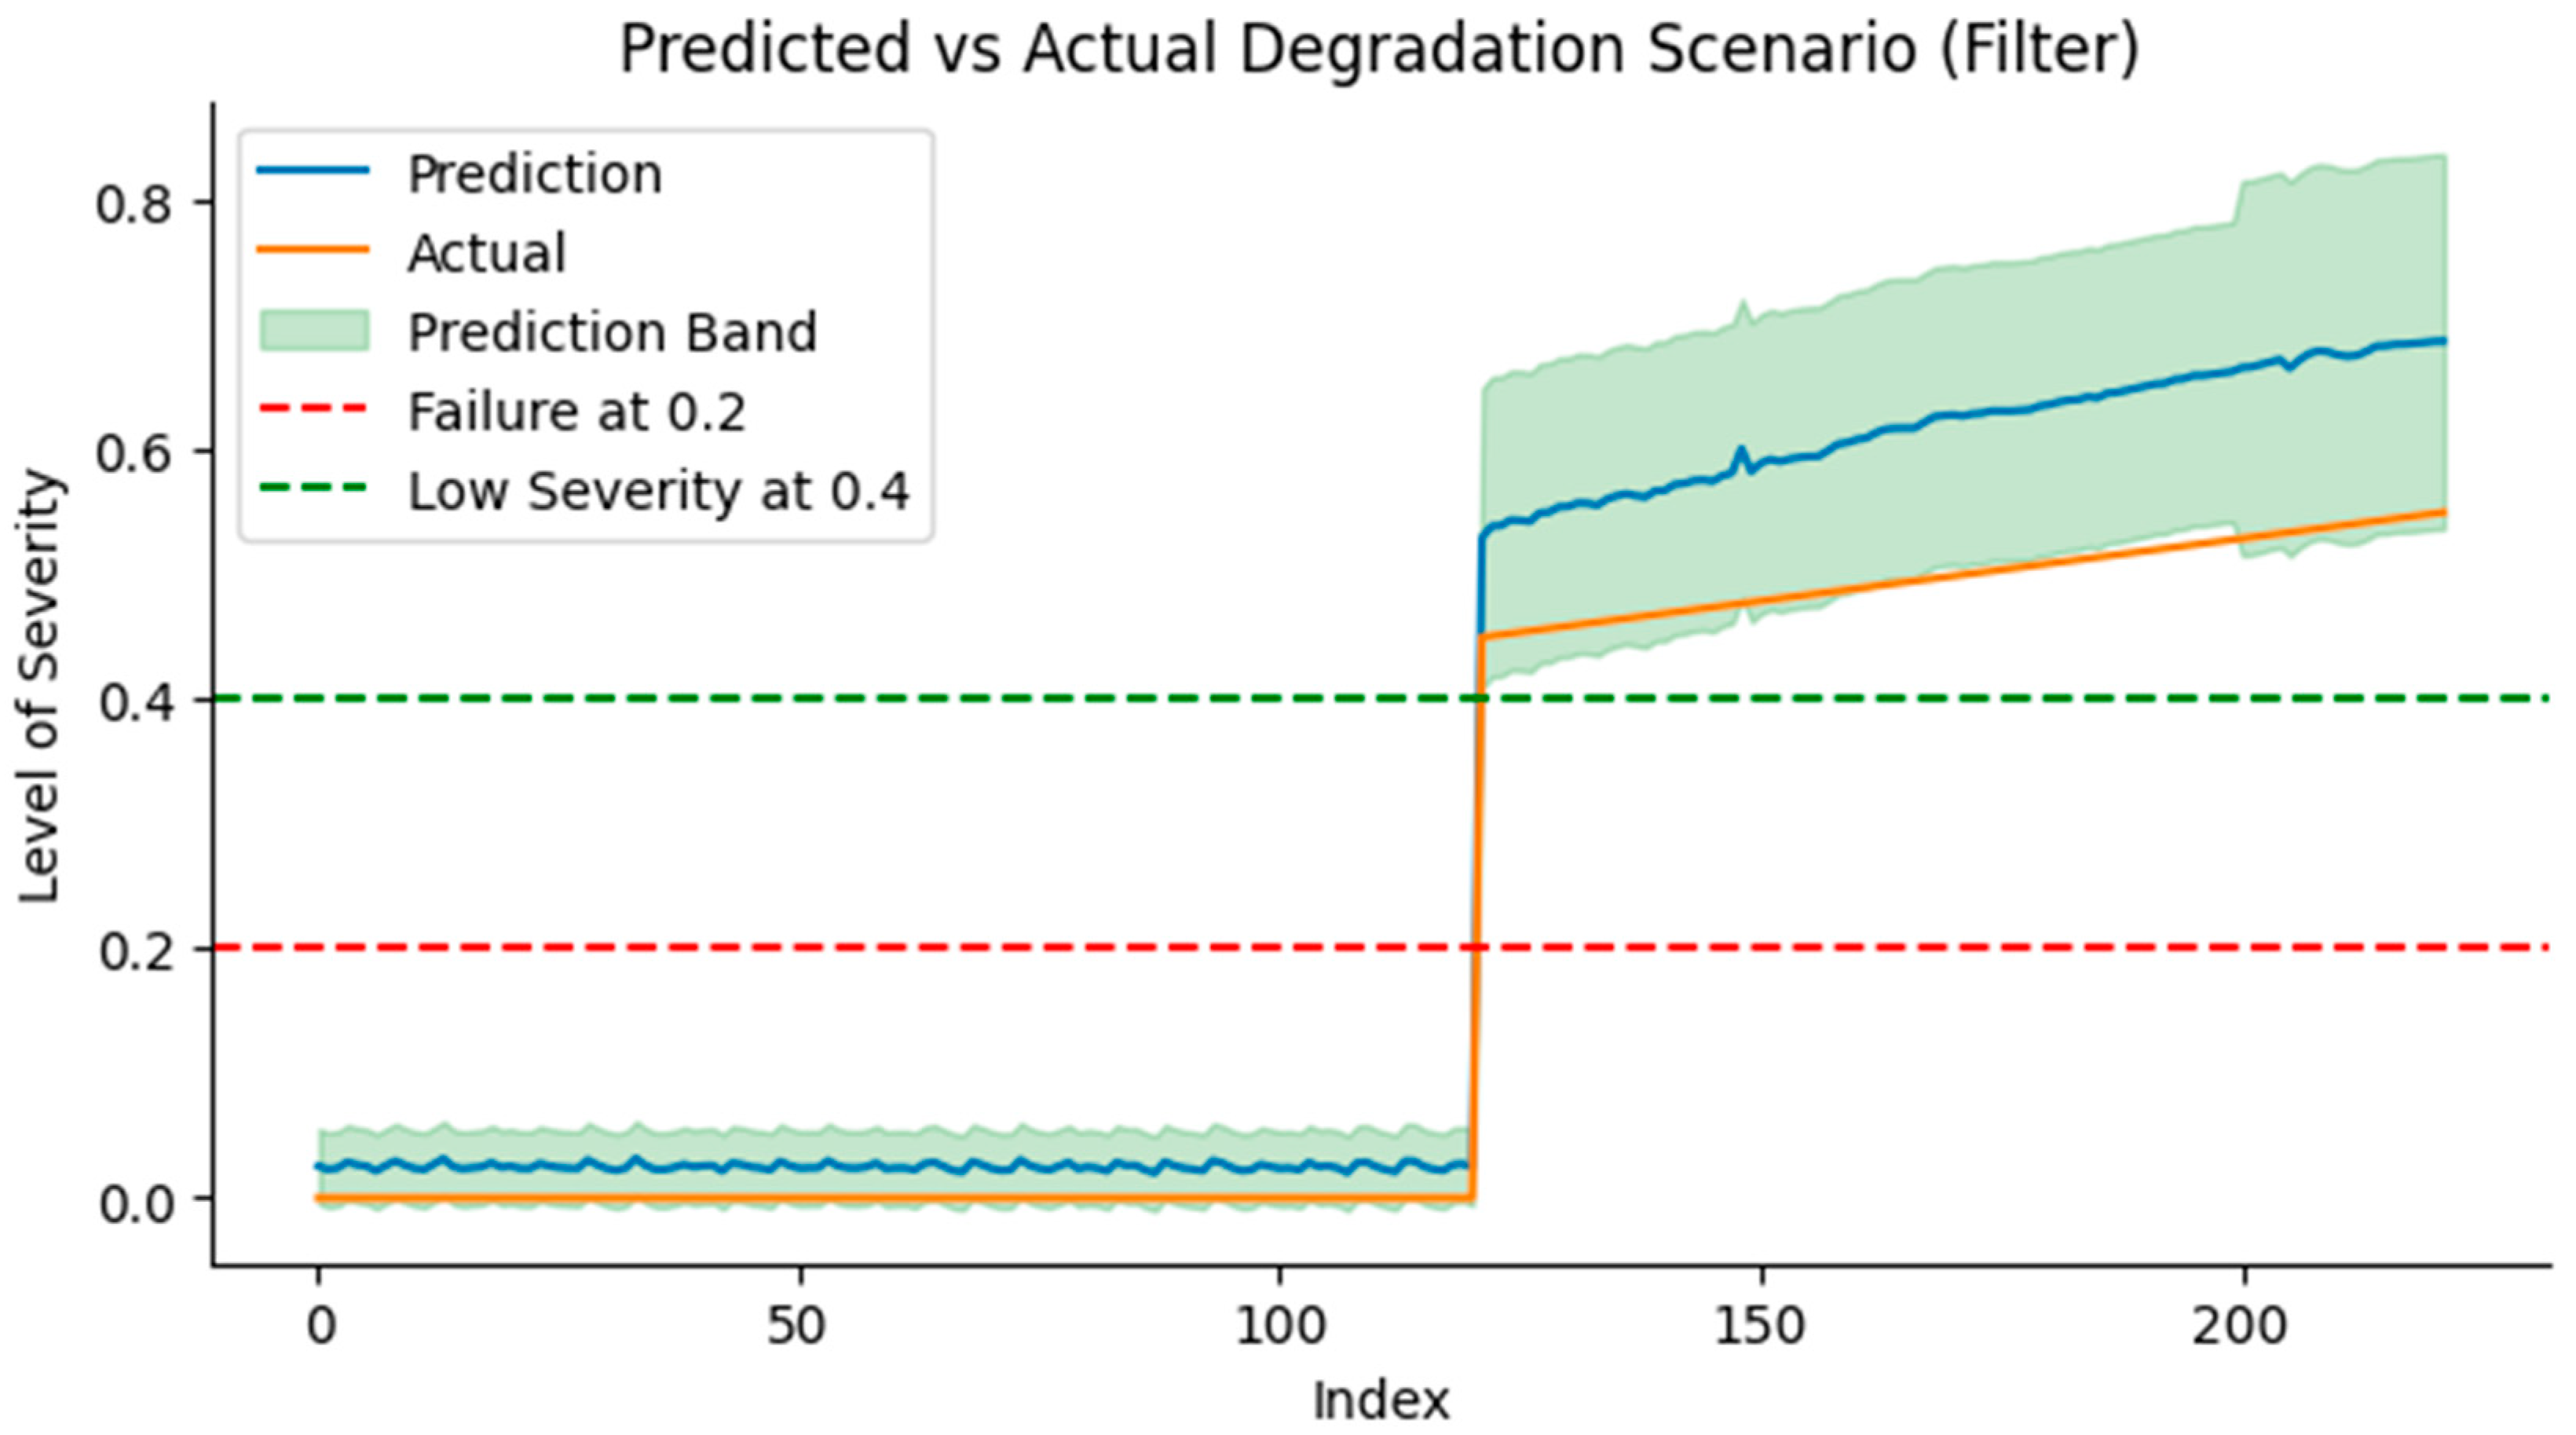
Figure 23 and
Appendix A.2 (see
Figure A1 and
Figure A2) also show the performance of the scaled DT intelligence models for an instantaneous degradation scenario for Testbed-2-C010A at 700 rpm, 800 rpm and 900 rpm respectively.
5. Discussion
The DT architecture of the system leverages a multi-tiered approach, connecting edge devices to ThingworxTM and AWS for advanced data processing and analytics. Each testbed was connected through an edge device to transmit real-time operational data to the cloud. These data are then processed by the backend analytics service, hosted on AWS, which includes a prognostics model designed to predict component degradation. The cloud architecture’s design prioritized reliability and availability by deploying services across multiple data centers (availability zones) and using security measures such as encryption, NAT gateways, and private subnets to protect sensitive data. The use of Kubernetes for managing the containerized applications adds another layer of resilience and scalability. By orchestrating pods that contain predictive models for each hydraulic testbed, Kubernetes ensures efficient load balancing and traffic management, distributing the workload across containers to prevent failures. Each pod is dedicated to a specific component—pump, valve, nozzle, pipe, and filter—ensuring a modular approach to component health management. This microservice architecture not only simplifies management but also enables easy scaling of the system to accommodate more assets in the future.
The predictive analytics component, built using the physics-informed neural network (PINN), offers advanced capabilities in forecasting equipment health. This model takes real-time data from the testbeds, such as pressure differentials and pump speed, and compares them with historically healthy operational data to detect anomalies. The predictive model employs a statistical process control (SPC) algorithm to determine if components such as pumps, nozzles, valves, and pipes are operating within normal bounds. When values fall outside acceptable thresholds, the PINN model predicts the extent of degradation and failure risk, helping to ensure proactive maintenance and reduce downtime. The ability of the scaled filter model to approximate the dynamics of the C010A filter with improved performance provides an approach for the scalability of digital twin models for various assets in a complex system.
Additionally, the ThingworxTM platform provides an intuitive graphical interface using Mashup Builder. The global dashboard allows users to monitor the health of multiple assets at a glance, providing details on system status, the number of healthy versus faulty components, and last report updates. The ability to drill down into individual testbeds and examine specific components adds valuable insights for decision-makers and maintenance teams, enabling the quick identification of issues and appropriate action. The interface’s design accommodates future expansion, allowing new assets to be integrated without significant reconfiguration, demonstrating the flexibility of the ThingworxTM platform in managing a growing asset base.
6. Conclusions
In conclusion, the use of modern cloud architecture, predictive analytics, and microservice infrastructure allows for highly available systems and models capable of managing and diagnosing the health of multiple hydraulic assets in real time. This paper incorporates a wide range of technologies, including cloud services via AWS, Kubernetes for container orchestration, and a machine-learning-based prognostic model, effectively bringing together hardware and software for seamless operation. The main contribution of this paper is providing an optimal data transformation model that can approximate degradation patterns for similar components in different system designs. The scalable DT intelligence models developed through this approach have the potential to significantly reduce the time and cost associated with training models for new, complex systems, enhancing the practicality and adoption of DT technologies across various industries.
However, more research is required to improve the predictive accuracy and robustness in scaling DT deployments. Recommendations for future work packages (WPs) for future work to improve the research and move it towards autonomous digital twin service for multi-asset management are as follows:
WP1: Expand the scope of testing the DT models for each asset by recording more degradation data at different operating conditions.
WP2: Expand the predictive analytics features of the current system to indicate the degradation and healthy level of a component, not only to identify when a component has started degrading but also the degradation level, which would be core in determining the remaining useful life more accurately of the components and the hydraulic system.
WP3: Benchmark scaled model approach against other DT scalability approaches for multi-component degradation scenarios.
WP4: Implement a logic that automatically implements the prescriptive recommendations and actions from an algorithm, thus achieving an autonomous digital twin.
Author Contributions
Conceptualization, A.K.B. and O.N.; methodology, A.K.B. and O.P.O.; software, A.K.B. and O.P.O.; validation, A.K.B., O.N. and D.M.; formal analysis, A.K.B. and O.N.; investigation, A.K.B. and O.P.O.; resources, A.K.B. and O.N.; data curation, A.K.B.; writing—original draft preparation, A.K.B. and O.P.O.; writing—review and editing, A.K.B., O.P.O., O.N., A.C. and D.M.; visualization, A.K.B. and O.P.O.; supervision, O.N., A.C. and D.M.; project administration, A.K.B., O.P.O. and O.N. All authors have read and agreed to the published version of the manuscript.
Funding
This research received no external funding.
Data Availability Statement
The data presented in this study are available on request from the corresponding authors due to data being part of an ongoing research.
Conflicts of Interest
The authors declare no conflicts of interest.
Appendix A
Appendix A.1. GitHub Repository for PINN Models
Appendix A.2. Performance of DT Intelligence Model
Figure A1.
Performance of DT analytics at 800 rpm for instantaneous degradation.
Figure A1.
Performance of DT analytics at 800 rpm for instantaneous degradation.
Figure A2.
Performance of DT analytics at 900 rpm for instantaneous degradation.
Figure A2.
Performance of DT analytics at 900 rpm for instantaneous degradation.
References
- Errandonea, I.; Beltrán, S.; Arrizabalaga, S. Digital Twin for maintenance: A literature review. Comput. Ind. 2020, 123, 103316. [Google Scholar]
- Semeraro, C.; Lezoche, M.; Panetto, H.; Dassisti, M. Digital twin paradigm: A systematic literature review. Comput. Ind. 2021, 130, 103469. [Google Scholar]
- Bhatti, G.; Mohan, H.; Singh, R.R. Towards the future of smart electric vehicles: Digital twin technology. Renew. Sustain. Energy Rev. 2021, 141, 110801. [Google Scholar]
- Lo, C.K.; Chen, C.H.; Zhong, R.Y. A review of digital twin in product design and development. Adv. Eng. Inform. 2021, 48, 101297. [Google Scholar]
- Barimah, A.; Niculita, O.; McGlinchey, D.; Cowell, A.; Milligan, B. Towards Physics-Informed PHM for Multi-component degradation (MCD) in complex systems. PHM Soc. Eur. Conf. 2024, 8, 14. [Google Scholar] [CrossRef]
- Cai, S.; Mao, Z.; Wang, Z.; Yin, M.; Karniadakis, G.E. Physics-Informed Neural Networks (PINNs) for Fluid Mechanics: A Review. Acta Mech. Sin. 2021, 37, 1727–1738. [Google Scholar]
- Huang, B.; Wang, J. Applications of Physics-Informed Neural Networks in Power Systems—A Review. IEEE Trans. Power Syst. 2022, 38, 572–588. [Google Scholar]
- Srivyas, P.D.; Singh, S.; Singh, B. Study of various maintenance approaches types of failure and failure detection techniques used in hydraulic pumps: A review. Ind. Eng. J. 2017, X, 27–35. [Google Scholar]
- Rizvi, S.H.M.; Abbas, M. From Data to Insight, Enhancing Structural Health Monitoring Using Physics-Informed Machine Learning and Advanced Data Collection Methods. Eng. Res. Express 2023, 5, 032003. [Google Scholar]
- Barimah, A. Design of Digital Twins for In-Service Support and Maintenance. PHM Soc. Eur. Conf. 2024, 8, 4. [Google Scholar]
- Wang, Z. Digital Twin Technology. In Industry 4.0—Impact on Intelligent Logistics and Manufacturing; IntechOpen: London, UK, 2020. [Google Scholar] [CrossRef]
- Rasheed, A.; San, O.; Kvamsdal, T. Digital Twin: Values, Challenges and Enablers. arXiv 2019, arXiv:1910.01719. [Google Scholar]
- Singh, M.; Fuenmayor, E.; Hinchy, E.P.; Qiao, Y.; Murray, N.; Devine, D. Digital Twin: Origin to Future. Appl. Syst. Innov. 2021, 4, 36. [Google Scholar] [CrossRef]
- VanDerHorn, E.; Mahadevan, S. Digital Twin: Generalization, Characterization and Implementation. Decis. Support Syst. 2021, 145, 113524. [Google Scholar] [CrossRef]
- Tao, F.; Xiao, B.; Qi, Q.; Cheng, J.; Ji, P. Digital Twin Modeling. J. Manuf. Syst. 2022, 64, 372–389. [Google Scholar] [CrossRef]
- Agrawal, A.; Fischer, M.; Singh, V. Digital Twin: From Concept to Practice. J. Manag. Eng. 2022, 38, 06022001. [Google Scholar] [CrossRef]
- Fuller, A.; Fan, Z.; Day, C.; Barlow, C. Digital Twin: Enabling Technologies, Challenges and Open Research. IEEE Access 2020, 8, 108952–108971. [Google Scholar] [CrossRef]
- Olesen, J.F.; Shaker, H.R. Predictive Maintenance for Pump Systems and Thermal Power Plants: State-of-the-Art Review, Trends and Challenges. Sensors 2020, 20, 2425. [Google Scholar] [CrossRef]
- Saad, A.; Faddel, S.; Mohammed, O. IoT-Based Digital Twin for Energy Cyber-Physical Systems: Design and Implementation. Energies 2020, 13, 4762. [Google Scholar] [CrossRef]
- He, B.; Liu, L.; Zhang, D. Digital Twin-Driven Remaining Useful Life Prediction for Gear Performance Degradation: A Review. J. Comput. Inf. Sci. Eng. 2021, 21, 030801. [Google Scholar] [CrossRef]
- Civerchia, F.; Bocchino, S.; Salvadori, C.; Rossi, E.; Maggiani, L.; Petracca, M. Industrial Internet of Things Monitoring Solution for Advanced Predictive Maintenance Applications. J. Ind. Inf. Integr. 2017, 7, 4–12. [Google Scholar] [CrossRef]
- Liu, M.; Fang, S.; Dong, H.; Xu, C. Review of Digital Twin about Concepts, Technologies, and Industrial Applications. J. Manuf. Syst. 2021, 58, 346–361. [Google Scholar]
- Anghel, D.; Balan, T.C. Automation of IoT-Based Services Using Digital Twin. In Lecture Notes in Networks and Systems; Springer: Cham, Switzerland, 2022; Volume 298, pp. 360–369. [Google Scholar] [CrossRef]
- Galera-Zarco, C.; Papadonikolaki, E. Digital Twin-Based Services: A Taxonomy (Extended Abstract). IET Conf. Proc. 2023, 14, 98–102. [Google Scholar] [CrossRef]
- Talasila, P.; Gomes, C.; Mikkelsen, P.H.; Arboleda, S.G.; Kamburjan, E.; Larsen, P.G. Digital twin as a service (DTaaS): A platform for digital twin developers and users. In Proceedings of the 2023 IEEE Smart World Congress (SWC), Portsmouth, UK, 28–31 August 2023; pp. 1–8. [Google Scholar]
- Georgakopoulos, D.; Bamunuarachchi, D. Digital twins-based application development for digital manufacturing. In Proceedings of the 2021 IEEE 7th International Conference on Collaboration and Internet Computing (CIC), Atlanta, GA, USA, 13–15 December 2021; pp. 87–95. [Google Scholar]
- Steinmetz, C.; Schroeder, G.N.; Rettberg, A.; Rodrigues, R.N.; Pereira, C.E. Enabling and supporting car-as-a-service by digital twin modeling and deployment. In Proceedings of the 2021 Design, Automation & Test in Europe Conference & Exhibition (DATE), Grenoble, France, 1–5 February 2021; pp. 428–433. [Google Scholar]
- Pahl, C. Containerization and the PaaS Cloud. IEEE Cloud Comput. 2017, 2, 24–31. [Google Scholar]
- Raissi, M.; Perdikaris, P.; Karniadakis, G.E. Physics-Informed Neural Networks: A Deep Learning Framework for Solving Forward and Inverse Problems Involving Nonlinear Partial Differential Equations. J. Comput. Phys. 2019, 378, 686–707. [Google Scholar]
- Lin, L.; Bao, H.; Dinh, N. Uncertainty Quantification and Software Risk Analysis for Digital Twins in the Nearly Autonomous Management and Control Systems: A Review. Ann. Nucl. Energy 2021, 160, 108362. [Google Scholar]
- Jardine, A.K.; Lin, D.; Banjevic, D. A Review on Machinery Diagnostics and Prognostics Implementing Condition-Based Maintenance. Mech. Syst. Signal Process. 2006, 20, 1483–1510. [Google Scholar]
- Sankararaman, S. Significance, Interpretation, and Quantification of Uncertainty in Prognostics and Remaining Useful Life Prediction. Mech. Syst. Signal Process. 2015, 52, 228–247. [Google Scholar]
- Williams, C.K.; Rasmussen, C.E. Gaussian Processes for Machine Learning; MIT Press: Cambridge, MA, USA, 2006; Volume 2, p. 4. [Google Scholar]
- Barimah, A.K.; Niculita, O.; McGlinchey, D.; Cowell, A. Data-quality assessment for digital twins targeting multi-component degradation in industrial internet of things (IIoT)-enabled smart infrastructure systems. Appl. Sci. 2023, 13, 13076. [Google Scholar] [CrossRef]
- Knight, E.; Russell, M.; Sawalka, D.; Yendell, S. ValveModeling. Control Valve Wiki 2013. [Google Scholar]
- Bera, S.; Shrivastava, V.K. Analysis of various optimizers on deep convolutional neural network model in the application of hyperspectral remote sensing image classification. Int. J. Remote Sens. 2020, 41, 2664–2683. [Google Scholar]
- Gal, Y.; Ghahramani, Z. Dropout as a bayesian approximation: Representing model uncertainty in deep learning. In Proceedings of the International Conference on Machine Learning, PMLR, New York, NY, USA, 19–24 June 2016; pp. 1050–1059. [Google Scholar]
Figure 1.
Relationship between DT and PHM applications.
Figure 1.
Relationship between DT and PHM applications.
Figure 2.
Digital twin components and high-level processes.
Figure 2.
Digital twin components and high-level processes.
Figure 3.
Digital model, shadow, and twin.
Figure 3.
Digital model, shadow, and twin.
Figure 4.
Kubernetes block diagram (* route path).
Figure 4.
Kubernetes block diagram (* route path).
Figure 5.
Kubernetes infrastructure architecture.
Figure 5.
Kubernetes infrastructure architecture.
Figure 6.
Testbed-1-C103A reference system testbed [
34].
Figure 6.
Testbed-1-C103A reference system testbed [
34].
Figure 7.
Testbed-2-C010A target system.
Figure 7.
Testbed-2-C010A target system.
Figure 8.
Pressure drop across the filters on Testbed-1-C103A and Testbed-2-C010A.
Figure 8.
Pressure drop across the filters on Testbed-1-C103A and Testbed-2-C010A.
Figure 9.
Distribution of the pressure drop across the filters on Testbed-1-C103A and Testbed-2-C010A.
Figure 9.
Distribution of the pressure drop across the filters on Testbed-1-C103A and Testbed-2-C010A.
Figure 10.
(a) Testbed-1-C103A (left) and (b) Testbed-2-C010A (right).
Figure 10.
(a) Testbed-1-C103A (left) and (b) Testbed-2-C010A (right).
Figure 11.
Transformation of Testbed-2 data to match Testbed-1-C103A data.
Figure 11.
Transformation of Testbed-2 data to match Testbed-1-C103A data.
Figure 12.
Application logic for DT intelligence model.
Figure 12.
Application logic for DT intelligence model.
Figure 13.
Application logic block diagram for DT intelligence model.
Figure 13.
Application logic block diagram for DT intelligence model.
Figure 14.
Change in component degradation severity level.
Figure 14.
Change in component degradation severity level.
Figure 15.
A random sampling of full degradation dataset for model training for reference system.
Figure 15.
A random sampling of full degradation dataset for model training for reference system.
Figure 16.
PINN model architecture for each component.
Figure 16.
PINN model architecture for each component.
Figure 17.
Methodology for scalable data transformation model for digital twin intelligence model.
Figure 17.
Methodology for scalable data transformation model for digital twin intelligence model.
Figure 18.
Integration with C103A Testbed on ThingworxTM platform.
Figure 18.
Integration with C103A Testbed on ThingworxTM platform.
Figure 19.
ThingWorx PINN model API for Testbed-1-C103A.
Figure 19.
ThingWorx PINN model API for Testbed-1-C103A.
Figure 20.
PINN model response for system components.
Figure 20.
PINN model response for system components.
Figure 21.
Application of data transformation approach.
Figure 21.
Application of data transformation approach.
Figure 22.
Performance of DT analytics.
Figure 22.
Performance of DT analytics.
Figure 23.
Performance of DT analytics at 700 rpm for instantaneous degradation at 40% severity.
Figure 23.
Performance of DT analytics at 700 rpm for instantaneous degradation at 40% severity.
Table 1.
Gaps in research on DT scalability and reliability.
Table 1.
Gaps in research on DT scalability and reliability.
| Challenge | Description | Impact on DT Scalability and Reliability |
|---|
| Integration of heterogeneous data sources | DTs must aggregate data from sensors, enterprise systems, and engineering models, often in different formats and standards. | Inconsistent data fusion and interoperability issues hinder seamless integration across industrial ecosystems. |
| Lack of standardized frameworks for Uncertainty Quantification (UQ) | Current DT models lack widely accepted methodologies for quantifying and managing uncertainty in predictions. | Reduced trust in DT predictions, making risk-sensitive decision-making more challenging. |
| Limited research on benchmarking data transformation models | Few studies systematically evaluate the effectiveness of different data transformation approaches in DT applications. | Unclear best practices for adapting models across varying industrial conditions, limiting generalizability. |
| Challenges in scaling DT applications across diverse industrial scenarios | Adapting DTs for fleet-wide asset management requires flexible architectures and scalable analytical models. | Difficulty in extending DT benefits beyond single assets, reducing overall return on investment (ROI). |
Table 2.
Healthy condition operating state of the system’s control valves and associated fault codes [
5].
Table 2.
Healthy condition operating state of the system’s control valves and associated fault codes [
5].
| Component | Fault Emulation | Healthy State/Fault Emulation Mechanism | Fault Code |
|---|
| Filter | DPV1 | Fully open/Gradually closing | FC1 |
| Pump | DPV2 | Fully closed/Gradually opening | FC2 |
| Valve | DPV3 | Fully open/Gradually closing | FC3 |
| Nozzle | DPV4 | Fully open/Gradually closing | FC4 |
| Pipe | DPV5 | Fully closed/Gradually opening | FC5 |
Table 3.
Failure condition of assets on Testbed-1-C103A and Testbed-2-C010A.
Table 3.
Failure condition of assets on Testbed-1-C103A and Testbed-2-C010A.
| Testbed | Failure Mode | Emulating Valve | Nominal Mode | Severity Threshold |
|---|
| C103A | Clogged Filter (FC1) | DPV1 | 100% Open | >20% Degradation (<80% Open) |
| | Degraded Pump (FC2) | DPV2 | 0% Open | >20% Degradation
(>20% Open) |
| | Partially Closed Valve (FC3) | DPV3 | 100% Open | >20% Degradation (<80% Open) |
| | Leaking Pipe (FC4) | DPV4 | 0% Open | >20% Degradation
(>20% Open) |
| | Blocked Nozzle (FC5) | DPV5 | 100% Open | >20% Degradation
(<80% Open) |
| C010A | Clogged Filter (FC1) | PCV01 | 100% Open | >20% Degradation (<80% Open) |
| | Degraded Pump (FC2) | Uses operational values from the pump model | | |
| | Blocked Nozzle (FC5) | PCV02 | 100% Open | >20% Degradation (<80% Open) |
Table 4.
PINN model Training parameters.
Table 4.
PINN model Training parameters.
| Asset | Learning Rate | ) | Model Input | Model Output (Severity) | |
|---|
| Pipe | | | | | |
| Valve | | | | | |
| Pump | | | | | |
| Nozzle | | | | | |
| Filter | | | | | |
Table 5.
Test degradation scenarios for filter on Testbed-2-C010A.
Table 5.
Test degradation scenarios for filter on Testbed-2-C010A.
| Test | Component | Operational Speed Range (RPM) |
|---|
| T1 | Gradual degradation (0–100% severity) | 700 |
| T2 | Gradual degradation (0–100% severity) | 800 |
| T3 | Gradual degradation (0–100% severity) | 900 |
Table 6.
Performance of DT intelligence models at different pump speeds for gradual degradation of filter on Testbed-2-C010A.
Table 6.
Performance of DT intelligence models at different pump speeds for gradual degradation of filter on Testbed-2-C010A.
| Pump Speed (RPM) | Predictive Model | Upper Bound (Alarm 1) | Prediction (Alarm 2) | Lower Bound (Alarm 3) |
|---|
| 700 | Scaled | 63.73% | 59.92% | 56.91% |
| Unscaled | 58.52% | 56.71% | 54.31% |
| 800 | Scaled | 71.74% | 65.33% | 60.92% |
| Unscaled | 64.13% | 61.92% | 59.52% |
| 900 | Scaled | 88.98% | 72.55% | 61.13% |
| Unscaled | 64.13% | 61.92% | 59.52% |
| Disclaimer/Publisher’s Note: The statements, opinions and data contained in all publications are solely those of the individual author(s) and contributor(s) and not of MDPI and/or the editor(s). MDPI and/or the editor(s) disclaim responsibility for any injury to people or property resulting from any ideas, methods, instructions or products referred to in the content. |
© 2025 by the authors. Licensee MDPI, Basel, Switzerland. This article is an open access article distributed under the terms and conditions of the Creative Commons Attribution (CC BY) license (https://creativecommons.org/licenses/by/4.0/).


