Abstract
The accurate segmentation of 3D spheroids is crucial in advancing biomedical research, particularly in understanding tumor development and testing therapeutic responses. As 3D spheroids emulate in vivo conditions more closely than traditional 2D cultures, efficient segmentation methods are essential for precise analysis. This study evaluates three prominent neural network architectures—U-Net, HRNet, and DeepLabV3+—for the segmentation of 3D spheroids, a critical challenge in biomedical image analysis. Through empirical analysis across a comprehensive Tumour Spheroid dataset, HRNet and DeepLabV3+ emerged as top performers, achieving high segmentation accuracy, with HRNet achieving 99.72% validation accuracy, a Dice coefficient of 96.70%, and a Jaccard coefficient of 93.62%. U-Net, although widely used in medical imaging, struggled to match the performance of the other models. The study also examines the impact of optimizers, with the Adam optimizer frequently causing overfitting, especially in U-Net models. Despite improvements with SGD and Adagrad, these optimizers did not surpass HRNet and DeepLabV3+. The study highlights the importance of selecting the right model–optimizer combination for optimal segmentation.
1. Introduction
Spheroids, often referred to as 3D cell cultures, possess complex characteristics due to their three-dimensional structure, making them an invaluable tool for emulating tissues and microtumors [1]. However, their intricate nature poses significant challenges for modern biomedical analysis, often leading to suboptimal generalization performance, especially in cancer research [2]. Despite these complexities, 3D spheroids offer the remarkable ability to faithfully replicate tissue architecture and functions, including the critical phenomenon of limited drug penetration [3,4]. This feature makes spheroids exceptionally relevant for in-depth studies of tumor cell behavior [5,6]. Recent advancements have enabled the exploration of how various microenvironmental factors influence tumor dynamics while facilitating the rigorous testing of diverse preclinical and clinical treatments through spheroid models [6,7,8]. Consequently, the segmentation of 3D spheroid images has emerged as a vital focus within the broader landscape of biomedical image analysis [9,10].
Image segmentation itself is a foundational challenge in computer vision [11]. It finds applications across many fields, including robotics [12], geology [13], forensics [14], medicine [15], agriculture [16], autonomous driving [17], and more. The efficient and accurate segmentation of 3D spheroidal structures is essential for advancing both scientific research and medical applications [18]. This study explores key imaging metrics and presents a comprehensive comparative analysis of optimized neural network architectures aimed at enhancing the efficiency of 3D spheroid segmentation. Applications of these techniques range from improving image editing and object localization to guiding decision-making in various domains by processing visual data, further enhancing the capabilities of computer vision methods [19].
Image segmentation techniques can be broadly divided into two paradigms: classical methods and intelligent approaches rooted in artificial intelligence (AI) principles [20,21]. These approaches collectively contribute to the evolution of image segmentation methodologies, enriching the broader field of computer vision and its manifold applications [22,23]. The segmentation of spheroids, which involves identifying and isolating tumor boundaries in medical images, is a critical step in the diagnosis and treatment of cancer [2,24]. Numerous algorithms for image segmentation have been developed, ranging from supervised methods to fully unsupervised techniques [25,26]. Supervised methods, which rely heavily on manual tumor segmentation, are labor-intensive and prone to variability, highlighting the need for automated solutions [25]. While some segmentation efforts focus on images containing a single spheroid, these approaches can also be adapted to segment images containing multiple or combined spheroids [27,28]. These methods include region-based techniques [29], clustering methods [30], and hybrid approaches. For instance, in [31], a novel clustering approach based on Teacher-Learner Based Optimization (TLBO) demonstrates improved results over other clustering techniques. Other segmentation approaches include hybrid methods [32], graph-based techniques [33], deep learning methods [34], watershed techniques [35], thresholding [36], and edge-based techniques [37].
Deep learning-based models have shown particular promise in addressing various challenges, including
- The analysis of ensemble images, where traditional imaging methods process images one by one [38].
- Generalizability and transferability, as DL-based models can learn and replicate shared properties of spheroids, enabling efficient segmentation [39].
- A reduction in the need for domain-specific experts to validate automated segmentation [40].
Despite their advantages, deep learning models face two major challenges: (1) the lack of annotated training data and (2) the challenge of efficiently selecting model hyperparameters that account for spheroid image properties, capturing conditions, and the therapy-related context in which they are captured.
Beyond image segmentation, AI plays a significant role in various other domains of medical research [41,42,43]. For example, AI techniques have been applied to gene selection for cancer classification [44,45]. Hybrid algorithms, such as those utilizing ant colony optimization [46,47] and logistic regression combined with generalized fused LASSO [48,49,50], have proven effective in managing high-dimensional data, which is crucial for accurate cancer classification.
The primary objective of this study is to address the critical challenge of accurate segmentation of 3D spheroids in biomedical imaging. Specifically, this research aims to evaluate and compare the performance of three state-of-the-art neural network architectures—U-Net, HRNet, and DeepLabV3+—to identify the most effective approach for spheroid segmentation. By leveraging advanced techniques such as transfer learning and hyperparameter optimization, we aim to enhance segmentation accuracy and provide actionable insights for both research and clinical applications.
The core of our investigation centers around a comprehensive evaluation of the 3D-spheroid model, meticulously examining three pivotal architectural paradigms: (1) an architecture based on the U-Net framework, (2) an architecture founded on the HRNet paradigm, and (3) an architecture grounded in the DeepLabV3+ architecture. Through a rigorous and detailed exploration of the mathematical foundations of each architecture, we extend beyond theoretical considerations to assess their practical efficacy. This study aims to offer both a theoretical framework and empirical insights that contribute to advancing the field of biomedical image segmentation, thereby addressing key limitations in existing methodologies. Typically, to address the challenge of limited annotated data—a common obstacle in this field—we leverage the power of transfer learning, effectively integrating pre-existing knowledge to enhance our models’ performance. A critical aspect of our study is the exhaustive optimization of methodologies and hyperparameter tuning, guiding us toward identifying the most effective model. Moreover, our investigation includes a comparative analysis of training parameters, carefully aligned with the unique metrics and criteria pertinent to the specific properties of spheroids. The empirical phase of our study focuses on a comprehensive tumor spheroid dataset, unveiling a compelling narrative of innovation and advancement in segmentation techniques [51]. The highlight of our endeavor is the proposed model, which demonstrates competitive performance, achieving a mean whole-tumor segmentation Dice score of 0.9203. Additionally, the model exhibits strong results in enhancing tumor and core segmentation, with Dice scores of 0.9113 and 0.8726, respectively. However, our contribution extends beyond these quantitative achievements.
In the remainder of the paper, Section 2 provides a summary of previous studies on the segmentation of 3D spheroids, covering pioneering approaches based on machine learning and deep learning, as well as the challenges and limitations encountered. Section 3 presents the theoretical formulation of the deep neural network models employed in this study, including the problem formulation. Section 4 presents the proposed methodology, while Section 5 discusses the experiments conducted and the results obtained. Finally, Section 6 concludes the paper.
2. Related Works
In recent years, there has been a significant adoption of neural-network-based approaches for 3D spheroid segmentation. Early studies in this field predominantly relied on imaging techniques, which played a pivotal role in enabling thorough investigations into spheroid structure and behavior.
Imaging methods, such as Brightfield Microscopy, Phase-Contrast Microscopy, fluorescence microscopy, Confocal Microscopy, Optical Coherence Tomography (OCT), and Magnetic Resonance Imaging (MRI), have been central to segmentation processes in the early stages of 3D spheroid research. The primary objective of these techniques is to capture and analyze the structural and morphological characteristics of spheroids. For example, researchers in [52] proposed a workflow that combines data from mass spectrometry and fluorescence microscopy to segment spheroids. This integrated approach evaluates drug penetration and cell type distribution within 3D in vitro spheroids. Similarly, ref. [53] introduced 3D-Cell-Annotator, an open-source software for the semi-automated segmentation of single cells in 3D microscopy images, achieving the precision of a human expert. In another study, ref. [54] utilized light sheet-based fluorescence microscopy to automate nuclei segmentation, revealing concentric layers of breast carcinoma spheroids with varying cell densities. While these imaging methods offer valuable insights, several limitations have been identified, such as variability in output, the challenge of combining high-content imaging, complex and noisy data, and the high cost and time required for large-scale studies [55,56,57]. These challenges underscore the need for more efficient and scalable approaches, especially when annotating 3D spheroid images for automatic segmentation using machine learning techniques.
The transition from traditional imaging methods to automatic 3D spheroid segmentation began with machine-learning-based proposals. In this context, authors like [58] proposed supervised machine learning models for 3D microscopy that eliminate the need for manual annotation by leveraging large volumes of unlabeled data. This unsupervised approach extracts meaningful features from microscopy images without the burden of manual annotation. In another study, ref. [59] presented a machine learning model that creates heterogeneous spheroids resembling arterial structures, demonstrating its utility in spheroid segmentation and morphological clustering. These early approaches, while effective in automating segmentation, often faced challenges such as overfitting, especially due to the limited availability of annotated training data. The variability in spheroid characteristics—including size, shape, and cell distribution—further complicates generalization across diverse datasets. Addressing these limitations requires efforts such as acquiring more annotated data, developing robust preprocessing techniques, and exploring advanced architectures suitable for 3D segmentation tasks.
Neural networks have emerged as a potent solution to many of these challenges. Recent advancements have demonstrated their efficacy in the segmentation of 3D spheroids. For example, in ref. [60], a multiscale deep adversarial network was employed for 2D bright-field microscopy spheroid segmentation, achieving remarkable results without requiring configuration. In 3D nuclear segmentation, ref. [61] applied convolutional neural networks (CNNs) to spheroid models of human mammary epithelial cells, significantly improving segmentation accuracy. CNNs have also been utilized in other domains, such as the segmentation of the sphenoid sinus in CT scans [62] and the combination of CNNs and recurrent neural networks (RNNs) to track spheroids in time-lapse microscopy data (ref. [63]). Moreover, ref. [64] proposed a multiview CNN architecture that incorporates multiple imaging perspectives to enhance segmentation performance for 3D spheroids. These neural-network-based approaches have collectively revolutionized the segmentation of spheroid models, offering unprecedented insights into their characteristics and behavior.
Beyond segmentation, convolutional neural networks have been employed for spheroid clearing and behavior analysis. The authors of [65] introduced a method for clearing 3D fluorescent microscopy spheroids by combining soft chemicals with CNN-based segmentation, enhancing visualization and allowing high-quality image acquisition. Similarly, ref. [66] developed a CNN-based algorithm for analyzing tumor spheroid behavior in 3D cultures, combining boundary detection and invasiveness analysis to improve high-throughput drug screening. However, the large volumes of imaging data required for such analyses pose computational challenges, demanding significant resources and time for training and deploying neural network algorithms.
To address the issue of limited annotated training data, various data augmentation techniques have been proposed. For instance, ref. [60] utilized multiscale deep adversarial networks, combining elements from U-Net, long-short skip connection networks, and multiscale architectures while creating ground truth data through semi-automatic segmentation and manual annotation. Other works, like ref. [67], have focused on reducing the annotation burden by integrating unsupervised machine learning and thresholding methods with CNNs. This approach improved annotations, generating better segmentation results than traditional methods. Another proposal by ref. [59] automated the annotation process using pixel annotation tools, significantly reducing manual effort. These data augmentation techniques represent promising strategies for overcoming the scarcity of annotated data and achieving more robust segmentation models.
The remarkable advancements in deep-learning-based methods have led to the development of specialized tools for 3D spheroid segmentation. For instance, SpheroidJ [27] is an open-source tool for deep-learning-based spheroid segmentation, adaptable to various spheroid images and configurations. SpheroidPicker [18] offers an automated system for 3D cell culture manipulation, using light microscopy and micromanipulation to select and transfer uniform spheroids for experimentation. Similarly, 3DeeCellTracker [68] is a deep-learning-based software for tracking and segmenting cells in 3D time-lapse images, revealing dynamic cell behaviors that were previously difficult to analyze.
Table 1 provides a comprehensive comparison of recent studies focusing on 3D spheroid segmentation and related tasks. It highlights key methodologies, datasets, contributions, performance metrics, and limitations of each approach, offering valuable insights for researchers in 3D spheroid segmentation. Additionally, it emphasizes the strengths and weaknesses of these techniques, helping researchers identify suitable methods for their specific needs or areas requiring further improvement.

Table 1.
Comparison of studies on 3D spheroid segmentation.
One of the standout observations is the diversity of models used across these studies. While traditional architectures like U-Net and 3D CNNs remain popular, more advanced models such as PSP-U-Net, HRNet-Seg, and Mask R-CNN have emerged as high-performing alternatives. These modern architectures often leverage deep learning innovations to enhance segmentation accuracy and adaptability. The datasets and data types employed in these studies also vary widely, including 2D bright-field microscopy images, 3D fluorescence microscopy images, and synthetic datasets. This diversity highlights the adaptability of different approaches to a range of data formats. For example, studies like [27] emphasize the importance of generalizability across experimental conditions, whereas others, such as [52,65], focus on highly specialized datasets and scenarios.
In terms of performance, several studies reported impressive results. HRNet-Seg [27] achieved a remarkable Jaccard Index of 0.97 ± 0.01, demonstrating its ability to generalize effectively across diverse datasets. Similarly, PSP-U-Net [66] achieved an F1-Score above 0.95, underscoring its high segmentation accuracy. Another standout is 3DeeCellTracker [68], which showcased 90–100% tracking accuracy, making it highly effective for dynamic cell activity analysis.
The studies also made significant contributions beyond segmentation accuracy. For instance, ref. [53] introduced a semi-automated annotation tool that drastically reduces manual effort, while [18] developed an AI-guided system for spheroid selection and transfer, paving the way for more standardized workflows in precision medicine. Furthermore, ref. [65] proposed innovative digital clearing techniques, broadening the applicability of high-throughput imaging.
Despite their achievements, many of these approaches face notable limitations. A recurring challenge is the generalizability of the models. While some studies, such as [27], strive to adapt their algorithms to diverse datasets, others, like [52], struggle with scalability and application to unseen scenarios. Computational complexity also poses a barrier, as seen in PSP-U-Net [66], which requires extensive training and computational resources. Additionally, reliance on synthetic training data [58] raises concerns about the real-world applicability of these methods.
3. Formulation of Deep Neural Network Models
The rapid proliferation of DNN-based model variants for image segmentation has made it increasingly challenging to keep up with the latest advancements. In this section, we present the formulation of three prominent DNN-based models.
3.1. UNet
UNet, first introduced by [69] in 2015, is a fully convolutional neural network architecture designed primarily for image segmentation tasks. UNet excels at partitioning an image into two main components: regions and objects. It has found extensive use in diverse applications, including medical image segmentation (e.g., tumor segmentation), robotics, text segmentation, object detection, tracking, land-use classification, and semantic segmentation. UNet networks are particularly well suited for any application requiring accurate image segmentation and are effective with different image types, such as grayscale and RGB images.
The UNet architecture comprises two main parts: a contracting path and an expansive path. The contracting path uses convolutional and max-pooling layers to progressively reduce the image’s dimensions while extracting more features. This helps the network learn meaningful representations of the image. Conversely, the expansive path applies upsampling and convolutional layers to increase the image’s resolution while refining feature maps. The goal is to reconstruct the image using the learned features from the contracting path. Skip connections are introduced between the corresponding layers of the contracting and expansive paths, enabling the network to combine both high-level and low-level features effectively.
UNet architectures can be considered a form of auto-encoders. The contracting path serves to extract and condense the most relevant features of the image, while the expansive path reconstructs the segmented image. The final output of a UNet model is a probabilistic map, where each pixel is assigned a probability indicating the likelihood of its belonging to a particular segment.
3.2. HRNet Architecture
HRNet (High-Resolution Network) is a convolutional neural network architecture introduced by [35] in 2019. The primary idea behind HRNet is to process images at multiple resolutions simultaneously and integrate features across different scales to achieve superior performance in computer vision tasks such as facial landmark detection and semantic segmentation.
Figure 1 illustrates the design of HRNet, which is inspired by cascaded pyramid networks [66]. The architecture consists of several subnetworks that operate at varying resolutions and exchange information between different scales. The horizontal axis in the figure represents the depth of the network, while the vertical axis represents the scale of the feature maps.
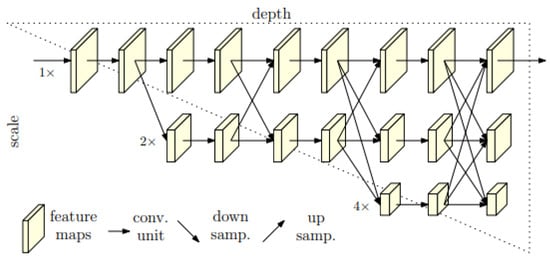
Figure 1.
Structure of the HRNet model.
The HRNet framework is organized into several stages, with each stage containing multiple parallel pyramids. As the input image moves through the stages, its resolution is progressively reduced, but high-resolution image representations are preserved through the parallel pyramids. The final stage involves merging the feature maps from all pyramids to produce the final output. As illustrated in Figure 2, the fusion module aggregates information from high, medium, and low resolutions from left to right. This fused output can be used for various tasks, such as semantic segmentation and object detection.
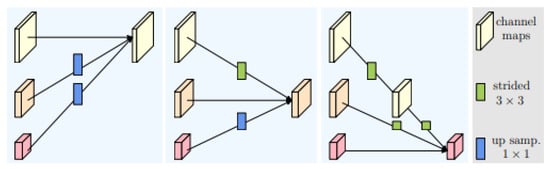
Figure 2.
Fusion module in HRNet architecture.
3.3. DeepLabV3+
DeepLabv3+ [66] is a neural network architecture that employs an encoder–decoder approach for semantic segmentation. In typical convolutional neural networks (CNNs), the use of convolutions and max-pooling progressively reduces the spatial resolution of feature maps, often by half at each step. This can result in sparse feature extraction when the feature map is projected back onto the original image [66]. DeepLabv3+ addresses this issue through the use of Atrous Spatial Pyramid Pooling (ASPP) and atrous convolutions, which enable dense feature extraction without a loss of spatial resolution.
Atrous convolutions, also known as dilated convolutions, extend the receptive field without increasing the size of the feature map or the number of parameters. Mathematically, the output of a 2D atrous convolution is computed as follows:
where is the input image, is the convolution filter, and r is the dilation rate that controls the sampling stride. When , the atrous convolution behaves like a standard convolution. However, for values of , such as shown in Figure 3, the receptive field is expanded, allowing the convolution to capture more context from the image. The advantage of atrous convolution lies in its ability to capture multi-scale information, making it particularly effective for tasks like image segmentation. Several models, including the DeepLab family proposed by Google and DenseASPP [70], leverage this technique to achieve state-of-the-art performance on benchmark datasets such as PASCAL VOC, PASCAL-Context, and Cityscapes.
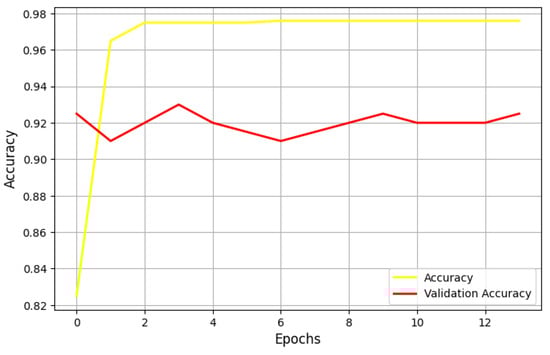
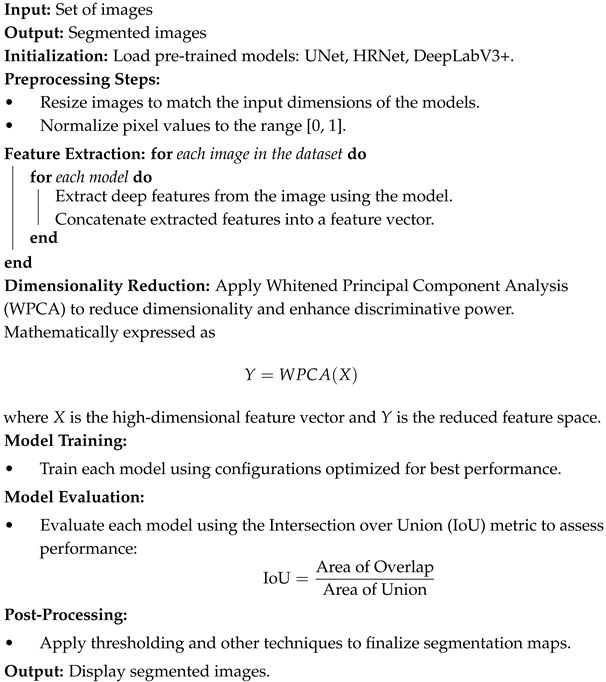
Figure 3.
Performance of the U-Net model in terms of accuracy with a learning rate of 0.05 and the Adam Optimizer.
3.4. Optimizers
In machine learning, the choice of optimizer plays a crucial role in minimizing the cost or loss function, which measures the discrepancy between predicted and actual outputs. By minimizing this cost, the optimizer fine-tunes the model’s weights and biases, thereby improving its accuracy. To evaluate the effectiveness of our model, we compared its performance using three optimizers: Stochastic Gradient Descent (SGD), Adagrad, and Adam.
Optimizers adjust the parameters of the model by first computing the loss between the predicted and true values and then updating the model weights accordingly. Different optimizers have their own strengths and weaknesses, and the choice of optimizer depends on the problem at hand. Common optimizers include SGD, Adam, Adagrad, and RMSProp. For tumor detection, we experimented with SGD, Adagrad, and Adam. The update rule for SGD is expressed as
where is the model’s parameters at iteration t, is the gradient of the loss function with respect to the model parameters for a randomly selected training example i, and is the learning rate. One limitation of SGD is that the learning rate remains constant throughout training, which can be problematic. In some cases, it is beneficial to decrease the learning rate as the model approaches an optimal solution or increase it when far from the optimum.
Adagrad improves upon SGD by adapting the learning rate for each parameter based on the historical gradient information. This approach can speed up convergence and improve performance. The update rule for Adagrad is as follows:
where is the parameter of the model at iteration t, is the gradient of the loss function at step t, is the learning rate, is the sum of squares of the gradients up to iteration t, and is a small constant added to prevent division by zero.
The final optimizer we considered is Adam, a popular algorithm that combines the advantages of Adagrad and RMSProp. Adam is well suited for problems with large datasets and high-dimensional parameter spaces. The update rule for Adam is given by
where
Here, and are the first and second moments of the gradient, respectively, and is the gradient of the loss function at step t. The decay rates and are typically set to 0.9 and 0.999, respectively. To correct for bias towards zero at the start of training, bias correction terms are applied:
In this formulation, and represent bias-corrected estimates of the first and second moments, respectively, of the gradients. The learning rate is denoted by , and is a small constant added to avoid division by zero. Adam’s ability to handle sparse gradients and its adaptive learning rate make it a robust choice for training deep learning models.
4. Proposed Methodology
The implementation of neural network models for 3D spheroid segmentation involves several key phases, starting with preprocessing, followed by model setup, training, evaluation, post-processing, and finally, deployment, as explained in Figure 4.
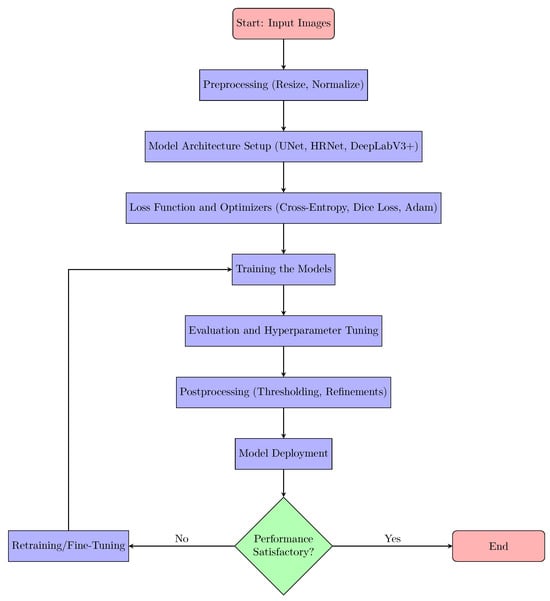
Figure 4.
Flowchart of the proposed 3D Spheroid Segmentation method.
The first step, Preprocessing, is essential to prepare the input images for further processing by the neural networks. In this phase, images are resized and normalized to ensure they have consistent dimensions and pixel values across the dataset. This normalization process can be described as
where I is the original image, and and represent the minimum and maximum intensity values, respectively. This transformation scales pixel values to the range [0, 1], ensuring the neural networks can effectively process the data.
The next phase is Model Architecture Setup, where three different models are configured: UNet, HRNet, and DeepLabV3+. Each model has its specific architectural design suited for segmentation tasks. The UNet architecture, for instance, employs a contracting path to downsample the image and an expansive path to upsample it, combining these two paths through skip connections. The forward pass in UNet is mathematically represented as
where and represent the weights and bias at layer l. HRNet and DeepLabV3+, on the other hand, combine features from multiple resolutions to enhance the segmentation quality by capturing both local and global information. This enables them to perform well even in complex segmentation tasks.
After the model architectures are set up, the Loss Function and Optimizers phase begins. A combination of Cross-Entropy loss and Dice loss is employed to optimize the models during training. The Cross-Entropy loss measures the divergence between the predicted and actual labels, while Dice loss helps improve the model’s segmentation accuracy by focusing on overlapping regions between predicted and ground truth masks. The loss function is given as
where y and represent the true and predicted segmentation masks. The Adam optimizer is used to update the model parameters during training, and its update rule is described as
where is the learning rate and and are the first and second-moment estimates of the gradients.
Training the models involves running the dataset through each model to learn the segmentation patterns. During this phase, the models adjust their internal weights to minimize the loss function, improving performance over time. Early stopping and model checkpointing techniques are often used to avoid overfitting and ensure the model generalizes well.
Once training is complete, Evaluation and Hyperparameter Tuning is performed. The performance of the models is assessed using several metrics, including the Intersection over Union (IoU), precision, Dice coefficient, and accuracy. IoU is computed as
where A and B are the predicted and true masks. By evaluating these metrics, we can fine-tune hyperparameters such as learning rates and batch sizes to optimize the model’s performance.
After evaluation, Postprocessing techniques are applied to refine the segmentation output. This often involves applying thresholding techniques to convert predicted probability maps into binary masks, which clearly define object boundaries. The thresholding operation is given by
where is the predicted probability at pixel and is the threshold value.
The trained models are then deployed for practical use in the Model Deployment phase, where they can be applied to new spheroid images for automatic segmentation. The models take an input image and output a segmentation mask that identifies relevant structures within the image.
Lastly, a Feedback Loop is established, which allows continuous refinement of the models based on performance feedback and new data acquisition. As new spheroid images become available or if the model’s performance on certain types of images is insufficient, retraining or fine-tuning can be applied to improve accuracy and generalization capabilities. Algorithm 1 provides a concise overview of the key steps involved in the proposed method, summarizing its main procedures effectively.
| Algorithm 1: Image Segmentation Using UNet, HRNet, and DeepLabV3+ |
 |
5. Results and Discussion
5.1. Datasets
For this study, we utilized an open dataset [51], which includes 621 images and 921 masks, each with a resolution of 512 × 512 pixels. Each image has a fully annotated ground truth segmentation map, with cells represented in white and membranes in black. We evaluated the segmentation performance and parameters of three models: U-Net, HRNet, and DeepLabV3+. All models were trained for 100 epochs, and the best results were recorded during the training process. The dataset was split into 489 training images and 132 test images. Three architectures were trained: U-Net with a ResNet-34 backbone [69], DeepLabV3+ with a ResNet-50 backbone [66], and HRNet-Seg with an HRNet-W30 backbone [35]. The DeepLabV3+ and HRNet architectures were trained using PyTorch [71] and FastAI [72] on an Nvidia RTX 2080 Ti GPU, while the U-Net architecture was trained independently of PyTorch libraries. The learning rates for the two architectures were set using the method presented by [72]. Early stopping was applied to all architectures to prevent overfitting. As a result of the training process, three models were produced that can be used for inference by providing spheroid images as input, with each model generating a corresponding segmentation mask. The original images in our dataset had dimensions of 1002 × 1004 pixels. To train U-Net, we resized the images to 256 × 256 and 192 × 192 pixels.
5.2. Evaluation Metrics
To assess the segmentation performance of the models, we used several metrics: Intersection over Union (IoU), precision, the Dice coefficient (Dice), and pixel accuracy (ACC).
The Intersection over Union (IoU) metric evaluates the prediction quality of a segmentation model. The IoU is calculated as
where , , and represent true positives, false positives, and false negatives, respectively.
The Dice coefficient measures the similarity between two sets, with values ranging from 0 to 1. A Dice value closer to 1 indicates more effective segmentation. The Dice coefficient is calculated as
Accuracy (ACC) represents the ratio of correctly predicted pixels to the total pixels and is computed as follows:
The Jaccard index, closely related to the Dice coefficient, quantifies the percentage overlap between the target mask and the predicted output. This metric is often used as a loss function during model training.
5.3. Performance of the U-Net Model
This study examined the effect of different learning rates and optimizers on the performance of U-Net models for image segmentation. While previous research has highlighted the general effectiveness of U-Net, few studies have explored how varying learning rates and optimizers affect segmentation quality, particularly regarding overfitting and the model’s ability to capture the internal structure of images.
5.3.1. Impact of Learning Rates on Model Performance
The learning rate is a crucial hyperparameter that dictates the speed at which the model updates its weights during gradient descent. Striking the right balance is essential—too high a learning rate may lead to instability and suboptimal convergence, while too low a learning rate can slow down training and hinder performance. To better understand its impact, we conducted two tests aimed at identifying an optimal learning rate.
In the first test, we set the learning rate to 0.05 and employed the Adam optimizer. Figure 3 illustrates the performance of the U-Net model under these conditions, measured using the Jaccard metric.
Our findings indicate that, despite extensive training, the model struggles to accurately capture the internal structures of images, leading to erroneous segmentations. This suggests that Adam may not be the ideal optimizer for this task at the given learning rate. The model overfits the training data, performing well on the training set but exhibiting limited generalization when applied to unseen images. Overfitting in this case may stem from Adam’s adaptive learning rate adjustments, which can sometimes lead to overconfident updates, preventing the model from learning robust feature representations.
To improve the model’s generalization and reduce overfitting, several adjustments can be made. Lowering the learning rate in the Adam optimizer (e.g., to 0.001 or lower) allows for more gradual and stable updates, promoting better generalization. Alternatively, switching to optimizers like SGD or RMSprop may yield smoother and more consistent weight updates. Additionally, incorporating regularization techniques such as dropout, L2 regularization, or batch normalization can enhance the model’s robustness and transferability. Finally, implementing learning rate decay through a scheduler helps prevent erratic updates, ensuring steady convergence and improved performance on unseen data.
Figure 5 shows the performance of the UNet model, using a learning rate of 0.001 and the Adam optimizer, measured by the log loss metric. The model is very unstable during both the training and validation phases, indicating that the learning rate should be adjusted. In this experiment, one training epoch suffices for the model to be well trained.
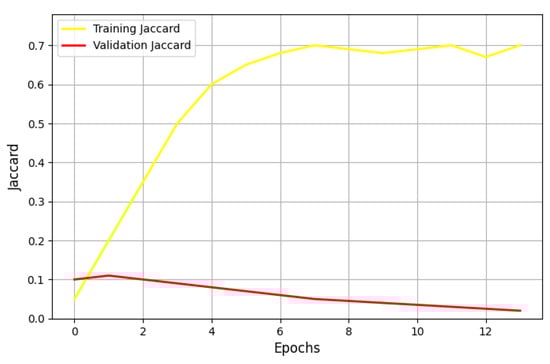
Figure 5.
Performance of the U-Net Model in terms of the Jaccard metric with a learning rate of 0.001 and the Adam optimizer.
The graph indicates significant instability in both the training and validation phases, characterized by erratic log loss fluctuations. This suggests that the current learning rate of 0.001 may be too high, preventing effective convergence. Experimenting with smaller learning rates is likely necessary to stabilize training. Additionally, monitoring other metrics alongside log loss, such as accuracy, could provide further insights into the model’s learning dynamics.
Figure 6 shows the performance of the UNet model, using a learning rate of 0.001 and the Adam optimizer, based on the Jaccard metric. During the training phase, the Jaccard metric remains relatively constant across all epochs. However, in the validation phase, the Jaccard metric fluctuates, indicating that the learning rate should be adjusted. This instability during validation suggests that the current learning rate may not be optimal. It could indicate overfitting, where the model adapts too closely to the training data, or issues like vanishing gradients due to an overly small learning rate.
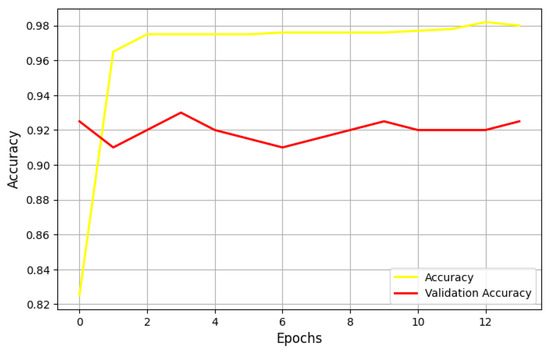
Figure 6.
Performances of the UNet model using a learning rate equal to 0.001 and the Adam optimizer on accuracy metric.
5.3.2. Performance Using SGD and Adagrad Optimizers
To thoroughly assess the effectiveness of our model, we conducted a comparative analysis using two additional optimizers: SGD and Adagrad. When utilizing Adagrad, we observed that the precision metric fluctuates significantly throughout both the training and validation phases. This instability suggests that the learning rate requires further tuning to improve convergence. Similarly, the Jaccard metric exhibits oscillatory behavior but stabilizes after just one epoch, indicating potential sensitivity to hyperparameters.
Figure 7 illustrates the performance of the UNet model when optimized with SGD, as measured by the Jaccard metric. The results show a steady improvement with each epoch, with 36 epochs emerging as the optimal point, minimizing the loss function. However, the validation Jaccard metric exhibits significant fluctuations, suggesting that the model may be underfitting and struggling to generalize effectively to unseen data.
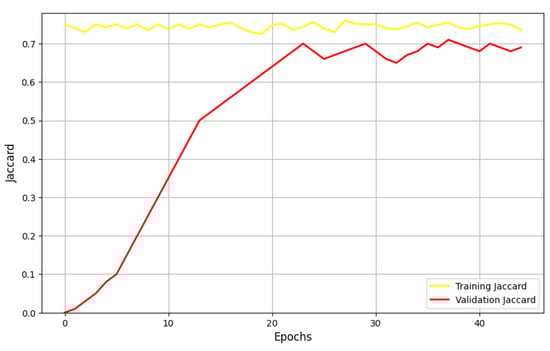
Figure 7.
Performances of the UNet model using the SGD optimizer in terms of the Jaccard metric.
Furthermore, Figure 8 presents the log-loss evolution of the UNet model trained with SGD. The training loss steadily declines across the epochs, reaching a minimum value of approximately 0.03, indicating effective learning on the training set. However, the validation loss oscillates noticeably, which is a strong indicator of potential overfitting. This suggests that while the model learns well from the training data, it memorizes patterns rather than generalizing them, limiting its effectiveness when exposed to new, unseen samples.
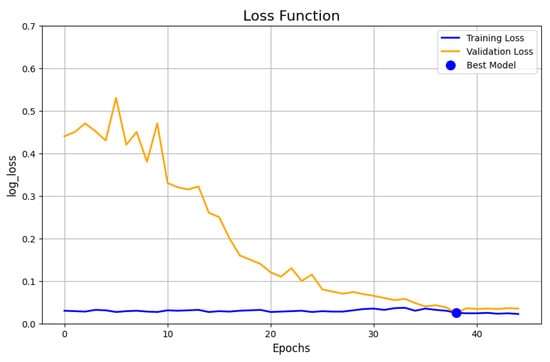
Figure 8.
Loss evolution of the UNet model using the SGD optimizer.
These findings highlight the critical need for further hyperparameter tuning, regularization strategies, or alternative optimization approaches to enhance the model’s robustness and generalization capabilities.
In the validation phase, the Jaccard metric increases with the number of epochs, indicating a high similarity between the input and output images. Figure 9 illustrates an example of UNet SGD results on spheroid images.
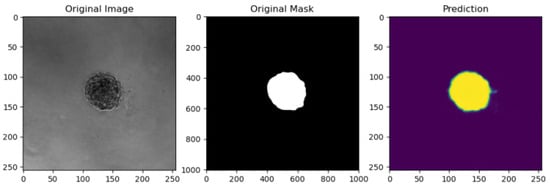
Figure 9.
UNet with SGD results on a spheroid image.
5.4. Performance of the DeeplabV3+ Model
As is well known, the learning rate controls the speed at which a model learns. A very large learning rate can cause the model to diverge and become unstable, while a very small learning rate may hinder proper learning by slowing down convergence. Deep learning models, such as DeepLabV3+, are particularly sensitive to hyperparameter variations, and even small adjustments in parameters like the learning rate can lead to significant changes in performance. Figure 10 illustrates the evolution of the loss metric for DeepLabV3+ in response to learning rate tuning. While a learning rate of is typically considered optimal, our findings show that the smallest loss is achieved with a learning rate of 0.1. However, this value is too large to be appropriate, as it risks causing instability in the model’s learning process. Initially, the learning rate remains constant (from to ), but it begins to fluctuate significantly after this period. This pattern, with an initial phase of stability followed by fluctuations, may suggest a shift in the model’s optimization dynamics during training. Further investigation is required to understand the specific factors driving this shift and its implications for the learning process.
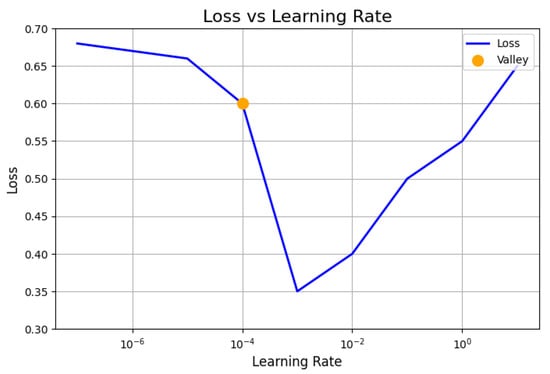
Figure 10.
Evolution of the loss metric values based on tuning the learning rate for the DeeplabV3+ model.
It is well established that increasing the number of epochs allows the model to learn more effectively, with its weights progressively adjusting to the underlying data structure. However, an excessive number of epochs can lead to overfitting, where the model becomes overly specialized to the training data. Figure 11 illustrates the evolution of the loss across epochs during both the training and validation phases for the DeeplabV3+ model. After six epochs, the validation loss begins to fluctuate, suggesting some instability, although the model still achieves an impressive accuracy of 95.91%. While the training loss steadily decreases, eventually reaching a minimum around 0.1, the fluctuating validation loss indicates the onset of potential overfitting. This suggests that the model may be memorizing the training data too well, impairing its ability to generalize to unseen data. of
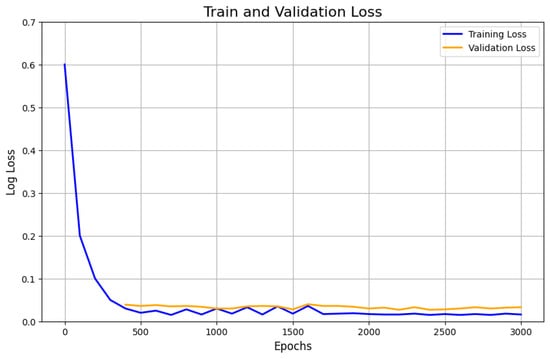
Figure 11.
Performances of the model DeeplabV3+ in terms of the log-loss metric by the number of epochs.
5.5. Performance of the HRNet Model
In contrast to DeepLabV3+, the HRNet model shows a decreasing training loss as the learning rate increases, reaching a minimum around . However, the validation loss increases over time, indicating potential instability in the model during the validation phase.
This increasing validation loss suggests that the model may be overfitting to the training data. Despite this, the Jaccard coefficient and Dice metrics improve as their values decrease, reflecting better segmentation performance. Additionally, for the tumor segmentation metric, accuracy steadily improves from the first to the final epoch, indicating that the model becomes more adept at capturing tumor features.
5.6. Comparison of Model Performance on Various Metrics
This subsection presents a comparison of the performance of different neural network models across various evaluation metrics.
Table 2 summarizes the results obtained from five implemented models, including HRNet, DeeplabV3+, and three variants of UNet utilizing different optimizers. The results reveal notable differences in performance among the models. HRNet and DeeplabV3+ demonstrate superior performance, achieving the lowest validation loss and highest accuracy scores. Specifically, HRNet achieves a validation loss of 0.0199 and an accuracy of 0.9972, while DeeplabV3+ achieves a validation loss of 0.0242 and an accuracy of 0.9972. Additionally, HRNet outperforms other models in terms of yjr Dice coefficient (0.9670) and yjr Jaccard coefficient (0.9362), while DeeplabV3+ achieves competitive scores (Dice: 0.9645, Jaccard: 0.9314). In contrast, the UNet models, regardless of the optimizer used (Adam, Adagard, SGD), exhibit higher validation loss and lower segmentation metrics compared to HRNet and DeeplabV3+. Despite parameter tuning, UNet models struggle to achieve comparable performance, indicating limitations in their architecture for tumor spheroid segmentation tasks.
Table 2.
Comparison of model performance on various metrics (in percentages).
These findings underscore the effectiveness of HRNet and DeeplabV3+ as neural network models for image segmentation, particularly in accurately segmenting tumor spheroids. The choice of optimizer also plays a significant role in model performance, with further investigation needed to optimize UNet models for improved segmentation accuracy. Therefore, selecting the appropriate neural network model and optimizer is crucial for achieving accurate tumor spheroid segmentation in medical imaging applications. HRNet and DeeplabV3+ emerge as top contenders, while further research is warranted to enhance the performance of UNet models for this task.
5.7. Independent Holdout Test Evaluation
To enhance the evaluation of the models and ensure robust generalizability, the experimental protocol was also evaluated and tested on independent holdout test sets. Initially, the focus was on training and validation performance due to dataset size constraints. However, evaluating model performance on unseen data is critical for assessing their generalization capabilities. In the updated setup, the dataset was partitioned into three subsets:
- Training set (60% of the data): Used for model optimization during training.
- Validation set (20% of the data): Used for hyperparameter tuning and monitoring model performance during training.
- Test set (20% of the data): Reserved exclusively for final model evaluation on unseen data.
The models were retrained with this updated data split, and their performance was evaluated on the independent test set. Table 3 summarizes the results. The results indicate that both HRNet and DeepLabV3+ maintain their high performance on the independent test set, demonstrating their robust generalization capabilities. HRNet achieves the best overall performance, with a test accuracy of 99.54%, a Dice coefficient of 0.9608, and a Jaccard coefficient of 0.9267. DeepLabV3+ closely follows, with a test accuracy of 99.43%, a Dice coefficient of 0.9562, and a Jaccard coefficient of 0.9173. In contrast, the U-Net models show comparatively lower performance on the test set, particularly when using the Adam optimizer. This highlights the sensitivity of U-Net to hyperparameter choices and the potential for overfitting in smaller datasets.
Table 3.
Performance of models on an independent holdout test set.
5.8. Addressing Overfitting Through Data Augmentation and Regularization
Overfitting, a phenomenon where a model learns to perform exceedingly well on the training data but struggles to generalize to new data, was observed during the initial phases of model training, particularly for U-Net with the Adam optimizer. To combat this, we implemented several data augmentation strategies and regularization techniques.
Data Augmentation: To artificially increase the diversity of the training data, we applied random rotations (up to ±30°), horizontal and vertical flips, intensity scaling (±20%), and the addition of Gaussian noise. These augmentations simulate the variability inherent in real-world imaging conditions, enabling the model to generalize better across different datasets. For instance, introducing Gaussian noise and intensity scaling mimics varying imaging conditions, while flipping ensures invariance to orientation differences.
Regularization Techniques: In parallel, we applied dropout with a rate of 0.5 in the penultimate layers of the networks to prevent over-reliance on specific neurons. Additionally, weight decay (L2 regularization) with a factor of was introduced to penalize large weights, encouraging the network to maintain simpler models.
Impact on Performance: The introduction of these techniques led to significant improvements. For U-Net, the validation Dice coefficient increased from 0.8255 to 0.8537, while the Jaccard coefficient improved from 0.7048 to 0.7321. The HRNet and DeepLabV3+ models also benefited from these enhancements, with their performance metrics demonstrating greater consistency across training and validation datasets. Furthermore, training losses exhibited smoother convergence patterns, and validation losses showed reduced fluctuations, indicating improved generalization.
5.9. Dataset Limitations and Diversity Considerations
The dataset used in this study consists of 621 images of 3D spheroids, which were segmented and annotated for training and evaluation purposes. While this dataset provides a representative sample of spheroids with varying sizes, shapes, and structural properties, we acknowledge that its size may be insufficient to fully capture the diverse imaging conditions and biological variances encountered in practical applications.
Diversity of Imaging Conditions: To enhance the dataset’s applicability, we ensured that the images included were captured under varying lighting conditions, focal planes, and resolutions. This diversity aimed to mimic real-world imaging variability, such as differences in microscopy setups and sample preparations. However, we recognize that a larger dataset encompassing a broader spectrum of conditions, such as varying cell types, media compositions, and imaging modalities, would further strengthen the generalizability of the models.
Mitigation Strategies: To address the limited dataset size, we implemented data augmentation techniques such as random rotations, flips, intensity scaling, and noise addition. These augmentations effectively increased the diversity of the training data, reducing the risk of overfitting. Additionally, transfer learning was utilized by initializing model weights with pre-trained parameters from larger datasets, thereby leveraging prior knowledge to improve performance and robustness.
5.10. Evaluation Metrics and Their Relevance to Biomedical Segmentation
In this study, we utilized standard metrics such as the Dice coefficient, Intersection over Union (IoU), accuracy, and loss to evaluate the segmentation performance of our models. These metrics provide a robust overall assessment of segmentation quality and have been widely adopted in image analysis tasks. However, we acknowledge that they may not fully capture the specific requirements of biomedical segmentation, particularly in scenarios where edge precision and cell boundary accuracy are critical for accurate analysis.
Limitations of Standard Metrics: While the Dice coefficient and IoU effectively measure overlap between predicted and ground truth masks, they are less sensitive to errors along the edges of segmented objects. This limitation can lead to an incomplete assessment of models, particularly in tasks like spheroid segmentation, where the accurate delineation of boundaries is essential for downstream analyses such as morphology quantification or cell behavior modeling.
Implications for Spheroid Segmentation: Incorporating edge-specific metrics would allow for a more comprehensive evaluation of segmentation models, particularly in tasks involving irregular or overlapping spheroids. This would ensure that the models not only segment objects accurately but also preserve critical boundary details necessary for biomedical applications.
6. Conclusions
This study evaluates three neural network architectures—U-Net, HRNet, and DeepLabV3+—for 3D spheroid segmentation on a comprehensive Tumour Spheroid dataset. HRNet and DeepLabV3+ emerged as top performers, with HRNet achieving a validation accuracy of 99.72%, a Dice coefficient of 0.9670, and a Jaccard coefficient of 0.9362, surpassing U-Net across all metrics. While U-Net is commonly used in medical imaging, it struggled to match the performance of the other two models. The study also explored the impact of different optimizers, finding that the Adam optimizer, although promising, often led to overfitting, particularly in U-Net models. SGD and Adagrad offered some improvement but did not match HRNet and DeepLabV3+, highlighting the importance of selecting the right model and optimizer for optimal segmentation.
However, this work also has limitations. The main constraint lies in the availability of annotated training data, which remains a significant challenge for the segmentation of 3D spheroids. The models in this study may still be prone to overfitting due to the limited size of the dataset, particularly in U-Net’s case. Additionally, while the models were evaluated across various metrics, further experimentation with more complex hyperparameter tuning and additional datasets is necessary to fully explore the potential of these architectures in different biomedical imaging scenarios.
In addition, as neural network models grow in complexity, understanding their decision-making processes becomes increasingly critical, particularly in medical applications where interpretability impacts trust and usability. Incorporating explainability methods such as Grad-CAM and SHAP in future studies could provide valuable insights into the model’s behavior and decision logic. These methods would ensure greater transparency and enable clinicians to validate segmentation results more effectively.
To expand the scope of this research, we recommend expanding the dataset in future work to include additional imaging conditions and biological variances, such as different cell types and treatment conditions. Collaborations with other research groups to compile larger datasets or utilizing publicly available datasets could help achieve this goal. Such efforts would facilitate the development of models that are better suited for clinical and research applications, ensuring greater reliability across diverse settings.
Moreover, while this study focused on U-Net, HRNet, and DeepLabV3+, emerging transformer-based architectures, such as Swin Transformer and SegFormer, present promising alternatives for biomedical image segmentation. These models leverage attention mechanisms to capture both local and global features more effectively, which could lead to enhanced performance in tasks like 3D spheroid segmentation. Integrating these architectures into our evaluation framework could provide deeper insights into their suitability and trade-offs compared to the models analyzed here. Furthermore, exploring hybrid architectures that combine the strengths of convolutional and transformer-based approaches may yield innovative solutions. By addressing these avenues, future research can push the boundaries of segmentation accuracy and adaptability in diverse biomedical imaging scenarios.
Author Contributions
Conceptualization, F.O., A.B.-J. and Y.H.; methodology, A.B.-J. and H.G.; software, H.G.; validation, F.O., S.M.D., Y.H. and W.M.; formal analysis, Y.H., A.B.-J., S.A. and W.M.; investigation, H.G., S.M.D. and S.M.; resources, S.M.; data curation, F.O.; writing—original draft preparation, F.O. and A.B.-J.; writing—review and editing, H.G., Y.H., S.M., S.A. and W.M.; visualization, Y.H. and S.A.; supervision, Y.H. and W.M.; project administration, H.G., Y.H., S.M.D., S.A. and S.M.; funding acquisition, Y.H. and W.M. All authors have read and agreed to the published version of the manuscript.
Funding
This work was supported by the Ministry of Higher Education, Scientific Research and Innovation, the Digital Development Agency (DDA), and the National Center for Scientific and Technical Research (CNRST) under Project ALKHAWARIZMI/2020/19.
Institutional Review Board Statement
Not applicable.
Data Availability Statement
Data will be shared upon request.
Conflicts of Interest
The funders had no role in the design of the study; in the collection, analyses, or interpretation of data; in the writing of the manuscript; or in the decision to publish the results.
References
- Lee, S.Y.; Koo, I.S.; Hwang, H.J.; Lee, D.W. In Vitro three-dimensional (3D) cell culture tools for spheroid and organoid models. SLAS Discov. 2023, 28, 119–137. [Google Scholar] [CrossRef]
- Nguyen, T.H.; Ngo, T.K.N.; Vu, M.A.; Tu, T.Y. Blurry-Consistency Segmentation Framework with Selective Stacking on Differential Interference Contrast 3D Breast Cancer Spheroid. In Proceedings of the IEEE/CVF Conference on Computer Vision and Pattern Recognition, Seattle, WA, USA, 16–22 June 2024; pp. 5223–5230. [Google Scholar]
- Yun, C.; Kim, S.H.; Kim, K.M.; Yang, M.H.; Byun, M.R.; Kim, J.H.; Kwon, D.; Pham, H.T.; Kim, H.S.; Kim, J.H.; et al. Advantages of Using 3D Spheroid Culture Systems in Toxicological and Pharmacological Assessment for Osteogenesis Research. Int. J. Mol. Sci. 2024, 25, 2512. [Google Scholar] [CrossRef]
- Arora, S.; Singh, S.; Mittal, A.; Desai, N.; Khatri, D.K.; Gugulothu, D.; Lather, V.; Pandita, D.; Vora, L. Spheroids in cancer research: Recent advances and opportunities. J. Drug Deliv. Sci. Technol. 2024, 100, 106033. [Google Scholar] [CrossRef]
- Jadhav, S.; Rath, S.N.; Roopavath, U.K. A Review on Multicellular Spheroids and Organoids for Breast Cancer Diagnosis and Therapy. Biomed. Mater. Devices 2024, 1–23. [Google Scholar] [CrossRef]
- Feng, L.; Pan, R.; Ning, K.; Sun, W.; Chen, Y.; Xie, Y.; Wang, M.; Li, Y.; Yu, L. The impact of 3D tumor spheroid maturity on cell migration and invasion dynamics. Biochem. Eng. J. 2025, 213, 109567. [Google Scholar] [CrossRef]
- Ascione, F.; Ferraro, R.; Dogra, P.; Cristini, V.; Guido, S.; Caserta, S. Gradient-induced instability in tumour spheroids unveils the impact of microenvironmental nutrient changes. Sci. Rep. 2024, 14, 20837. [Google Scholar] [CrossRef]
- Zhu, Y.; Kang, E.; Wilson, M.; Basso, T.; Chen, E.; Yu, Y.; Li, Y.R. 3D tumor spheroid and organoid to model tumor microenvironment for cancer immunotherapy. Organoids 2022, 1, 149–167. [Google Scholar] [CrossRef]
- Piccinini, F.; Peirsman, A.; Stellato, M.; Pyun, J.c.; Tumedei, M.M.; Tazzari, M.; De Wever, O.; Tesei, A.; Martinelli, G.; Castellani, G. Deep learning-based tool for morphotypic analysis of 3D multicellular spheroids. J. Mech. Med. Biol. 2023, 23, 2340034. [Google Scholar] [CrossRef]
- Li, W.; Zhou, Z.; Zhou, X.; Khoo, B.L.; Gunawan, R.; Chin, Y.R.; Zhang, L.; Yi, C.; Guan, X.; Yang, M. 3D Biomimetic Models to Reconstitute Tumor Microenvironment In Vitro: Spheroids, Organoids, and Tumor-on-a-Chip. Adv. Healthc. Mater. 2023, 12, 2202609. [Google Scholar] [CrossRef]
- Rodrigues, C.N.; Nunes, I.M.; Pereira, M.B.; Oliveira, H.; dos Santos, J.A. From superpixels to foundational models: An overview of unsupervised and generalizable image segmentation. Comput. Graph. 2024, 123, 104014. [Google Scholar] [CrossRef]
- Koval, V.; Zahorodnia, D.; Adamiv, O. An Image Segmentation Method for Obstacle Detection in a Mobile Robot Environment. In Proceedings of the 2019 9th International Conference on Advanced Computer Information Technologies (ACIT), Ceske Budejovice, Czech Republic, 4–7 June 2019; IEEE: Piscataway, NJ, USA, 2019. [Google Scholar] [CrossRef]
- Vasuki, Y.; Holden, E.J.; Kovesi, P.; Micklethwaite, S. An interactive image segmentation method for lithological boundary detection: A rapid mapping tool for geologists. Comput. Geosci. 2017, 100, 27–40. [Google Scholar] [CrossRef]
- Ebert, L.; Dobay, A.; Franckenberg, S.; Thali, M.; Decker, S.; Ford, J. Image segmentation of post-mortem computed tomography data in forensic imaging: Methods and applications. Forensic Imaging 2022, 28, 200483. [Google Scholar] [CrossRef]
- Hoorali, F.; Khosravi, H.; Moradi, B. IRUNet for medical image segmentation. Expert Syst. Appl. 2022, 191, 116399. [Google Scholar] [CrossRef]
- Liu, M. Momentum Contrast Learning for Aerial Image Segmentation and Precision Agriculture Analysis. In Proceedings of the 2022 International Conference on Image Processing, Computer Vision and Machine Learning (ICICML), Xi’an, China, 28–30 October 2022; IEEE: Piscataway, NJ, USA, 2022. [Google Scholar] [CrossRef]
- Kaymak, Ç.; Uçar, A. Semantic Image Segmentation for Autonomous Driving Using Fully Convolutional Networks. In Proceedings of the 2019 International Artificial Intelligence and Data Processing Symposium (IDAP), Malatya, Turkey, 21–22 September 2019; IEEE: Piscataway, NJ, USA, 2019. [Google Scholar] [CrossRef]
- Grexa, I.; Diosdi, A.; Harmati, M.; Kriston, A.; Moshkov, N.; Buzas, K.; Pietiäinen, V.; Koos, K.; Horvath, P. SpheroidPicker for automated 3D cell culture manipulation using deep learning. Sci. Rep. 2021, 11, 14813. [Google Scholar] [CrossRef]
- Habchi, Y.; Himeur, Y.; Kheddar, H.; Boukabou, A.; Atalla, S.; Chouchane, A.; Ouamane, A.; Mansoor, W. Ai in thyroid cancer diagnosis: Techniques, trends, and future directions. Systems 2023, 11, 519. [Google Scholar] [CrossRef]
- Górriz, J.M.; Álvarez-Illán, I.; Álvarez-Marquina, A.; Arco, J.E.; Atzmueller, M.; Ballarini, F.; Barakova, E.; Bologna, G.; Bonomini, P.; Castellanos-Dominguez, G.; et al. Computational approaches to explainable artificial intelligence: Advances in theory, applications and trends. Inf. Fusion 2023, 100, 101945. [Google Scholar] [CrossRef]
- Gupta, M.; Mishra, A. A systematic review of deep learning based image segmentation to detect polyp. Artif. Intell. Rev. 2024, 57, 7. [Google Scholar] [CrossRef]
- Himeur, Y.; Aburaed, N.; Elharrouss, O.; Varlamis, I.; Atalla, S.; Mansoor, W.; Ahmad, H.A. Applications of Knowledge Distillation in Remote Sensing: A Survey. arXiv 2024, arXiv:2409.12111. [Google Scholar] [CrossRef]
- Li, Z.; Zheng, Y.; Shan, D.; Yang, S.; Li, Q.; Wang, B.; Zhang, Y.; Hong, Q.; Shen, D. Scribformer: Transformer makes cnn work better for scribble-based medical image segmentation. IEEE Trans. Med. Imaging 2024, 43, 2254–2265. [Google Scholar] [CrossRef]
- García-Domínguez, M.; Domínguez, C.; Heras, J.; Mata, E.; Pascual, V. Deep style transfer to deal with the domain shift problem on spheroid segmentation. Neurocomputing 2024, 569, 127105. [Google Scholar] [CrossRef]
- Shahbazi, A.S.; Irandoost, F.; Mahdavian, R.; Shojaeilangari, S.; Allahvardi, A.; Naderi-Manesh, H. A multi-stage weakly supervised design for spheroid segmentation to explore mesenchymal stem cell differentiation dynamics. BMC Bioinform. 2025, 26, 20. [Google Scholar] [CrossRef] [PubMed]
- Sampaio Da Silva, C.; Boos, J.A.; Goldowsky, J.; Blache, M.; Schmid, N.; Heinemann, T.; Netsch, C.; Luongo, F.; Boder-Pasche, S.; Weder, G.; et al. High-throughput platform for label-free sorting of 3D spheroids using deep learning. Front. Bioeng. Biotechnol. 2024, 12, 1432737. [Google Scholar] [CrossRef] [PubMed]
- Lacalle, D.; Castro-Abril, H.A.; Randelovic, T.; Domínguez, C.; Heras, J.; Mata, E.; Mata, G.; Méndez, Y.; Pascual, V.; Ochoa, I. SpheroidJ: An Open-Source Set of Tools for Spheroid Segmentation. Comput. Methods Programs Biomed. 2021, 200, 105837. [Google Scholar] [CrossRef] [PubMed]
- Olofsson, K.; Carannante, V.; Takai, M.; Önfelt, B.; Wiklund, M. Single cell organization and cell cycle characterization of DNA stained multicellular tumor spheroids. Sci. Rep. 2021, 11, 17076. [Google Scholar] [CrossRef]
- Cigla, C.; Alatan, A.A. Region-based image segmentation via graph cuts. In Proceedings of the 2008 15th IEEE International Conference on Image Processing, San Diego, CA, USA, 12–15 October 2008; IEEE: Piscataway, NJ, USA, 2008. [Google Scholar] [CrossRef]
- Sharma, M.; Bhattacharya, M. Segmentation of CA3 Hippocampal Region of Rat Brain Cells Images Based on Bio-inspired Clustering Technique. In Proceedings of the 2019 IEEE International Conference on Bioinformatics and Biomedicine (BIBM), San Diego, CA, USA, 18–21 November 2019; IEEE: Piscataway, NJ, USA, 2019. [Google Scholar] [CrossRef]
- Rao, R.V.; Savsani, V.J.; Vakharia, D.P. Teaching–learning-based optimization: A novel method for constrained mechanical design optimization problems. Comput.-Aided Des. 2011, 43, 303–315. [Google Scholar] [CrossRef]
- Hossain, M.D.; Chen, D. A hybrid image segmentation method for building extraction from high-resolution RGB images. ISPRS J. Photogramm. Remote Sens. 2022, 192, 299–314. [Google Scholar] [CrossRef]
- Fallah, F.; Yang, B.; Walter, S.S.; Bamberg, F. Hierarchical Feature-learning Graph-based Segmentation of Fat-Water MR Images. In Proceedings of the 2018 Signal Processing: Algorithms, Architectures, Arrangements, and Applications (SPA), Poznan, Poland, 19–21 September 2018; IEEE: Piscataway, NJ, USA, 2018. [Google Scholar] [CrossRef]
- Luo, D.; Zeng, W.; Chen, J.; Tang, W. Deep Learning for Automatic Image Segmentation in Stomatology and Its Clinical Application. Front. Med. Technol. 2021, 3, 767836. [Google Scholar] [CrossRef]
- Wang, J.; Sun, K.; Cheng, T.; Jiang, B.; Deng, C.; Zhao, Y.; Xiao, B. Deep High-Resolution Representation Learning for Visual Recognition. IEEE Trans. Pattern Anal. Mach. Intell. 2021, 43, 3349–3364. [Google Scholar] [CrossRef]
- Bhandari, A.K.; Singh, V.K.; Kumar, A.; Singh, G.K. Cuckoo search algorithm and wind driven optimization based study of satellite image segmentation for multilevel thresholding using Kapur’s entropy. Expert Syst. Appl. 2014, 41, 3538–3560. [Google Scholar] [CrossRef]
- Baydoun, M.; Al-Alaoui, M.A. Modified edge detection for segmentation. In Proceedings of the 2015 International Symposium on Signals, Circuits and Systems (ISSCS), Iasi, Romania, 9–10 July 2015; IEEE: Piscataway, NJ, USA, 2015. [Google Scholar] [CrossRef]
- Bechar, A.; Elmir, Y.; Himeur, Y.; Medjoudj, R.; Amira, A. Federated and Transfer Learning for Cancer Detection Based on Image Analysis. arXiv 2024, arXiv:2405.20126. [Google Scholar] [CrossRef]
- Bechar, A.; Elmir, Y.; Medjoudj, R.; Himeur, Y.; Amira, A. Transfer Learning for Cancer Detection based on Images Analysis. Procedia Comput. Sci. 2024, 239, 1903–1910. [Google Scholar] [CrossRef]
- Hamza, A.; Lekouaghet, B.; Himeur, Y. Hybrid whale-mud-ring optimization for precise color skin cancer image segmentation. In Proceedings of the 2023 6th International Conference on Signal Processing and Information Security (ICSPIS), Dubai, United Arab Emirates, 8–9 November 2023; IEEE: Piscataway, NJ, USA, 2023; pp. 87–92. [Google Scholar]
- Habchi, Y.; Kheddar, H.; Himeur, Y.; Boukabou, A.; Atalla, S.; Mansoor, W.; Al-Ahmad, H. Deep Transfer Learning for Kidney Cancer Diagnosis. arXiv 2024, arXiv:2408.04318. [Google Scholar]
- Khalifa, M.; Albadawy, M. Artificial Intelligence for Clinical Prediction: Exploring Key Domains and Essential Functions. Comput. Methods Programs Biomed. Update 2024, 5, 100148. [Google Scholar] [CrossRef]
- Wankhede, N.L.; Kale, M.B.; Shukla, M.; Nathiya, D.; Roopashree, R.; Kaur, P.; Goyanka, B.; Rahangdale, S.R.; Taksande, B.G.; Upaganlawar, A.B.; et al. Leveraging AI for the diagnosis and treatment of autism spectrum disorder: Current trends and future prospects. Asian J. Psychiatry 2024, 101, 104241. [Google Scholar] [CrossRef]
- Yaqoob, A.; Verma, N.K.; Aziz, R.M. Optimizing gene selection and cancer classification with hybrid sine cosine and cuckoo search algorithm. J. Med. Syst. 2024, 48, 10. [Google Scholar] [CrossRef]
- Alharbi, F.; Vakanski, A. Machine learning methods for cancer classification using gene expression data: A review. Bioengineering 2023, 10, 173. [Google Scholar] [CrossRef]
- Stephan, P.; Stephan, T.; Kannan, R.; Abraham, A. A hybrid artificial bee colony with whale optimization algorithm for improved breast cancer diagnosis. Neural Comput. Appl. 2021, 33, 13667–13691. [Google Scholar] [CrossRef]
- Thawkar, S.; Sharma, S.; Khanna, M.; kumar Singh, L. Breast cancer prediction using a hybrid method based on butterfly optimization algorithm and ant lion optimizer. Comput. Biol. Med. 2021, 139, 104968. [Google Scholar] [CrossRef]
- Bir-Jmel, A.; Douiri, S.M.; Bernoussi, S.E.; Maafiri, A.; Himeur, Y.; Atalla, S.; Mansoor, W.; Al-Ahmad, H. GFLASSO-LR: Logistic Regression with Generalized Fused LASSO for Gene Selection in High-Dimensional Cancer Classification. Computers 2024, 13, 93. [Google Scholar] [CrossRef]
- Li, J.; Liang, K.; Song, X. Logistic regression with adaptive sparse group lasso penalty and its application in acute leukemia diagnosis. Comput. Biol. Med. 2022, 141, 105154. [Google Scholar] [CrossRef]
- Tian, L.; Li, X.; Zheng, H.; Wang, L.; Qin, Y.; Cai, J. Fisher discriminant model based on LASSO logistic regression for computed tomography imaging diagnosis of pelvic rhabdomyosarcoma in children. Sci. Rep. 2022, 12, 15631. [Google Scholar] [CrossRef]
- Castillo, D.L. Deep-Tumour-Spheroid. GitHub. 2023. Available online: https://github.com/WaterKnight1998/Deep-Tumour-Spheroid (accessed on 21 October 2024).
- Michálek, J.; Štěpka, K.; Kozubek, M.; Navrátilová, J.; Pavlatovská, B.; Machálková, M.; Pruška, A. Quantitative Assessment of Anti-Cancer Drug Efficacy From Coregistered Mass Spectrometry and Fluorescence Microscopy Images of Multicellular Tumor Spheroids. Microsc. Microanal. 2019, 25, 1311–1322. [Google Scholar] [CrossRef]
- Tasnadi, E.A.; Toth, T.; Kovacs, M.; Diosdi, A.; Pampaloni, F.; Molnar, J.; Horvath, P. 3D-Cell-Annotator: An open-source active surface tool for single-cell segmentation in 3D microscopy images. Bioinformatics 2020, 36, 2948–2949. [Google Scholar] [CrossRef]
- Schmitz, A.; Fischer, S.C.; Mattheyer, C.; Pampaloni, F.; Stelzer, E.H.K. Multiscale image analysis reveals structural heterogeneity of the cell microenvironment in homotypic spheroids. Sci. Rep. 2017, 7, 43693. [Google Scholar] [CrossRef]
- Antoni, D.; Burckel, H.; Josset, E.; Noel, G. Three-Dimensional Cell Culture: A Breakthrough in Vivo. Int. J. Mol. Sci. 2015, 16, 5517–5527. [Google Scholar] [CrossRef]
- Barbosa, M.A.G.; Xavier, C.P.R.; Pereira, R.F.; Petrikaitė, V.; Vasconcelos, M.H. 3D Cell Culture Models as Recapitulators of the Tumor Microenvironment for the Screening of Anti-Cancer Drugs. Cancers 2021, 14, 190. [Google Scholar] [CrossRef]
- Wrzesinski, K.; Magnone, M.C.; Visby, H.L.; Kruse, M.E.; Bergauer, T.; Bobadilla, M.; Fey, S.J. HepG2/C3A 3D spheroids exhibit stable physiological functionality for at least 24 days after recovering from trypsinisation. Toxicol. Res. 2013, 2, 163. [Google Scholar] [CrossRef]
- Rousseau, D.; Huaman, R.; Rasti, P.; Riviere, C. Supervised machine learning for 3D light microscopy without manual annotation: Application to spheroids. In Proceedings of the Unconventional Optical Imaging, Strasbourg, France, 22–26 April 2018; SPIE: Bellingham, WA, USA, 2018. [Google Scholar] [CrossRef]
- Vaidyanathan, K.; Wang, C.; Krajnik, A.; Yu, Y.; Choi, M.; Lin, B.; Bae, Y. A machine learning pipeline revealing heterogeneous responses to drug perturbations on vascular smooth muscle cell spheroid morphology and formation. Sci. Rep. 2021, 11, 23285. [Google Scholar] [CrossRef]
- Kecheril Sadanandan, S.; Karlsson, J.; Wahlby, C. Spheroid segmentation using multiscale deep adversarial networks. In Proceedings of the IEEE International Conference on Computer Vision Workshops, Montreal, BC, Canada, 11–17 October 2017; pp. 36–41. [Google Scholar]
- Khoshdeli, M.; Winkelmaier, G.; Parvin, B. Multilayer encoder-decoder network for 3D nuclear segmentation in spheroid models of human mammary epithelial cell lines. In Proceedings of the IEEE Conference on Computer Vision and Pattern Recognition Workshops, Salt Lake City, UT, USA, 18–23 June 2018; pp. 2239–2245. [Google Scholar]
- Souadih, K.; Belaid, A.; Salem, D.B. Automatic segmentation of the sphenoid sinus in CT-scans volume with deepmedics 3D CNN architecture: Array. Med. Technol. J. 2019, 3, 334–346. [Google Scholar] [CrossRef]
- Gupta, A.; Harrison, P.J.; Wiesl, e.H.; Pielawski, N.; Kartasalo, K.; Partel, G.; Wählby, C. Deep Learning in Image Cytometry: A Review. Cytometry Part A 2018, 95, 366–380. [Google Scholar] [CrossRef]
- Wang, L. Deep Learning Techniques to Diagnose Lung Cancer. Cancers 2022, 14, 5569. [Google Scholar] [CrossRef] [PubMed]
- Ahmad, A.; Goodarzi, S.; Frindel, C.; Recher, G.; Riviere, C.; Rousseau, D. Clearing spheroids for 3D fluorescent microscopy: Combining safe and soft chemicals with deep convolutional neural network. Cold Spring Harb. Lab. 2021. [Google Scholar] [CrossRef]
- Chen, Z.; Ma, N.; Sun, X.; Li, Q.; Zeng, Y.; Chen, F.; Gu, Z. Automated evaluation of tumor spheroid behavior in 3D culture using deep learning-based recognition. Biomaterials 2021, 272, 120770. [Google Scholar] [CrossRef] [PubMed]
- Rettenberger, L.; Schilling, M.; Reischl, M. Annotation Efforts in Image Segmentation can be Reduced by Neural Network Bootstrapping. Curr. Dir. Biomed. Eng. 2022, 8, 329–332. [Google Scholar] [CrossRef]
- Wen, C.; Miura, T.; Voleti, V.; Yamaguchi, K.; Tsutsumi, M.; Yamamoto, K.; Kimura, K.D. 3DeeCellTracker, a deep learning-based pipeline for segmenting and tracking cells in 3D time lapse images. eLife 2021, 10, 59187. [Google Scholar] [CrossRef]
- Ronneberger, O.; Fischer, P.; Brox, T. U-Net: Convolutional Networks for Biomedical Image Segmentation. In Proceedings of the Lecture Notes in Computer Science, Washington, DC, USA, 13–17 July 2015; Springer International Publishing: Cham, Switzerland, 2015; pp. 234–241. [Google Scholar] [CrossRef]
- Yang, M.; Yu, K.; Zhang, C.; Li, Z.; Yang, K. DenseASPP for Semantic Segmentation in Street Scenes. In Proceedings of the 2018 IEEE/CVF Conference on Computer Vision and Pattern Recognition, Salt Lake City, UT, USA, 18–23 June 2018; IEEE: Piscataway, NJ, USA, 2018. [Google Scholar] [CrossRef]
- Paszke, A.; Gross, S.; Massa, F.; Lerer, A.; Bradbury, J.; Chanan, G.; Chintala, S. PyTorch: An Imperative Style, High-Performance Deep Learning Library. arXiv 2019. [Google Scholar] [CrossRef]
- Howard, J.; Gugger, S. Fastai: A Layered API for Deep Learning. Information 2020, 11, 108. [Google Scholar] [CrossRef]
Disclaimer/Publisher’s Note: The statements, opinions and data contained in all publications are solely those of the individual author(s) and contributor(s) and not of MDPI and/or the editor(s). MDPI and/or the editor(s) disclaim responsibility for any injury to people or property resulting from any ideas, methods, instructions or products referred to in the content. |
© 2025 by the authors. Licensee MDPI, Basel, Switzerland. This article is an open access article distributed under the terms and conditions of the Creative Commons Attribution (CC BY) license (https://creativecommons.org/licenses/by/4.0/).