Abstract
This paper presents a novel Ripple Evolution Optimizer (REO) that incorporates adaptive and diversified movement—a population-based metaheuristic that turns a coastal-dynamics metaphor into principled search operators. REO augments a JADE-style current-to-p-best/1 core with jDE self-adaptation and three complementary motions: (i) a rank-aware that pulls candidates toward the best, (ii) a time-increasing that aligns agents with an elite mean, and (iii) a scale-aware sinusoidal that lead solutions with a decaying envelope; rare Lévy-flight kicks enable long escapes. A reflection/clamp rule preserves step direction while enforcing bound feasibility. On the CEC2022 single-objective suite (12 functions spanning unimodal, rotated multimodal, hybrid, and composition categories), REO attains 10 wins and 2 ties, never ranking below first among 34 state-of-the-art compared optimizers, with rapid early descent and stable late refinement. Population-size studies reveal predictable robustness gains for larger N. On constrained engineering designs, REO achieves outperforming results on Welded Beam, Spring Design, Three-Bar Truss, Cantilever Stepped Beam, and 10-Bar Planar Truss. Altogether, REO couples adaptive guidance with diversified perturbations in a compact, transparent optimizer that is competitive on rugged benchmarks and transfers effectively to real engineering problems.
1. Introduction
Optimization plays a central role across the sciences, engineering, and management because many real-world decisions involve choosing the best configuration from an immense combinatorial or continuous search space. Problems such as structural design, energy management, parameter tuning in machine learning, and operations scheduling often lead to nonlinear, multimodal, or NP-hard formulations for which deterministic exact algorithms are computationally prohibitive [1]. To circumvent these limitations, researchers have developed a broad class of metaheuristic algorithms that combine stochastic exploration with problem-specific heuristics to efficiently approximate near-optimal solutions. Metaheuristics encompass a diverse family of strategies, including evolutionary algorithms, swarm intelligence, physics-based heuristics, and other population-based approaches, all designed to escape local minima and balance exploration and exploitation in the search space [2,3].
In the past decade, the landscape of metaheuristics has expanded rapidly, spurred by inspiration from natural processes and mathematical analogies. Nature-inspired optimizers model biological or physical phenomena such as the cooperative hunting behavior of animal groups [4], the social dynamics of jackals [5], or the foraging patterns of insects and birds [6,7]. These algorithms exploit analogies with ecosystems and physical laws to design simple update rules and information-sharing mechanisms. For example, the spotted hyena optimizer simulates group hunting to update candidate solutions and avoid premature convergence [4], whereas the golden jackal optimizer mimics the dispersal and prey-detection strategies of golden jackals to enhance diversification [5]. Inspired by natural resource allocation, economic and physical principles have also given rise to supply–demand-based optimizers [8], light spectrum optimizers [9], and tornado optimizers with Coriolis force [10], highlighting the versatility of metaheuristic design.
Another hallmark of contemporary metaheuristic research is the integration of metaheuristics with problem-specific models and hybrid frameworks to tackle complex engineering tasks. For instance, researchers have combined physics-inspired search with neural network architectures to build fault-diagnosis systems for transformers [11] and gas turbines [12]. Swarm-inspired algorithms have been deployed for proton exchange membrane fuel cell flow-field optimization [13], multilevel image segmentation [1], software-defined networking [14], and malware detection in Android systems [15]. These hybrid strategies illustrate how metaheuristics can be customized to exploit domain knowledge while preserving generic search capabilities.
As the number of metaheuristics grows, so does the need for comparative studies and performance analyses. Recent research has proposed numerically efficient variants and multi-objective frameworks aimed at improving convergence speed, robustness, and scalability. Examples include modified backtracking search algorithms informed by species evolution and simulated annealing [16], nomad–migration-inspired algorithms for global optimization [17], and quantum-inspired swarm optimizers [18]. Multi-objective approaches such as the geometric mean optimizer extend the search to Pareto frontiers [19], and advances in regularization and graph filtering have improved metaheuristic-based machine-learning models [20]. Collectively, these developments illustrate the vibrancy of research in metaheuristics and the need for continued innovation.
To address this gap, this paper introduces the ripple evolution optimizer, a novel nature-inspired metaheuristic designed to handle complex and engineering design problems. The new algorithm derives its inspiration from the propagation of ripples on water surfaces, exploiting the nonlinear interactions between neighboring waves to guide candidate solutions. Following a description of the algorithm, we present extensive experimental comparisons on benchmark and engineering design problems to demonstrate the competitiveness of the ripple evolution optimizer. We also discuss the main contributions of the present work.
2. Related Work
Metaheuristics inspired by animal behavior remain a fertile source of algorithmic innovation. The hippopotamus optimization algorithmproposed by Amiri et al. [21] models the social hierarchy and foraging strategies of hippopotamuses to strike a balance between exploration and exploitation, whereas the spotted hyena optimizer by Dhiman and Kumar [4] captures cooperative hunting to search the solution space efficiently. Similar inspirations include the grasshopper optimization algorithm applied to wireless communications networks [22], the Golden Jackal Optimization algorithm for engineering applications [5], and the Humboldt squid optimization algorithm which imitates the collective intelligence of squids [23]. Researchers have also drawn from avian behavior to develop pigeon-inspired and hummingbird-based schemes for structural health monitoring and communication systems [24,25]. These works highlight the trend of designing population-based search rules grounded in zoological observations.
Another line of research develops metaheuristics based on the dynamics of physical and economic systems. Wang et al. [16] introduced a modified backtracking search algorithm that integrates species-evolution principles and simulated annealing to improve convergence in constrained engineering problems. Zhao et al. [8] proposed a supply–demand-based optimization where search agents negotiate and trade resources to achieve equilibrium in the objective landscape. Abdel-Basset et al. [9] formulated a light spectrum optimizer that leverages properties of light wavelengths, while Braik et al. [10] incorporated the Coriolis force into a tornado-inspired algorithm to enhance diversification. Other novel metaphors include the garden balsam algorithm [6], the nomad–migration-inspired algorithm [17], the hunting search heuristic [2], the light spectrum optimizer [9], and the migration search algorithm [26]. Each of these approaches introduces distinct mechanisms for information sharing and reinforcement, illustrating the creative use of analogies from disparate domains.
Hybrid and problem-specific strategies continue to expand the scope of metaheuristics. Tao et al. [11] combined a probabilistic neural network with a bio-inspired optimizer for transformer fault diagnosis, and Hou et al. [12] developed a dynamic recurrent fuzzy neural network trained via a chaotic quantum pigeon-inspired optimizer for gas turbine modelling. In power systems, Kumar et al. [27] devised a nutcracker optimizer for congestion control, while Rathee et al. [28] used a quantum-inspired genetic algorithm to deploy sink nodes in wireless sensor networks. Metaheuristics have also been applied to structural design and fuel cell engineering: Ghanbari et al. [13] optimized bio-inspired flow fields for proton exchange membrane fuel cells, and Nemati et al. [29] employed a banking-system-inspired algorithm for truss size and layout design. Within the realm of image processing, Haddadi et al. [30] restored medical images using an enhanced regularized inverse filtering approach guided by a bio-inspired search, while Bhandari et al. [1] designed a multilevel image thresholding method using nature-inspired algorithms. These examples show how metaheuristics are being integrated into domain-specific models to solve real-world tasks beyond conventional benchmarks.
Many studies focus on tailoring metaheuristics to address multiple objectives and improve numerical efficiency. Pandya et al. [19] proposed a multi-objective geometric mean optimizer that eschews metaphors and uses mathematical transformations to locate Pareto-optimal solutions. Dalla Vedova et al. [10] applied bio-inspired algorithms to prognostics of electromechanical actuators, while Li and Sun [6] introduced a numerical optimization algorithm based on garden balsam biology. Anaraki and Farzin [23] reported the Humboldt squid optimizer, Maroosi and Muniyandi [31] developed a membrane-inspired multiverse optimizer for web service composition, and Panigrahi et al. [15] used nature-inspired optimization with support vector machines to identify malicious Android data. Recent work also explored quantum-inspired swarm algorithms [18], orca predation models [32], and improved graph neural networks with nonconvex norms inspired by unified optimization frameworks [20]. The diversity of applications—from scheduling and communication networks to health monitoring and machine learning—demonstrates the versatility of metaheuristics when adapted with suitable objective functions and constraints.
Several comparative studies provide insights into the relative strengths of different algorithms and offer guidelines for metaheuristic design. Attaran et al. [33] introduced an evolutionary algorithm inspired by hunter spiders and compared its performance against established heuristics. Bhandari et al. [1] evaluated nature-inspired optimizers for color image segmentation, while Sivakumar and Kanagasabapathy [34] benchmarked multiple bio-inspired algorithms for cantilever beam parameter optimization. Chiang et al. [14] combined artificial bee colony algorithms with support vector machines for software-defined networking, and Chou and Truong [7] proposed a jellyfish-inspired optimizer and showed its competitiveness on benchmark functions. In structural engineering, Zhou et al. [35] examined bamboo-inspired multi-cell structures optimized by particle swarm algorithms, while Janizadeh et al. [36] used three novel optimizers to tune LightGBM models for wildfire susceptibility prediction. These studies reveal that no single algorithm universally outperforms others; rather, the effectiveness of a metaheuristic depends on the problem domain, search landscape, and parameter settings.
Overall, the literature demonstrates a vigorous pursuit of novel metaphors and hybrid architectures to enhance the capability of metaheuristics. Despite the proliferation of algorithms, challenges remain in balancing exploration and exploitation, avoiding premature convergence, and ensuring robustness across diverse problems. The proposed ripple evolution optimizer contributes to this ongoing evolution by introducing new interaction dynamics based on ripple propagation, aiming to deliver competitive performance on complex and engineering optimization tasks.
3. Ripple Evolution Optimizer: A Novel Nature-Inspired Metaheuristic
3.1. Inspiration from Nature (Ocean Ripples, Tides, and Undertow)
The three core inspirations in REO are: concentric ripples traveling across the sea surface, a tide that gradually pulls the water mass in a consistent direction, and an undertow that draws material back toward the sea after waves break on the shore. We use these notions to encode stochastic (ripples), time-aware (tides), and rank-aware (undertow) forces on each search agent.
3.1.1. Ripple Superposition
We model ripples as sinusoidal, decaying perturbations that encourage agents to probe along multiple directions, analogous to overlapping wavefronts. This intuition is later stated analytically in Equation (7). The visual metaphor is shown in Figure 1, where circular wavefronts fade in thickness and opacity with radius to depict amplitude decay Equation (6) and directional probing.
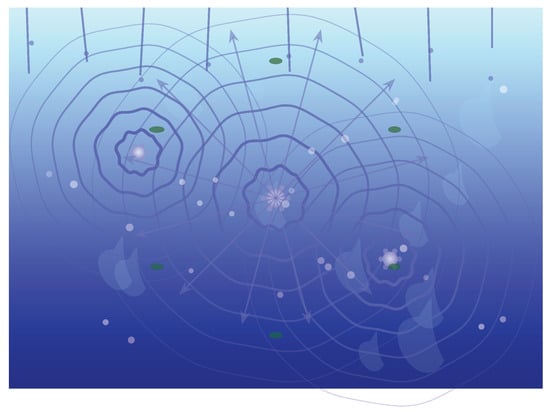
Figure 1.
Ripple superposition. Rain creates multiple overlapping ripples that decay with distance. Energy radiates outward in all directions, with debris particles showing the multi-directional flow patterns.
3.1.2. Tide and Undertow
The tide makes exploitation gradually stronger (Equation (5)), while the undertow rewards high-quality agents with a stronger pull toward the global best (Equation (4)). Together, they bias movement without removing diversity. Figure 2 renders the ocean/shore interface with a slow rightward tide arrow (growing with time ) and a leftward near-shore undertow arrow (stronger for better-ranked agents).
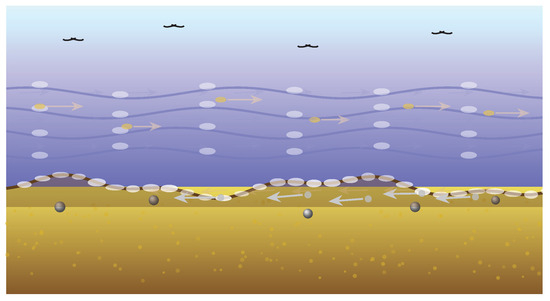
Figure 2.
Tide and undertow dynamics. Surface debris and birds move with the incoming tide (rightward), while sediment near the beach is pulled back by undertow (leftward). Wave angle and particle trajectories reveal the dual flow system.
3.1.3. Elite Crest
The top-performing agents form a crest whose mean (Equation (10)) provides a stable, multi-point guide, mitigating premature convergence to a single attractor. Figure 3 marks the elite agents in green, the best with a star, and overlays the crest mean as a highlighted marker.
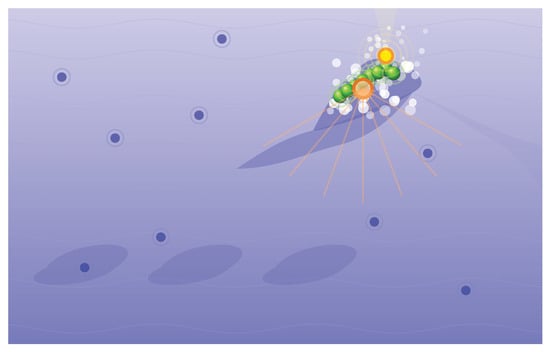
Figure 3.
Elite crest formation. Energy concentrates at the breaking wave peak where elite agents (green spheres) cluster. The brightest point marks the global best, while the orange center represents the stable crest mean. Spray and turbulence show the dynamic convergence.
For interference between multiple ripple sources, Figure 4 adds a second source and a global swell (sinusoid), reflecting the superposition implied by Equation (7) and the multiple guides in Equation (11).
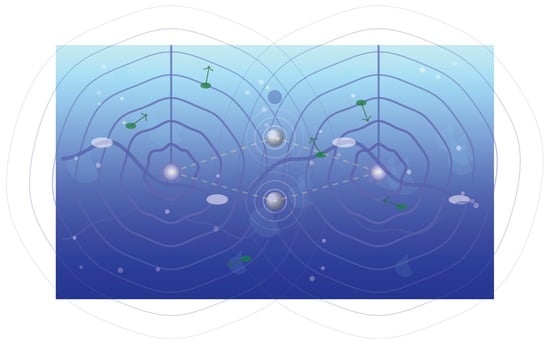
Figure 4.
Wave interference and superposition. Two raindrop sources create overlapping ripple patterns that interfere constructively (bright zones) and destructively (calm zones).
3.2. Mathematical Model
We formalize REO on a bounded domain with population size N and iteration budget T. Let and be agent i at iteration t.
3.3. Initialization and Fitness
3.4. Rank- and Time-Aware Pulls
3.5. Ripple (Swell) and Amplitude Decay
3.6. Self-Adaptive Parameters (jDE)
3.7. Elite Crest and Mutant Construction
Let the top-k agents () constitute the crest. We use the mean of the top-m () for stability, defined in Equation (10):
Combine Equations (4)–(7) with a JADE-like current-to-p-best/1 [38]. The mutant vector is defined by Equation (11), where indexes a random member of the crest, are random indices, and is the global best:
3.8. Crossover, Lévy Drift, and Selection
Binomial crossover forms the trial vector per dimension j as in Equation (12) (with a forced dimension ):
With probability in Equation (13), we apply a Lévy-flight kick [39,40] as in Equation (14), using Mantegna’s recipe Equations (15) and (16) with stability and scale :
We use reflection for boundary handling [41], dimension-wise as in Equation (17) (applied twice for long jumps):
Finally, greedy selection in Equation (18) ensures non-worsening replacement:
3.9. High-Level Pseudocode
Algorithm 1 shows the high-level pseudocode.
| Algorithm 1 REO: Ripple Evolution with adaptive and diversified movement |
|
3.10. Movement Strategy
REO update decomposes into five forces: (i) current-to-p-best/1 (first two terms of Equation (11)), (ii) undertow to the global best (Equation (4)), (iii) tide toward the crest mean (Equations (5) and (10)), and (iv) sinusoidal swell (Equation (7)). Their vector superposition is the mutant step in Equation (11). Figure 5 illustrates these components as arrows from the current agent.
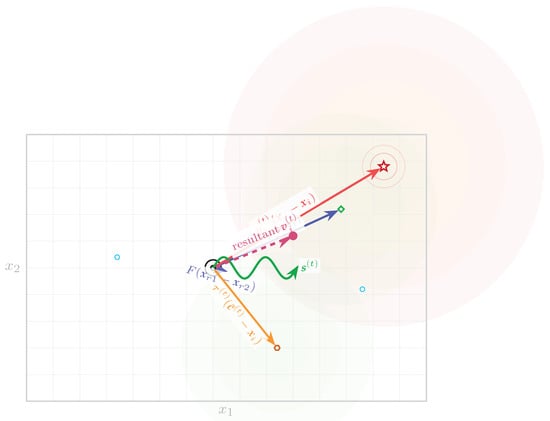
Figure 5.
Vector decomposition of movement strategy. Current agent position experiences five force components that combine to form the mutant vector . Contour-like regions indicate fitness landscape structure.
3.11. Exploration and Exploitation Behavior
REO balances exploration and exploitation via (Equation (6)) amplitude decay, the drift probability in Equation (13), and growing tide Equation (5). Early iterations have larger , higher , and weaker tide, yielding long-range, multi-directional search; late iterations invert these proportions. We depict the progression in two separate figures: Figure 6 (early) and Figure 7 (late).
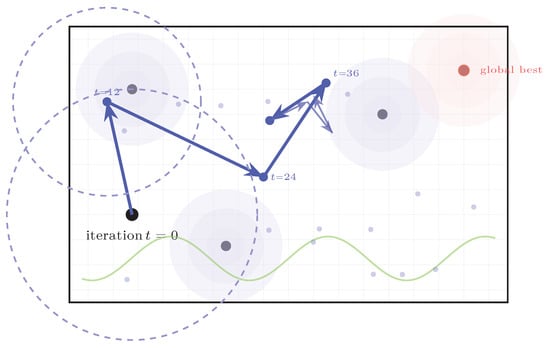
Figure 6.
Early exploration phase. Large-amplitude movements with frequent long-range jumps (Lévy flights) enable the discovery of diverse regions. Dashed circles indicate exploration radii. Multiple evaluations (small dots) span the search space.
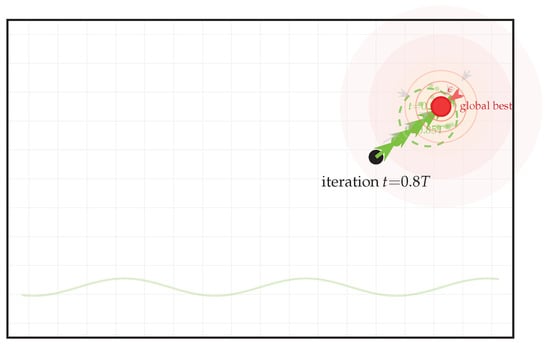
Figure 7.
Late exploitation phase, steps with decreasing amplitude converge precisely toward the global optimum. The gradient field (gray arrows) and tight evaluation cluster (small dots) indicate focused local search. Distance to optimum decreases rapidly.
3.12. Ripple Evolution Optimizer (REO) Novelty
The metaphor of ripples serves only as an intuitive analogy; the novelty of REO lies in three explicit operators and their interaction schedules, which collectively generate a two-anchor vector field atop a Differential Evolution (DE) backbone. As formalized in Equation (11), REO’s mutation decomposes the step for agent i at iteration t as follows:
3.12.1. Rank-Aware Undertow
The first unique operator is the rank-aware undertow , which scales the exploitation pressure according to each agent’s fitness rank. As defined in Equations (3) and (4), the undertow coefficient ensures that high-quality agents are pulled more strongly toward the global best, while low-quality ones retain more freedom to explore. Unlike the scalar selection pressure in Genetic Algorithms (GA) or the uniform global attraction in Particle Swarm Optimization (PSO), REO’s undertow operates as a vector field that modulates both direction and magnitude per agent and per coordinate.
3.12.2. Time-Growing Tide Toward Elite Mean
The second mechanism is the tide, a time-dependent attraction toward the mean of the top-m individuals (the “crest’’). As shown in Equations (5)–(10), the term grows linearly with time t. This creates a second attractor that represents collective elite knowledge, contrasting with DE’s reliance on a single sampled p-best or PSO’s dual global/local anchors. By incorporating two simultaneous attractors—the global best and the elite mean—REO mitigates premature convergence and stabilizes the search trajectory.
3.12.3. Zero-Mean Range-Scaled Swell
The third operator is the swell term , a zero-mean sinusoidal perturbation whose amplitude decays geometrically as . Defined in Equations (6) and (7), it introduces structured, range-scaled oscillations with random phase, providing controlled exploration early in the run while vanishing as convergence progresses. Unlike the constant stochastic variation in GA, PSO, or DE, REO’s swell adds a deterministic, frequency-controlled component that improves early coverage of the search space without destabilizing exploitation.
3.12.4. Complementary Schedules and Two-Anchor Dynamics
Each operator follows a complementary schedule: the undertow increases with solution quality, the tide increases with iteration count, the swell amplitude decreases with time, and Lévy kicks are applied only early in the search. These opposing schedules define a consistent exploration–exploitation trajectory: broad exploration in early iterations followed by controlled exploitation near convergence. The combined “two-anchor’’ behavior—bias toward both and —is absent in GA, PSO, and classical DE.
3.12.5. Analytical Expectation of the Search Bias
Taking expectations over random terms in Equation (19), and using and , the mean step simplifies to:
This demonstrates that exploration arises from the variance of the random terms (differential mutation, swell, and Lévy drift), while exploitation is driven by two biased forces toward distinct anchors. Hence, REO’s exploration/exploitation balance is structurally different from GA, DE, and PSO.
3.13. Standard-Terms Presentation and Comparative Analysis with DE and PSO
This subsection presents REO strictly in standard optimization terms (populations, candidate solutions, and move operators), and compares its update rule side by side with well-established algorithms. We avoid metaphorical phrasing and focus on functional operators, schedules, and resulting biases/variances.
3.13.1. Notation and Baseline Updates
Let denote the position of individual i at iteration t; is the best individual, and is the mean of the top-m elites. The JADE-style DE mutant and PSO updates are:
JADE (Current-to-p-best/1) [38]
PSO (Global Best Variant)
- Here is the personal best, is inertia, are cognitive/social coefficients, and are i.i.d. uniform vectors.
3.13.2. REO Update in Standard Terms
REO is inspired by the JADE core with two bias terms and one structured, scheduled perturbation:
3.13.3. REO Mechanism in Comparison to PSO or JADE
REO’s operator in comparison to PSO or JADE:
(i) No velocity state: REO does not maintain a state or inertia (Equations (22) and (23)); it is a direct position update with DE-style crossover and greedy selection. (ii) Anchors: PSO uses (personal best) and ; REO uses and (elite mean), a multi-point anchor not present in PSO. (iii) Scheduling: REO’s undertow depends on rank (quality) and its tide grows with time; PSO’s attraction coefficients are static (or annealed but not rank-conditioned). (iv) Structured perturbation: REO’s is range-scaled, zero-mean, sinusoidal with decaying amplitude, unlike PSO’s stochastic terms, which enter as multiplicative random scalars of point-to-point differences and velocity memory.
REO In comparison with JADE (or classic DE: (i) Two anchors vs one: JADE’s step uses a single sampled p-best (Equation (21)). REO adds rank-aware pull to and a time-growing pull to , producing a two-anchor bias not expressible as with any scalar F. (ii) Rank/time coupling: depends on rank; depends on time; these cannot be absorbed into a constant or jDE-updated without changing the anchor point(s) and introducing quality conditioning. (iii) Swell: adds a zero-mean, span-aware, scheduled oscillation that is not part of DE’s differential term and cannot be re-parameterized as .
3.13.4. REO Operator Mapping with Standard Terms
Table 1 summarizes the Operator-level comparison in standard terms of metaheuristic field.

Table 1.
Operator-level comparison in standard terms.
3.14. Rationale for Component Design and Expected Advantages
While REO follows a standard population-based optimizer structure—initialization, variation, evaluation, and selection—each of its components is deliberately constructed to address known weaknesses of existing metaheuristics. This subsection explains the individual purpose of each operator and why their combination is expected to outperform other optimizers on specific classes of problems.
3.14.1. Initialization and Diversity Preservation
The population is initialized uniformly over the search domain to ensure unbiased coverage and maximal entropy at iteration 0. Because REO introduces no velocity state or historical memory, the diversity of the initial sampling directly affects global exploration. The subsequent swell term (Equation (7)) maintains controlled diversity through range-scaled oscillations even after several generations, preventing early clustering that often limits PSO or GA in high dimensions.
3.14.2. Differential and Rank-Conditioned Exploitation
The DE core (Equation (11)) provides efficient local search through difference vectors between randomly chosen agents. To enhance convergence stability, REO augments this with a rank-aware undertow that adaptively scales exploitation intensity: high-ranking individuals are drawn strongly toward the global best, while lower-ranking ones explore more widely. This selective pressure accelerates convergence on unimodal landscapes and maintains exploration on multimodal ones.
3.14.3. Time-Dependent Collective Guidance
The tide component increases over time, guiding all agents toward the elite mean once the population begins to converge. This collective attractor mitigates oscillations around the best solution—a common issue in PSO—and allows cooperative exploitation of multiple promising regions. On composite functions or constrained engineering designs where multiple local minima exist, this term stabilizes the search trajectory and ensures steady improvement.
3.14.4. Structured Exploration via the Swell
The swell term injects sinusoidal, range-scaled perturbations with a geometrically decaying amplitude. Its early large amplitude promotes long-range exploration akin to Lévy flights but in a deterministic and bounded manner; its late small amplitude supports fine-grained local refinement. Empirically, this yields faster initial descent than DE and smoother final convergence than PSO.
3.14.5. Complementary Scheduling of Operators
The three dynamic coefficients— (rank-based), (time-based), and (amplitude decay)—are complementary:
- early iterations: large , small ⇒ exploration dominant;
- mid-phase: balanced undertow and tide ⇒ exploration–exploitation equilibrium;
- late iterations: small , large ⇒ refined exploitation.
This predictable scheduling produces the rapid early progress and stable late convergence observed in CEC2022 experiments.
3.14.6. Theoretical Analysis of the Outperforming Performance
REO’s integration of a two-anchor bias (best and elite mean), rank-dependent adaptation, and structured perturbation provides an adaptive exploration–exploitation trajectory absent in GA, DE, and PSO. GA’s stochastic mutation can lose gradient direction; PSO’s global–local duality can oscillate; DE’s fixed differential scale can stagnate near optima. REO’s coordinated design offers:
- faster descent on smooth unimodal functions due to rank-aware undertow;
- improved robustness on rotated multimodal and hybrid functions through oscillatory exploration;
- superior consistency on constrained engineering problems via the tide’s collective stabilization.
Hence, although REO conforms to the generic population-based template, its operator coupling and scheduling yield demonstrable advantages for landscapes where both global coverage and precise final refinement are required.
3.15. Computational Cost
Operation Counts per Iteration
Let N be the population size, d the dimensionality, and T the iteration budget. Denote by the time to evaluate the objective once on a single agent. One iteration of REO (Section 1) performs: (i) a population sort (to obtain the best and the elite set), (ii) N objective evaluations, and (iii) vector operations for variation, recombination, and bound handling. Using -notation,
Hence the per-iteration and total costs are
Space usage is linear in the population:
Cheap Objectives (Closed-Form Mathematical Relations)
When f is a deterministic, closed-form mapping with low arithmetic cost, or , the iteration time is dominated by . In this regime, two engineering choices keep overhead small: (i) partial selection instead of full sorting. REO only needs the global best and the top-m agents to compute the elite mean; replacing a full sort by an m-element heap or nth_element yields
which tightens (26) to for cheap f; and (ii) vectorization. The variation and crossover steps are BLAS-1/2 style and run efficiently in SIMD/GPU, making bandwidth-bound in practice. Empirically, for common analytic benchmarks, the wall-clock is then driven by memory traffic rather than transcendental calls (e.g., sin in the perturbation), and REO scales near-linearly with N.
Expensive Objectives (Simulators, Black-Box Models, or API Calls)
When dominates, (26) reduces to , and the wall-clock is controlled by how evaluations are dispatched. Let P be the number of parallel workers (threads/processes/remote slots). Under synchronous batches,
where m is the elite set size used by REO. For remote services (APIs), decompose the evaluation time per agent as
with network latency , service processing time , and client-side serialization/parsing . If the platform imposes a rate limit (requests/sec) and a maximum concurrency , the effective parallelism is , and the sustainable throughput is bounded by . In this case, REO behaves like a standard population-based optimizer whose wall-clock is dominated by external I/O; the algorithmic overhead (selection and vector ops) is negligible.
Asynchronous and Batched Execution
To reduce idle time when varies across agents (e.g., heterogeneous API latencies), an asynchronous variant evaluates agents as workers become free and updates the elite set on arrival; in practice, this preserves REO’s behavior while improving utilization. If the external platform supports batched queries, grouping the N candidates per iteration into a few large requests amortizes and , effectively shrinking .
4. Experimental Setup
All experiments were conducted in MATLAB R2024 using a common protocol across REO and all baselines: a population of agents, a budget of iterations per run, and independent runs per problem with distinct seeds (rng(seed,’twister’)). We evaluate on the CEC2022 single-objective suite (12 functions spanning unimodal, rotated multimodal, hybrid, and composition) and five constrained engineering designs (Welded Beam, Spring Design, Three-Bar Truss, Cantilever Stepped Beam, Ten-Bar Planar Truss), treating all as minimization with canonical bounds/constraints; initialization is uniform in , bound violations are handled by reflection/clamp (long jumps reflected twice), feasibility has priority in replacement (feasible ≻ infeasible; among infeasible, lower total violation), and required discrete variables are projected to the nearest admissible value before evaluation. REO employs a JADE current-to-p-best/1 core with jDE self-adaptation , elite sampling and elite-mean fraction , a rank-aware undertow of strength , a time-growing tide with , a range-scaled swell with , , , , and early Lévy kicks with , , ; these settings are fixed across problems unless sensitivity analyses are explicitly reported. Baselines (e.g., DE/JADE, PSO, CMA–ES, GA, ABC, CS, and recent nature-inspired methods) follow canonical parameterizations from their primary sources but strictly match the shared budget/population/runs, stopping at T or when the suite’s tolerance to the known optimum is achieved. For each algorithm and problem, we report mean, standard deviation (when known), error to the optimum, and a per-function rank (lower-is-better) with tie-breaking by better mean, then better best, then lower std; global summaries include average rank, Top-k counts, and head-to-head tallies. Statistical significance is assessed via two-sided Wilcoxon signed-rank tests over paired per-function results ( for CEC2022). Convergence is visualized with mean best-so-far curves and shaded variability bands, complemented by boxplots of final scores, ECDFs across functions, and a Dolan–Moré performance profile.
5. Statistical Comparison Results over CEC2022
The CEC2022 test suite comprises 12 benchmark functions (–) designed to evaluate single-objective optimization algorithms. Each function provides a challenging landscape with different modalities and complexities, requiring algorithms to explore and exploit the search space effectively. In dynamic multimodal optimization research, the presence of multiple global or local optima is well recognized, and benchmark test suites combine multimodal functions with different change modes to generate diverse environments for algorithm evaluation. The populations used in CEC competitions often include both “simple” environments with several global and local peaks and “composition” functions whose landscapes include a large number of local peaks that can mislead evolutionary search. The results provided here are static single-objective data from the CEC2022 suite; however, the insights from dynamic multimodal problems illustrate the importance of robustness and adaptability across heterogeneous functions.
5.1. Evaluation Metrics
For each test function, four statistics were recorded for every optimizer: the mean objective value over multiple runs, the standard deviation (Std.), an error measure (difference between the observed mean value and the known optimum), and a rank. Lower mean and error values are better, and lower standard deviations indicate more consistent performance. Ranks are assigned per function; the best mean receives rank 1, and higher numbers denote worse performance. Average ranks across all functions allow holistic comparison among optimizers.
5.2. Performance of the REO Optimizer Compared with Other Optimizers
The REO algorithm consistently achieved the best performance across all 12 CEC2022 functions. As shown in the following tables, REO obtained the lowest mean objective value, zero or very small error, and negligible standard deviation on every function. Consequently, it was ranked first on all functions, giving it an average rank of 1 (Table 2). The second-best algorithms overall were RUN, ALO, MVO, DO and COA. Nonetheless, their average ranks were much higher (6.42–8.92), and their mean objective values and variances were noticeably worse than those of REO.

Table 2.
Average performance metrics across all CEC2022 functions.
On each benchmark function , the mean objective value of REO was either equal to or lower than that of every competitor. For example, on the shifted and fully rotated Zakharov function , the mean of REO was with zero standard deviation, whereas the nearest competitors (RTH, DO, and several others) obtained the same mean value but had non-zero standard deviations. For , REO achieved a mean of , while the second-best algorithm (ALO) produced ; REO also had an almost zero error measure compared with larger errors for other methods. Similarly, on , the mean of REO was (with zero error), whereas the best competitor (GWO) attained with an error of approximately . These small yet consistent margins illustrate the superiority of REO.
A more pronounced gap appears on functions with higher dimensions or more complex landscapes. On REO yielded a mean of , whereas RTH achieved and COA produced . For , the mean of REO was , while the next best algorithm (COA) delivered , and ALO produced . Similar patterns are observed on –, where REO maintained the lowest means and standard deviations; for instance, on the mean of REO was , whereas MVO (second) achieved and RUN produced . Across all functions, the error measures of REO were minimal (often below 40), while many competing algorithms recorded errors in the hundreds or thousands (Table A1, Table A2 and Table A3).
The stability of an optimizer can be inferred from the standard deviation across runs. REO had an exceptionally low average standard deviation (about ) compared with other algorithms; the second-best method (RTH) had an average standard deviation of approximately , and most algorithms exhibited much larger variances (hundreds to millions). The low variance of REO demonstrates that it consistently converged to high-quality solutions across repeated runs.
The next strongest optimizers were RUN, ALO, and MVO. RUN achieved an average rank of and an average mean value of . ALO had a slightly higher average mean () and rank (). While these algorithms occasionally approached REO on simpler functions (for instance, RUN equaled REO on and produced only slightly higher means on and ), none matched REO’s uniform dominance across the entire suite. Algorithms such as SMA, GBO, SPBO, SSOA, and OHO performed poorly, with extremely large error measures and standard deviations, leading to average ranks greater than 29.
As it can be seen in Table 3, REO does not lose to any competitor on any function; only RTH ties REO (two functions: and ). The most frequent non-REO top 3 finishes are observed for GWO (5), followed by MVO (4), and COA/RTH (3 each).

Table 3.
Optimizers results vs. REO across 12 functions and number of Top-3 finishes (rank ≤ 3). W/D/L counts functions where an algorithm had a better/same/worse rank than REO.
The rank-based summaries in Table 4 and Table 5 show a clear overall winner: REO attains an average rank of with 12/12 wins, indicating consistent dominance across all CEC2022 functions considered. The only ties at the top occur on F1 and F9, where RTH matches REO’s best rank.

Table 4.
Global summary over the 12 CEC2022 functions using the reported ranks (lower is better). Columns show: Avg. rank, median rank, SD of ranks across functions, the number of wins (#rank ), Top-3/Top-5 counts, Bottom-3 (#rank ), and the average-rank gap to REO ().

Among the compared optimizers other than REO, the strongest overall performers by average rank are RUN (), ALO (), MVO (), COA (), DO (), GWO (), and RTH (). Notably, GWO and MVO accumulate the largest number of Top-3 finishes among non-REO algorithms (five and four, respectively). In contrast, OHO, SSOA, and SPBO reside at the bottom of the ranking distribution, with high Bottom-3 counts ( 8, 11, and 8, respectively ) and average ranks above 30.
Stability varies substantially across optimizers as reflected by the SD of ranks. Some methods are consistently good or bad: e.g., RUN (SD ) is tightly clustered in the single-digit ranks, while SSOA (SD ) is consistently near the bottom. Others are more volatile: FOX shows the largest variability (SD ), switching between mid-pack and near-bottom ranks depending on the function, whereas HLOA (SD ) also exhibits wide fluctuations.
5.3. REO vs. Traditional Optimizers on CEC2022
Table A4 compares REO against Traditional Optimizers, including PSO, CMAES, GA, DE, CS, and ABC, on the CEC2022 suite. REO attains the top rank on 10 of 12 functions (with ties on F3 with DE and on F5 with CMAES), yielding the best average rank of (versus DE , ABC , PSO , CS , CMAES , and GA ). In terms of solution quality and robustness, REO achieves the smallest error measure on nearly all problems—zero error on F1, F3, F5, and F11—and exhibits very low variability (Std. = 0 on F1, F3, F5, F9, F11 and on F12), while substantially outperforming classical methods on challenging instances such as F6. The only clear exceptions are F8 and F10, where DE leads (with ABC second on F8), yet REO remains competitive (third and second, respectively). Overall, the evidence indicates that REO provides consistently superior accuracy and stability across diverse landscapes.
6. Visual Results over CECC2022
This section provides a discussion of the visual results obtained by running the optimizer over the CEC2022 benchmark functions. The following subsections will cover different aspects of the optimization process, including convergence behavior, performance distribution, and the impact of population size on optimization.
6.1. Search History, Trajectory, Fitness and Convergence Curve Comparison Comparison of Different Population Sizes
Figure 8 and Figure 9 presents Search history, trajectory, fitness and convergence curve comparison and plots comparing the final objective values across population sizes for each benchmark function. The plot confirms that larger population sizes generally lead to better performance, especially for complex functions. This result further emphasizes the importance of selecting an appropriate population size to balance between computational cost and optimization quality.
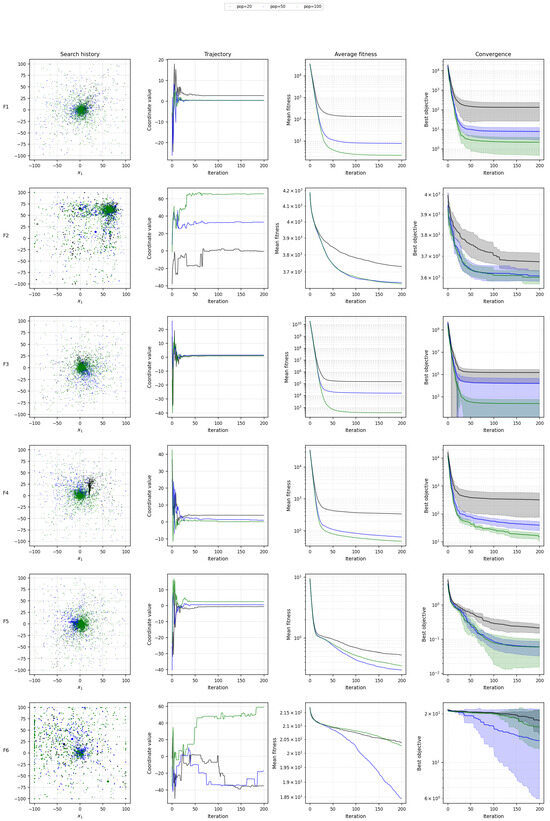
Figure 8.
Search history, trajectory, fitness and convergence curve comparison of the final objective values achieved by different population sizes for the CEC2022 benchmark functions.
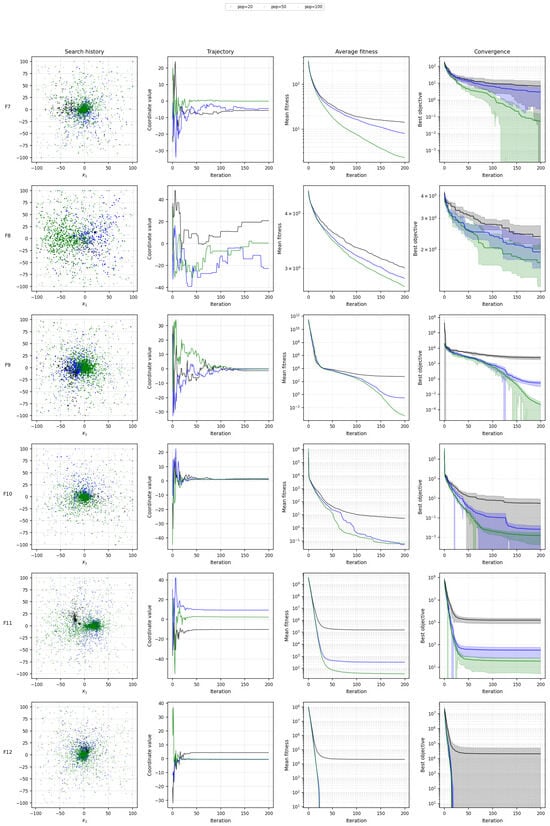
Figure 9.
Search history, trajectory, fitness and convergence curve comparison of the final objective values achieved by different population sizes for the CEC2022 benchmark functions.
The optimizer’s convergence performance is illustrated across CEC2022 12 benchmark functions. Figure 10 shows the convergence of the best objective value with respect to the number of iterations for each of the 12 functions. These plots illustrate the optimizer’s ability to find solutions that improve over time. Generally, it can be observed that the optimizer exhibits rapid convergence initially, especially for simpler functions such as F1, F2, and F5, where the best objective rapidly approaches the optimal value within a few hundred iterations.
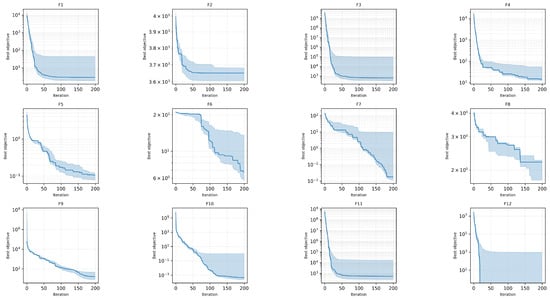
Figure 10.
Convergence behavior of the optimizer across the CEC2022 benchmark functions. The best objective values are plotted against iterations for different functions.
For more complex functions like F3, F7, and F12, the convergence slows significantly, and the optimizer requires more iterations to improve its objective value. For these functions, the algorithm’s exploration phase seems to dominate, as it spends more time searching for better solutions. Notably, functions such as F10 and F11 show a plateau after initial improvement, suggesting that the optimizer may become stuck in local optima before continuing to improve after several iterations. The performance of the optimizer across these functions is generally consistent, but the complexity of the objective landscape plays a significant role in the rate of convergence.
6.2. Final Objective Values
Figure 11 shows the Empirical Cumulative Distribution Function (ECDF) of the final objective values for the different population sizes (pop = 20, 50, 100). This plot provides insight into how the optimizer performs across different population sizes. The results show that larger populations (pop = 100) generally result in a higher fraction of benchmark functions achieving better final objective values. The ECDF indicates that the larger population tends to explore the search space more thoroughly, leading to improved optimization outcomes. Conversely, the smaller population sizes (pop = 20) often result in suboptimal final objective values, as they are less capable of escaping local optima.
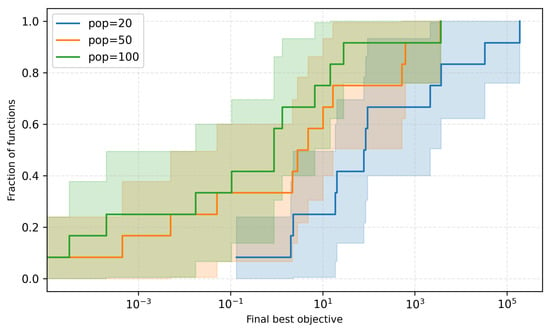
Figure 11.
Empirical Cumulative Distribution Function (ECDF) of final objective values for different population sizes.
Interestingly, while larger populations have a clear advantage in terms of final objective values, the overall trend is relatively consistent across population sizes, with a noticeable shift towards better performance with increased population size. This result emphasizes the trade-off between computational expense and solution quality, suggesting that while a larger population improves performance, it requires more resources.
6.3. Final Objective Scatter Plot
In Figure 12, a scatter plot of the final objective values is presented across all benchmark functions. This plot shows the best objective values achieved by the optimizer for different population sizes. From the scatter plot, it is clear that the optimizer’s performance varies significantly across functions, with certain functions showing excellent optimization results regardless of population size, while others exhibit a more erratic performance.
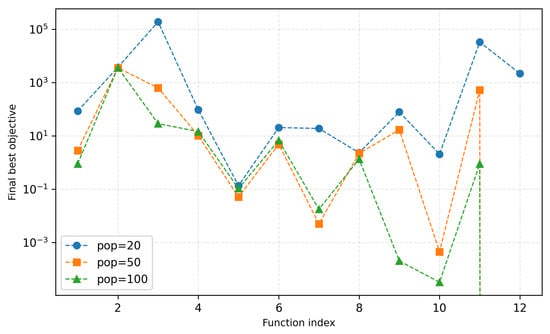
Figure 12.
Scatter plot of the final objective values achieved by the optimizer for different population sizes across the CEC2022 benchmark functions.
For instance, functions such as F1 and F2 show a very tight clustering of objective values for all population sizes, indicating that the optimizer consistently finds high-quality solutions. However, functions like F3 and F12 show a wider spread of results, particularly for smaller population sizes, which suggests that the optimizer struggles to find optimal solutions on these more complex functions. The scatter plot also confirms that larger population sizes (pop = 100) generally lead to better optimization results, but the magnitude of improvement is not uniform across all functions.
6.4. Impact of Population Size on Optimization
Figure 13 and Figure 14 present boxplots for the final objective values across different population sizes. These boxplots offer a summary of the distribution of objective values achieved by the optimizer for each function. From the plots, it is evident that the optimizer’s performance is significantly affected by population size. Larger population sizes lead to a higher probability of achieving lower objective values, as reflected by the lower median values and narrower interquartile ranges in the boxplots for pop = 50 and pop = 100 compared to pop = 20.
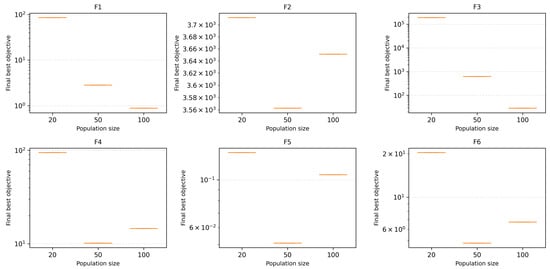
Figure 13.
Boxplot showing the distribution of final objective values across different population sizes for various CEC2022 benchmark functions.
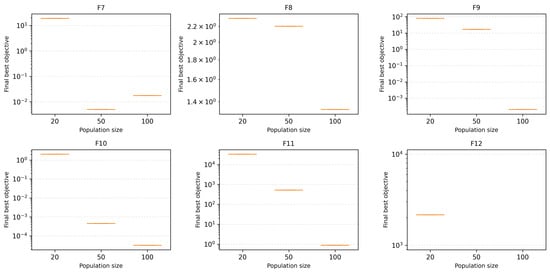
Figure 14.
Boxplot showing the distribution of final objective values for different population sizes, emphasizing the impact of population size on optimization performance.
However, the effect of population size varies depending on the complexity of the function. For simpler functions (F1, F2), the performance differences between population sizes are minimal, suggesting that these functions do not require large populations to achieve near-optimal solutions. In contrast, more complex functions (F3, F6, F10) show a clear advantage for larger population sizes, as the larger populations allow for better exploration and more consistent convergence.
6.5. Performance Profile
Figure 15 shows the performance profile, which tracks the fraction of functions solved within a given factor of the best objective value across all population sizes. The plot illustrates the relative performance of the optimizer for each population size. The population size of 100 consistently outperforms the other sizes, showing that it solves a higher fraction of functions within a given performance threshold. The population size of 50 shows moderate performance, while the size of 20 is the least effective.
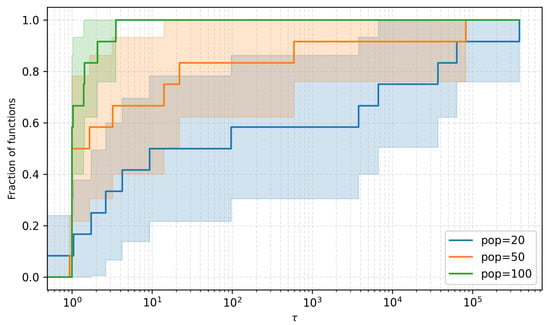
Figure 15.
Performance profile comparing the fraction of functions solved within a given factor of the best objective value for different population sizes.
6.6. Sensitivity Analysis
Population-based optimization algorithms often have several control parameters that regulate the balance between exploration and exploitation. As noted in the literature, proper parameter tuning is critical for competitive performance yet is notoriously difficult. To follow the reviewer’s suggestion for a thorough assessment of the original Ripple Evolution (REO) algorithm, we conducted a sensitivity analysis across all 12 benchmark functions. Two key parameters were investigated:
- Amplitude decay rate : controls how quickly the ripple amplitude diminishes over iterations.
- Pull strength : scales the attraction of each individual toward the current global best.
For each parameter, three values were tested ( and ). The REO algorithm was run with population size 50, 50 iterations, dimension 10 and bounds . Each configuration was repeated three times, and the final objective values were averaged.
6.7. Sensitivity to the Amplitude Decay Rate
Table 6 lists the averaged best objective values for each function and value of . Figure 16 visualizes the same data. Overall, a faster decay () generally leads to better performance on most functions, particularly Sphere, Rastrigin, Griewank, and Alpine. On the Schwefel, Rosenbrock, and Zakharov functions, the differences are more nuanced, but very slow decay () tends to degrade performance by injecting too much stochasticity.

Table 6.
Effect of the amplitude decay rate on the REO algorithm. Each entry reports the mean final objective value over three runs. Smaller values indicate better performance.
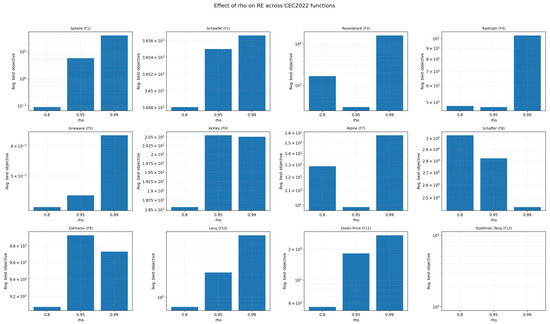
Figure 16.
Bar plots (log scale) showing the influence of on RE performance for all 12 CEC2022 functions. Faster decay () generally provides better convergence on most functions, while very slow decay () often degrades performance.
6.8. Sensitivity to the Pull Strength
Table 7 and Figure 17 summarize the effect of varying the pull strength. A moderate pull () yields the best or near-best performance on several functions (Rastrigin, Griewank, Ackley, Alpine, and Levy). Too low a pull () leads to under-exploitation and higher errors on many problems, whereas an excessively strong pull () causes premature convergence and poor performance on Sphere, Schwefel, Rosenbrock, and Dixon–Price.

Table 7.
Effect of the pull strength on the REO algorithm. Smaller values indicate better performance.
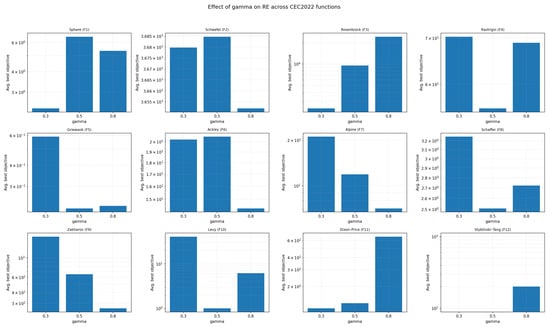
Figure 17.
Bar plots (log scale) of the effect of on RE performance. A moderate pull () generally balances exploration and exploitation across many functions, while too strong or too weak attraction hampers performance on specific problems.
The sensitivity analysis confirms that the original RE algorithm is highly sensitive to its control parameters across diverse problem landscapes. On most functions, a relatively fast amplitude decay () is beneficial because it reduces oscillations quickly and concentrates search effort; however, on functions with complex topologies like Levy and Styblinski–Tang, a slightly slower decay retains diversity and prevents premature convergence. Overall, very slow decay () tends to inject too much random perturbation, causing stagnation or divergence.
The pull strength regulates exploitation. Moderate values () offer a good balance between exploring new regions and exploiting the current best solutions. Very small pulls () fail to guide the population effectively on many functions, while excessive pulls () can drive the swarm toward local optima prematurely, producing large errors on several test problems. These observations mirror general findings in the metaheuristic community: algorithms that rely solely on exploitation risk premature convergence, whereas those that overemphasize exploration may converge too slowly. Similar trade-offs are seen in genetic algorithms with Lévy flights, where increased exploration improves escape from local minima but introduces parameter sensitivity and may hinder convergence.
6.9. Wilcoxon Signed-Rank Summary for REO
As it can be seen in Table A5, Table A6 and Table A7 for the (12 test functions × 32 peer optimizers), REO shows overwhelmingly superior performance: out of 12 functions, REO is significant on almost all of them with no significant losses, and only 7 ties—all on F2 against RUN, ALO, MVO, DO, COA, and AVOA, plus one on F7 against COA—while every other case favors REO, typically with very small p-values () and large negative test statistics (; e.g., on F1, F3–F6, F9–F11 we observe versus every competitor). Aggregating per competitor, REO achieves 12–0–0 (wins–losses–ties) against all compared optimizers, 11–0–1 against RUN, ALO, MVO, DO, and AVOA, and 10–0–2 against COA, confirming that REO’s advantage is consistent, statistically robust, and practically large across the entire benchmark suite.
7. Applications of REO in Solving Engineering Design Problems
7.1. Welded Beam Engineering Design Problem
The welded beam design problem seeks the minimum fabrication cost of a welded beam subject to constraints on shear stress, bending stress, buckling load, and end deflection. Typical decision variables are weld size (), weld length (), beam thickness (), and beam width () (see Figure 18).
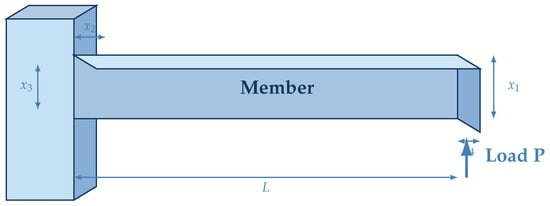
Figure 18.
Welded connection with design parameters and load application.
REO attains the top rank (Rank 1) on Welded Beam with best objective and mean (std ). Compared with the next best method, POA, the first optimizer improves the best objective by 0.30% (from 1.73003 to 1.72485) and reduces the mean by 0.36% (from 1.73117 to 1.72485). Relative to the median across the remaining optimizers, the first optimizer yields a 42.46% lower mean objective, indicating stable performance. These figures (see Table 8) consistently highlight the superior performance of REO over the competing optimizers on this problem.

Table 8.
Optimization results for Welded Beam.
7.2. Spring Engineering Design Problem
The tension/compression spring design problem (See Figure 19) minimizes the spring weight while satisfying constraints on shear stress, surge frequency, and limits on geometry. The decision variables are wire diameter (), mean coil diameter (), and the number of active Lcoils ().
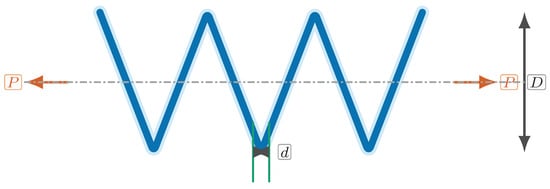
Figure 19.
Tension –compression spring with axial load P, overall coil diameter D, and wire diameter d at the central valley.
REO attains the top rank (Rank 1) on Spring Design with best Objective and mean (std ). Compared with the next best method, POA, the first optimizer improves the best objective by (from 180,806 to 180,806) and reduces the mean by 0.00% (from 180,806 to 180,806). Relative to the median across the remaining optimizers, the first optimizer yields a 19.26% lower mean objective, indicating stable performance. These figures (see Table 9) consistently highlight the superior performance of RE over the competing optimizers on this problem.

Table 9.
Optimization results for Spring Design.
7.3. Three-Bar Truss Engineering Design Problem
The three-bar truss problem (See Figure 20) minimizes structural weight with stress and displacement constraints. A symmetric V-shaped truss supports a vertical load; design variables typically parameterize the cross-sectional areas.
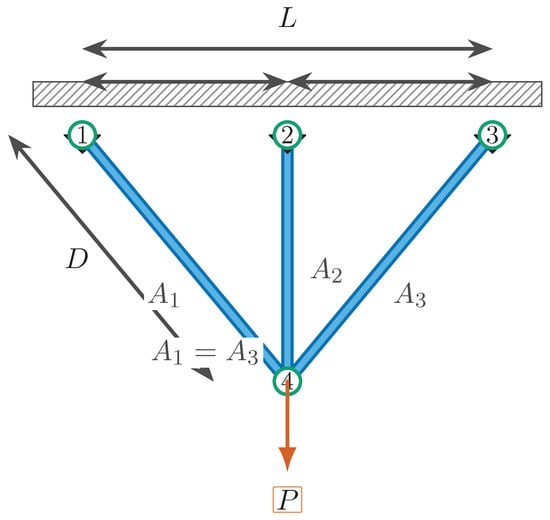
Figure 20.
Illustration of the three-bar truss Design.
REO attains the top rank (Rank 1) on Three-Bar Truss with best Objective and mean (std ). Compared with the next best method, POA, the first optimizer improves the best objective by (from 263.896 to 263.896) and reduces the mean by 0.00% (from 263.896 to 263.896). Relative to the median across the remaining optimizers, the first optimizer yields a 0.31% lower mean objective, indicating stable performance. These figures (see Table 10) consistently highlight the superior performance of RE over the competing optimizers on this problem.

Table 10.
Optimization results for Three-Bar Truss.
7.4. Cantilever Stepped Beam Engineering Design Problem
The cantilever stepped beam problem (See Figure 21) minimizes the material weight (or cost) of a beam divided into a number of segments, under stress and deflection constraints. The design variables (–) are the cross-sectional dimensions of each segment.

Figure 21.
Cantilever stepped beam with ten segments clamped at the left wall, subjected to a tip load P. The total span is L. Cross-section dimensions are width W and height H.
REO attains the top rank (Rank 1) on Cantilever Stepped Beam with best Objective and mean (std ). Compared with the next best method, POA, the first optimizer improves the best objective by 1.97% (from 64,036 to 62,772.8) and reduces the mean by 2.05% (from 64,110.5 to 62,795.2). Relative to the median across the remaining optimizers, the first optimizer yields a 22.62% lower mean objective, indicating stable performance. These figures (see Table 11) consistently highlight the superior performance of RE over the competing optimizers on this problem.

Table 11.
Optimization results for Cantilever Stepped Beam.
7.5. Ten Bar Planar Truss Engineering Design Problem
The classical 10-bar planar truss problem (See Figure 22) minimizes the truss weight under stress and displacement constraints. The design variables are the cross-sectional areas of the ten members.
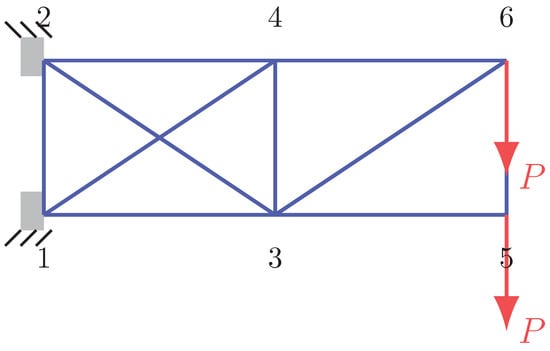
Figure 22.
Ten Bar Planar Truss Design.
REO attains the top rank (Rank 1) on Ten-Bar Planar Truss with best Objective and mean (std ). Compared with the next best method, REA, the first optimizer improves the best objective by 1.91% (from 609.626 to 597.999) and reduces the mean by 2.65% (from 614.41 to 598.153). Relative to the median across the remaining optimizers, the first optimizer yields a 29.03% lower mean objective, indicating stable performance. These figures (see Table 12) consistently highlight the superior performance of RE over the competing optimizers on this problem.

Table 12.
Optimization results for Ten-Bar Planar Truss.
7.6. Pressure-Vessel Design Problem
A pressure vessel (See Figure 23) stores fluid under pressure; it consists of a cylindrical shell capped by two hemispherical heads. The optimization task is to choose the shell thickness , head thickness , inner radius R, and cylindrical section length L so that the cost of material, forming, and welding is minimized. Rolled steel plate is only available in increments of 0.0625 in, so must be a multiple of 0.0625 in and must be selected from a discrete set, while R and L are continuous. NEORL’s problem description summarizes the variables and bounds.
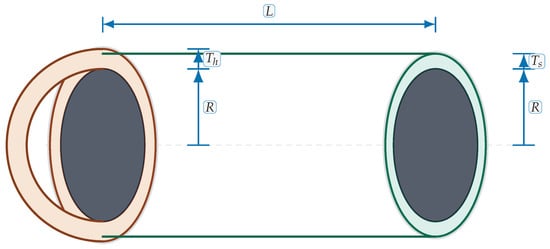
Figure 23.
Pressure vessel with cylindrical shell (length L) and hemispherical heads. Inner radius R; shell thickness ; head thickness . Colored rings indicate wall regions; dark disks show the inner cavity at the seam planes.
The cost function (in U.S. dollars) includes material, forming, and welding costs and is defined as
where represents in inches. The constraints ensure minimum thickness, sufficient volume, and a maximum length:
with bounds (multiples of 0.0625), , and .
As can be seen in Table 13, of the compared 16 metaheuristic algorithms. The RE optimizer achieved the lowest mean objective value (about 6106.46) and the best single solution (around 6043.92). Its modest standard deviation implies reliable convergence. The second-best (TTHHO) had a mean cost of approximately 6389.28, about 5% higher than RE. Algorithms such as MFO and ChOA had larger variability and higher costs. The poorest performers (SCA, FLO, ROA, WOA, TSO, SMA, RSA, SSOA) exhibited mean costs 40–420% higher than the best and large standard deviations. RE’s best design uses a thin shell ( in), a moderate head thickness ( in), an inner radius in, and a cylinder length in, satisfying all constraints and minimizing cost.

Table 13.
Pressure-Vessel Design Problem.
7.7. Stepped Transmission-Shaft Design
A stepped shaft transmits power through gears and pulleys mounted on different diameters (See Figure 24). The benchmark problem considers a three-segment shaft with fixed lengths and design variables for the diameters. The goal is to minimize the shaft weight while satisfying fatigue strength, minimum step size, and maximum-deflection constraints. Rodríguez-Cabal et al. formulated the model using the Modified Goodman fatigue criterion.

Figure 24.
Schematic of a stepped transmission shaft with symmetric shoulders. Red callouts denote diameters ; teal callouts denote radii .
The objective function is the total weight of the three cylindrical segments, given by
where and are fixed segment lengths. Six constraints enforce safety and manufacturability. First, each diameter must exceed a minimum safe diameter derived from the Modified Goodman criterion, expressed as for Second, bearing manufacturers require the middle diameter to exceed each adjacent diameter by at least 0.0787 in, giving and . Third, the deflection of the shaft must not exceed 0.005 in: . Bounds on the diameters are in.
As can be seen in Table 14, RE obtains the lowest mean objective value (about 0.002086) and the best single solution (≈0.001903), indicating the lightest weight shaft. Algorithms such as FLO, MFO, TSO, TTHHO, WOA, and SHO converge to a common mean objective of about 0.002268 with negligible variance; their designs use smaller diameters ( in, in). RE’s design uses a slightly larger in but a smaller in, reducing weight by roughly 8%. Lower-ranked algorithms show gradually larger mean objectives and variability, suggesting difficulties in handling the nonlinear constraints. The worst performers (SMA, ROA, RSA) yield substantially heavier shafts and higher standard deviations. Overall, RE offers superior performance on both benchmark problems, delivering the best solutions with low variability.

Table 14.
Stepped Transmission-Shaft Design.
8. Conclusions
We introduced REO (Ripple Evolution), a nature inspired, population based optimizer that combines a JADE-style current to p-best/1 core with jDE self adaptation and three complementary motions—rank aware undertow toward the incumbent best, a time varying tide toward the elite mean, and a scale aware swell with occasional Lévy kicks—supplemented by reflection/clamp boundary handling; we provided a compact, equation labeled model, pseudocode tied to those equations, visual diagrams, and a complexity analysis showing evaluation dominated cost. Empirically, REO achieved first or tied first across the CEC2022 functions considered, with notable strength on rotated multimodal, hybrid, and composition landscapes; convergence band and performance profile plots showed rapid early descent and stable late refinement, and population studies indicated that larger populations (e.g., 100) improve robustness at predictable computational expense. On constrained engineering problems (Welded Beam, Spring Design, Three Bar Truss, Cantilever Stepped Beam, Ten Bar Planar Truss), REO attained the best objectives among compared methods, demonstrating transfer from benchmarks to real designs. Collectively, these results underscore REO’s contributions in (i) design—a principled composition that couples adaptive guidance with diversified perturbations atop a strong DE backbone; (ii) transparency—fully specified equations, pseudocode, and bounds; and (iii) effectiveness—consistent top tier performance with practical guidance on population sizing and schedules. For practitioners, we recommend moderate to large populations when budgets allow, an increasing tide weight with concurrent decay of swell amplitude and Lévy probability, and jDE self-adaptation to reduce manual tuning; when evaluations are costly, consider smaller populations with restarts or early stopping on stagnation. Limitations include evaluation budget sensitivity typical of wrapper methods; promising extensions include discrete/mixed encodings, surrogate and early acceptance schemes, multi-objective variants, restart/niching for multimodality, and scalable vectorized/GPU implementations, alongside formal convergence analyses under stochastic schedules.
Author Contributions
Conceptualization, H.N.F. and H.R.; methodology, H.N.F. and H.R.; software, H.N.F.; validation, H.N.F., H.R. and R.A.; formal analysis, H.N.F. and F.H.; investigation, H.N.F. and H.R.; resources, R.A., F.H. and Z.K.; data curation, F.H. and H.N.F.; writing—original draft preparation, H.N.F.; writing—review and editing, H.R., R.A., F.H. and Z.K.; visualization, R.A.; supervision, H.R.; project administration, F.H. and Z.K. All authors have read and agreed to the published version of the manuscript.
Funding
This research received no external funding.
Data Availability Statement
The original contributions presented in this study are included in the article. Further inquiries can be directed to the corresponding author.
Conflicts of Interest
The authors declare no conflicts of interest.
Appendix A. Results in Comparison with State-of-the-Art Optimizers over CEC2022

Table A1.
REO Results in comparison with state-of-the-art optimizers over CEC2022 (Group 1).
Table A1.
REO Results in comparison with state-of-the-art optimizers over CEC2022 (Group 1).
| Function | Measure | REO | SMA | GBO | RTH | CPO | COA | SCSO | DOA | ZOA | SPBO | TSO | AO | TTHHO |
|---|---|---|---|---|---|---|---|---|---|---|---|---|---|---|
| F1 | mean | 300.000 | 16,900.597 | 7868.615 | 300.000 | 981.508 | 317.024 | 1801.966 | 1895.276 | 697.862 | 26,176.837 | 4750.826 | 872.700 | 312.415 |
| Std. | 0.000 | 16,600.597 | 7568.615 | 0.000 | 681.508 | 17.024 | 1501.966 | 1595.276 | 397.862 | 25,876.837 | 4450.826 | 572.700 | 12.415 | |
| error measure | 0.000 | 11,874.182 | 4956.494 | 0.000 | 1451.845 | 26.010 | 2273.235 | 2553.890 | 935.614 | 6927.866 | 5508.664 | 463.019 | 19.171 | |
| F1 | rank | 1 | 33 | 25 | 1 | 15 | 12 | 16 | 17 | 13 | 34 | 24 | 14 | 11 |
| F2 | mean | 402.581 | 452.966 | 444.742 | 411.699 | 423.869 | 406.033 | 433.995 | 491.903 | 431.409 | 1094.518 | 424.986 | 418.084 | 470.581 |
| Std. | 3.940 | 52.966 | 44.742 | 11.699 | 23.869 | 6.033 | 33.995 | 91.903 | 31.409 | 694.518 | 24.986 | 18.084 | 70.581 | |
| error measure | 2.581 | 31.299 | 25.924 | 20.353 | 32.345 | 2.949 | 26.176 | 106.030 | 30.078 | 274.228 | 32.515 | 26.194 | 94.370 | |
| F2 | rank | 1 | 23 | 22 | 7 | 12 | 3 | 19 | 26 | 18 | 30 | 13 | 10 | 24 |
| F3 | mean | 600.000 | 620.655 | 620.413 | 611.848 | 637.061 | 603.206 | 615.503 | 623.220 | 616.166 | 668.404 | 631.587 | 612.471 | 628.735 |
| Std. | 0.000 | 20.655 | 20.413 | 11.848 | 37.061 | 3.206 | 15.503 | 23.220 | 16.166 | 68.404 | 31.587 | 12.471 | 28.735 | |
| error measure | 0.000 | 13.196 | 9.874 | 10.923 | 11.770 | 4.874 | 12.032 | 11.162 | 7.298 | 9.788 | 12.698 | 6.659 | 12.167 | |
| F3 | rank | 1 | 17 | 16 | 10 | 26 | 4 | 14 | 18 | 15 | 34 | 23 | 12 | 21 |
| F4 | mean | 810.083 | 838.870 | 836.529 | 822.457 | 832.587 | 828.879 | 827.825 | 824.514 | 812.466 | 902.295 | 844.571 | 823.668 | 825.772 |
| Std. | 1.432 | 38.870 | 36.529 | 22.457 | 32.587 | 28.879 | 27.825 | 24.514 | 12.466 | 102.295 | 44.571 | 23.668 | 25.772 | |
| error measure | 10.083 | 11.420 | 9.979 | 9.812 | 1.764 | 5.820 | 6.430 | 9.526 | 3.611 | 12.137 | 16.366 | 8.681 | 7.384 | |
| F4 | rank | 1 | 25 | 23 | 10 | 19 | 17 | 16 | 12 | 2 | 34 | 29 | 11 | 13 |
| F5 | mean | 900.000 | 1484.652 | 1050.145 | 1049.876 | 1551.412 | 1019.747 | 1010.111 | 1173.483 | 1014.690 | 3451.315 | 1827.040 | 997.873 | 1388.892 |
| Std. | 0.000 | 584.652 | 150.145 | 149.876 | 651.412 | 119.747 | 110.111 | 273.483 | 114.690 | 2551.315 | 927.040 | 97.873 | 488.892 | |
| error measure | 0.000 | 472.104 | 152.080 | 90.371 | 199.784 | 215.990 | 117.853 | 195.992 | 66.519 | 667.842 | 874.950 | 52.252 | 143.077 | |
| F5 | rank | 1 | 28 | 15 | 14 | 30 | 13 | 11 | 17 | 12 | 34 | 33 | 9 | 23 |
| F6 | mean | 1809.765 | 5677.840 | 33,919.673 | 1826.654 | 3120.834 | 4423.698 | 3854.209 | 67,336,761.737 | 3597.939 | 426,332,821.762 | 4031.066 | 11,087.131 | 6258.135 |
| Std. | 13.852 | 3877.840 | 32,119.673 | 26.654 | 1320.834 | 2623.698 | 2054.209 | 67,334,961.737 | 1797.939 | 426,331,021.762 | 2231.066 | 9287.131 | 4458.135 | |
| error measure | 9.765 | 2616.177 | 35816.917 | 22.403 | 1543.796 | 1990.347 | 1606.781 | 301127840.444 | 1798.520 | 282,125,839.580 | 1352.132 | 6922.344 | 3597.598 | |
| F6 | rank | 1 | 19 | 25 | 2 | 3 | 15 | 10 | 31 | 6 | 33 | 12 | 24 | 21 |
| F7 | mean | 2004.235 | 2052.650 | 2069.420 | 2037.401 | 2115.933 | 2020.408 | 2046.890 | 2063.633 | 2039.307 | 2161.409 | 2073.196 | 2039.008 | 2071.799 |
| Std. | 8.827 | 52.650 | 69.420 | 37.401 | 115.933 | 20.408 | 46.890 | 63.633 | 39.307 | 161.409 | 73.196 | 39.008 | 71.799 | |
| error measure | 4.235 | 26.499 | 18.999 | 15.013 | 52.264 | 4.312 | 24.979 | 41.437 | 14.054 | 40.985 | 22.249 | 13.079 | 23.743 | |
| F7 | rank | 1 | 17 | 22 | 8 | 29 | 2 | 15 | 19 | 13 | 34 | 24 | 11 | 23 |
| F8 | mean | 2219.091 | 2228.475 | 2240.069 | 2233.442 | 2278.199 | 2223.370 | 2227.916 | 2228.705 | 2231.548 | 2348.422 | 2237.610 | 2226.484 | 2234.139 |
| Std. | 5.552 | 28.475 | 40.069 | 33.442 | 78.199 | 23.370 | 27.916 | 28.705 | 31.548 | 148.422 | 37.610 | 26.484 | 34.139 | |
| error measure | 19.091 | 6.876 | 27.160 | 36.711 | 65.027 | 7.685 | 4.280 | 13.281 | 27.091 | 139.749 | 9.133 | 3.117 | 12.334 | |
| F8 | rank | 1 | 14 | 23 | 20 | 28 | 2 | 12 | 15 | 16 | 31 | 22 | 9 | 21 |
| F9 | mean | 2529.284 | 2594.821 | 2571.185 | 2529.284 | 2552.204 | 2536.631 | 2572.129 | 2560.766 | 2599.920 | 2766.442 | 2567.088 | 2567.694 | 2609.746 |
| Std. | 0.000 | 294.821 | 271.185 | 229.284 | 252.204 | 236.631 | 272.129 | 260.766 | 299.920 | 466.442 | 267.088 | 267.694 | 309.746 | |
| error measure | 229.284 | 47.874 | 27.707 | 0.000 | 46.950 | 32.855 | 33.585 | 47.179 | 46.939 | 63.028 | 61.840 | 33.092 | 55.262 | |
| F9 | rank | 1 | 24 | 20 | 1 | 11 | 8 | 21 | 15 | 25 | 32 | 16 | 17 | 27 |
| F10 | mean | 2531.034 | 2581.995 | 2541.277 | 2550.504 | 2634.426 | 2573.403 | 2555.738 | 2579.061 | 2559.907 | 2573.886 | 2603.991 | 2536.191 | 2572.175 |
| Std. | 59.074 | 181.995 | 141.277 | 150.504 | 234.426 | 173.403 | 155.738 | 179.061 | 159.907 | 173.886 | 203.991 | 136.191 | 172.175 | |
| error measure | 153.034 | 67.972 | 63.625 | 62.531 | 215.038 | 61.563 | 62.708 | 72.968 | 60.981 | 34.190 | 258.399 | 55.028 | 94.052 | |
| F10 | rank | 1 | 22 | 5 | 9 | 28 | 19 | 12 | 21 | 14 | 20 | 26 | 3 | 18 |
| F11 | mean | 2600.000 | 2874.215 | 2926.663 | 2815.979 | 2785.229 | 2732.789 | 2775.718 | 2885.080 | 2757.808 | 3716.126 | 2796.474 | 2693.787 | 2755.431 |
| Std. | 0.000 | 274.215 | 326.663 | 215.979 | 185.229 | 132.789 | 175.718 | 285.080 | 157.808 | 1116.126 | 196.474 | 93.787 | 155.431 | |
| error measure | 0.000 | 191.420 | 212.963 | 171.395 | 181.294 | 121.744 | 184.306 | 313.356 | 153.406 | 303.444 | 195.562 | 89.838 | 135.942 | |
| F11 | rank | 1 | 23 | 26 | 20 | 15 | 8 | 13 | 25 | 12 | 33 | 18 | 4 | 11 |
| F12 | mean | 2860.196 | 2872.729 | 2871.544 | 2869.085 | 2898.136 | 2864.921 | 2866.041 | 2911.859 | 2932.846 | 2884.343 | 2892.856 | 2866.018 | 2896.950 |
| Std. | 0.382 | 172.729 | 171.544 | 169.085 | 198.136 | 164.921 | 166.041 | 211.859 | 232.846 | 184.343 | 192.856 | 166.018 | 196.950 | |
| error measure | 65.196 | 11.690 | 13.426 | 13.582 | 34.722 | 1.912 | 4.841 | 99.275 | 27.037 | 6.855 | 33.902 | 1.916 | 29.487 | |
| F12 | rank | 1 | 15 | 14 | 11 | 23 | 4 | 9 | 26 | 28 | 17 | 20 | 8 | 21 |

Table A2.
REO Results in comparison with state-of-the-art optimizers over CEC2022 (Group 2).
Table A2.
REO Results in comparison with state-of-the-art optimizers over CEC2022 (Group 2).
| Function | Measure | HHO | SSOA | RUN | GWO | MVO | AOA | GJO | HLOA | WOA | RSA | SHO | FLO | DO |
|---|---|---|---|---|---|---|---|---|---|---|---|---|---|---|
| F1 | mean | 301.806 | 11,293.075 | 300.000 | 2029.523 | 300.010 | 8697.436 | 2066.980 | 300.014 | 16,022.132 | 8777.105 | 2539.039 | 8917.237 | 300.003 |
| Std. | 1.806 | 10,993.075 | 0.000 | 1729.523 | 0.010 | 8397.436 | 1766.980 | 0.014 | 15,722.132 | 8477.105 | 2239.039 | 8617.237 | 0.003 | |
| error measure | 1.071 | 2433.432 | 0.000 | 1697.369 | 0.005 | 6884.058 | 1447.968 | 0.025 | 8428.573 | 2347.469 | 1764.691 | 1273.796 | 0.005 | |
| F1 | rank | 10 | 30 | 6 | 18 | 8 | 27 | 19 | 9 | 32 | 28 | 21 | 29 | 7 |
| F2 | mean | 426.318 | 1438.447 | 409.757 | 420.801 | 406.559 | 826.861 | 438.023 | 406.872 | 427.450 | 1102.226 | 435.404 | 1634.352 | 413.445 |
| Std. | 26.318 | 1038.447 | 9.757 | 20.801 | 6.559 | 426.861 | 38.023 | 6.872 | 27.450 | 702.226 | 35.404 | 1234.352 | 13.445 | |
| error measure | 33.210 | 400.643 | 21.266 | 20.970 | 2.671 | 323.795 | 41.151 | 3.126 | 30.346 | 653.659 | 57.937 | 423.507 | 23.044 | |
| F2 | rank | 14 | 32 | 6 | 11 | 4 | 29 | 21 | 5 | 15 | 31 | 20 | 33 | 8 |
| F3 | mean | 630.755 | 655.976 | 612.156 | 600.303 | 601.182 | 637.163 | 606.660 | 648.059 | 634.659 | 645.812 | 609.226 | 645.670 | 604.583 |
| Std. | 30.755 | 55.976 | 12.156 | 0.303 | 1.182 | 37.163 | 6.660 | 48.059 | 34.659 | 45.812 | 9.226 | 45.670 | 4.583 | |
| error measure | 8.743 | 7.434 | 5.689 | 0.516 | 1.545 | 7.722 | 4.496 | 11.397 | 13.674 | 3.335 | 5.510 | 9.529 | 5.516 | |
| F3 | rank | 22 | 32 | 11 | 2 | 3 | 27 | 8 | 30 | 25 | 29 | 9 | 28 | 5 |
| F4 | mean | 826.076 | 855.488 | 821.889 | 814.461 | 817.482 | 832.485 | 821.232 | 844.108 | 841.133 | 848.923 | 820.322 | 849.216 | 825.810 |
| Std. | 26.076 | 55.488 | 21.889 | 14.461 | 17.482 | 32.485 | 21.232 | 44.108 | 41.133 | 48.923 | 20.322 | 49.216 | 25.810 | |
| error measure | 8.522 | 11.615 | 6.226 | 6.750 | 7.823 | 8.321 | 7.655 | 18.068 | 16.793 | 6.373 | 5.834 | 11.961 | 11.096 | |
| F4 | rank | 15 | 33 | 8 | 3 | 5 | 18 | 7 | 28 | 26 | 31 | 6 | 32 | 14 |
| F5 | mean | 1319.910 | 1604.662 | 978.973 | 907.954 | 900.057 | 1308.511 | 962.528 | 1402.142 | 1423.981 | 1441.385 | 1072.166 | 1456.632 | 983.810 |
| Std. | 419.910 | 704.662 | 78.973 | 7.954 | 0.057 | 408.511 | 62.528 | 502.142 | 523.981 | 541.385 | 172.166 | 556.632 | 83.810 | |
| error measure | 145.528 | 193.921 | 36.631 | 12.782 | 0.154 | 157.513 | 70.099 | 232.996 | 286.952 | 158.522 | 113.335 | 191.607 | 118.720 | |
| F5 | rank | 21 | 32 | 7 | 3 | 2 | 20 | 5 | 24 | 25 | 26 | 16 | 27 | 8 |
| F6 | mean | 3806.335 | 166,665,619.625 | 3182.351 | 6395.797 | 5971.458 | 4037.837 | 7945.659 | 3861.126 | 4434.161 | 53,751,268.631 | 4464.440 | 22,703,425.419 | 4761.776 |
| Std. | 2006.335 | 166,663,819.625 | 1382.351 | 4595.797 | 4171.458 | 2237.837 | 6145.659 | 2061.126 | 2634.161 | 53,749,468.631 | 2664.440 | 22,701,625.419 | 2961.776 | |
| error measure | 1747.588 | 221,589,176.904 | 1335.925 | 1871.969 | 2008.888 | 1192.688 | 1293.822 | 2850.706 | 2188.785 | 24,335,005.208 | 1647.107 | 27,640,219.168 | 1754.379 | |
| F6 | rank | 9 | 32 | 4 | 22 | 20 | 13 | 23 | 11 | 16 | 30 | 17 | 29 | 18 |
| F7 | mean | 2052.247 | 2131.198 | 2037.971 | 2024.498 | 2035.516 | 2093.584 | 2041.290 | 2105.708 | 2064.570 | 2124.884 | 2026.420 | 2103.249 | 2027.173 |
| Std. | 52.247 | 131.198 | 37.971 | 24.498 | 35.516 | 93.584 | 41.290 | 105.708 | 64.570 | 124.884 | 26.420 | 103.249 | 27.173 | |
| error measure | 24.262 | 26.348 | 9.137 | 9.185 | 39.677 | 26.763 | 16.680 | 29.136 | 23.912 | 22.848 | 10.415 | 20.378 | 6.669 | |
| F7 | rank | 16 | 32 | 10 | 3 | 7 | 26 | 14 | 28 | 20 | 31 | 4 | 27 | 5 |
| F8 | mean | 2232.476 | 2355.481 | 2223.899 | 2224.083 | 2228.138 | 2248.708 | 2226.523 | 2296.505 | 2233.059 | 2253.877 | 2223.942 | 2244.260 | 2223.770 |
| Std. | 32.476 | 155.481 | 23.899 | 24.083 | 28.138 | 48.708 | 26.523 | 96.505 | 33.059 | 53.877 | 23.942 | 44.260 | 23.770 | |
| error measure | 13.226 | 96.688 | 1.278 | 5.163 | 28.368 | 37.895 | 3.170 | 62.612 | 6.456 | 21.895 | 1.830 | 24.891 | 5.450 | |
| F8 | rank | 18 | 32 | 4 | 7 | 13 | 26 | 10 | 29 | 19 | 27 | 5 | 25 | 3 |
| F9 | mean | 2568.046 | 2787.297 | 2529.285 | 2560.093 | 2536.647 | 2690.040 | 2569.191 | 2531.502 | 2557.904 | 2719.079 | 2587.331 | 2758.261 | 2529.284 |
| Std. | 268.046 | 487.297 | 229.285 | 260.093 | 236.647 | 390.040 | 269.191 | 231.502 | 257.904 | 419.079 | 287.331 | 458.261 | 229.284 | |
| error measure | 30.923 | 49.753 | 0.000 | 39.037 | 32.851 | 38.995 | 23.473 | 6.142 | 35.698 | 27.554 | 22.182 | 44.256 | 0.000 | |
| F9 | rank | 18 | 33 | 5 | 14 | 9 | 29 | 19 | 7 | 12 | 30 | 23 | 31 | 4 |
| F10 | mean | 2597.987 | 2708.862 | 2552.328 | 2535.133 | 2569.878 | 2609.437 | 2561.466 | 2679.896 | 2536.786 | 2643.823 | 2547.393 | 2658.647 | 2549.937 |
| Std. | 197.987 | 308.862 | 152.328 | 135.133 | 169.878 | 209.437 | 161.466 | 279.896 | 136.786 | 243.823 | 147.393 | 258.647 | 149.937 | |
| error measure | 133.827 | 107.957 | 58.762 | 62.167 | 87.109 | 115.888 | 61.797 | 342.143 | 63.867 | 128.505 | 58.188 | 127.829 | 62.602 | |
| F10 | rank | 25 | 32 | 11 | 2 | 17 | 27 | 15 | 31 | 4 | 29 | 7 | 30 | 8 |
| F11 | mean | 2754.203 | 3675.586 | 2635.064 | 2810.817 | 2675.451 | 3217.882 | 2818.181 | 2724.192 | 2780.018 | 3175.503 | 2823.400 | 3345.298 | 2791.527 |
| Std. | 154.203 | 1075.586 | 35.064 | 210.817 | 75.451 | 617.882 | 218.181 | 124.192 | 180.018 | 575.503 | 223.400 | 745.298 | 191.527 | |
| error measure | 177.997 | 364.810 | 97.513 | 173.872 | 155.101 | 372.814 | 188.813 | 139.182 | 183.967 | 459.242 | 253.988 | 367.387 | 201.031 | |
| F11 | rank | 9 | 32 | 2 | 19 | 3 | 29 | 21 | 7 | 14 | 28 | 22 | 31 | 17 |
| F12 | mean | 2898.851 | 3069.755 | 2863.450 | 2865.382 | 2862.361 | 2986.633 | 2870.383 | 2901.851 | 2891.004 | 2952.150 | 2891.185 | 3077.339 | 2867.937 |
| Std. | 198.851 | 369.755 | 163.450 | 165.382 | 162.361 | 286.633 | 170.383 | 201.851 | 191.004 | 252.150 | 191.185 | 377.339 | 167.937 | |
| error measure | 44.926 | 77.570 | 1.580 | 4.235 | 2.294 | 49.548 | 10.404 | 43.709 | 36.930 | 109.831 | 26.590 | 104.473 | 6.752 | |
| F12 | rank | 24 | 32 | 3 | 6 | 2 | 30 | 12 | 25 | 18 | 29 | 19 | 33 | 10 |

Table A3.
REO Results in comparison with state-of-the-art optimizers over CEC2022 (Group 3).
Table A3.
REO Results in comparison with state-of-the-art optimizers over CEC2022 (Group 3).
| Function | Measure | FOX | ROA | ALO | AVOA | Chimp | SHIO | OHO | HGSO |
|---|---|---|---|---|---|---|---|---|---|
| F1 | mean | 300.000 | 8477.647 | 300.000 | 300.000 | 2274.443 | 3701.791 | 14,724.679 | 4246.992 |
| Std. | 0.000 | 8177.647 | 0.000 | 0.000 | 1974.443 | 3401.791 | 14,424.679 | 3946.992 | |
| error measure | 0.000 | 1280.074 | 0.000 | 0.000 | 1154.214 | 3884.769 | 6187.418 | 1236.568 | |
| F1 | rank | 5 | 26 | 3 | 4 | 20 | 22 | 31 | 23 |
| F2 | mean | 415.301 | 753.296 | 403.980 | 431.224 | 567.695 | 431.257 | 2451.052 | 482.848 |
| Std. | 15.301 | 353.296 | 3.980 | 31.224 | 167.695 | 31.257 | 2051.052 | 82.848 | |
| error measure | 24.232 | 324.950 | 4.089 | 33.680 | 117.304 | 30.103 | 996.906 | 15.775 | |
| F2 | rank | 9 | 28 | 2 | 16 | 27 | 17 | 34 | 25 |
| F3 | mean | 649.560 | 633.858 | 606.490 | 614.177 | 627.504 | 605.393 | 660.693 | 626.433 |
| Std. | 49.560 | 33.858 | 6.490 | 14.177 | 27.504 | 5.393 | 60.693 | 26.433 | |
| error measure | 9.920 | 12.257 | 6.739 | 9.534 | 7.169 | 4.151 | 4.013 | 4.909 | |
| F3 | rank | 31 | 24 | 7 | 13 | 20 | 6 | 33 | 19 |
| F4 | mean | 838.068 | 844.107 | 821.908 | 833.631 | 836.525 | 816.676 | 845.389 | 832.948 |
| Std. | 38.068 | 44.107 | 21.908 | 33.631 | 36.525 | 16.676 | 45.389 | 32.948 | |
| error measure | 10.857 | 8.865 | 10.448 | 12.201 | 8.195 | 7.972 | 2.933 | 4.052 | |
| F4 | rank | 24 | 27 | 9 | 21 | 22 | 4 | 30 | 20 |
| F5 | mean | 1486.474 | 1370.511 | 974.625 | 1215.933 | 1269.705 | 948.649 | 1581.290 | 1000.787 |
| Std. | 586.474 | 470.511 | 74.625 | 315.933 | 369.705 | 48.649 | 681.290 | 100.787 | |
| error measure | 60.739 | 219.527 | 136.945 | 219.161 | 182.519 | 94.230 | 83.253 | 29.627 | |
| F5 | rank | 29 | 22 | 6 | 18 | 19 | 4 | 31 | 10 |
| F6 | mean | 4294.815 | 988,112.679 | 3333.468 | 3718.850 | 855,099.288 | 3759.744 | 813,540,668.079 | 1,638,867.010 |
| Std. | 2494.815 | 986,312.679 | 1533.468 | 1918.850 | 853,299.288 | 1959.744 | 813,538,868.079 | 1,637,067.010 | |
| error measure | 2067.655 | 2,044,013.325 | 1541.820 | 1853.750 | 548,275.257 | 1754.143 | 501,380,245.039 | 1,071,348.661 | |
| F6 | rank | 14 | 27 | 5 | 7 | 26 | 8 | 34 | 28 |
| F7 | mean | 2152.445 | 2074.398 | 2037.702 | 2031.001 | 2059.501 | 2039.192 | 2123.132 | 2067.928 |
| Std. | 152.445 | 74.398 | 37.702 | 31.001 | 59.501 | 39.192 | 123.132 | 67.928 | |
| error measure | 53.509 | 34.532 | 15.691 | 8.508 | 10.688 | 19.596 | 9.035 | 8.958 | |
| F7 | rank | 33 | 25 | 9 | 6 | 18 | 12 | 30 | 21 |
| F8 | mean | 2405.798 | 2243.123 | 2227.573 | 2223.952 | 2304.731 | 2226.446 | 2457.029 | 2232.235 |
| Std. | 205.798 | 43.123 | 27.573 | 23.952 | 104.731 | 26.446 | 257.029 | 32.235 | |
| error measure | 116.963 | 17.001 | 6.147 | 3.212 | 61.602 | 5.090 | 139.094 | 2.024 | |
| F8 | rank | 33 | 24 | 11 | 6 | 30 | 8 | 34 | 17 |
| F9 | mean | 2549.245 | 2660.820 | 2529.928 | 2529.284 | 2558.473 | 2585.655 | 2824.990 | 2608.553 |
| Std. | 249.245 | 360.820 | 229.928 | 229.284 | 258.473 | 285.655 | 524.990 | 308.553 | |
| error measure | 36.709 | 57.006 | 1.842 | 0.000 | 20.854 | 40.159 | 107.423 | 30.530 | |
| F9 | rank | 10 | 28 | 6 | 3 | 13 | 22 | 34 | 26 |
| F10 | mean | 2875.742 | 2596.302 | 2559.364 | 2568.017 | 2592.985 | 2551.934 | 2965.790 | 2544.649 |
| Std. | 475.742 | 196.302 | 159.364 | 168.017 | 192.985 | 151.934 | 565.790 | 144.649 | |
| error measure | 556.849 | 86.167 | 60.672 | 69.926 | 349.904 | 58.524 | 266.220 | 61.169 | |
| F10 | rank | 33 | 24 | 13 | 16 | 23 | 10 | 34 | 6 |
| F11 | mean | 2717.808 | 2978.927 | 2710.784 | 2754.540 | 3317.333 | 2879.024 | 4231.245 | 2786.157 |
| Std. | 117.808 | 378.927 | 110.784 | 154.540 | 717.333 | 279.024 | 1631.245 | 186.157 | |
| error measure | 128.091 | 168.036 | 148.480 | 150.486 | 149.370 | 203.864 | 435.998 | 13.195 | |
| F11 | rank | 6 | 27 | 5 | 10 | 30 | 24 | 34 | 16 |
| F12 | mean | 2994.919 | 2923.412 | 2865.555 | 2865.009 | 2871.482 | 2880.102 | 3238.549 | 2896.966 |
| Std. | 294.919 | 223.412 | 165.555 | 165.009 | 171.482 | 180.102 | 538.549 | 196.966 | |
| error measure | 87.264 | 46.929 | 2.565 | 1.297 | 12.838 | 23.264 | 135.905 | 5.975 | |
| F12 | rank | 31 | 27 | 7 | 5 | 13 | 16 | 34 | 22 |

Table A4.
REO Results vs. Traditional Optimizers over CEC2022).
Table A4.
REO Results vs. Traditional Optimizers over CEC2022).
| Function | Measure | REO | PSO | CMAES | GA | DE | CS | ABC |
|---|---|---|---|---|---|---|---|---|
| F1 | mean | 300.000 | 625.402 | 27,818.803 | 35,989.483 | 1927.604 | 17,652.882 | 5828.933 |
| Std. | 0.000 | 1029.013 | 13,531.172 | 8055.384 | 564.140 | 13,285.973 | 2065.394 | |
| error measure | 0.000 | 325.402 | 27,518.803 | 35,689.483 | 1627.604 | 17,352.882 | 5528.933 | |
| F1 | rank | 1 | 2 | 6 | 7 | 3 | 5 | 4 |
| F2 | mean | 402.581 | 460.904 | 651.355 | 640.462 | 402.615 | 411.132 | 405.085 |
| Std. | 3.940 | 34.327 | 93.846 | 204.299 | 1.731 | 10.361 | 0.069 | |
| error measure | 2.581 | 60.904 | 251.355 | 240.462 | 2.615 | 11.132 | 5.085 | |
| F2 | rank | 1 | 5 | 7 | 6 | 2 | 4 | 3 |
| F3 | mean | 600.000 | 601.413 | 614.347 | 655.913 | 600.000 | 607.309 | 600.000 |
| Std. | 0.000 | 1.353 | 21.044 | 14.131 | 0.000 | 7.738 | 0.000 | |
| error measure | 0.000 | 1.413 | 14.347 | 55.913 | 0.000 | 7.309 | 0.000 | |
| F3 | rank | 1 | 4 | 6 | 7 | 1 | 5 | 3 |
| F4 | mean | 810.083 | 818.356 | 821.340 | 878.501 | 817.500 | 855.322 | 823.101 |
| Std. | 1.432 | 8.993 | 7.804 | 11.314 | 2.612 | 25.330 | 7.211 | |
| error measure | 10.083 | 18.356 | 21.340 | 78.501 | 17.500 | 55.322 | 23.101 | |
| F4 | rank | 1 | 3 | 4 | 7 | 2 | 6 | 5 |
| F5 | mean | 900.000 | 923.360 | 900.000 | 1570.241 | 900.159 | 1210.375 | 1088.901 |
| Std. | 0.000 | 73.173 | 0.000 | 372.009 | 0.121 | 471.622 | 124.480 | |
| error measure | 0.000 | 23.360 | 0.000 | 670.241 | 0.159 | 310.375 | 188.901 | |
| F5 | rank | 1 | 4 | 1 | 7 | 3 | 6 | 5 |
| F6 | mean | 1809.765 | 5967.520 | 10,971,599.786 | 47,007,215.646 | 2295.720 | 245,240.607 | 1922.310 |
| Std. | 13.852 | 1781.664 | 26,588,179.508 | 79,306,727.240 | 275.759 | 612,571.849 | 101.382 | |
| error measure | 9.765 | 4167.520 | 10,969,799.786 | 47,005,415.646 | 495.720 | 243,440.607 | 122.310 | |
| F6 | rank | 1 | 4 | 6 | 7 | 3 | 5 | 2 |
| F7 | mean | 2004.235 | 2022.144 | 2093.553 | 2124.336 | 2005.567 | 2035.599 | 2007.375 |
| Std. | 8.827 | 1.149 | 65.357 | 50.292 | 0.626 | 18.355 | 0.455 | |
| error measure | 4.235 | 22.144 | 93.553 | 124.336 | 5.567 | 35.599 | 7.375 | |
| F7 | rank | 1 | 4 | 6 | 7 | 2 | 5 | 3 |
| F8 | mean | 2219.091 | 2222.901 | 2253.049 | 2252.068 | 2212.126 | 2230.522 | 2212.797 |
| Std. | 5.552 | 7.842 | 15.460 | 27.558 | 3.367 | 7.595 | 7.194 | |
| error measure | 19.091 | 22.901 | 53.049 | 52.068 | 12.126 | 30.522 | 12.797 | |
| F8 | rank | 3 | 4 | 7 | 6 | 1 | 5 | 2 |
| F9 | mean | 2529.284 | 2556.692 | 2569.673 | 2697.656 | 2529.284 | 2531.657 | 2556.563 |
| Std. | 0.000 | 51.959 | 52.862 | 42.942 | 0.000 | 6.327 | 70.619 | |
| error measure | 229.284 | 256.692 | 269.673 | 397.656 | 229.284 | 231.657 | 256.563 | |
| F9 | rank | 1 | 5 | 6 | 7 | 2 | 3 | 4 |
| F10 | mean | 2531.034 | 2542.240 | 2790.693 | 2742.117 | 2500.748 | 2545.071 | 2570.119 |
| Std. | 59.074 | 57.933 | 463.781 | 374.060 | 0.246 | 69.988 | 0.046 | |
| error measure | 153.034 | 142.240 | 390.693 | 342.117 | 100.748 | 145.071 | 170.119 | |
| F10 | rank | 2 | 3 | 7 | 6 | 1 | 4 | 5 |
| F11 | mean | 2600.000 | 2964.193 | 2963.725 | 3277.093 | 2648.544 | 2788.517 | 2601.718 |
| Std. | 0.000 | 248.061 | 134.297 | 346.909 | 54.081 | 219.091 | 2.413 | |
| error measure | 0.000 | 364.193 | 363.725 | 677.093 | 48.544 | 188.517 | 1.718 | |
| F11 | rank | 1 | 6 | 5 | 7 | 3 | 4 | 2 |
| F12 | mean | 2860.196 | 2871.808 | 2875.160 | 3037.545 | 2864.518 | 2864.013 | 2865.237 |
| Std. | 0.382 | 10.508 | 4.307 | 41.264 | 0.411 | 0.700 | 1.373 | |
| error measure | 65.196 | 171.808 | 175.160 | 337.545 | 164.518 | 164.013 | 165.237 | |
| F12 | rank | 1 | 5 | 6 | 7 | 3 | 2 | 4 |

Table A5.
Wilcoxon Signed Results part 1.
Table A5.
Wilcoxon Signed Results part 1.
| Function | RUN | ALO | MVO | DO | COA | GWO | AVOA | AO | SHIO | SCSO | SHO |
|---|---|---|---|---|---|---|---|---|---|---|---|
| F1 | 8.86 | 8.86 | 8.86 | 8.86 | 8.86 | 8.86 | 8.86 | 8.86 | 8.86 | 8.86 | 8.86 |
| T+: 210, T-: 0 | T+: 210, T-: 0 | T+: 210, T-: 0 | T+: 210, T-: 0 | T+: 210, T-: 0 | T+: 210, T-: 0 | T+: 210, T-: 0 | T+: 210, T-: 0 | T+: 210, T-: 0 | T+: 210, T-: 0 | T+: 210, T-: 0 | |
| Z: −3.9199, SRN: 0.0000 | Z: −3.9199, SRN: 0.0000 | Z: −3.9199, SRN: 0.0000 | Z: −3.9199, SRN: 0.0000 | Z: −3.9199, SRN: 0.0000 | Z: −3.9199, SRN: 0.0000 | Z: −3.9199, SRN: 0.0000 | Z: −3.9199, SRN: 0.0000 | Z: −3.9199, SRN: 0.0000 | Z: −3.9199, SRN: 0.0000 | Z: −3.9199, SRN: 0.0000 | |
| F2 | 0.501591 | 0.411465 | 0.851925 | 0.433048 | 0.167184 | 0.000681 | 0.147416 | 0.000593 | 0.002821 | 0.005734 | 0.000681 |
| T+: 87, T-: 123 | T+: 83, T-: 127 | T+: 100, T-: 110 | T+: 126, T-: 84 | T+: 142, T-: 68 | T+: 196, T-: 14 | T+: 146, T-: 64 | T+: 197, T-: 13 | T+: 185, T-: 25 | T+: 179, T-: 31 | T+: 196, T-: 14 | |
| Z: 0.6720, SRN: 123.0000 | Z: 0.8213, SRN: 127.0000 | Z: 0.1867, SRN: 110.0000 | Z: −0.7840, SRN: 84.0000 | Z: −1.3813, SRN: 68.0000 | Z: −3.3973, SRN: 14.0000 | Z: −1.4487, SRN: 59.0000 | Z: −3.4346, SRN: 13.0000 | Z: −2.9866, SRN: 25.0000 | Z: −2.7626, SRN: 31.0000 | Z: −3.3973, SRN: 14.0000 | |
| F3 | 8.86 | 8.86 | 8.86 | 8.86 | 8.86 | 8.86 | 8.86 | 8.86 | 8.86 | 8.86 | 8.86 |
| T+: 210, T-: 0 | T+: 210, T-: 0 | T+: 210, T-: 0 | T+: 210, T-: 0 | T+: 210, T-: 0 | T+: 210, T-: 0 | T+: 210, T-: 0 | T+: 210, T-: 0 | T+: 210, T-: 0 | T+: 210, T-: 0 | T+: 210, T-: 0 | |
| Z: −3.9199, SRN: 0.0000 | Z: −3.9199, SRN: 0.0000 | Z: −3.9199, SRN: 0.0000 | Z: −3.9199, SRN: 0.0000 | Z: −3.9199, SRN: 0.0000 | Z: −3.9199, SRN: 0.0000 | Z: −3.9199, SRN: 0.0000 | Z: −3.9199, SRN: 0.0000 | Z: −3.9199, SRN: 0.0000 | Z: −3.9199, SRN: 0.0000 | Z: −3.9199, SRN: 0.0000 | |
| F4 | 8.86 | 0.000219 | 0.000593 | 8.86 | 8.86 | 0.000293 | 8.86 | 8.86 | 0.00012 | 8.86 | 8.86 |
| T+: 210, T-: 0 | T+: 204, T-: 6 | T+: 197, T-: 13 | T+: 210, T-: 0 | T+: 210, T-: 0 | T+: 202, T-: 8 | T+: 210, T-: 0 | T+: 210, T-: 0 | T+: 208, T-: 2 | T+: 210, T-: 0 | T+: 210, T-: 0 | |
| Z: −3.9199, SRN: 0.0000 | Z: −3.6959, SRN: 6.0000 | Z: −3.4346, SRN: 13.0000 | Z: −3.9199, SRN: 0.0000 | Z: −3.9199, SRN: 0.0000 | Z: −3.6213, SRN: 8.0000 | Z: −3.9199, SRN: 0.0000 | Z: −3.9199, SRN: 0.0000 | Z: −3.8453, SRN: 2.0000 | Z: −3.9199, SRN: 0.0000 | Z: −3.9199, SRN: 0.0000 | |
| F5 | 8.86 | 8.86 | 8.86 | 8.86 | 8.86 | 8.86 | 8.86 | 8.86 | 8.86 | 8.86 | 8.86 |
| T+: 210, T-: 0 | T+: 210, T-: 0 | T+: 210, T-: 0 | T+: 210, T-: 0 | T+: 210, T-: 0 | T+: 210, T-: 0 | T+: 210, T-: 0 | T+: 210, T-: 0 | T+: 210, T-: 0 | T+: 210, T-: 0 | T+: 210, T-: 0 | |
| Z: −3.9199, SRN: 0.0000 | Z: −3.9199, SRN: 0.0000 | Z: −3.9199, SRN: 0.0000 | Z: −3.9199, SRN: 0.0000 | Z: −3.9199, SRN: 0.0000 | Z: −3.9199, SRN: 0.0000 | Z: −3.9199, SRN: 0.0000 | Z: −3.9199, SRN: 0.0000 | Z: −3.9199, SRN: 0.0000 | Z: −3.9199, SRN: 0.0000 | Z: −3.9199, SRN: 0.0000 | |
| F6 | 8.86 | 8.86 | 8.86 | 8.86 | 8.86 | 8.86 | 8.86 | 8.86 | 8.86 | 8.86 | 8.86 |
| T+: 210, T-: 0 | T+: 210, T-: 0 | T+: 210, T-: 0 | T+: 210, T-: 0 | T+: 210, T-: 0 | T+: 210, T-: 0 | T+: 210, T-: 0 | T+: 210, T-: 0 | T+: 210, T-: 0 | T+: 210, T-: 0 | T+: 210, T-: 0 | |
| Z: −3.9199, SRN: 0.0000 | Z: −3.9199, SRN: 0.0000 | Z: −3.9199, SRN: 0.0000 | Z: −3.9199, SRN: 0.0000 | Z: −3.9199, SRN: 0.0000 | Z: −3.9199, SRN: 0.0000 | Z: −3.9199, SRN: 0.0000 | Z: −3.9199, SRN: 0.0000 | Z: −3.9199, SRN: 0.0000 | Z: −3.9199, SRN: 0.0000 | Z: −3.9199, SRN: 0.0000 | |
| F7 | 8.86 | 8.86 | 0.000338 | 0.000103 | 0.178956 | 0.00078 | 0.00014 | 8.86 | 0.000103 | 0.00014 | 0.000219 |
| T+: 210, T-: 0 | T+: 210, T-: 0 | T+: 201, T-: 9 | T+: 209, T-: 1 | T+: 141, T-: 69 | T+: 195, T-: 15 | T+: 207, T-: 3 | T+: 210, T-: 0 | T+: 209, T-: 1 | T+: 207, T-: 3 | T+: 204, T-: 6 | |
| Z: −3.9199, SRN: 0.0000 | Z: −3.9199, SRN: 0.0000 | Z: −3.5839, SRN: 9.0000 | Z: −3.8826, SRN: 1.0000 | Z: −1.3440, SRN: 69.0000 | Z: −3.3599, SRN: 15.0000 | Z: −3.8079, SRN: 3.0000 | Z: −3.9199, SRN: 0.0000 | Z: −3.8826, SRN: 1.0000 | Z: −3.8079, SRN: 3.0000 | Z: −3.6959, SRN: 6.0000 | |
| F8 | 0.00078 | 0.000103 | 0.001507 | 0.000254 | 0.00014 | 0.000254 | 0.000254 | 0.000681 | 0.000103 | 8.86 | 0.00039 |
| T+: 195, T-: 15 | T+: 209, T-: 1 | T+: 190, T-: 20 | T+: 203, T-: 7 | T+: 207, T-: 3 | T+: 203, T-: 7 | T+: 203, T-: 7 | T+: 196, T-: 14 | T+: 209, T-: 1 | T+: 210, T-: 0 | T+: 200, T-: 10 | |
| Z: −3.3599, SRN: 15.0000 | Z: −3.8826, SRN: 1.0000 | Z: −3.1733, SRN: 20.0000 | Z: −3.6586, SRN: 7.0000 | Z: −3.8079, SRN: 3.0000 | Z: −3.6586, SRN: 7.0000 | Z: −3.6586, SRN: 7.0000 | Z: −3.3973, SRN: 14.0000 | Z: −3.8826, SRN: 1.0000 | Z: −3.9199, SRN: 0.0000 | Z: −3.5466, SRN: 10.0000 | |
| F9 | 8.86 | 8.86 | 8.86 | 8.86 | 8.86 | 8.86 | 8.86 | 8.86 | 8.86 | 8.86 | 8.86 |
| T+: 210, T-: 0 | T+: 210, T-: 0 | T+: 210, T-: 0 | T+: 210, T-: 0 | T+: 210, T-: 0 | T+: 210, T-: 0 | T+: 210, T-: 0 | T+: 210, T-: 0 | T+: 210, T-: 0 | T+: 210, T-: 0 | T+: 210, T-: 0 | |
| Z: −3.9199, SRN: 0.0000 | Z: −3.9199, SRN: 0.0000 | Z: −3.9199, SRN: 0.0000 | Z: −3.9199, SRN: 0.0000 | Z: −3.9199, SRN: 0.0000 | Z: −3.9199, SRN: 0.0000 | Z: −3.9199, SRN: 0.0000 | Z: −3.9199, SRN: 0.0000 | Z: −3.9199, SRN: 0.0000 | Z: −3.9199, SRN: 0.0000 | Z: −3.9199, SRN: 0.0000 | |
| F10 | 8.86 | 8.86 | 8.86 | 0.000103 | 0.00012 | 0.000189 | 8.86 | 8.86 | 0.000103 | 0.000103 | 8.86 |
| T+: 210, T-: 0 | T+: 210, T-: 0 | T+: 210, T-: 0 | T+: 209, T-: 1 | T+: 208, T-: 2 | T+: 205, T-: 5 | T+: 210, T-: 0 | T+: 210, T-: 0 | T+: 209, T-: 1 | T+: 209, T-: 1 | T+: 210, T-: 0 | |
| Z: −3.9199, SRN: 0.0000 | Z: −3.9199, SRN: 0.0000 | Z: −3.9199, SRN: 0.0000 | Z: −3.8826, SRN: 1.0000 | Z: −3.8453, SRN: 2.0000 | Z: −3.7333, SRN: 5.0000 | Z: −3.9199, SRN: 0.0000 | Z: −3.9199, SRN: 0.0000 | Z: −3.8826, SRN: 1.0000 | Z: −3.8826, SRN: 1.0000 | Z: −3.9199, SRN: 0.0000 | |
| F11 | 8.86 | 8.86 | 8.86 | 8.86 | 8.86 | 8.86 | 8.86 | 8.86 | 8.86 | 8.86 | 8.86 |
| T+: 210, T-: 0 | T+: 210, T-: 0 | T+: 210, T-: 0 | T+: 210, T-: 0 | T+: 210, T-: 0 | T+: 210, T-: 0 | T+: 210, T-: 0 | T+: 210, T-: 0 | T+: 210, T-: 0 | T+: 210, T-: 0 | T+: 210, T-: 0 | |
| Z: −3.9199, SRN: 0.0000 | Z: −3.9199, SRN: 0.0000 | Z: −3.9199, SRN: 0.0000 | Z: −3.9199, SRN: 0.0000 | Z: −3.9199, SRN: 0.0000 | Z: −3.9199, SRN: 0.0000 | Z: −3.9199, SRN: 0.0000 | Z: −3.9199, SRN: 0.0000 | Z: −3.9199, SRN: 0.0000 | Z: −3.9199, SRN: 0.0000 | Z: −3.9199, SRN: 0.0000 | |
| F12 | 0.000681 | 8.86 | 0.011129 | 0.00012 | 8.86 | 0.000103 | 0.000517 | 8.86 | 8.86 | 8.86 | 8.86 |
| T+: 196, T-: 14 | T+: 210, T-: 0 | T+: 173, T-: 37 | T+: 208, T-: 2 | T+: 210, T-: 0 | T+: 209, T-: 1 | T+: 198, T-: 12 | T+: 210, T-: 0 | T+: 210, T-: 0 | T+: 210, T-: 0 | T+: 210, T-: 0 | |
| Total | +:11, -:0, =:1 | +:11, -:0, =:1 | +:11, -:0, =:1 | +:11, -:0, =:1 | +:10, -:0, =:2 | +:12, -:0, =:0 | +:11, -:0, =:1 | +:12, -:0, =:0 | +:12, -:0, =:0 | +:12, -:0, =:0 | +:12, -:0, =:0 |

Table A6.
Wilcoxon Signed Results part 2.
Table A6.
Wilcoxon Signed Results part 2.
| Function | ZOA | GJO | HHO | WOA | HGSO | HLOA | TTHHO | GBO | CPO | DOA | FOX |
|---|---|---|---|---|---|---|---|---|---|---|---|
| F1 | 8.86 | 8.86 | 8.86 | 8.86 | 8.86 | 8.86 | 8.86 | 8.86 | 8.86 | 8.86 | 8.86 |
| T+: 210, T-: 0 | T+: 210, T-: 0 | T+: 210, T-: 0 | T+: 210, T-: 0 | T+: 210, T-: 0 | T+: 210, T-: 0 | T+: 210, T-: 0 | T+: 210, T-: 0 | T+: 210, T-: 0 | T+: 210, T-: 0 | T+: 210, T-: 0 | |
| Z: −3.9199, SRN: 0.0000 | Z: −3.9199, SRN: 0.0000 | Z: −3.9199, SRN: 0.0000 | Z: −3.9199, SRN: 0.0000 | Z: −3.9199, SRN: 0.0000 | Z: −3.9199, SRN: 0.0000 | Z: −3.9199, SRN: 0.0000 | Z: −3.9199, SRN: 0.0000 | Z: −3.9199, SRN: 0.0000 | Z: −3.9199, SRN: 0.0000 | Z: −3.9199, SRN: 0.0000 | |
| F2 | 0.001019 | 8.86 | 0.002204 | 8.86 | 8.86 | 0.001713 | 0.005111 | 8.86 | 0.016881 | 8.86 | 0.036561 |
| T+: 193, T-: 17 | T+: 210, T-: 0 | T+: 187, T-: 23 | T+: 210, T-: 0 | T+: 210, T-: 0 | T+: 189, T-: 21 | T+: 180, T-: 30 | T+: 210, T-: 0 | T+: 169, T-: 41 | T+: 210, T-: 0 | T+: 161, T-: 49 | |
| Z: −3.2853, SRN: 17.0000 | Z: −3.9199, SRN: 0.0000 | Z: −3.0613, SRN: 23.0000 | Z: −3.9199, SRN: 0.0000 | Z: −3.9199, SRN: 0.0000 | Z: −3.1359, SRN: 21.0000 | Z: −2.8000, SRN: 30.0000 | Z: −3.9199, SRN: 0.0000 | Z: −2.3893, SRN: 41.0000 | Z: −3.9199, SRN: 0.0000 | Z: −2.0906, SRN: 49.0000 | |
| F3 | 8.86 | 8.86 | 8.86 | 8.86 | 8.86 | 8.86 | 8.86 | 8.86 | 8.86 | 8.86 | 8.86 |
| T+: 210, T-: 0 | T+: 210, T-: 0 | T+: 210, T-: 0 | T+: 210, T-: 0 | T+: 210, T-: 0 | T+: 210, T-: 0 | T+: 210, T-: 0 | T+: 210, T-: 0 | T+: 210, T-: 0 | T+: 210, T-: 0 | T+: 210, T-: 0 | |
| Z: −3.9199, SRN: 0.0000 | Z: −3.9199, SRN: 0.0000 | Z: −3.9199, SRN: 0.0000 | Z: −3.9199, SRN: 0.0000 | Z: −3.9199, SRN: 0.0000 | Z: −3.9199, SRN: 0.0000 | Z: −3.9199, SRN: 0.0000 | Z: −3.9199, SRN: 0.0000 | Z: −3.9199, SRN: 0.0000 | Z: −3.9199, SRN: 0.0000 | Z: −3.9199, SRN: 0.0000 | |
| F4 | 0.000681 | 8.86 | 8.86 | 8.86 | 8.86 | 8.86 | 0.000103 | 8.86 | 8.86 | 0.000103 | 8.86 |
| T+: 196, T-: 14 | T+: 210, T-: 0 | T+: 210, T-: 0 | T+: 210, T-: 0 | T+: 210, T-: 0 | T+: 210, T-: 0 | T+: 209, T-: 1 | T+: 210, T-: 0 | T+: 210, T-: 0 | T+: 209, T-: 1 | T+: 210, T-: 0 | |
| Z: −3.3973, SRN: 14.0000 | Z: −3.9199, SRN: 0.0000 | Z: −3.9199, SRN: 0.0000 | Z: −3.9199, SRN: 0.0000 | Z: −3.9199, SRN: 0.0000 | Z: −3.9199, SRN: 0.0000 | Z: −3.8826, SRN: 1.0000 | Z: −3.9199, SRN: 0.0000 | Z: −3.9199, SRN: 0.0000 | Z: −3.8826, SRN: 1.0000 | Z: −3.9199, SRN: 0.0000 | |
| F5 | 8.86 | 8.86 | 8.86 | 8.86 | 8.86 | 8.86 | 8.86 | 8.86 | 8.86 | 8.86 | 8.86 |
| T+: 210, T-: 0 | T+: 210, T-: 0 | T+: 210, T-: 0 | T+: 210, T-: 0 | T+: 210, T-: 0 | T+: 210, T-: 0 | T+: 210, T-: 0 | T+: 210, T-: 0 | T+: 210, T-: 0 | T+: 210, T-: 0 | T+: 210, T-: 0 | |
| Z: −3.9199, SRN: 0.0000 | Z: −3.9199, SRN: 0.0000 | Z: −3.9199, SRN: 0.0000 | Z: −3.9199, SRN: 0.0000 | Z: −3.9199, SRN: 0.0000 | Z: −3.9199, SRN: 0.0000 | Z: −3.9199, SRN: 0.0000 | Z: −3.9199, SRN: 0.0000 | Z: −3.9199, SRN: 0.0000 | Z: −3.9199, SRN: 0.0000 | Z: −3.9199, SRN: 0.0000 | |
| F6 | 8.86 | 8.86 | 8.86 | 8.86 | 8.86 | 8.86 | 8.86 | 8.86 | 8.86 | 8.86 | 8.86 |
| T+: 210, T-: 0 | T+: 210, T-: 0 | T+: 210, T-: 0 | T+: 210, T-: 0 | T+: 210, T-: 0 | T+: 210, T-: 0 | T+: 210, T-: 0 | T+: 210, T-: 0 | T+: 210, T-: 0 | T+: 210, T-: 0 | T+: 210, T-: 0 | |
| Z: −3.9199, SRN: 0.0000 | Z: −3.9199, SRN: 0.0000 | Z: −3.9199, SRN: 0.0000 | Z: −3.9199, SRN: 0.0000 | Z: −3.9199, SRN: 0.0000 | Z: −3.9199, SRN: 0.0000 | Z: −3.9199, SRN: 0.0000 | Z: −3.9199, SRN: 0.0000 | Z: −3.9199, SRN: 0.0000 | Z: −3.9199, SRN: 0.0000 | Z: −3.9199, SRN: 0.0000 | |
| F7 | 8.86 | 0.000103 | 8.86 | 8.86 | 8.86 | 8.86 | 8.86 | 8.86 | 8.86 | 8.86 | 8.86 |
| T+: 210, T-: 0 | T+: 209, T-: 1 | T+: 210, T-: 0 | T+: 210, T-: 0 | T+: 210, T-: 0 | T+: 210, T-: 0 | T+: 210, T-: 0 | T+: 210, T-: 0 | T+: 210, T-: 0 | T+: 210, T-: 0 | T+: 210, T-: 0 | |
| Z: −3.9199, SRN: 0.0000 | Z: −3.8826, SRN: 1.0000 | Z: −3.9199, SRN: 0.0000 | Z: −3.9199, SRN: 0.0000 | Z: −3.9199, SRN: 0.0000 | Z: −3.9199, SRN: 0.0000 | Z: −3.9199, SRN: 0.0000 | Z: −3.9199, SRN: 0.0000 | Z: −3.9199, SRN: 0.0000 | Z: −3.9199, SRN: 0.0000 | Z: −3.9199, SRN: 0.0000 | |
| F8 | 0.000219 | 0.000189 | 8.86 | 0.00014 | 8.86 | 8.86 | 8.86 | 8.86 | 0.000103 | 8.86 | 8.86 |
| T+: 204, T-: 6 | T+: 205, T-: 5 | T+: 210, T-: 0 | T+: 207, T-: 3 | T+: 210, T-: 0 | T+: 210, T-: 0 | T+: 210, T-: 0 | T+: 210, T-: 0 | T+: 209, T-: 1 | T+: 210, T-: 0 | T+: 210, T-: 0 | |
| Z: −3.6959, SRN: 6.0000 | Z: −3.7333, SRN: 5.0000 | Z: −3.9199, SRN: 0.0000 | Z: −3.8079, SRN: 3.0000 | Z: −3.9199, SRN: 0.0000 | Z: −3.9199, SRN: 0.0000 | Z: −3.9199, SRN: 0.0000 | Z: −3.9199, SRN: 0.0000 | Z: −3.8826, SRN: 1.0000 | Z: −3.9199, SRN: 0.0000 | Z: −3.9199, SRN: 0.0000 | |
| F9 | 8.86 | 8.86 | 8.86 | 8.86 | 8.86 | 8.86 | 8.86 | 8.86 | 8.86 | 8.86 | 8.86 |
| T+: 210, T-: 0 | T+: 210, T-: 0 | T+: 210, T-: 0 | T+: 210, T-: 0 | T+: 210, T-: 0 | T+: 210, T-: 0 | T+: 210, T-: 0 | T+: 210, T-: 0 | T+: 210, T-: 0 | T+: 210, T-: 0 | T+: 210, T-: 0 | |
| Z: −3.9199, SRN: 0.0000 | Z: −3.9199, SRN: 0.0000 | Z: −3.9199, SRN: 0.0000 | Z: −3.9199, SRN: 0.0000 | Z: −3.9199, SRN: 0.0000 | Z: −3.9199, SRN: 0.0000 | Z: −3.9199, SRN: 0.0000 | Z: −3.9199, SRN: 0.0000 | Z: −3.9199, SRN: 0.0000 | Z: −3.9199, SRN: 0.0000 | Z: −3.9199, SRN: 0.0000 | |
| F10 | 8.86 | 8.86 | 8.86 | 8.86 | 8.86 | 8.86 | 8.86 | 8.86 | 8.86 | 8.86 | 8.86 |
| T+: 210, T-: 0 | T+: 210, T-: 0 | T+: 210, T-: 0 | T+: 210, T-: 0 | T+: 210, T-: 0 | T+: 210, T-: 0 | T+: 210, T-: 0 | T+: 210, T-: 0 | T+: 210, T-: 0 | T+: 210, T-: 0 | T+: 210, T-: 0 | |
| Z: −3.9199, SRN: 0.0000 | Z: −3.9199, SRN: 0.0000 | Z: −3.9199, SRN: 0.0000 | Z: −3.9199, SRN: 0.0000 | Z: −3.9199, SRN: 0.0000 | Z: −3.9199, SRN: 0.0000 | Z: −3.9199, SRN: 0.0000 | Z: −3.9199, SRN: 0.0000 | Z: −3.9199, SRN: 0.0000 | Z: −3.9199, SRN: 0.0000 | Z: −3.9199, SRN: 0.0000 | |
| F11 | 8.86 | 8.86 | 8.86 | 8.86 | 8.86 | 8.86 | 8.86 | 8.86 | 8.86 | 8.86 | 8.86 |
| T+: 210, T-: 0 | T+: 210, T-: 0 | T+: 210, T-: 0 | T+: 210, T-: 0 | T+: 210, T-: 0 | T+: 210, T-: 0 | T+: 210, T-: 0 | T+: 210, T-: 0 | T+: 210, T-: 0 | T+: 210, T-: 0 | T+: 210, T-: 0 | |
| Z: −3.9199, SRN: 0.0000 | Z: −3.9199, SRN: 0.0000 | Z: −3.9199, SRN: 0.0000 | Z: −3.9199, SRN: 0.0000 | Z: −3.9199, SRN: 0.0000 | Z: −3.9199, SRN: 0.0000 | Z: −3.9199, SRN: 0.0000 | Z: −3.9199, SRN: 0.0000 | Z: −3.9199, SRN: 0.0000 | Z: −3.9199, SRN: 0.0000 | Z: −3.9199, SRN: 0.0000 | |
| F12 | 8.86 | 8.86 | 8.86 | 8.86 | 8.86 | 8.86 | 8.86 | 8.86 | 8.86 | 8.86 | 8.86 |
| T+: 210, T-: 0 | T+: 210, T-: 0 | T+: 210, T-: 0 | T+: 210, T-: 0 | T+: 210, T-: 0 | T+: 210, T-: 0 | T+: 210, T-: 0 | T+: 210, T-: 0 | T+: 210, T-: 0 | T+: 210, T-: 0 | T+: 210, T-: 0 | |
| Total | +:12, -:0, =:0 | +:12, -:0, =:0 | +:12, -:0, =:0 | +:12, -:0, =:0 | +:12, -:0, =:0 | +:12, -:0, =:0 | +:12, -:0, =:0 | +:12, -:0, =:0 | +:12, -:0, =:0 | +:12, -:0, =:0 | +:12, -:0, =:0 |

Table A7.
Wilcoxon Signed Results part 3.
Table A7.
Wilcoxon Signed Results part 3.
| Function | SMA | TSO | Chimp | AOA | ROA | RSA | FLO | SPBO | SSOA | OHO |
|---|---|---|---|---|---|---|---|---|---|---|
| F1 | 8.86 | 8.86 | 8.86 | 8.86 | 8.86 | 8.86 | 8.86 | 8.86 | 8.86 | 8.86 |
| T+: 210, T-: 0 | T+: 210, T-: 0 | T+: 210, T-: 0 | T+: 210, T-: 0 | T+: 210, T-: 0 | T+: 210, T-: 0 | T+: 210, T-: 0 | T+: 210, T-: 0 | T+: 210, T-: 0 | T+: 210, T-: 0 | |
| Z: −3.9199, SRN: 0.0000 | Z: −3.9199, SRN: 0.0000 | Z: −3.9199, SRN: 0.0000 | Z: −3.9199, SRN: 0.0000 | Z: −3.9199, SRN: 0.0000 | Z: −3.9199, SRN: 0.0000 | Z: −3.9199, SRN: 0.0000 | Z: −3.9199, SRN: 0.0000 | Z: −3.9199, SRN: 0.0000 | Z: −3.9199, SRN: 0.0000 | |
| F2 | 0.004045 | 0.027621 | 8.86 | 8.86 | 8.86 | 8.86 | 8.86 | 8.86 | 8.86 | 8.86 |
| T+: 182, T-: 28 | T+: 164, T-: 46 | T+: 210, T-: 0 | T+: 210, T-: 0 | T+: 210, T-: 0 | T+: 210, T-: 0 | T+: 210, T-: 0 | T+: 210, T-: 0 | T+: 210, T-: 0 | T+: 210, T-: 0 | |
| Z: −2.8746, SRN: 28.0000 | Z: −2.2026, SRN: 46.0000 | Z: −3.9199, SRN: 0.0000 | Z: −3.9199, SRN: 0.0000 | Z: −3.9199, SRN: 0.0000 | Z: −3.9199, SRN: 0.0000 | Z: −3.9199, SRN: 0.0000 | Z: −3.9199, SRN: 0.0000 | Z: −3.9199, SRN: 0.0000 | Z: −3.9199, SRN: 0.0000 | |
| F3 | 8.86 | 8.86 | 8.86 | 8.86 | 8.86 | 8.86 | 8.86 | 8.86 | 8.86 | 8.86 |
| T+: 210, T-: 0 | T+: 210, T-: 0 | T+: 210, T-: 0 | T+: 210, T-: 0 | T+: 210, T-: 0 | T+: 210, T-: 0 | T+: 210, T-: 0 | T+: 210, T-: 0 | T+: 210, T-: 0 | T+: 210, T-: 0 | |
| Z: −3.9199, SRN: 0.0000 | Z: −3.9199, SRN: 0.0000 | Z: −3.9199, SRN: 0.0000 | Z: −3.9199, SRN: 0.0000 | Z: −3.9199, SRN: 0.0000 | Z: −3.9199, SRN: 0.0000 | Z: −3.9199, SRN: 0.0000 | Z: −3.9199, SRN: 0.0000 | Z: −3.9199, SRN: 0.0000 | Z: −3.9199, SRN: 0.0000 | |
| F4 | 8.86 | 8.86 | 8.86 | 8.86 | 8.86 | 8.86 | 8.86 | 8.86 | 8.86 | 8.86 |
| T+: 210, T-: 0 | T+: 210, T-: 0 | T+: 210, T-: 0 | T+: 210, T-: 0 | T+: 210, T-: 0 | T+: 210, T-: 0 | T+: 210, T-: 0 | T+: 210, T-: 0 | T+: 210, T-: 0 | T+: 210, T-: 0 | |
| Z: −3.9199, SRN: 0.0000 | Z: −3.9199, SRN: 0.0000 | Z: −3.9199, SRN: 0.0000 | Z: −3.9199, SRN: 0.0000 | Z: −3.9199, SRN: 0.0000 | Z: −3.9199, SRN: 0.0000 | Z: −3.9199, SRN: 0.0000 | Z: −3.9199, SRN: 0.0000 | Z: −3.9199, SRN: 0.0000 | Z: −3.9199, SRN: 0.0000 | |
| F5 | 8.86 | 8.86 | 8.86 | 8.86 | 8.86 | 8.86 | 8.86 | 8.86 | 8.86 | 8.86 |
| T+: 210, T-: 0 | T+: 210, T-: 0 | T+: 210, T-: 0 | T+: 210, T-: 0 | T+: 210, T-: 0 | T+: 210, T-: 0 | T+: 210, T-: 0 | T+: 210, T-: 0 | T+: 210, T-: 0 | T+: 210, T-: 0 | |
| Z: −3.9199, SRN: 0.0000 | Z: −3.9199, SRN: 0.0000 | Z: −3.9199, SRN: 0.0000 | Z: −3.9199, SRN: 0.0000 | Z: −3.9199, SRN: 0.0000 | Z: −3.9199, SRN: 0.0000 | Z: −3.9199, SRN: 0.0000 | Z: −3.9199, SRN: 0.0000 | Z: −3.9199, SRN: 0.0000 | Z: −3.9199, SRN: 0.0000 | |
| F6 | 8.86 | 8.86 | 8.86 | 8.86 | 8.86 | 8.86 | 8.86 | 8.86 | 8.86 | 8.86 |
| T+: 210, T-: 0 | T+: 210, T-: 0 | T+: 210, T-: 0 | T+: 210, T-: 0 | T+: 210, T-: 0 | T+: 210, T-: 0 | T+: 210, T-: 0 | T+: 210, T-: 0 | T+: 210, T-: 0 | T+: 210, T-: 0 | |
| Z: −3.9199, SRN: 0.0000 | Z: −3.9199, SRN: 0.0000 | Z: −3.9199, SRN: 0.0000 | Z: −3.9199, SRN: 0.0000 | Z: −3.9199, SRN: 0.0000 | Z: −3.9199, SRN: 0.0000 | Z: −3.9199, SRN: 0.0000 | Z: −3.9199, SRN: 0.0000 | Z: −3.9199, SRN: 0.0000 | Z: −3.9199, SRN: 0.0000 | |
| F7 | 8.86 | 8.86 | 8.86 | 8.86 | 8.86 | 8.86 | 8.86 | 8.86 | 8.86 | 8.86 |
| T+: 210, T-: 0 | T+: 210, T-: 0 | T+: 210, T-: 0 | T+: 210, T-: 0 | T+: 210, T-: 0 | T+: 210, T-: 0 | T+: 210, T-: 0 | T+: 210, T-: 0 | T+: 210, T-: 0 | T+: 210, T-: 0 | |
| Z: −3.9199, SRN: 0.0000 | Z: −3.9199, SRN: 0.0000 | Z: −3.9199, SRN: 0.0000 | Z: −3.9199, SRN: 0.0000 | Z: −3.9199, SRN: 0.0000 | Z: −3.9199, SRN: 0.0000 | Z: −3.9199, SRN: 0.0000 | Z: −3.9199, SRN: 0.0000 | Z: −3.9199, SRN: 0.0000 | Z: −3.9199, SRN: 0.0000 | |
| F8 | 8.86 | 8.86 | 8.86 | 8.86 | 8.86 | 8.86 | 8.86 | 8.86 | 8.86 | 8.86 |
| T+: 210, T-: 0 | T+: 210, T-: 0 | T+: 210, T-: 0 | T+: 210, T-: 0 | T+: 210, T-: 0 | T+: 210, T-: 0 | T+: 210, T-: 0 | T+: 210, T-: 0 | T+: 210, T-: 0 | T+: 210, T-: 0 | |
| Z: −3.9199, SRN: 0.0000 | Z: −3.9199, SRN: 0.0000 | Z: −3.9199, SRN: 0.0000 | Z: −3.9199, SRN: 0.0000 | Z: −3.9199, SRN: 0.0000 | Z: −3.9199, SRN: 0.0000 | Z: −3.9199, SRN: 0.0000 | Z: −3.9199, SRN: 0.0000 | Z: −3.9199, SRN: 0.0000 | Z: −3.9199, SRN: 0.0000 | |
| F9 | 8.86 | 8.86 | 8.86 | 8.86 | 8.86 | 8.86 | 8.86 | 8.86 | 8.86 | 8.86 |
| T+: 210, T-: 0 | T+: 210, T-: 0 | T+: 210, T-: 0 | T+: 210, T-: 0 | T+: 210, T-: 0 | T+: 210, T-: 0 | T+: 210, T-: 0 | T+: 210, T-: 0 | T+: 210, T-: 0 | T+: 210, T-: 0 | |
| Z: −3.9199, SRN: 0.0000 | Z: −3.9199, SRN: 0.0000 | Z: −3.9199, SRN: 0.0000 | Z: −3.9199, SRN: 0.0000 | Z: −3.9199, SRN: 0.0000 | Z: −3.9199, SRN: 0.0000 | Z: −3.9199, SRN: 0.0000 | Z: −3.9199, SRN: 0.0000 | Z: −3.9199, SRN: 0.0000 | Z: −3.9199, SRN: 0.0000 | |
| F10 | 8.86 | 8.86 | 8.86 | 8.86 | 8.86 | 8.86 | 8.86 | 8.86 | 8.86 | 8.86 |
| T+: 210, T-: 0 | T+: 210, T-: 0 | T+: 210, T-: 0 | T+: 210, T-: 0 | T+: 210, T-: 0 | T+: 210, T-: 0 | T+: 210, T-: 0 | T+: 210, T-: 0 | T+: 210, T-: 0 | T+: 210, T-: 0 | |
| Z: −3.9199, SRN: 0.0000 | Z: −3.9199, SRN: 0.0000 | Z: −3.9199, SRN: 0.0000 | Z: −3.9199, SRN: 0.0000 | Z: −3.9199, SRN: 0.0000 | Z: −3.9199, SRN: 0.0000 | Z: −3.9199, SRN: 0.0000 | Z: −3.9199, SRN: 0.0000 | Z: −3.9199, SRN: 0.0000 | Z: −3.9199, SRN: 0.0000 | |
| F11 | 8.86 | 8.86 | 8.86 | 8.86 | 8.86 | 8.86 | 8.86 | 8.86 | 8.86 | 8.86 |
| T+: 210, T-: 0 | T+: 210, T-: 0 | T+: 210, T-: 0 | T+: 210, T-: 0 | T+: 210, T-: 0 | T+: 210, T-: 0 | T+: 210, T-: 0 | T+: 210, T-: 0 | T+: 210, T-: 0 | T+: 210, T-: 0 | |
| Z: −3.9199, SRN: 0.0000 | Z: −3.9199, SRN: 0.0000 | Z: −3.9199, SRN: 0.0000 | Z: −3.9199, SRN: 0.0000 | Z: −3.9199, SRN: 0.0000 | Z: −3.9199, SRN: 0.0000 | Z: −3.9199, SRN: 0.0000 | Z: −3.9199, SRN: 0.0000 | Z: −3.9199, SRN: 0.0000 | Z: −3.9199, SRN: 0.0000 | |
| F12 | 8.86 | 8.86 | 8.86 | 8.86 | 8.86 | 8.86 | 8.86 | 8.86 | 8.86 | 8.86 |
| T+: 210, T-: 0 | T+: 210, T-: 0 | T+: 210, T-: 0 | T+: 210, T-: 0 | T+: 210, T-: 0 | T+: 210, T-: 0 | T+: 210, T-: 0 | T+: 210, T-: 0 | T+: 210, T-: 0 | T+: 210, T-: 0 | |
| Total | +:12, -:0, =:0 | +:12, -:0, =:0 | +:12, -:0, =:0 | +:12, -:0, =:0 | +:12, -:0, =:0 | +:12, -:0, =:0 | +:12, -:0, =:0 | +:12, -:0, =:0 | +:12, -:0, =:0 | +:12, -:0, =:0 |
Appendix A.1. Cantilever Stepped Beam
Decision variables:
Objective:
Constraint:
Appendix A.2. Three-Bar Truss
Decision variables:
Parameters:
Objective (weight/volume):
Stress constraints:
Appendix A.3. Welded Beam
Decision variables:
Parameters:
Objective (cost):
Derived quantities:
Constraints:
Appendix A.4. Planetary Gear Train
Decision variables:
Parameters:
Speed ratios:
Objective (match target ratios above their targets):
Auxiliary angle:
Constraints:
Appendix A.5. Robot Gripper
Decision variables:
Parameters:
Kinematic angles:
Openings:
Gripping force along the stroke: for , let
Objective (minimize force nonuniformity over the stroke):
Constraints:
(As in the code, arguments of and square roots must remain real; complex values are penalized.)
References
- Bhandari, A.; Kumar, A.; Chaudhary, S.; Singh, G. A novel color image multilevel thresholding based segmentation using nature inspired optimization algorithms. Expert Syst. Appl. 2016, 63, 112–133. [Google Scholar] [CrossRef]
- Oftadeh, R.; Mahjoob, M.; Shariatpanahi, M. A novel meta-heuristic optimization algorithm inspired by group hunting of animals: Hunting search. Comput. Math. Appl. 2010, 60, 2087–2098. [Google Scholar] [CrossRef]
- Christy, A.; Raj, P.A.D.V.; Padmanaban, S.; Selvamuthukumaran, R.; Ertas, A.H. A bio-inspired novel optimization technique for reactive power flow. Eng. Sci. Technol. Int. J. 2016, 19, 1682–1692. [Google Scholar] [CrossRef]
- Dhiman, G.; Kumar, V. Spotted hyena optimizer: A novel bio-inspired based metaheuristic technique for engineering applications. Adv. Eng. Softw. 2017, 114, 48–70. [Google Scholar] [CrossRef]
- Chopra, N.; Mohsin Ansari, M. Golden jackal optimization: A novel nature-inspired optimizer for engineering applications. Expert Syst. Appl. 2022, 198, 116924. [Google Scholar] [CrossRef]
- Li, S.; Sun, Y. A novel numerical optimization algorithm inspired from garden balsam. Neural Comput. Appl. 2020, 32, 16783–16794. [Google Scholar] [CrossRef]
- Chou, J.S.; Truong, D.N. A novel metaheuristic optimizer inspired by behavior of jellyfish in ocean. Appl. Math. Comput. 2021, 389. [Google Scholar] [CrossRef]
- Zhao, W.; Wang, L.; Zhang, Z. Supply-Demand-Based Optimization: A Novel Economics-Inspired Algorithm for Global Optimization. IEEE Access 2019, 7, 73182–73206. [Google Scholar] [CrossRef]
- Abdel-Basset, M.; Mohamed, R.; Sallam, K.M.; Chakrabortty, R.K. Light Spectrum Optimizer: A Novel Physics-Inspired Metaheuristic Optimization Algorithm. Mathematics 2022, 10, 3466. [Google Scholar] [CrossRef]
- Braik, M.; Al-Hiary, H.; Alzoubi, H.; Hammouri, A.; Azmi Al-Betar, M.; Awadallah, M.A. Tornado optimizer with Coriolis force: A novel bio-inspired meta-heuristic algorithm for solving engineering problems. Artif. Intell. Rev. 2025, 58, 123. [Google Scholar] [CrossRef]
- Tao, L.; Yang, X.; Zhou, Y.; Yang, L. A novel transformers fault diagnosis method based on probabilistic neural network and bio-inspired optimizer. Sensors 2021, 21, 3623. [Google Scholar] [CrossRef]
- Hou, G.; Fan, Y.; Wang, J. Application of a novel dynamic recurrent fuzzy neural network with rule self-adaptation based on chaotic quantum pigeon-inspired optimization in modeling for gas turbine. Energy 2024, 290, 130188. [Google Scholar] [CrossRef]
- Ghanbari, S.; Ghasabehi, M.; Asadi, M.R.; Shams, M. An inquiry into transport phenomena and artificial intelligence-based optimization of a novel bio-inspired flow field for proton exchange membrane fuel cells. Appl. Energy 2024, 376, 124260. [Google Scholar] [CrossRef]
- Chiang, H.S.; Sangaiah, A.K.; Chen, M.Y.; Liu, J.Y. A Novel Artificial Bee Colony Optimization Algorithm with SVM for Bio-inspired Software-Defined Networking. Int. J. Parallel Program. 2020, 48, 310–328. [Google Scholar] [CrossRef]
- Panigrahi, B.S.; Nagarajan, N.; Prasad, K.D.V.; Sathya; Salunkhe, S.S.; Kumar, P.D.; Kumar, M.A. Novel nature-inspired optimization approach-based svm for identifying the android malicious data. Multimed. Tools Appl. 2024, 83, 71579–71597. [Google Scholar] [CrossRef]
- Wang, H.; Hu, Z.; Sun, Y.; Su, Q.; Xia, X. A novel modified BSA inspired by species evolution rule and simulated annealing principle for constrained engineering optimization problems. Neural Comput. Appl. 2019, 31, 4157–4184. [Google Scholar] [CrossRef]
- Lin, N.; Fu, L.; Zhao, L.; Hawbani, A.; Tan, Z.; Al-Dubai, A.; Min, G. A novel nomad migration-inspired algorithm for global optimization. Comput. Electr. Eng. 2022, 100, 107862. [Google Scholar] [CrossRef]
- Alvarez-Alvarado, M.S.; Alban-Chacón, F.E.; Lamilla-Rubio, E.A.; Rodríguez-Gallegos, C.D.; Velásquez, W. Three novel quantum-inspired swarm optimization algorithms using different bounded potential fields. Sci. Rep. 2021, 11, 11655. [Google Scholar] [CrossRef]
- Pandya, S.B.; Kalita, K.; Jangir, P.; Ghadai, R.K.; Abualigah, L. Multi-objective Geometric Mean Optimizer (MOGMO): A Novel Metaphor-Free Population-Based Math-Inspired Multi-objective Algorithm. Int. J. Comput. Intell. Syst. 2024, 17, 91. [Google Scholar] [CrossRef]
- Yang, Y.; Yang, Z.; Yang, Z. Improved Graph Neural Network with Graph Filtering Kernel and Generalized Nonconvex Norm Inspired by a Novel Unified Optimization Framework. Circuits Syst. Signal Process. 2024, 44, 1239–1259. [Google Scholar] [CrossRef]
- Amiri, M.H.; Mehrabi Hashjin, N.; Montazeri, M.; Mirjalili, S.; Khodadadi, N. Hippopotamus optimization algorithm: A novel nature-inspired optimization algorithm. Sci. Rep. 2024, 14, 5032. [Google Scholar] [CrossRef] [PubMed]
- Sherif, A.; Haci, H. A Novel Bio-Inspired Energy Optimization for Two-Tier Wireless Communication Networks: A Grasshopper Optimization Algorithm (GOA)-Based Approach. Electronics 2023, 12, 1216. [Google Scholar] [CrossRef]
- Anaraki, M.V.; Farzin, S. Humboldt Squid Optimization Algorithm (HSOA): A Novel Nature-Inspired Technique for Solving Optimization Problems. IEEE Access 2023, 11, 122069–122115. [Google Scholar] [CrossRef]
- Sun, X.X.; Pan, J.S.; Chu, S.C.; Hu, P.; Tian, A.Q. A novel pigeon-inspired optimization with QUasi-Affine TRansformation evolutionary algorithm for DV-Hop in wireless sensor networks. Int. J. Distrib. Sens. Netw. 2020, 16, 1550147720932749. [Google Scholar] [CrossRef]
- Prajna, K.; Mukhopadhyay, C. Acoustic Emission Denoising Based on Bio-inspired Antlion Optimization: A Novel Technique for Structural Health Monitoring. J. Vib. Eng. Technol. 2024, 12, 7671–7687. [Google Scholar] [CrossRef]
- Zhou, X.; Guo, Y.; Yan, Y.; Huang, Y.; Xue, Q. Migration Search Algorithm: A Novel Nature-Inspired Metaheuristic Optimization Algorithm. J. Netw. Intell 2023, 8, 324–345. [Google Scholar]
- Kumar, V.; Rao, R.N.; Singh, A.; Shekher, V.; Paul, K.; Sinha, P.; Alghamdi, T.A.; Abdelaziz, A.Y. A novel nature-inspired nutcracker optimizer algorithm for congestion control in power system transmission lines. Energy Explor. Exploit. 2024, 42, 2056–2091. [Google Scholar] [CrossRef]
- Rathee, M.; Kumar, S.; Dilip, K.; Dohare, U.; Aanchal; Parveen. Towards energy balancing optimization in wireless sensor networks: A novel quantum inspired genetic algorithm based sinks deployment approach. Ad Hoc Netw. 2024, 153, 103350. [Google Scholar] [CrossRef]
- Nemati, M.; Zandi, Y.; Agdas, A.S. Application of a novel metaheuristic algorithm inspired by stadium spectators in global optimization problems. Sci. Rep. 2024, 14, 3078. [Google Scholar] [CrossRef]
- Haddadi, Y.R.; Mansouri, B.; Khodja, F.Z.D. A novel bio-inspired optimization algorithm for medical image restoration using Enhanced Regularized Inverse Filtering. Res. Biomed. Eng. 2023, 39, 233–244. [Google Scholar] [CrossRef]
- Maroosi, A.; Muniyandi, R.C. A novel membrane-inspired multiverse optimizer algorithm for quality of service-aware cloud web service composition with service level agreements. Int. J. Commun. Syst. 2023, 36, e5483. [Google Scholar] [CrossRef]
- Jiang, Y.; Wu, Q.; Zhu, S.; Zhang, L. Orca predation algorithm: A novel bio-inspired algorithm for global optimization problems. Expert Syst. Appl. 2022, 188, 116026. [Google Scholar] [CrossRef]
- Attaran, B.; Ghanbarzadeh, A.; Moradi, S. A novel evolutionary optimization algorithm inspired in the intelligent behaviour of the hunter spider. Int. J. Comput. Math. 2021, 98, 627–655. [Google Scholar] [CrossRef]
- Sivakumar, N.; Kanagasabapathy, H. Optimization of parameters of cantilever beam using novel bio-inspired algorithms: A comparative approach. J. Comput. Theor. Nanosci. 2018, 15, 66–77. [Google Scholar] [CrossRef]
- Zhou, B.; Zhang, H.; Han, S.; Ji, X. Crashworthiness analysis and optimization of a novel thin-walled multi-cell structure inspired by bamboo. Structures 2024, 59, 105827. [Google Scholar] [CrossRef]
- Janizadeh, S.; Thi Kieu Tran, T.; Bateni, S.M.; Jun, C.; Kim, D.; Trauernicht, C.; Heggy, E. Advancing the LightGBM approach with three novel nature-inspired optimizers for predicting wildfire susceptibility in Kaua’i and Moloka’i Islands, Hawaii. Expert Syst. Appl. 2024, 258, 124963. [Google Scholar] [CrossRef]
- Brest, J.; Greiner, S.; Boskovic, B.; Mernik, M.; Zumer, V. Self-Adapting Control Parameters in Differential Evolution: A Comparative Study on Numerical Benchmark Problems. IEEE Trans. Evol. Comput. 2006, 10, 646–657. [Google Scholar] [CrossRef]
- Zhang, J.; Sanderson, A.C. JADE: Adaptive Differential Evolution with Optional External Archive. IEEE Trans. Evol. Comput. 2009, 13, 945–958. [Google Scholar] [CrossRef]
- Mantegna, R.N. Fast, Accurate Algorithm for Numerical Simulation of Lévy Stable Stochastic Processes. Phys. Rev. E 1994, 49, 4677–4683. [Google Scholar] [CrossRef]
- Yang, X.; Deb, S. Engineering Optimization by Cuckoo Search. In Proceedings of the International Conference on Nature & Biologically Inspired Computing (NaBIC), Coimbatore, India, 9–11 December 2009; IEEE: New York, NY, USA, 2009; pp. 210–214. [Google Scholar] [CrossRef]
- Lampinen, J. A Constraint Handling Approach for Differential Evolution. In Proceedings of the 2002 Congress on Evolutionary Computation (CEC), Honolulu, HI, USA, 12–17 May 2002; IEEE: New York, NY, USA, 2002; pp. 1468–1473. [Google Scholar] [CrossRef]
Disclaimer/Publisher’s Note: The statements, opinions and data contained in all publications are solely those of the individual author(s) and contributor(s) and not of MDPI and/or the editor(s). MDPI and/or the editor(s) disclaim responsibility for any injury to people or property resulting from any ideas, methods, instructions or products referred to in the content. |
© 2025 by the authors. Licensee MDPI, Basel, Switzerland. This article is an open access article distributed under the terms and conditions of the Creative Commons Attribution (CC BY) license (https://creativecommons.org/licenses/by/4.0/).