Article

HRCD: A Hybrid Replica Method Based on Community Division Under Edge Computing

by
Shengyao Sun
1,2,*,
Ying Du
1,
Dong Wang
2,
Jiwei Zhang
3,* and
Shengbin Liang
2
1
School of Information Science and Technology, Zhengzhou Normal University, Zhengzhou 450044, China
2
School of Software, Henan University, Zhengzhou 450046, China
3
School of Computer Science, Beijing University of Posts and Telecommunications, Beijing 100876, China
*
Authors to whom correspondence should be addressed.
Computers 2025, 14(11), 454; https://doi.org/10.3390/computers14110454
Submission received: 10 June 2025 / Revised: 22 July 2025 / Accepted: 25 July 2025 / Published: 22 October 2025
(This article belongs to the Section Cloud Continuum and Enabled Applications)

Abstract

With the emergence of Industry 5.0 and explosive data growth, replica allocation has become a critical issue in edge computing systems. Current methods often focus on placing replicas on edge servers near terminals, yet this may lead to edge node overload and system performance degradation, especially in large 6G edge computing communities. Meanwhile, existing terminal-based strategies struggle due to their time-varying nature. To address these challenges, we propose the HRCD, a hybrid replica method based on community division. The HRCD first divides time-varying terminals into stable sets using the community division algorithm. Then, it employs fuzzy clustering analysis to select terminals with strong service capabilities for replica placement while utilizing uniform distribution to prioritize geographically local hotspot data as replica data. Extensive experiments demonstrate that the HRCD effectively reduces data access latency and decreases edge server load compared to other replica strategies. Overall, the HRCD offers a promising approach to optimizing replica placement in 6G edge computing environments.

1. Introduction

With the continuous advancement of information technology and the widespread application of the Internet of Things (IoT) and big data, digitization and intelligence have become important trends in the development of the manufacturing industry. The European Commission put forward the concept of Industry 5.0 in 2021, aiming to promote the sustainable development of the manufacturing industry through technological innovation and industrial upgrading [1]. In terms of technology, Industry 5.0 will integrate various advanced technologies, such as artificial intelligence, Internet of Things (IoT), big data analysis, cloud computing, and others, to form an efficient and synergistic industrial ecosystem [1]. Although 5G communication technology has driven the widespread application of technologies such as artificial intelligence in the manufacturing industry, enabling the digitization and networking of production processes, it has certain limitations in certain aspects, such as network intelligence and stronger communication capabilities, which prevent it from fully meeting the requirements of Industry 5.0 [2,3]. To meet Industry 5.0, the sixth-generation networks (6G) have garnered attention from the industrial and academic communities.
Regarding 6G networks, many scholars believe that the future 6G networks will primarily evolve in two directions [2,3,4,5,6,7], first, leveraging wireless signals from ground, air, and satellite equipment to build a globally connected network, and second, providing ubiquitous artificial intelligence and services. To ensure the evolution of 6G in these two directions, edge computing under 6G (6G Edge for short) has become a research hotspot in recent years [6,8,9]. Edge computing is a distributed computing architecture that transforms large-scale services originally processed entirely by central nodes into distributed edge nodes [2,5,6]. Under 6G Edge, smartphones will still be used in 6G [2,3,4]. They will also become an important component of terminal devices. The edge servers are distributed in different geographical areas. The edge infrastructure provider (EIP) can deploy edge servers equipped with small-scale cloud-like computing resources at base stations and access points in close proximity to end-users [10]. Based on the pay-as-you-go pricing model, app vendors can hire resources on edge servers in a specific geographical area for hosting applications [11] or caching popular data [12,13] to serve their users in areas with low latency. App vendors hire resources on edge servers for caching data to serve their users within the edge servers’ coverage areas [14,15]. The distributed setup brings many beneficial functions to edge computing, such as low latency and mobility [8]. In this way, end-users’ increasingly stringent latency requirements can be fulfilled [16]. Many scholars believe that 6G Edge will achieve significant breakthroughs in areas such as Industry 5.0, autonomous mobility, etc. [2,3,4,5,6,7,8].
The pay-as-you-go pricing model is a commonly used consumption pattern in Edge [3,4,5]. This consumption pattern is also a common model for utilizing 6G edge computing services in large communities. Personnel concentration and the diversification of User Equipment (UE for short) are fundamental characteristics of large communities. To enhance the Quality of Service (QoS) for users of large communities, the EIP needs to deploy more base stations. While the adoption of 6G communication technology can effectively mitigate the issue of mutual interference among multiple base stations [17,18], the concentration of people and the diversity of devices also pose new challenges for the pay-as-you-go consumption model. Firstly, the vast amount of communication data involved in edge computing, coupled with the diversity of devices, exerts tremendous service pressure on the edge [2,3,4,6]. Secondly, UE is usually carried by users, and their locations dynamically change as users move. UE needs to access the network from different access points to improve their QoS, which undoubtedly increases the communication burden of the edge node.
The multi-replica technology can effectively alleviate the issue of excessive service pressure in the context of 6G Edge [1,2,3,4,5,6,7,17,18]. Typically, these methods involve deploying replicas on edge devices situated close to UE [10,11,12,13,14,15,16]. In large communities characterized by high personnel density, the service pressure on edge nodes remains notably elevated. Compared to Edge Service nodes (ESs for short), UE is situated closer to the data access points. By placing replicas on UE, we can not only diminish the burden on ESs but also further curtail data access latency. With the burgeoning maturity of Device-to-Device (D2D for short) communication technology, UE participation in edge services has garnered increasing attention from scholars [19,20]. However, this approach also confronts a multitude of challenges, primarily manifested as follows.
(1) The question arises regarding which UE should be served by which replicas. In Edge, replicas are positioned on ESs that are proximal and stationary relative to UE, offering data access services to UE within their communication radius. Consequently, the service target of replicas on ESs remains consistent. In contrast, the position of UE in large communities is dynamically fluid. When replicas are hosted on UE, it becomes challenging to ascertain which replicas cater to which UE. (2) The issue of replica placement location emerges. ESs possess superior service capabilities and are typically situated at the network topology’s “exit” points in Edge. Consequently, selecting ESs as the replica deployment node can enhance replica hit rates. However, in large communities, UE positions are time-varying, and the network topology is also dynamically evolving. (3) The problem of selecting data for replica creation is as follows. Data accessed by geographically dispersed users exhibits a geographical locality pattern [21,22,23]. To fulfill the data access requirements of various geographical units, traditional replica placement methodologies typically select “hotspot” data of specific types as replicas (hotspot data denotes data that has been frequently requested per unit time). However, in Edge, UE is time-varying and may be situated in diverse geographical units at different times, rendering it difficult to measure the hotspot data of specific types.
In summary, since the time-varying nature of UE under 6G edge computing for Large-Scale Communities, and with the rapid growth in the amount of UE and mobile communication volume, it is difficult to meet the needs of Edge by simply placing replicas on ESs. Therefore, this paper proposes a Hybrid Replica strategy based on the Community Division under 6G Edge, named the HRCD, aiming to further reduce access latency and improve system performance by placing replicas on ESs and UE. the HRCD uses the Label Propagation Algorithm (LPA for short) to determine whether the time-varying UE belongs to the stable service set and selects appropriate multiple pieces of UE within the stable set as replica placement nodes. Meanwhile, it uses uniform distribution to select appropriate hotspot data as replica data according to the data access situation. The main contributions of this paper are summarized as follows:
  • The HRCD employs the PLA algorithm to categorize time-varying terminals into multiple stable communities and implements a hybrid replica placement strategy. This strategy involves distributing replicas across both edge nodes and end-devices, thereby achieving system load balancing and minimizing data access latency.
  • The HRCD determines the stable set that time-varying UE belongs to based on its inherent properties and data access patterns. To select replica placement nodes from this set, the HRCD utilizes fuzzy clustering analysis. Here, the inherent properties of UE refer to various indicators that influence a terminal node’s capacity to serve other nodes or itself, including the node’s load, residual computational power, available storage space, and topological distance from other nodes, among others.
  • The HRCD selects hotspot data for replica creation within the stable set by considering both the geographical proximity of nodes and data access patterns within the set. Based on these factors, the HRCD categorizes the data appropriately for replica creation.
  • We conduct an experimental evaluation of the HRCD’s performance in comparison to similar edge replication strategies to validate its superior performance.
The rest of this paper is organized as follows. Section 2 reviews the related work. Section 3 overviews the HRCD. Section 4 presents the HRCD in detail. Section 5 theoretically analyzes the HRCD’s validity and efficiency. Section 6 experimentally evaluates the HRCD’ performance against the similar edge replication strategies. Section 7 summarizes this paper and points out future work.

2. Related Works

2.1. The Method of Placing Replicas

Placing replicas on ESs can improve the overall system capacity of Edge, reduce data access latency, and lower energy consumption [3,4,5,6]. It has received widespread attention from academia and industry, and a large number of replica placement methods have been proposed [10,11,12,13,14,15,16,23,24,25,26,27]. The related works are shown in Table 1.
All the aforementioned methods in Table 1 effectively address network transmission delays, enhance real-time performance and data processing efficiency, elevate data access speeds, improve user experience, and strengthen data privacy and security. Depending on the placement of replicas, existing schemes can be grouped into three categories: UE-based, ES-based, and hybrid placement. Among them, ES-based placement pertains to placing replicas on edge nodes, as referenced in papers [12,14,15,23,24,25,26,27]. Such algorithms typically evaluate whether content is popular and requires replica creation based on the frequency of user requests and corresponding response times. They then compute the number of replicas needed for domains lacking them and identify the most suitable node within those domains for replica placement.
UE-based placement refers to placing replicas on end-user devices, as mentioned in papers [19,20]. This research often uses prediction algorithms to forecast the content users may access and caches this content in advance onto their devices, achieving rapid data retrieval and response. These algorithms are predominantly applied in D-2-D or Peer-to-Peer (P2P) scenarios. Compared to ES-based methods, the placement of replicas is closer to the user end, resulting in faster response speeds and effective load balancing of edge nodes. However, they consume end-device storage resources, leading to lower storage utilization rates.
Hybrid placement involves placing replicas on any device from end-user devices to the cloud center, as referenced in papers [12,27,28]. This approach flexibly selects caching locations (such as the cloud center, edge nodes, or end-devices) based on user request patterns, network conditions, and resource distribution. It pushes popular content closer to users, either to the edge or their devices, to reduce access latency. Such methods often require resource scheduling algorithms (or service orchestration algorithms) for support, resulting in significant computational resource consumption. Additionally, due to the need to place replicas in multiple locations, the degree of replica redundancy is relatively high.

2.2. The Community Discovery Algorithm

Community attributes are an important characteristic of complex networks. Discovering communities in the network is dividing similar nodes into a set. Paper [26] first applied the Label Propagation Algorithm (LPA) to community discovery. The basic idea of the algorithm is to assign a unique label to every node and update the label with the propagation process. It calculates the maximum number of labels among neighboring nodes to update the node’s label and finally adds all nodes with the same label to the same community. The links between nodes within the same community are relatively dense, while the links between different communities are relatively sparse [29,30]. In recent years, community discovery has been widely applied to different types of networks, such as the World Wide Web, social networks, and biological networks. Currently, most community discovery algorithms are based on network structure partitioning, such as graph-based partitioning algorithms, edge clustering algorithms, seed diffusion methods, random walks, hierarchical clustering, and modularity [31,32,33]. However, these algorithms have high computational complexity and are not suitable for analyzing large community networks.
Paper [31] studied the discovery of overlapping communities in dynamic communities and proposed a community discovery algorithm based on label propagation probability to reveal the development trend of “high coupling” in networks. Although community discovery algorithms based on LPA have been applied in many complex network application scenarios, they are less applied in replica placement in Edge. The UE in Edge has time-varying characteristics and is a typical complex network. LPA can also be used to discover the community to which the UE belongs and place replicas. Paper [32] proposes a reliable label selection and learning algorithm to address the problem of semi-supervised deep learning in the presence of only a very small number of labeled image backgrounds.

3. The Implementation Scenarios of the HRCD

As depicted in Figure 1, the HRCD primarily addresses the communication scenarios of a large-scale community within 6G edge computing, characterized by high-density micro base stations. UE is carried by users, and their movements traverse the service areas of various base stations over time. To vividly demonstrate the implementation steps of the HRCD, let us consider UE1 as a terminal node that traverses multiple service areas. Drawing from real-world scenarios, UE1 moves sequentially through numerous US areas, as highlighted by the red line in Figure 1. For instance, if  U E 1 is carried by a corporate employee, its movement pattern is likely to adhere to a regular route between home and the workplace.
The specific implementation steps are as follows:
Step 1: Initialization Phase. U E 1 determines its label based on the categories of its historical access data, while ESs determine its label based on the categories of the historical access data of all terminal nodes within its service area. The labels for both UE and ESs are not fixed but rather constitute a set of labels.
Step 2: Label Exchange Phase. As shown in Figure 1, when U E 1 moves into the service area of E S E , it exchanges labels with E S E , meaning that E S E distributes its labels to U E 1 . When exchanging labels among UE, the HRCD assumes that the UE within the service scope of the edge server remains constantly online and that the D2D link remains consistently accessible.
Step 3: Determining the Stable Set Belonging to U E 1 . As shown in Figure 1, within  E S E ’s service area, U S E employs the HRCD method to assess the similarity of data access patterns and inherent attributes between U E 1 and other UE, thereby determining the stable service set to which U E 1 belongs.
Step 4: Selecting Replica Placement Nodes within the Stable Set. the HRCD selects appropriate sets of terminal devices as replica placement nodes from each community, based on the predefined stable community sets. It considers multiple factors that influence data access and load balancing, and employs fuzzy clustering analysis to select node sets from within the stable set for replica placement.
Step 5: Selecting Replica Objects within the Stable Set. The HRCD creates replicas based on the categories of data in the candidate placement nodes and the hotspot data within each category. When creating replicas, the HRCD first allocates them uniformly according to the proportion of requests for each category of data within the replica placement node set in the stable set, determining the category of replica to be created. It then selects data for replica creation uniformly, based on the proportion of requests for hotspot data under different data categories. U E 1 selects hotspot data for replica creation.
Step 6: Data Access Phase. When accessing data, the HRCD prioritizes requests for data from within the stable set. If the request fails, it proceeds to request data from edge devices. Similarly, when accessing data, U E 1 prioritizes selecting replica data from the replica placement node set within the stable set. If the request is unsuccessful, U E 1 obtains replica services from E S E .
The HRCD prioritizes fetching data from the stable set. In the event of failure, it shifts to requesting data from edge nodes. If those attempts also fall through, it resorts to sourcing data from the cloud. This hybrid replica placement method stands out from traditional hybrid approaches. Instead of relying on predictive algorithms to pre-cache data on end devices, the HRCD leverages community detection algorithms and fuzzy clustering analysis to identify terminal nodes for replica placement, based on observed data access patterns. Moreover, when it comes to creating replicas, the HRCD takes a different tack from the traditional approach of prioritizing popular (or hotspot) data. Instead, it creates replicas based on data categories, taking into account access patterns within stable sets. This innovative approach helps enhance the success rate of replica access.

4. The HRCD Algorithm

This section will provide a comprehensive explanation of the algorithm steps involved in the HRCD. Previously, Section 4.2 introduced the detailed steps for obtaining a stable set of UE. Section 4.3 delved into the challenge of determining the set of replica placement nodes. Furthermore, Section 4.4 elaborated on the selection process for a replica creation object. Lastly, Section 4.5 detailed the steps required for placing replicas on the UEs.

4.1. The Table of Partial Parameters for the HRCD

Some of the parameters involved in the HRCD are shown in Table 2.

4.2. Algorithm for Obtaining Stable Set of Nodes

The core of the HRCD lies in accurately identifying which UE is served by the replicas. The requested data exhibits geographical locality characteristics at the edge [23], meaning that nodes within the service area of an edge server share similar data access requirements. In simpler terms, UE served by the same edge server has a higher likelihood of accessing identical data. Consequently, this UE develops stronger connections due to its shared data access patterns. Leveraging Complex Network Community Theory [29,30], we can characterize the relationships among UE at the edge by analyzing data access similarity. Thus, through community discovery, we can ascertain the community to which a piece of time-varying UE belongs. In other words, based on complex network community theory, we can identify the stable service sets that various UE is affiliated with.
The HRCD determines the relationship between time-varying nodes based on their inherent properties and the actual situation of data access. The inherent properties of UE are measured from the perspective of UE users. For example, assume U E 1 and U E 2 are used by U s e r 1 and U s e r 2 , and assume that users have three inherent attributes, workplace, unit, and gender, expressed as { a d d r , u n i t , s e x } . So, the inherent properties of U s e r 1 and U s e r 2 are represented as U E 1 = { a d d r 1 , u n i t 1 , s e x 1 } , U E 2 = { a d d r 2 , u n i t 2 , s e x 2 } . If a d d r 1 = a d d r 2 and a d d r 1 = a d d r 2 ; then, when U E 1 and U E 2 move to the same service area of an ES, compared to other UE, they have a higher probability of accessing the same data category due to some of their properties being the same; that is, compared to other UE, U E 1 and U E 2 are closely connected and have a high probability of belonging to the same “community”. However, judging the data category accessed by UE solely based on the same attributes still has limitations, and other factors need to be considered. For example, since there is an attribute difference between U E 1 and U E 2 , the data categories that they are concerned about may be different. To find similarities in accessing data, it is also necessary to pay attention to their historical access information.
According to the above considerations, the HRCD determines the stable services set as follows: Firstly, the HRCD defines node labels and ES labels. Then, UE periodically records the labels of encountering ESs in a decentralized adaptive manner. Finally, according to the recording labels and inherent attributes of UE, the stable set to which UE belongs is determined through the similarity degree.

4.2.1. The Method of Obtaining the UE’s Label

We assume that f i has a unique data type. U E i records the requested data in its log. the HRCD obtains the recent k 1 accessing records from the log and counts the frequency of each data category in k 1 , expressed as follows:
F d k j = K j i = 1 k 1 K i
F d k j represents the frequency of K j class data appearing in k 1 . In the initial state, U E i takes the top L e n i data category with the highest frequency as its label, expressed as follows:
R l i = { K 1 , K 2 , , K m } m = L e n i a n d m < = k

4.2.2. The Method of Obtaining the ES’s Label

According to the principle of geographic locality in edge computing [23], for simplicity, we use the data category of hotspots within the ES service area as the label for ESs. The method is as follows.
ESs periodically count the data requests within the area of the service in descending order according to the request count, obtain the top k 2 ( k 2 k 1 ) data with the highest number of requests, and count the frequency of each category of data in k 2 . E S i takes the top k 3 data category with the highest frequency as its label, in which, k 3 = β × L e n i ¯ β > = 2 . Here, L e n i represents the average number of UE labels in the current service area, and β is a custom constant.

4.2.3. The Method of Label Propagation

UE can move within different ES service areas. If UE requests data on ESs (or other nodes within the ES service area that place replicas), then it records ES labels related to the requested data; i.e.,the  ES propagates its label to the UE. UE can save the fixed number of labels and replace them with the longest unused algorithm [34]. Meanwhile, UE records the accessed data information in a log. When UE records labels, if the recorded label is a new label in the UE label record, update the number of label records, expressed as C R i = C R i + 1 . If the requested data does not exist in the ES, it is necessary to request data from the remote cloud through the ESs. At this time, the UE still records the accessed data category as its historical access data.

4.2.4. Determine the Stable Service Set to Which the UE Belongs According to the Membership Degree

The HRCD takes into account both the inherent properties and historical access information of UE and determines the stable service set to which the UE belongs based on the membership degree of the UE. Here, the membership function is shown in Equation (3) as follows:
S i m i , j = γ 1 × s d i , j + γ 2 × s p i , j γ 1 + γ 2 = 1
Here, γ 1 and γ 2 are weight coefficients. s d i , j and s p i , j are data access similarity and intrinsic attribute similarity for U E i and U E j , respectively.
The method of obtaining s d i , j is as follows:
Using S d r i as the domain of discourse ( S d r i indicates UE within E S i service area). Use every UE recorded label as an indicator; that is, U E i = { R l i , 1 , R l i , 2 , , R l i , m } are indicators. The proportion R l i , k , of the k-th data type label on U E i is represented as
R l k , i = K k K B p l k , i m R l i , k = 100 %
Given U E i and U E j , the similarity of their access data can be obtained by the following Equation (5):
S d i , j = k = 1 m R l i , k × R l j , k R l i , k 2 × R l j , k 2
The method of obtaining S p i , j is as follows:
Using p n i , k to denote the k-th attribute of U E i , and using n to denote the number of attributes. The fixed attribute set of U E i is represented as P n i = { p n i , 1 , p n i , 2 , , P p n i , n } . Given U E j , the similarity of their intrinsic attributes can be obtained by the following Equation (6):
S p i , j = 1 n × k = 1 n δ ( p n i , k , p n j , k )
where δ ( p n i , k , p n j , k ) = 1 when p n i , k = p n j , k . δ ( p n i , k , p n j , k ) = 0 when p n i , k p n j , k . For example, U E 1 = { a d d r 1 , u n i t 1 , f e m a l e } , U E 2 = { a d d r 2 , u n i t 2 , f e m a l e } , if  a d d r 1 = a d d r 2 , u n i t 1 = u n i t 2 , it indicates that users of U E 1 and U E 2 have the same work unit and residential unit; then, its inherent attribute similarity is s p 1 , 2 = 2 3 .
Given E S i , when dividing the stable service set to which the UE belongs, the HRCD firstly defines a threshold 2 = < γ according to the actual situation. Given E S j ( U E j S d r i ) , it obtains its membership degree with other nodes within its service area according to Formula (3). Take the node set that satisfies S i m i , j > γ S i m i , j ¯ as the stable service set to which U E j belongs, expressed as C p s i . Here,
S i m i , j ¯ = i = 1 N S i m i , j N
It indicates the average membership degree of other UE within S d r i and U E j .
According to the above description, the pseudocode for the HRCD to obtain the stable service set to which a node belongs is shown in Algorithm 1.    
Algorithm 1: The algorithm for obtaining stable set of UE
Input: S d r i , U E i = { R l i , 1 , R l i , 2 , , R l i , m } , P n i = { p n i , 1 , p n i , 2 , , P p n i , n } , γ 1 , γ 2 , γ
Output: The stable set C p s i to which U E i belongs
Obtaining the proportion of k-th class labels according to (4);
Obtaining S d i , j between U E i and other nodes in S d r i according to (5);
Obtaining S p i , j between U E i and other nodes in S d r i according to (6);
Obtaining S i m i , j between U E i and other nodes in S d r i according to (3);
Obtaining the average membership degree of other UE in S d r i and U E i according to (7);
Obtaining C p s i according to S i m i , j > γ S i m i , j ¯ ;

4.3. The Algorithm for Obtaining Replica Placement Nodes

Determining the optimal replica placement node is pivotal in the process of replica placement. Various factors, including a node’s service capacity, topological position, and load, must be taken into account when selecting replicas. Typically, replica placement algorithms opt for a single “optimal” node for replica deployment. However, given the dynamic nature of UE in edge computing, selecting a single “optimal” node may result in that node being relocated outside the service area of an ES, thereby rendering it unable to continue serving other UE.
To tackle this challenge, the HRCD employs fuzzy clustering analysis to identify a comprehensive set of replica placement nodes. The detailed steps involved are outlined below.

4.3.1. The Evaluation Indicators

Assuming any stable service set C p s k under E S i , select any node U E j from C p s k , and consider its following indicators: the number of records for new label C r j , the backhaul d i , j with E S j , the node load q j , the remaining space R s j for placing replicas and the remaining bandwidth R w j for nodes. HRCD uses { C r j , d i , j q j , R s j , R w j } as the evaluation indicator.

4.3.2. Building the Optimal Virtual Placement Node

If there exists a virtual UE, denoted as U E v r , in  C p s k with the following indicators:
U E v r = { C r v r , d i , v r , q v r , R s v r , R w v r } .
C r v r = m i n { C r 1 , C r 2 , , C r k 3 } .
d i , v r = m i n { d i , 1 , d i , 2 , , d i , k 3 } .
q v r = m i n { q 1 , q 2 , , q k 3 } .
R s v r = m a x { R s 1 , R s 2 , , R s k 3 } .
R w v r = m a x { R w 1 , R w 2 , , R w k 3 } .
where k 3 = C p s k . L e n g t h . That is, U E v r has the smallest backhaul, the smallest load, the largest remaining storage space, and the largest remaining bandwidth. Meanwhile, C r v r represents the number of times a new data type has been received. According to the principle of data locality under Edge, there is a higher probability of accepting the new data type when the UE moves to a new ES. Therefore, C r v r can serve as the frequency at which the UE moves in and out under different ESs. That is, U E v r has the minimum movement frequency. It is obvious that U E v r is the “optimal” replica placement node in C p s k . But it is a virtual node and cannot place replicas. So, the HRCD uses fuzzy clustering analysis to find UE with high similarity to U E v r from C p s k as a candidate set of replica placement nodes.

4.3.3. Building the Initial Matrix

The HRCD takes C p s a l l as the domain, { C r j , d i , j , q j , R s j , R w j } as the evaluation indicators to construct the initial matrix R i n i t (The initial matrix is shown in Table 3), in which C p s a l l = U E v r C p s k .
The HRCD uses the quantity product method to normalize the dimensions of different indicators in R i n i t and establishes the fuzzy similarity matrix R 1 . The quantity product method is shown in Formula (8):
r i , j = 1 , i = j 1 M × k = 1 5 x i , k × x j , k , i j
where r i , j represents the similarity between U E i and U E j in U C p s a l l . x i , k represents the second indicator of U E j . M = M a x i j ( k = 1 5 x i k × x j k ) .
According to Formula (8), R i n i t can be transformed into the following similarity matrix  R 1 :
1 r 1 , 2 r 1 , 3 r 1 , k 3 r 1 , v r r 2 , 1 1 r 2 , 3 r 2 , k 3 r 2 , v r r 3 , 1 r 3 , 2 1 r 3 , k 3 r 3 , v r r k 3 , 1 r k 3 , 2 r k 3 , 3 1 r k 3 , v r r v r , 1 r v r , 2 r v r , 3 r v r , k 3 1

4.3.4. Obtaining the Node Set of Replica Placement

The HRCD uses the fuzzy clustering analysis method to cluster C p s a l l . According to λ -Cut set theory [35,36], λ takes non-repeating values from R 1 and arranges them in descending order, expressed as follows:
D t s λ = { λ | d i s t i n c t r i , j o r d e r b y d e s c }
According to the HRCD’s goals, it selects a set of nodes with high similarity to U E v r from C p s j as candidate nodes for replica placement. According to λ -Cut set theory, the number of nodes in the cluster is closely related to the value of λ . A larger λ means that there less UE in the same set as U E v r . Less UE participating in replica services easily leads to these nodes’ service pressure increasing. A smaller λ indicates that more devices are divided into the same set as U E v r . Although placing replicas on more devices can effectively balance the load, it can lead to serious waste of storage resources. Therefore, the HRCD uses the Pareto distribution [37] to determine the appropriate λ threshold. Assuming when λ = λ , if the number of devices in the same set as nodes in C p s k and U E v r reaches 20% of the total number of C p s a l l , clustering will be stopped, and the cluster set at this time is expressed as C t d λ . Then C t d λ is the candidate set for placing replicas.
Meanwhile, during clustering, the HRCD also records the node set during each iteration of C p s k and U E v r clustering, expressed as
s t a t e k = { C t d λ 1 , C t d λ 2 , , C t d λ λ 1 , λ 2 , , λ D t s λ }
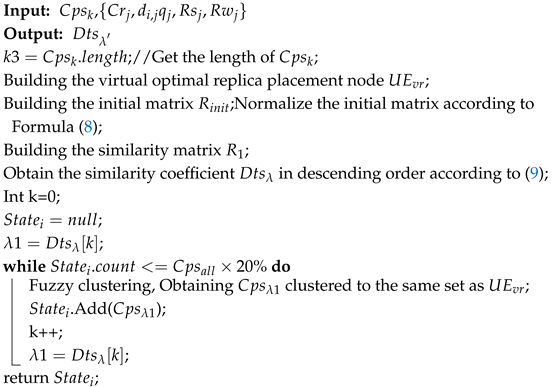
According to the above description, the algorithm pseudocode for obtaining candidate sets for replica placement within a stable set is as follows in Algorithm 2.
Algorithm 2: The algorithm for obtaining candidate replica placement nodes
Computers 14 00454 i001

4.4. The Method of UE Selecting the Data to Create Replica

Given that the label record of UE can capture its historical movement patterns across different ESs, HRCD leverages this information to optimize replica placement. Additionally, by selecting popular data for replication, data access latency can be minimized and load-balanced effectively. Therefore, the HRCD identifies and replicates hotspot data, categorized by data type, based on label exchange dynamics. The process involves the following steps:
Step 1: In a decentralized and adaptive manner, the candidate replica placement nodes tally the number of data requests within their respective stable service sets.
Given nodes U E i and U E j ( U E i D t s λ , U E i C t d k , U E i U E j ) and assuming the replica for f i has been placed on U E i , if U E j requests data f m from U E i , the number of requests for f i is increased by 1, denoted as r ( f m , c o u n t ) .
Step 2: E S i periodically obtains the data request situation.
The HRCD uses the following Formula (10) to count the request situation in C t d k according to the data type.
r ( f i ) = f i K k r ( f m , c o u n t ) f i K k
Step 3: According to Formula (10), order data in a descending order based on data type, denoted by
E t d k = { D a t a k | r ( f i ) o r d e r b y c o u n t d e s c }
E t d k is the k-th data type in descending order according to request counts.
Step 4: Select the candidate data sets for creating replicas based on data types.
Obtain the total number of requests for different data types in C t d k during a unit of time according to Formula (10), denoted by R Q A l l . So, the proportion of requests for the k-th data type, denoted by R Q k , can be expressed as:
R Q k = K k K r ( f i ) R Q A l l R Q k = 100 %
According to (13), obtain the number of candidate replicas, denoted by l h o t k , that need to be created in C t d k .
l h o t k = ϕ × R s k ¯ = ϕ × i = 1 k R s i k 0 < ϕ < = 0.5
where ϕ is a user-defined coefficient. R s k ¯ represents the average remaining storage capacity of all UE ( U E C t d k . k = C t d k .length.
According to (14), the proportion of the k-th data type in l h o t k is
L a b T e i k = l h o t k × R Q k
When selecting candidate replica sets, the HRCD selects hotspot data from different data types based on the proportion of requests for each category of data to join l h o t k , forming a candidate replica set for C t d k , expressed as H o t D k .
Based on above description, the pseudo code UE selects candidate data to create replicas as shown in Algorithm 3.
Algorithm 3: The algorithm for obtaining candidate replica placement nodes
Input: The data request status of C t d i during a unit of time,
The remaining space for nodes to place replicas
Output: H o t D i
Phase 1:
U E j ( U E j C t d λ ) counts the request information of its replicas in a decentralized manner.
Phase 2:
In C t d i , the number of requests is periodicly counted according to the data type by E s i ;
Obtaining the proportion of requests R Q k for different category of data during a unit time according to (12);
Arranging the number of requests for data in descending order by data category, obtaining E t d k ;
Obtaining the number of replicas for C t d i according to (14);
Join the different categories of data to the candidate replica set H o t k according to the number of requests;
Return H o t D k ;

4.5. The Replica Placement Algorithm

The HRCD employs a uniform distribution approach to pick data from the candidate replica set for replication purposes. Additionally, it determines the optimal nodes for placing these replicas by considering both the load of the candidate placement nodes and the order of clustering derived from fuzzy clustering analysis. The specific steps involved are outlined below.

4.5.1. Obtaining the Priority of Placing Replicas in the C t d k Node Set According to the Order of Fuzzy Clustering

When selecting the replica placement node, the HRCD prioritizes selecting UE with high similarity to U E v r as the replica placement node.
During the clustering process, as the number of iterations increases, candidate placement nodes gradually cluster into C t d λ . The earlier clustering into the C t d λ , the higher the similarity with U E v r . Therefore, the HRCD obtains the priority of candidate nodes as replica placement nodes based on the order of fuzzy clustering. The method is as follows:
Assuming s t a t e k = { C t d λ 1 , C t d λ 2 , , C t d λ } . The cluster sets corresponding to ( λ , ( i 1 ) ), ( λ , ( i ) ), ( λ , ( i + 1 ) ) are { C t d λ , ( i 1 ) , C t d λ , ( i ) , C t d λ , ( i + 1 ) λ , ( i + 1 ) < = λ } , respectively. When λ = ( λ , i ) , C t d λ , i = C t d λ , i C t d λ , i 1 is the new clustering node set. When λ = ( λ , i + 1 ) , C t d λ , i + 1 = C t d λ , i C t d λ , i + 1 is the new clustering node set. When selecting a replica placement node, prioritize the nodes in C t d λ , i .

4.5.2. Selecting Data Objects to Create Replicas

When creating the replica, the HRCD first determines the data type for creating the replica, and then selects the data for creating the replica. The HRCD first obtains the proportion of each type of data according to Formula (14), and then uses the uniform distribution to determine the data type for creating replicas, denoted by D a k ( D a k K k ). Then, according to Formula (15), select f i ( F i H o t D k ) from the D a k using the uniform distribution and create a replica.
P e p i = f i D a k r ( f i , c o u n t ) f i D a k r ( f i , c o u n t ) f i H o t D k
At (15), the denominator represents the number of requests during a unit time for all hotspot data belonging to the D a k type in H o t D k . The numerator represents the amount of f i requested during a unit time. According to (14) and (15), when selecting data to create the replica, the more times the f i in the D a k type data is accessed, the higher the probability of being selected as the replica data.

4.5.3. Obtaining the Number of Replicas Created According to the Node Load

Many factors can cause changes in node load. The HRCD only considers the load caused by requests. Assuming the maximum number of requests that U E i ( U E i C t d i can handle during a unit of time is M a x R e i . The node load is
q i = r ( f m , k , c o u n t ) M a x R e i
where r ( f m , k , c o u n t ) represents the total number of requests during a unit of time for all replicas on U E i . The average load of C t d i can be expressed as
q i ¯ = i = 1 k q i k i n w h i c h k = C t d i . l e n g t h
The HRCD defines a threshold δ ( δ > = 2 ) that can be dynamically adjusted according to actual situations. With the number of requests increasing during a unit of time, the node load increases too. Load balancing is one of the important goals of the HRCD. Since placing replicas on nodes is an important reason for increasing requests, the HRCD assumes that q i satisfies inequality (18) and stops placing replicas on U E i to reduce node load.
q i > = δ × q i ¯
Here, in (18), q i is called the overloaded threshold of U E i . When the load of a replica node reaches its overloaded threshold, it needs to stop responding to data requests. Although more replicas can balance the load of ESs, more replicas can also increase the maintenance burden and waste storage space. Therefore, the HRCD sets the lightweight load of E s i , denoted by E s L i . When the request load of E s i is less than E s L i , there is no need to create a replica within any stable set. Meanwhile, the HRCD also defines a lightweight load threshold for a stable services set, denoted by θ ( θ < = 0.5 ). After placing replicas on the UE within C t d i , if the average load q λ ¯ of C t d i satisfies inequality (19), stop placing replicas on any node within C t d i .
q λ ¯ < = θ × k = 1 k q λ k i n w h i c h , k = C t d i . l e n g t h
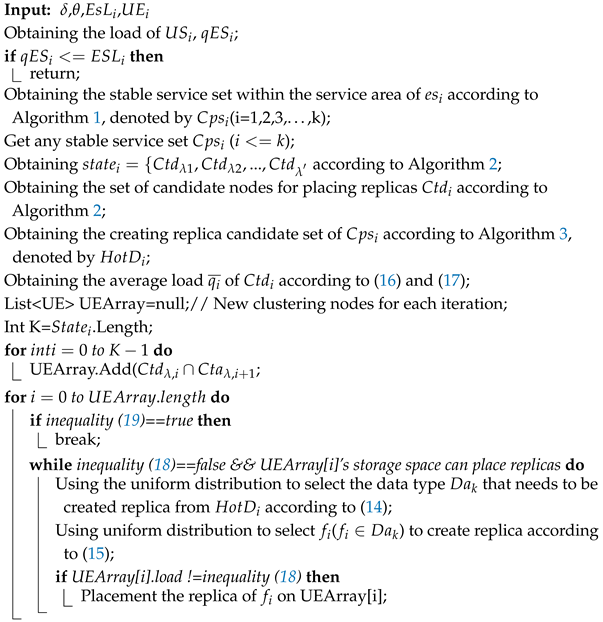
According to the above description, the pseudocode of placing replicas on UE is shown in Algorithm 4.
Algorithm 4: HRCD replica Placement Algorithm
Computers 14 00454 i002
While placing replicas on UE can indeed alleviate the service burden on ESs, there are instances where UE within a stable set is unable to retrieve the requested data locally. In such cases, they still have to request data from the ES. To address this, the HRCD adopts a traditional approach of deploying replicas of hotspot data on ESs based on the frequency of requests. This strategy aims to minimize the amount of UE acting as replica hosts and to reduce data access latency for UE.

5. Performance Analysis

This section theoretically analyzes the time complexity and the efficiency of the HRCD.

5.1. The Time Complexity of the HRCD

When placing replicas on UE, the HRCD designed a total of four algorithms. The first three algorithms are all for the final replica placement service (i.e., Algorithm 4). So, we only analyze the time complexity of Algorithm 4 here. For the time complexity of Algorithm 4, there is the following Theorem 1:
Theorem 1. 
The time complexity of the the HRCD is O( N 3 ).
Proof of Theorem 1. 
In Algorithm 1, line 1 computes the proportion of data labels for each node within the domain, with a time complexity that scales with the length of S d r i , denoted as O(N). Lines 2–4 determine the similarity between a specified node and all other nodes, exhibiting a time complexity of O( N 2 ). Line 5 calculates the average similarity complexity in constant time, O(1). Line 6, leveraging given coefficients, evaluates the similarity between each node and its peers to generate distinct stable service sets, with a time complexity of O( N 2 ). Consequently, the aggregate time complexity of Algorithm 1 is summarized as O( N + N 2 + 1 + N 2 ) = O( N 2 ).
Algorithm 2 constructs an optimal replica placement node and employs fuzzy clustering, specifically leveraging the fuzzy C-means clustering technique, which has been applied in edge computing scenarios [35,36]. The algorithmic complexity of fuzzy C-means clustering is influenced by various factors, including the number of samples (n), the number of classifications (c), the sample dimension (d), and the number of iterations (t), and is typically denoted as O(n c 2 dt) [35,36]. In the context of the HRCD, the sample dimension is fixed at d = 5, and the sample size is determined by k = k3 + 1. As a result, the time complexity of Algorithm 2 in this specific application can be summarized as O(5k c 2 t).
Algorithm 3 incorporates Formulas (10)–(14), which primarily serve to tally the data access attempts by the UE within a specified service area. This process leads to the identification of hotspot data, thereby forming a replica candidate set within a given stable set. The time complexity of this algorithm is intricately tied to the number of nodes contained within the stable set that is being considered for replica placement. In scenarios where all nodes happen to be grouped into a single stable set, represented by k = N , the time complexity escalates to O(N).
Algorithm 4, starting from Line 5, outlines the process of placing replicas within a given stable service set. The frequency of the algorithm’s execution is directly proportional to the number of stable service sets that have been divided. In the most extreme scenario, the UE forms its own stable service set. From Line 5 onwards, the worst-case execution scenario occurs O(N) times. Lines 6–8 involve the execution of Algorithms 1,2,3, respectively, implying that the time complexity for these lines in Algorithm 4 is O(N( ( N 2 )), O(N(5k c 2 t)), and O( N 2 ), respectively. Consequently, the cumulative time complexity can be expressed as O( N 3 ). Lines 16 to 25 describe the process of selecting replica placement nodes from the set of candidate replica nodes and selecting replica data from the set of candidate creation replicas. According to the pseudo-code, the premise of lines 16 to 25 is to give a stable set. Meanwhile, lines 16 to 25 are a nested loop; its time complexity is O( N 2 ). But, for the entire service area, the time complexity is O( N 3 ). In summary, the time complexity of Algorithm 4 is O( N 3 ). □

5.2. The Performance Analysis of the HRCD Algorithm

5.2.1. Analysis of the Success Rate of Replica Requests

In the application scenarios that the HRCD focuses on, compared to the method of sequentially selecting hotspot data as the target for replica creation, the approach adopted by the HRCD can effectively improve the success rate of data access. The analysis is as follows:
First, analyze by selecting the replica data category. In a large community with 6G edge computing, the time-varying nature of nodes is the main reason for the diversity of data categories within the ES service area. Since the data under ESs has geographical locality, data that conforms to the geographical characteristics of ESs has a higher access amount when given ESs. If data is selected sequentially, the type of data has a higher probability of becoming a replica, while other types of data have a lower probability of becoming replicas, resulting in an inability to meet the needs of accessing multiple types of data. the HRCD uses a uniform distribution to select data types according to the requested proportion of the data category. The higher the proportion of requests, the higher the probability of being selected, but data types with a smaller proportion also have a lower probability of becoming replicas. Therefore, this can meet the data access requirements of UE by varying time.
Second is the analysis from the perspective of selecting hotspot data. To address the issue of a single node easily moving out of the service area, it is necessary to select multiple pieces of excellent UE in Edge. If sequentially selecting hotspot data, each node in the excellent node set selects the first few hotspot data as the replica data, while the suboptimal hotspot data has a lower probability of becoming replicas. In the the HRCD method, each node in the excellent node set selects hotspot data as the replica data according to the request proportion. The higher the proportion of requests, the higher the probability of being selected, ensuring the probability of the first few hotspots becoming replica data. At the same time, data with a low proportion of requests can also become replicas, ensuring the demand for suboptimal hotspot data requests. So, we have the following, Theorem 2 (for correct verification of the conclusion, please refer to Experiment 6.3.3.).
Theorem 2. 
In the application scenarios that the HRCD focuses on, compared to sequentially selecting hotspot data as the objects for replica creation, the approach adopted by the HRCD is conducive to improving the success rate of replica access.

5.2.2. Load Balancing Analysis

In the application scenarios that the HRCD focuses on, compared to traditional methods of selecting replica placement nodes (i.e., ES-based in this paper), the HRCD can better balance the edge node load. The analysis is as follows.
Limitations of the ES-Based Method: The neighboring strategy primarily considers physical distance (or network topology distance) and neglects other factors that impact load, such as the request frequency, processing capacity, and activity level of terminal devices. This may result in some edge nodes being overloaded, while others may have lighter loads, leading to system load imbalance. Advantages of the HRCD are that the HRCD not only takes into account physical distance (or network topology distance) but also comprehensively considers multiple factors that impact load. By utilizing fuzzy clustering analysis, it selects the optimal replica placement nodes. This enables the HRCD strategy to better adapt to the mobility of terminal devices and changes in request patterns, dynamically adjusting the replica placement strategy to maintain a balanced system load. So, we have the following Theorem 3 (For correct verification of the conclusion, please refer to Experiment 6.3.1.).
Theorem 3. 
In the application scenarios that the HRCD focuses on, compared to sequentially selecting hotspot data as the objects for replica creation, the approach adopted by the HRCD is conducive to improving the success rate of replica access.

5.2.3. Data Access Latency Analysis

In the application scenarios that the HRCD focuses on, compared to methods based on ESs, the HRCD can reduce the access latency for the terminal. The analysis is as follows.
In large communities with high-density base stations, the dense distribution and time-varying characteristics of terminals result in frequent and volatile data access demands. The HRCD considers more factors (such as backhaul links, load, and bandwidth) when selecting replica placement nodes, enabling it to more accurately select optimal nodes for replica placement. Compared to ES-based methods, the data is positioned closer to the terminals with access demands. Furthermore, when selecting objects for replica creation, the HRCD prioritizes the data types to be replicated, taking into account the geographical locality features of ESs. This means that the HRCD not only focuses on the physical location of nodes but also the correlation between data types and nodes, further optimizing data access efficiency. In summary, by comprehensively considering multiple factors to select optimal replica placement nodes and creation objects, the HRCD employs more refined strategies and considers more influencing factors to optimize data access latency, thereby improving the overall performance of the system. So, we have the following Theorem 4 (For correct verification of the conclusion, please refer to Experiment 6.3.2.).
Theorem 4. 
In the application scenarios targeted by the HRCD, compared to ES-based methods, the HRCD can effectively reduce the access latency for terminals.

6. Discussion

6.1. Comparison Approaches and Experimental Settings

We compared the traditional method (named ECRP), the HRCD-O method, and the HRCD to show the superiority of the HRCD. The replica placement method for ECRP is the following: It selects hotspot data within the communication area as a replica and places the replica on ESs, such as in paper [12,14,15] in Table 1, which adopts the approach of placing replicas in ESs. The HRCD-O refers to the method of selecting replica creation objects in an ordered manner according to Theorem 2. The method of obtaining a stable set and selecting a set of replica placement nodes within the stable set is consistent with the HRCD, except for selecting replica creation objects and replica placement nodes sequentially. The HRCD-O places replicas in ESs or end through edge-end collaboration, such as in paper [28] in Table 1, which adopts the approach of placing replicas in ESs.
To verify the performance of the HRCD, we designed and implemented a simulation platform using VS according to Edge architecture. The experiment employed the publicly accessible dataset BSDS500 [38]. The simulation topology, depicting a vast community comprising numerous micro base stations, is presented in Figure 1. Each base station has a designated service area that remains fixed. Consistent with the attributes of 6G cellular networking, when the service zones of two distinct micro base stations converge, the terminal opts for the base station with the shorter topological distance to serve as its connection point. During the experiment, images were allocated to various base stations based on the edge annotations provided in the dataset, mirroring the geographically confined nature of data access in the real world. Furthermore, we postulate that each terminal node possesses a professional attribute, reflecting the occupations of actual terminal users. Depending on their professional attributes, terminals request diverse datasets from different base stations or from other terminals within the service area of a base station. Additionally, we hypothesize that each terminal node follows a “preset route” (as exemplified by UE1 tracing the red path A-B-D-E-C-A in Figure 1), simulating the movement patterns of real-world terminal users who traverse different locations due to their varying occupations.

6.2. Comparison Performance

The simulation platform was developed using Visual Studio 2015 to model the 6G edge computing environment, including cloud centers, edge servers (ESs), user equipment (UE), and UE mobility patterns. To handle fuzzy clustering analysis in the HRCD (Section 4.3), we utilized MATLAB R2020a with its built-in Fuzzy C-Means (FCM) function (fcm) for clustering terminal nodes based on their service capabilities (e.g., load, bandwidth). The BSDS50 dataset was integrated into the platform to simulate geographically localized data access patterns. The simulation code and supporting data are available as Supplementary Material. The simulation defines some user-defined variables involved in the HRCD, as shown in Table 4 below.
In the simulation experiment, we compared the following performance metrics:
(1) Average Load: Given that the primary objective of the HRCD is to diminish the load on ESs by deploying replicas in UE, we assessed the average load of nodes under various methodologies.
(2) Average Access Latency: Placing replicas on ESs can significantly reduce data access latency for terminals, aligning with the HRCD’s goal. Consequently, we compared the average access latency of requests across different methods.
(3) Replica Access Success Rate: As previously analyzed, the HRCD can achieve a higher success rate for accessing replicas. Therefore, we evaluated the success rate of replica access within a stable set under different methodologies.
(4) Replica Coefficient: While increasing the number of replicas can lead to lower data access latency and better load balancing, it also entails higher storage consumption and maintenance costs. Thus, finding a reasonable balance between the number of replicas and system performance is crucial. Therefore, the simulation compared the replica coefficient of different methods to confirm that the HRCD can achieve superior performance with fewer replicas.

6.3. Experimental Results

6.3.1. The Average Load

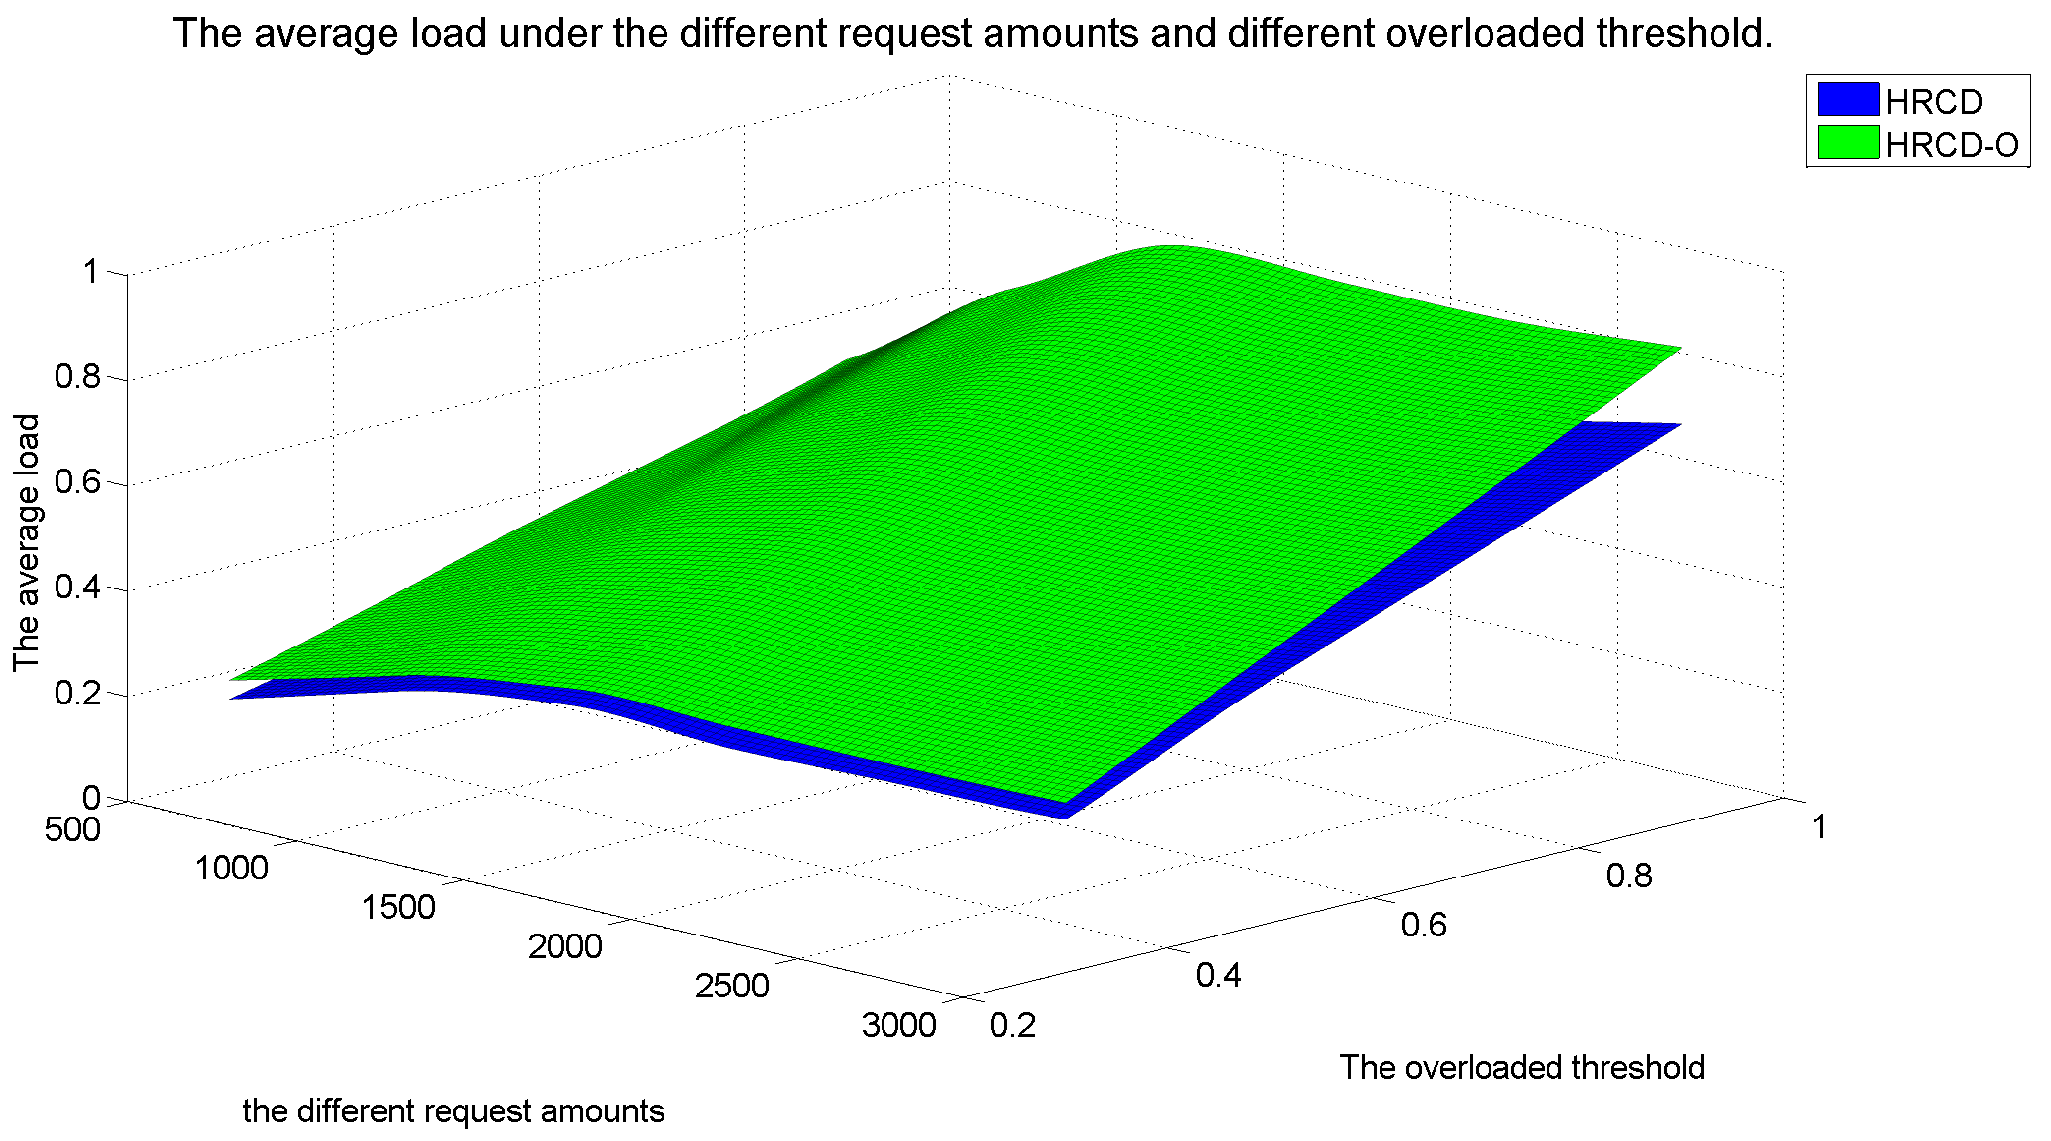
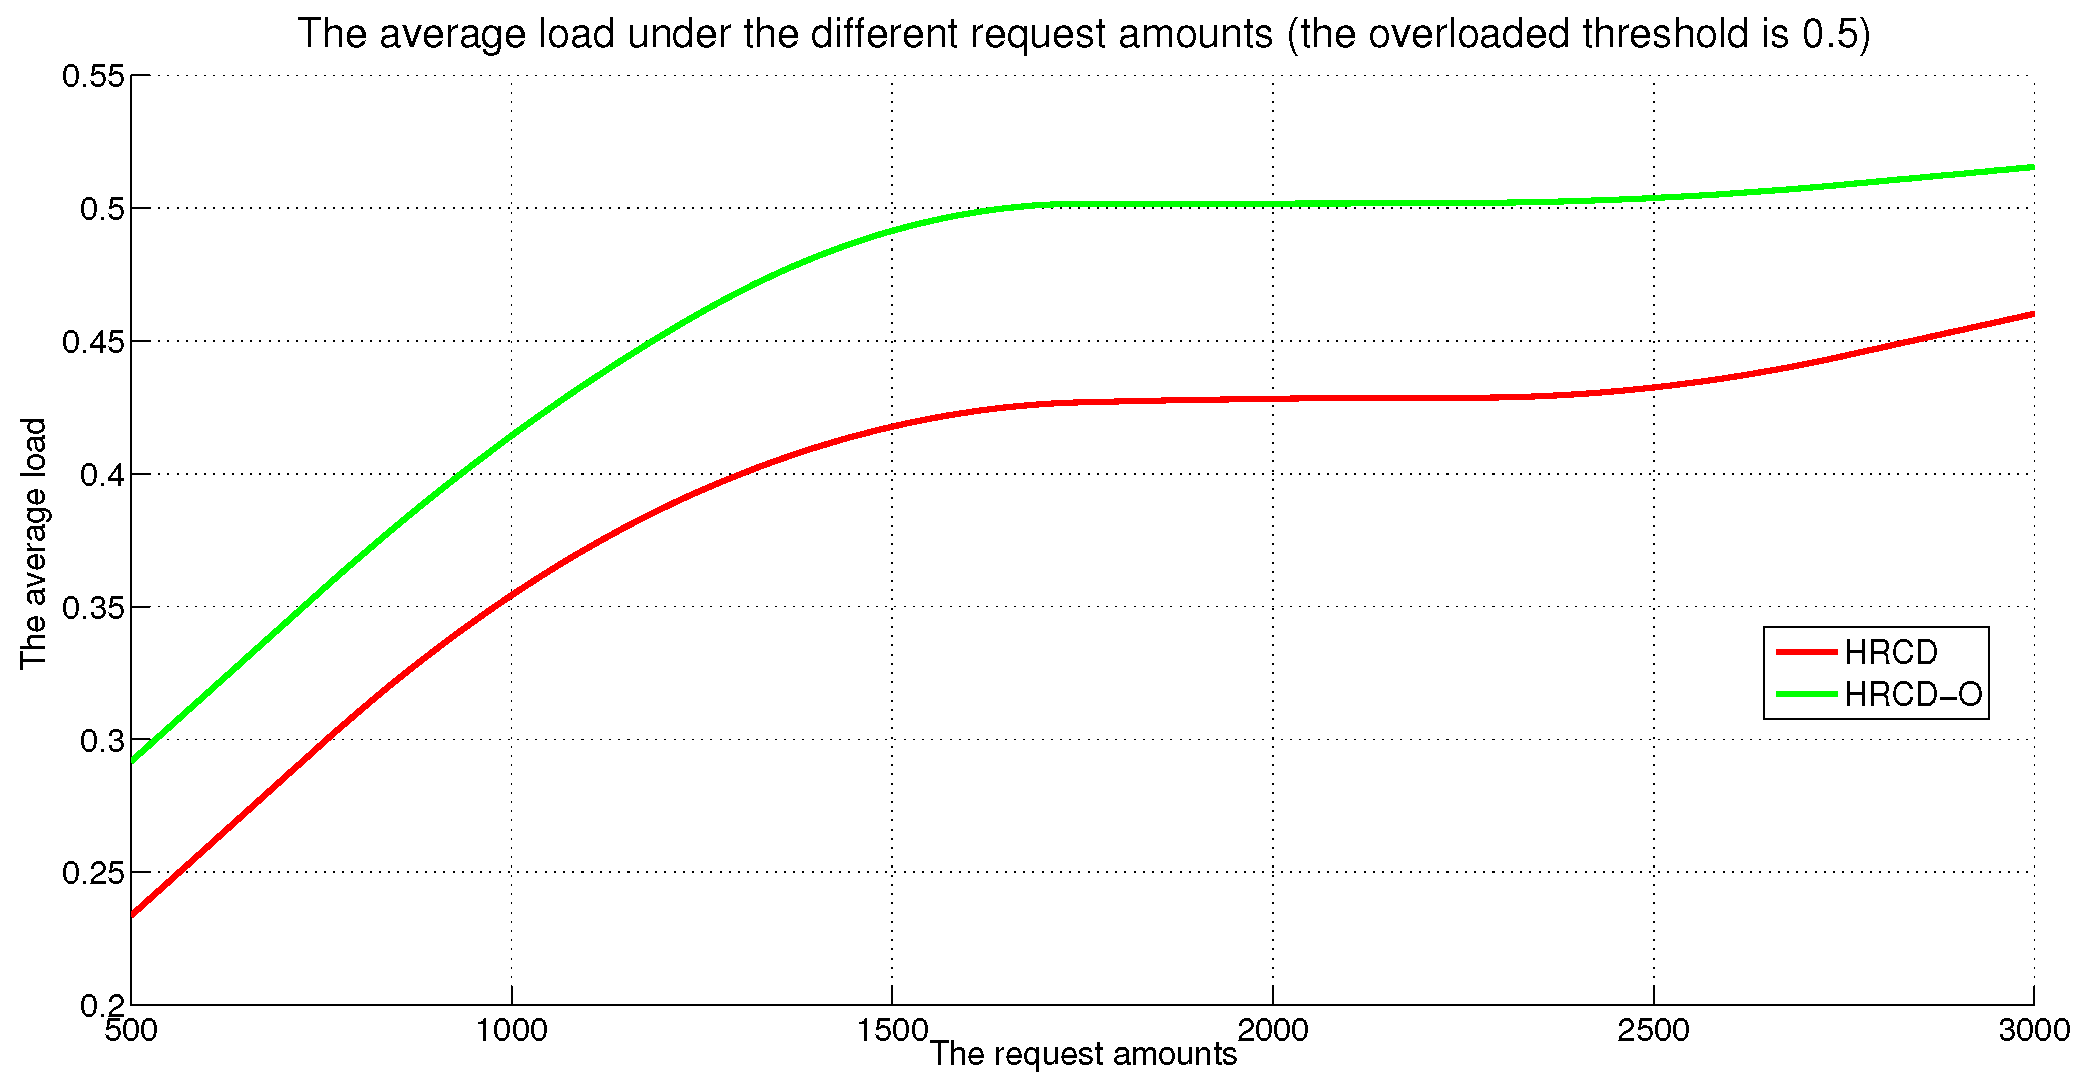
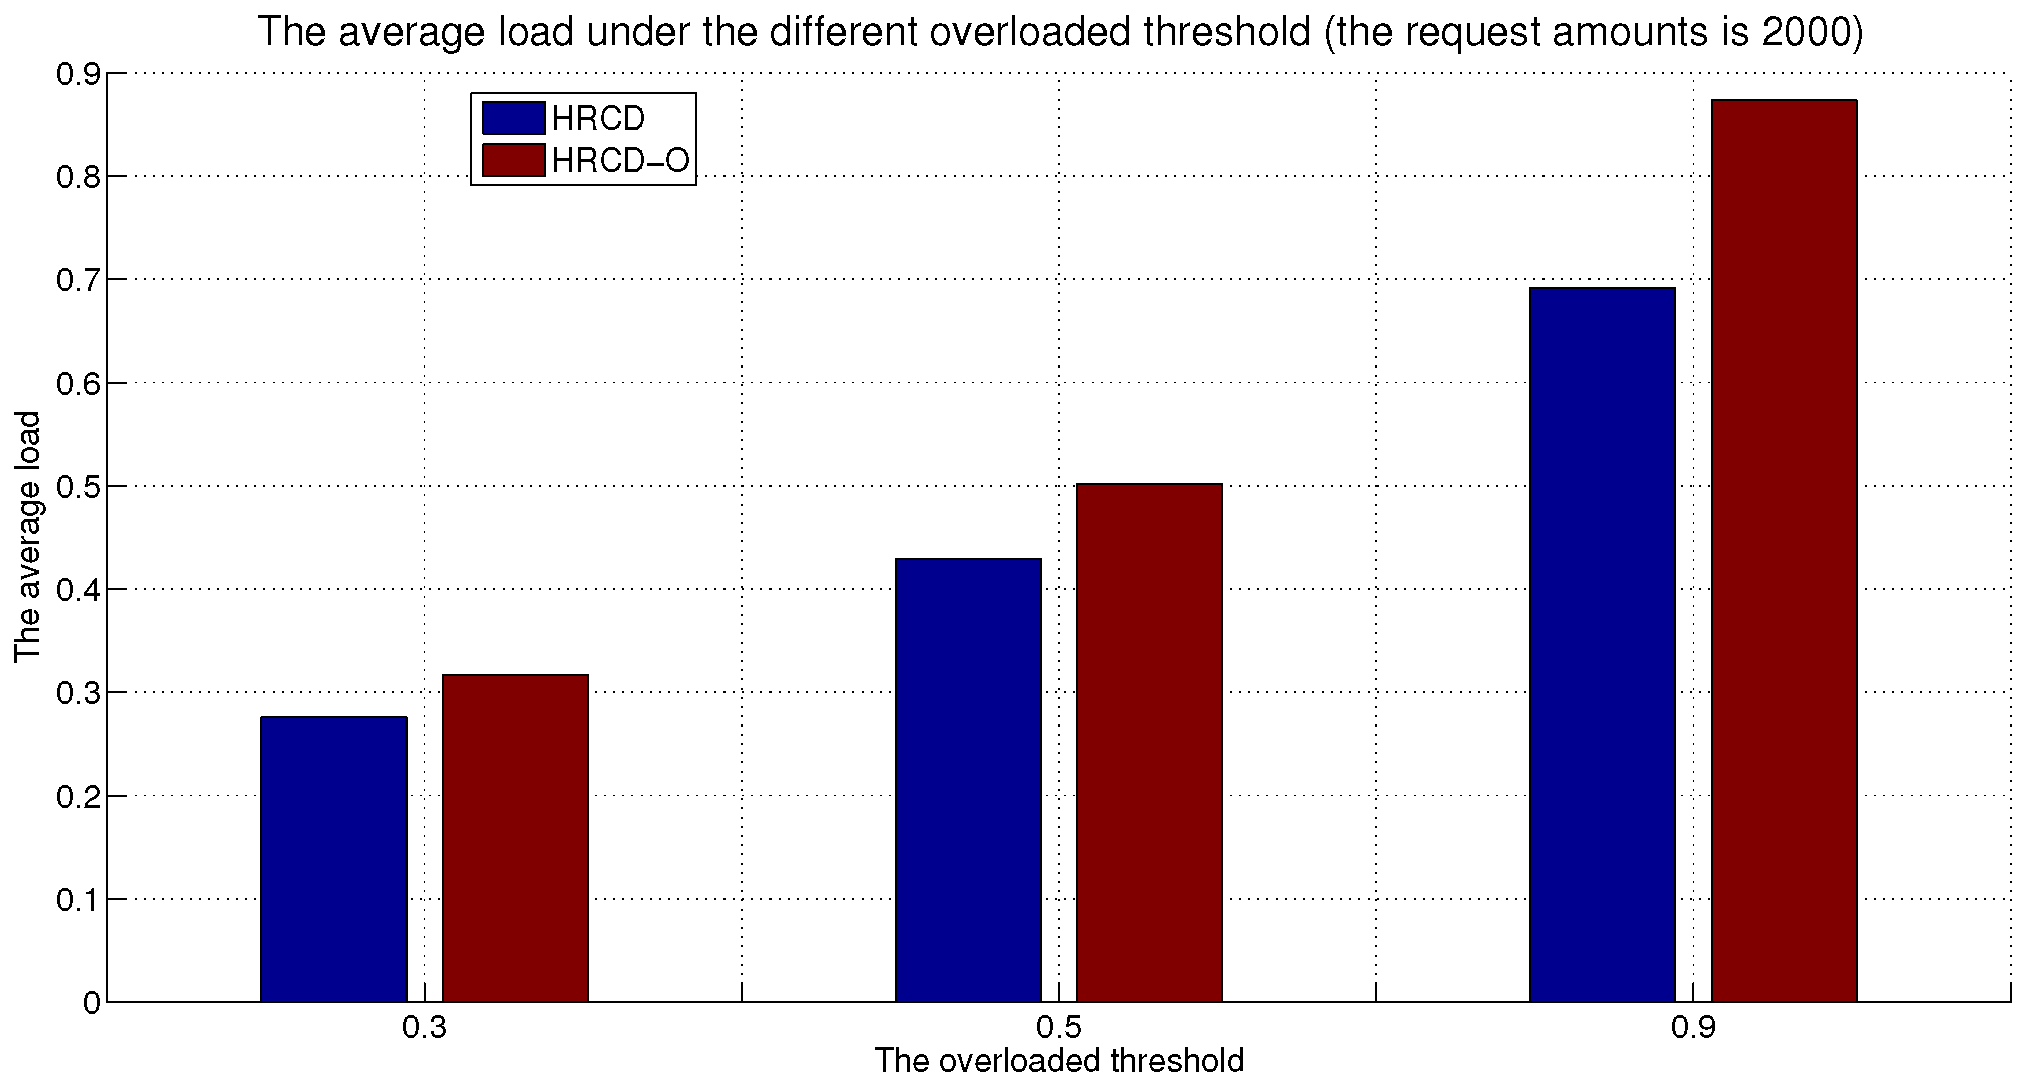
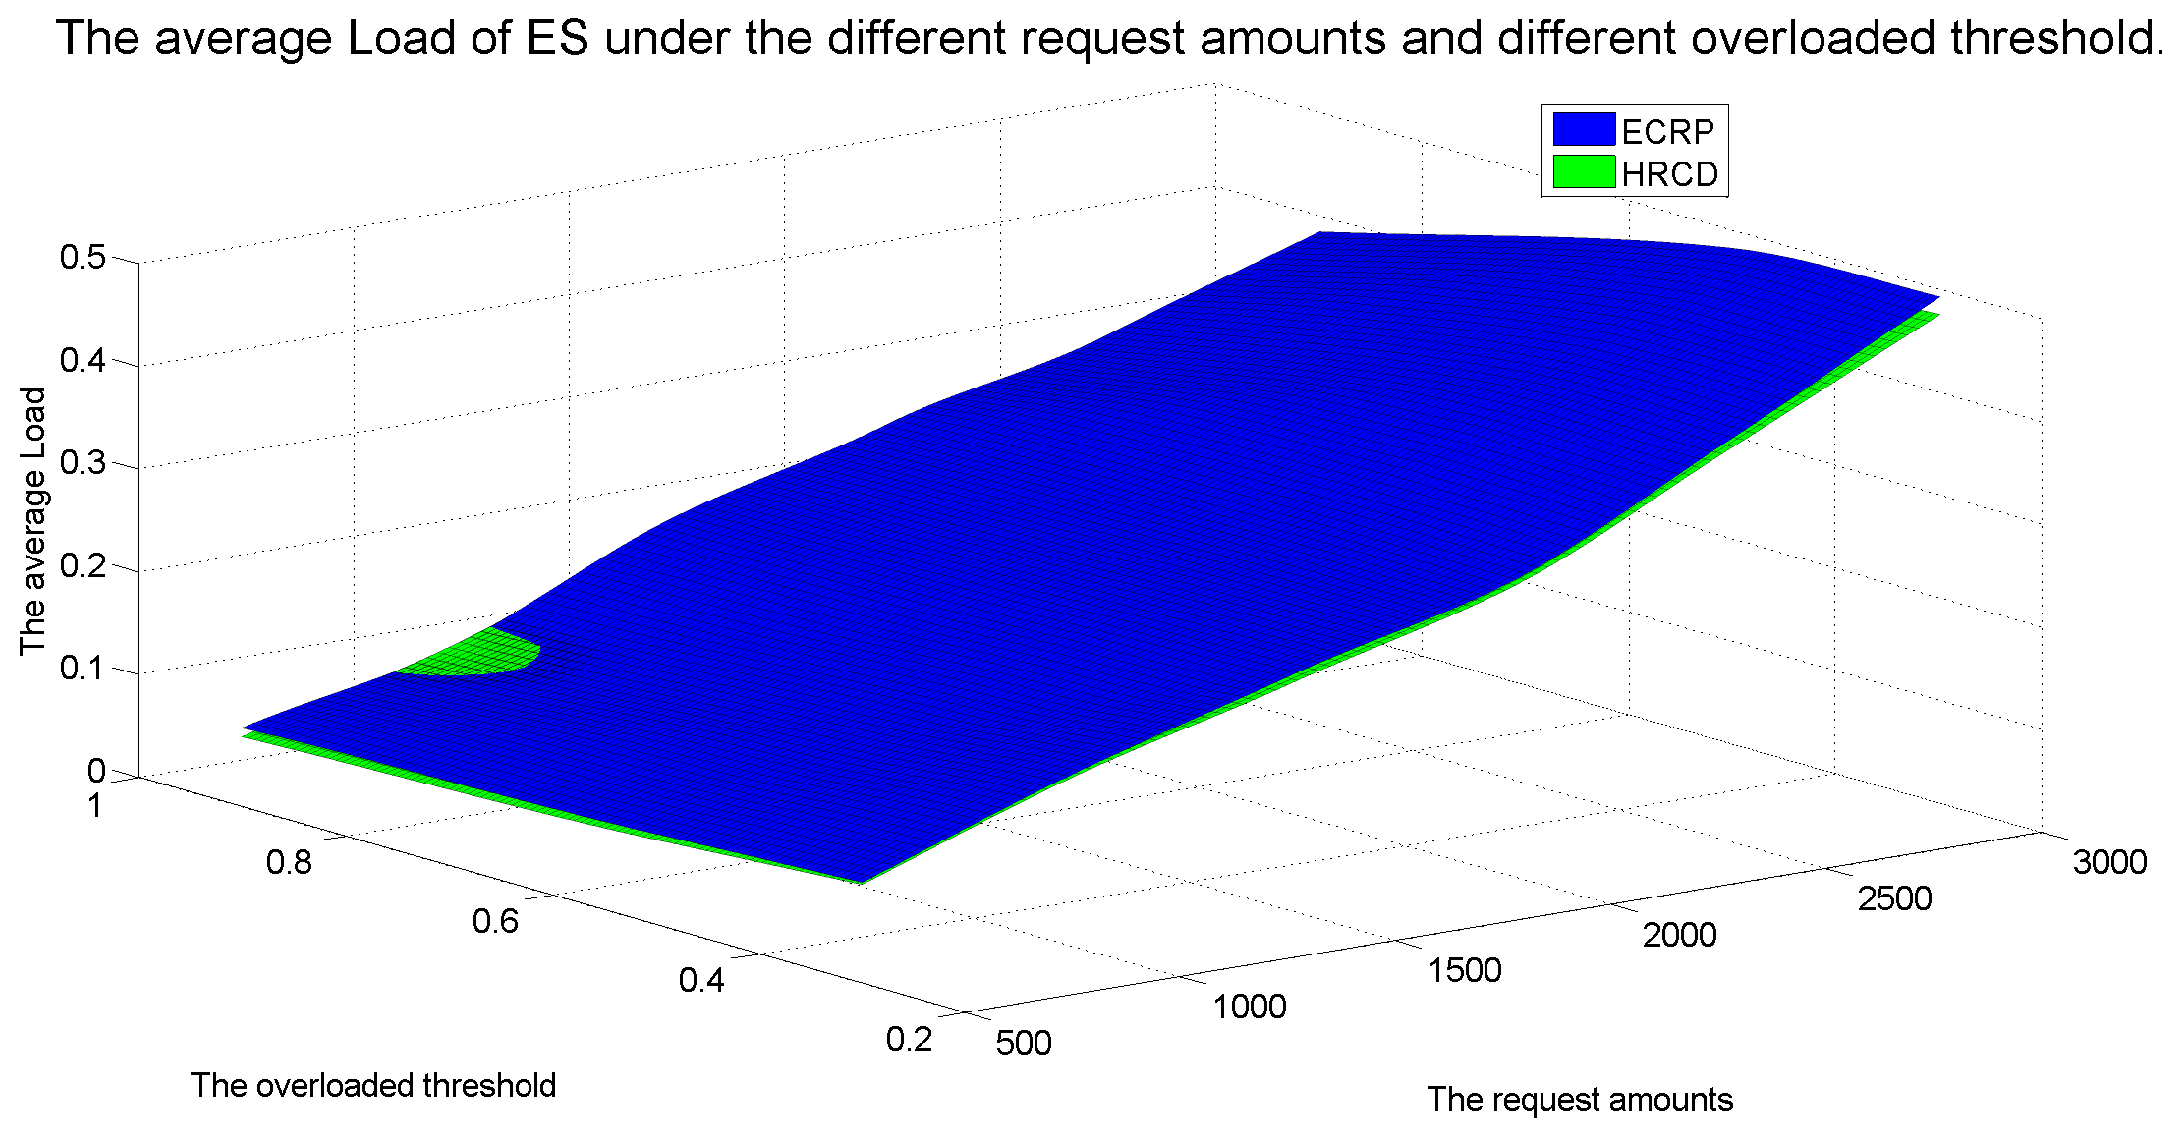
Figure 2, Figure 3, Figure 4, Figure 5, Figure 6 and Figure 7 show the average load of different methods to verify that the HRCD can balance the load of stable set nodes and ESs. Figure 5, Figure 6 and Figure 7 represent the average load of ESs.
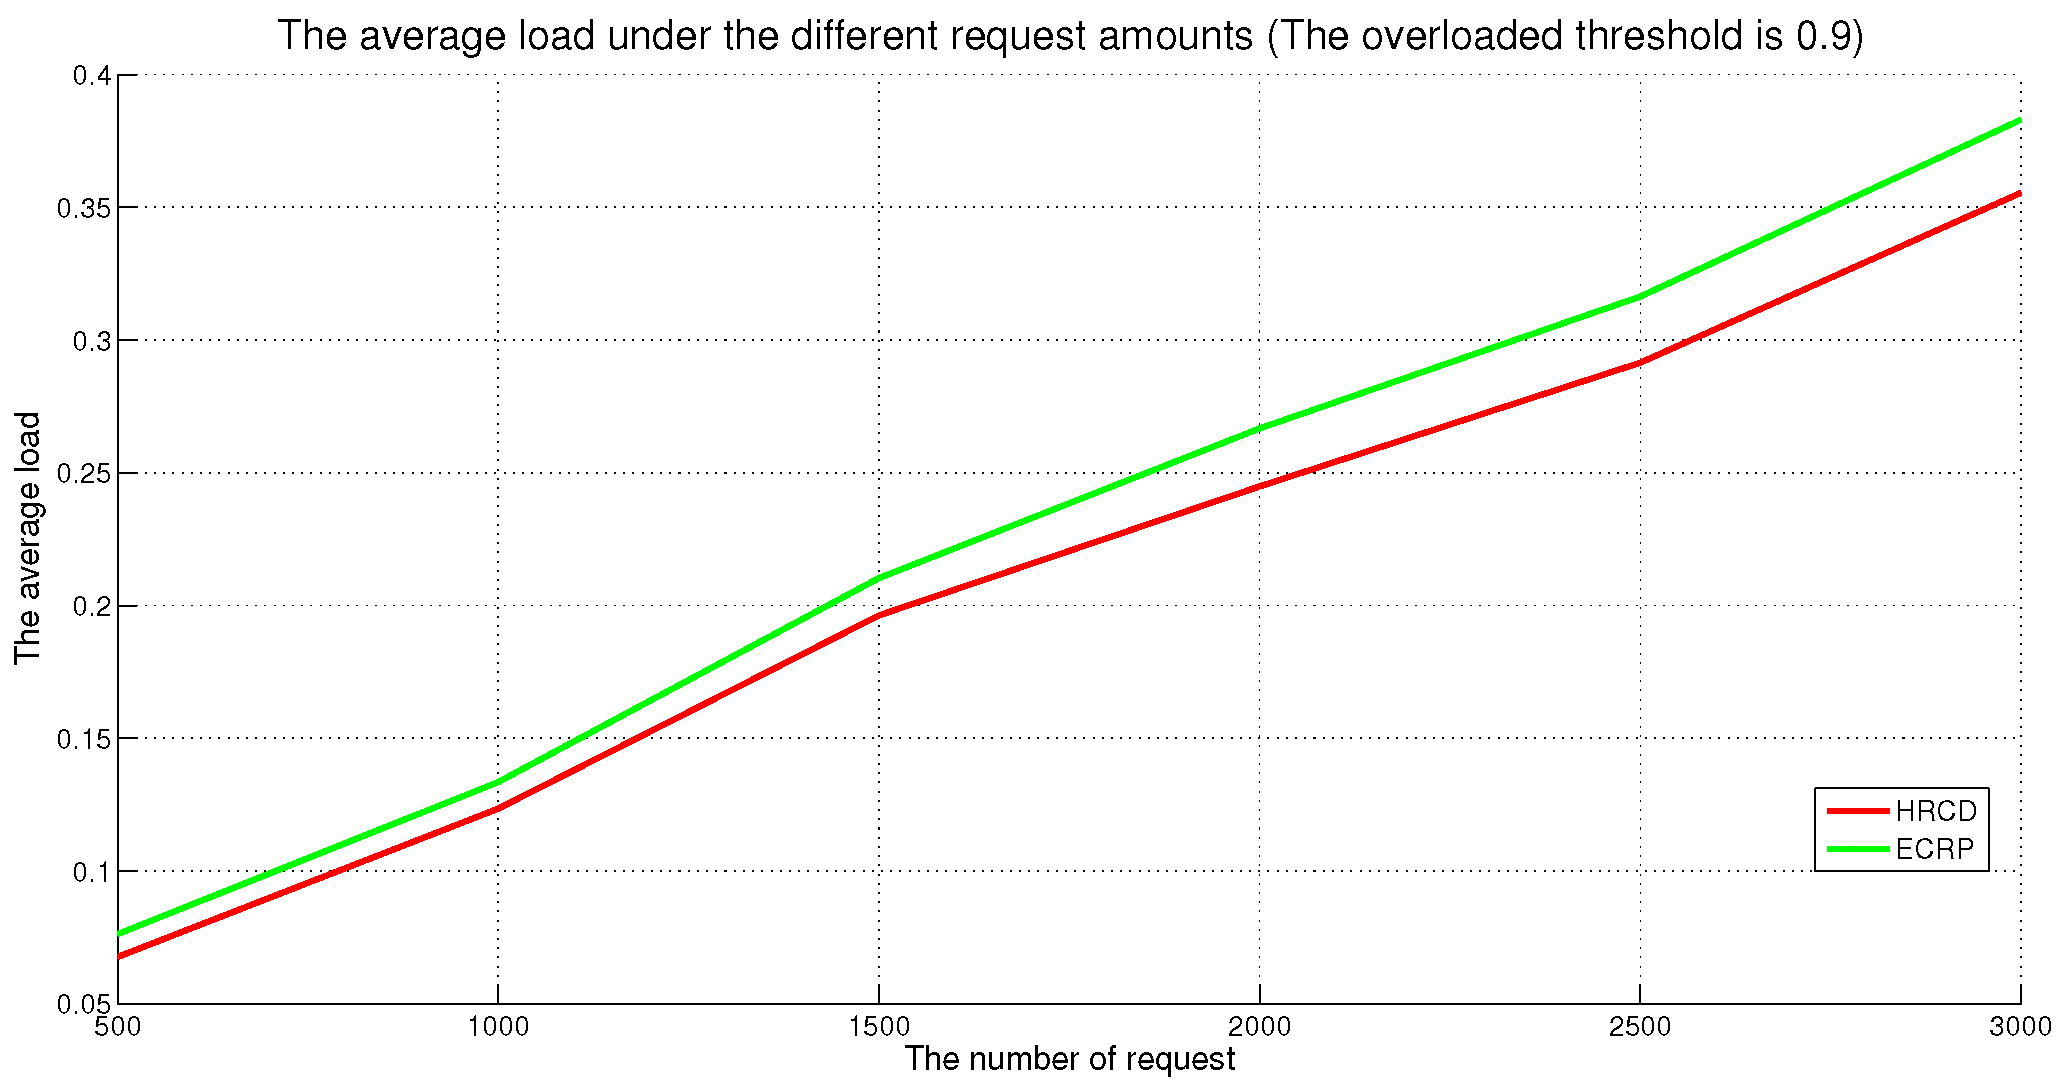
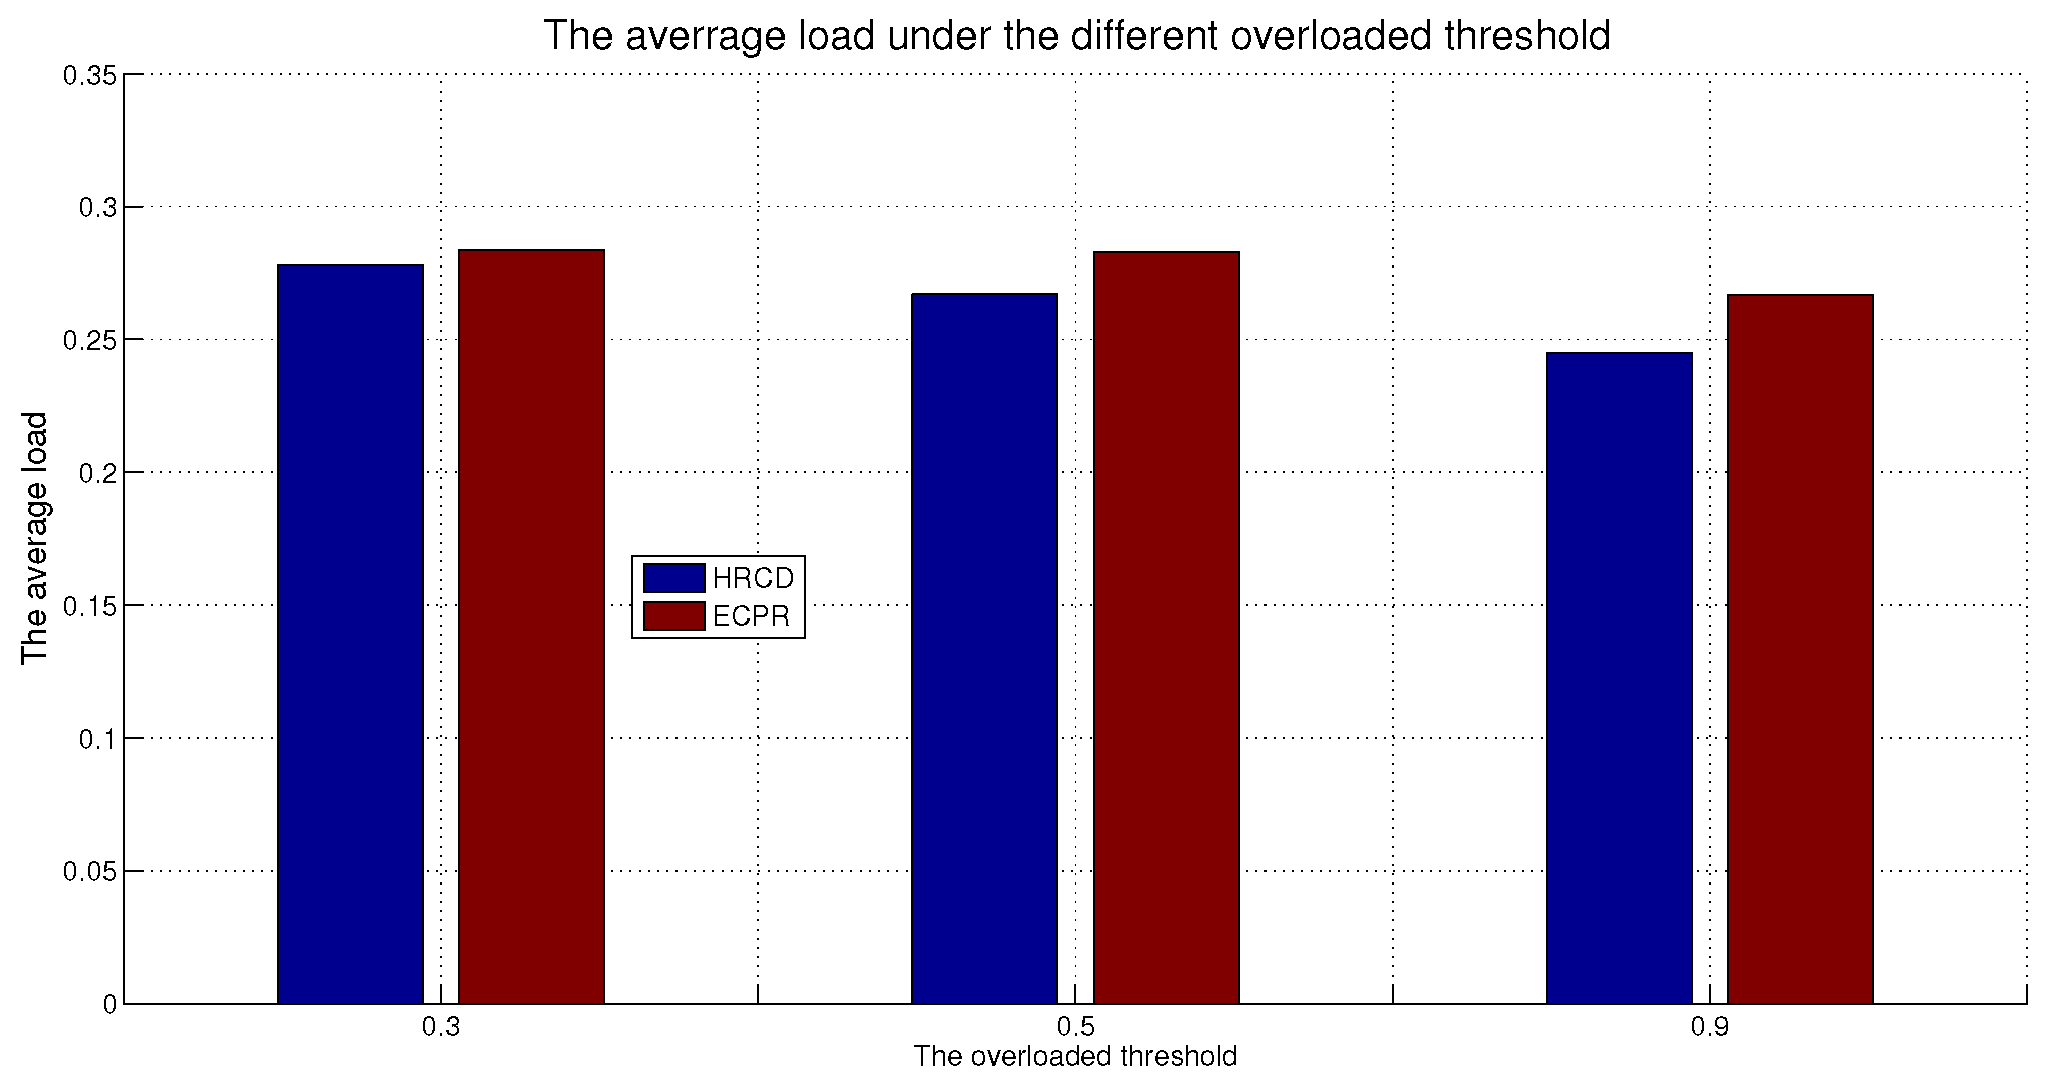
From Figure 2, Figure 3 and Figure 4, we observe that the average load exhibits an upward trend as both the number of requests and the overload threshold increase. This is attributed to the fact that a larger number of requests translates into higher pressure on the replica node, thereby elevating the average load. Additionally, a higher overload threshold for a node implies that the replica UE can accommodate more access, leading to an increase in the node’s average load as well.
From Figure 2, it is evident that the HRCD’s average load is approximately 5% lower than that of the HRCD-O. As the number of requests increases, the difference between the two gradually narrows. This is due to the HRCD’s strategy of selecting multiple “excellent” nodes within the stable set as replica placement nodes, which prevents other nodes in the stable set from being unable to request replicas when the replica node moves out of the ES service area. Furthermore, multiple nodes providing replica services can effectively balance the load within the stable set. In contrast, the HRCD-O selects the “best” node with the highest similarity to the virtual node within the stable set as the replica placement node, without considering the involvement of other nodes in the replica service. Consequently, its ability to balance node load is inferior to the HRCD. Additionally, both methods halt the creation of replicas when the node’s load reaches a predefined threshold. As the number of requests increases, replica nodes gradually become overloaded and cease responding to data requests, leading to a gradual convergence of the average load between the two methods.
From Figure 5, Figure 6 and Figure 7, we understand that both the HRCD and the HRCD-O are capable of effectively balancing the load of ES. As the number of requests increases, the load on the ES also rises. Conversely, as the overload threshold of a node increases, the load on the ES decreases. This is because a higher number of requests leads to a higher load, while a larger overload threshold allows the replica UE to handle more access, thereby reducing the load on the ES. In other words, when the replica UE bears more load, the ES bears less load, resulting in a decrease in load on the ES as the overload threshold increases.
Compared to the HRCD-O, the HRCD exhibits superior performance with an average load reduction of approximately 2%. This is attributed to the fact that both the HRCD and HRCD-O employ the strategy of placing replicas on UE to balance the load on the ES. However, when providing replica services, the HRCD allows multiple nodes within a stable set to participate in the service, whereas the HRCD-O only selects the “optimal” node. It is well established that a greater number of service nodes participating leads to better load balancing, explaining the HRCD’s advantage over the HRCD-O.
Meanwhile, from Figure 2, Figure 3 and Figure 4, we can observe that when the number of requests is relatively low during a unit of time, there is a difference between the two methods. However, as the number of requests increases, the gap between them gradually widens. This is due to the fact that when the request volume is low, a single “optimal” node participating in the service can effectively balance the load on the ES. However, as the number of requests grows, this “optimal” node gradually becomes overloaded and ceases to respond to further requests.
In summary, the HRCD and HRCD-O identify a stable set based on data access similarity and inherent attribute similarity and select “excellent” nodes within this set to place replicas. This approach helps reduce the load on ESs. Furthermore, the HRCD’s method of selecting multiple “optimal” nodes within the stable set to participate in replica services is more effective at balancing the system’s load compared to the HRCD-O, which only selects a single “optimal” node.

6.3.2. The Average Access Delay

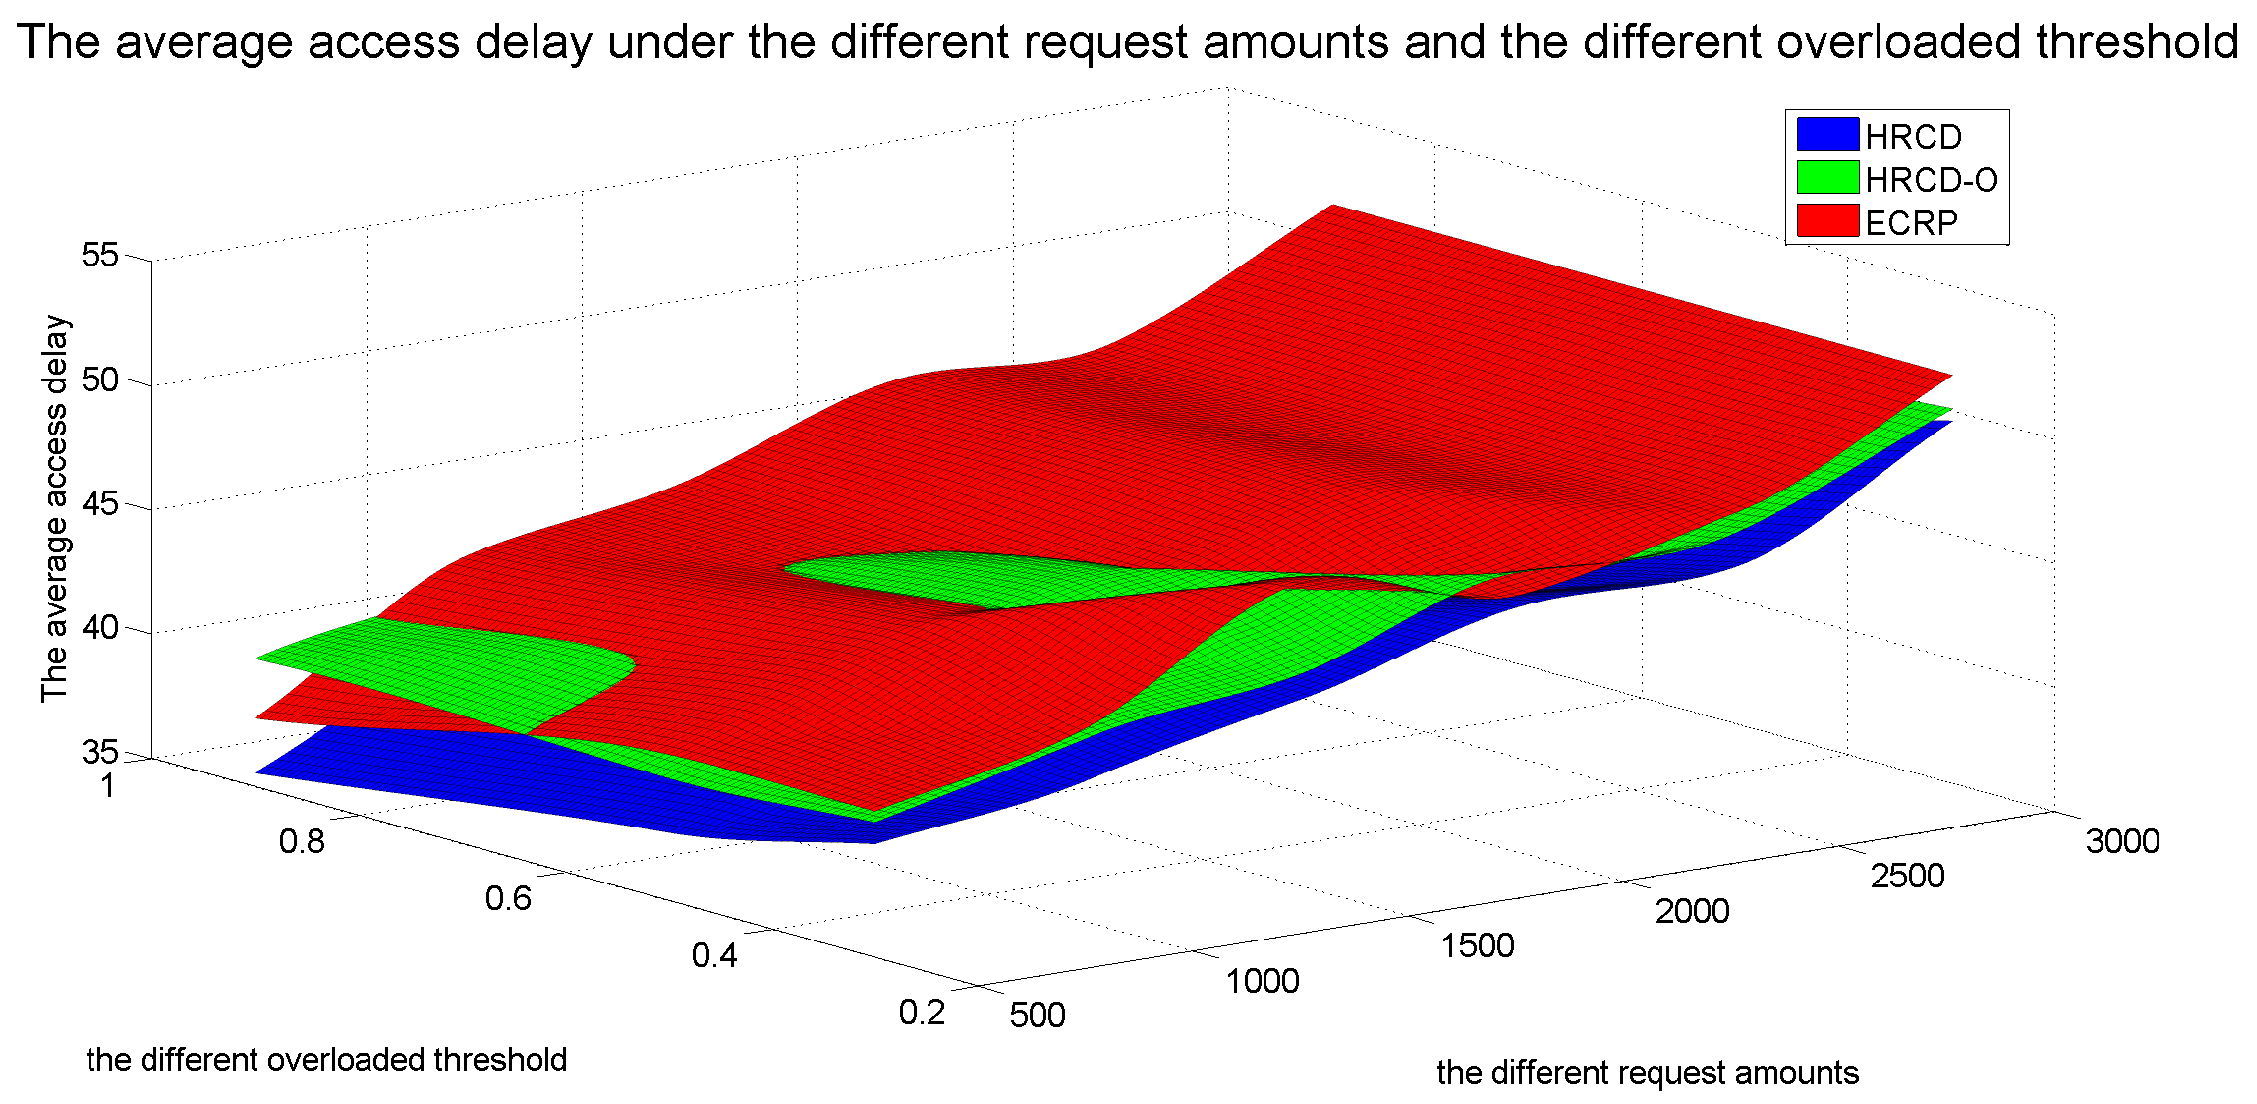
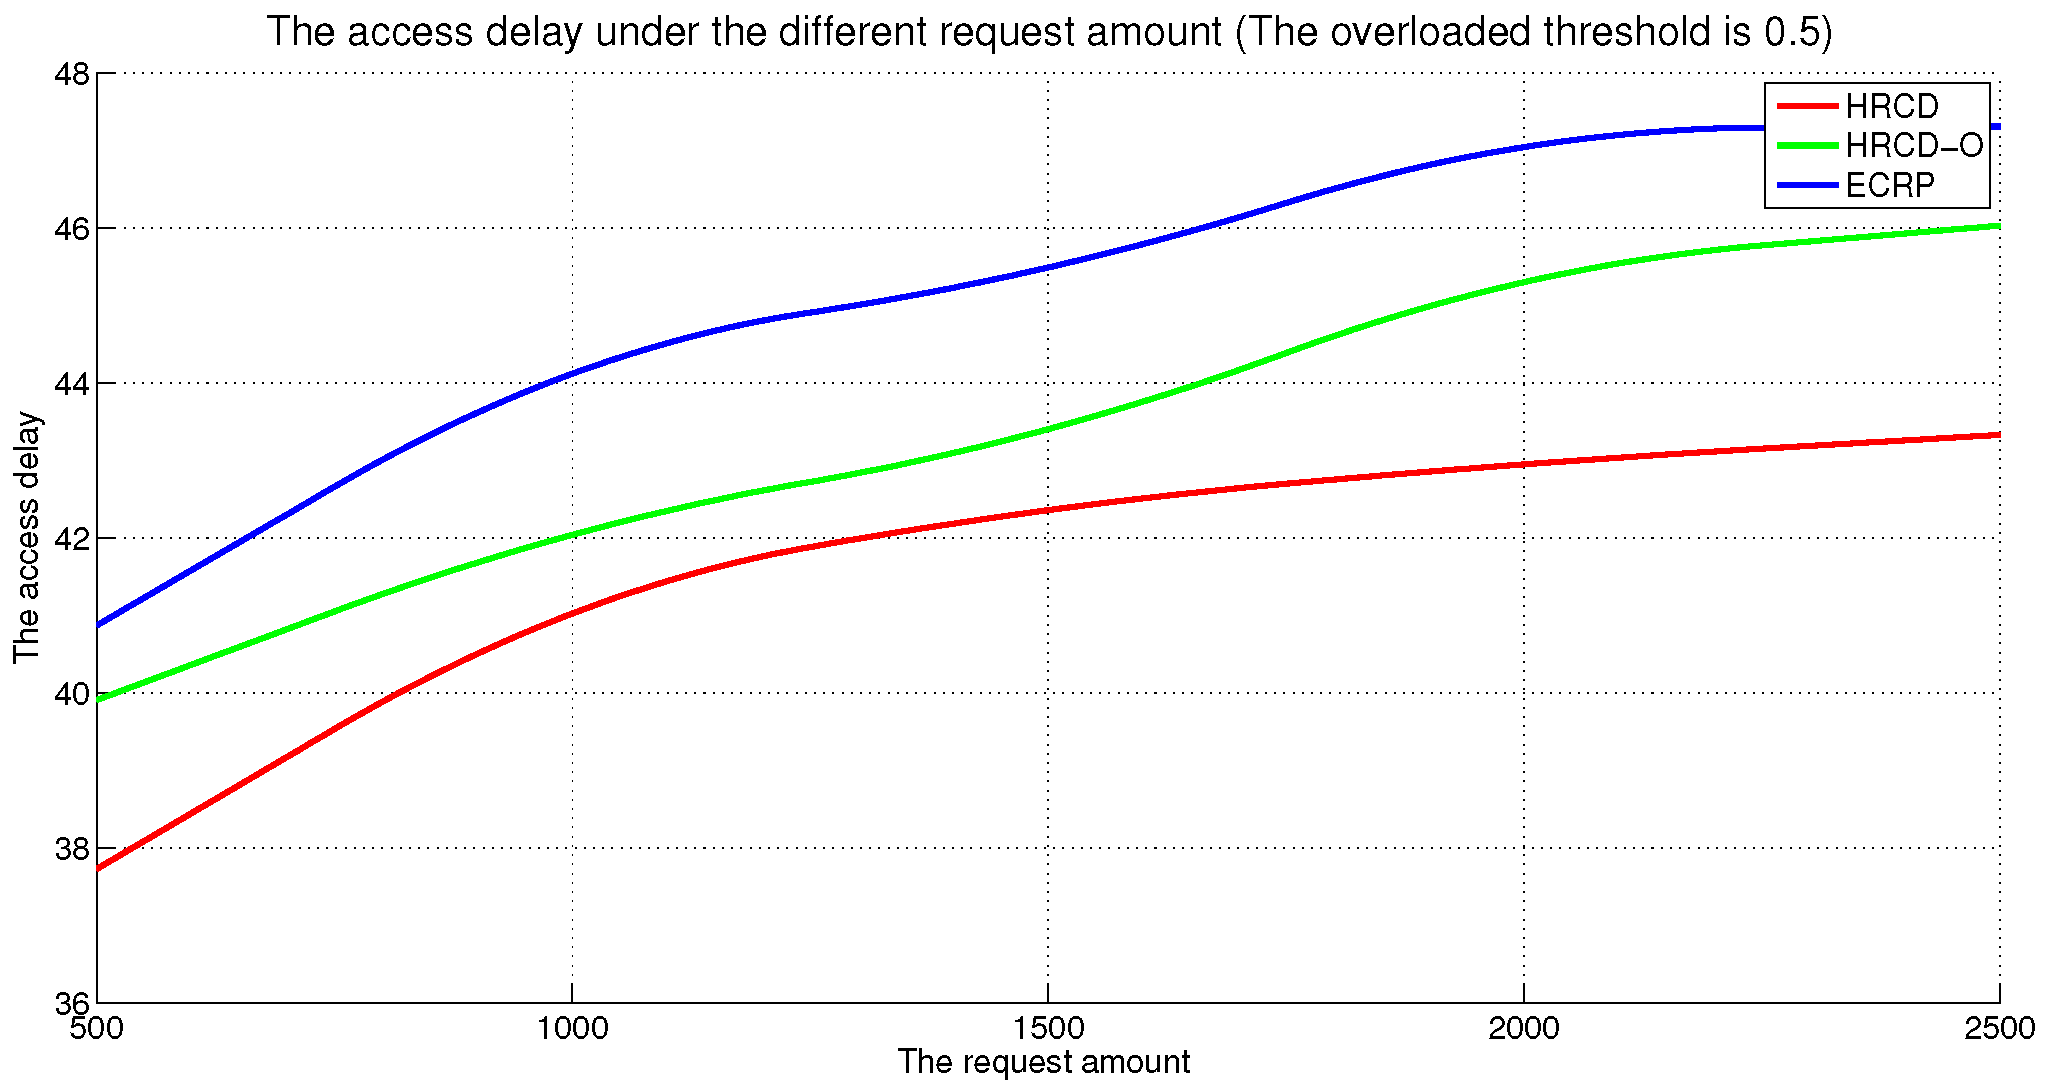
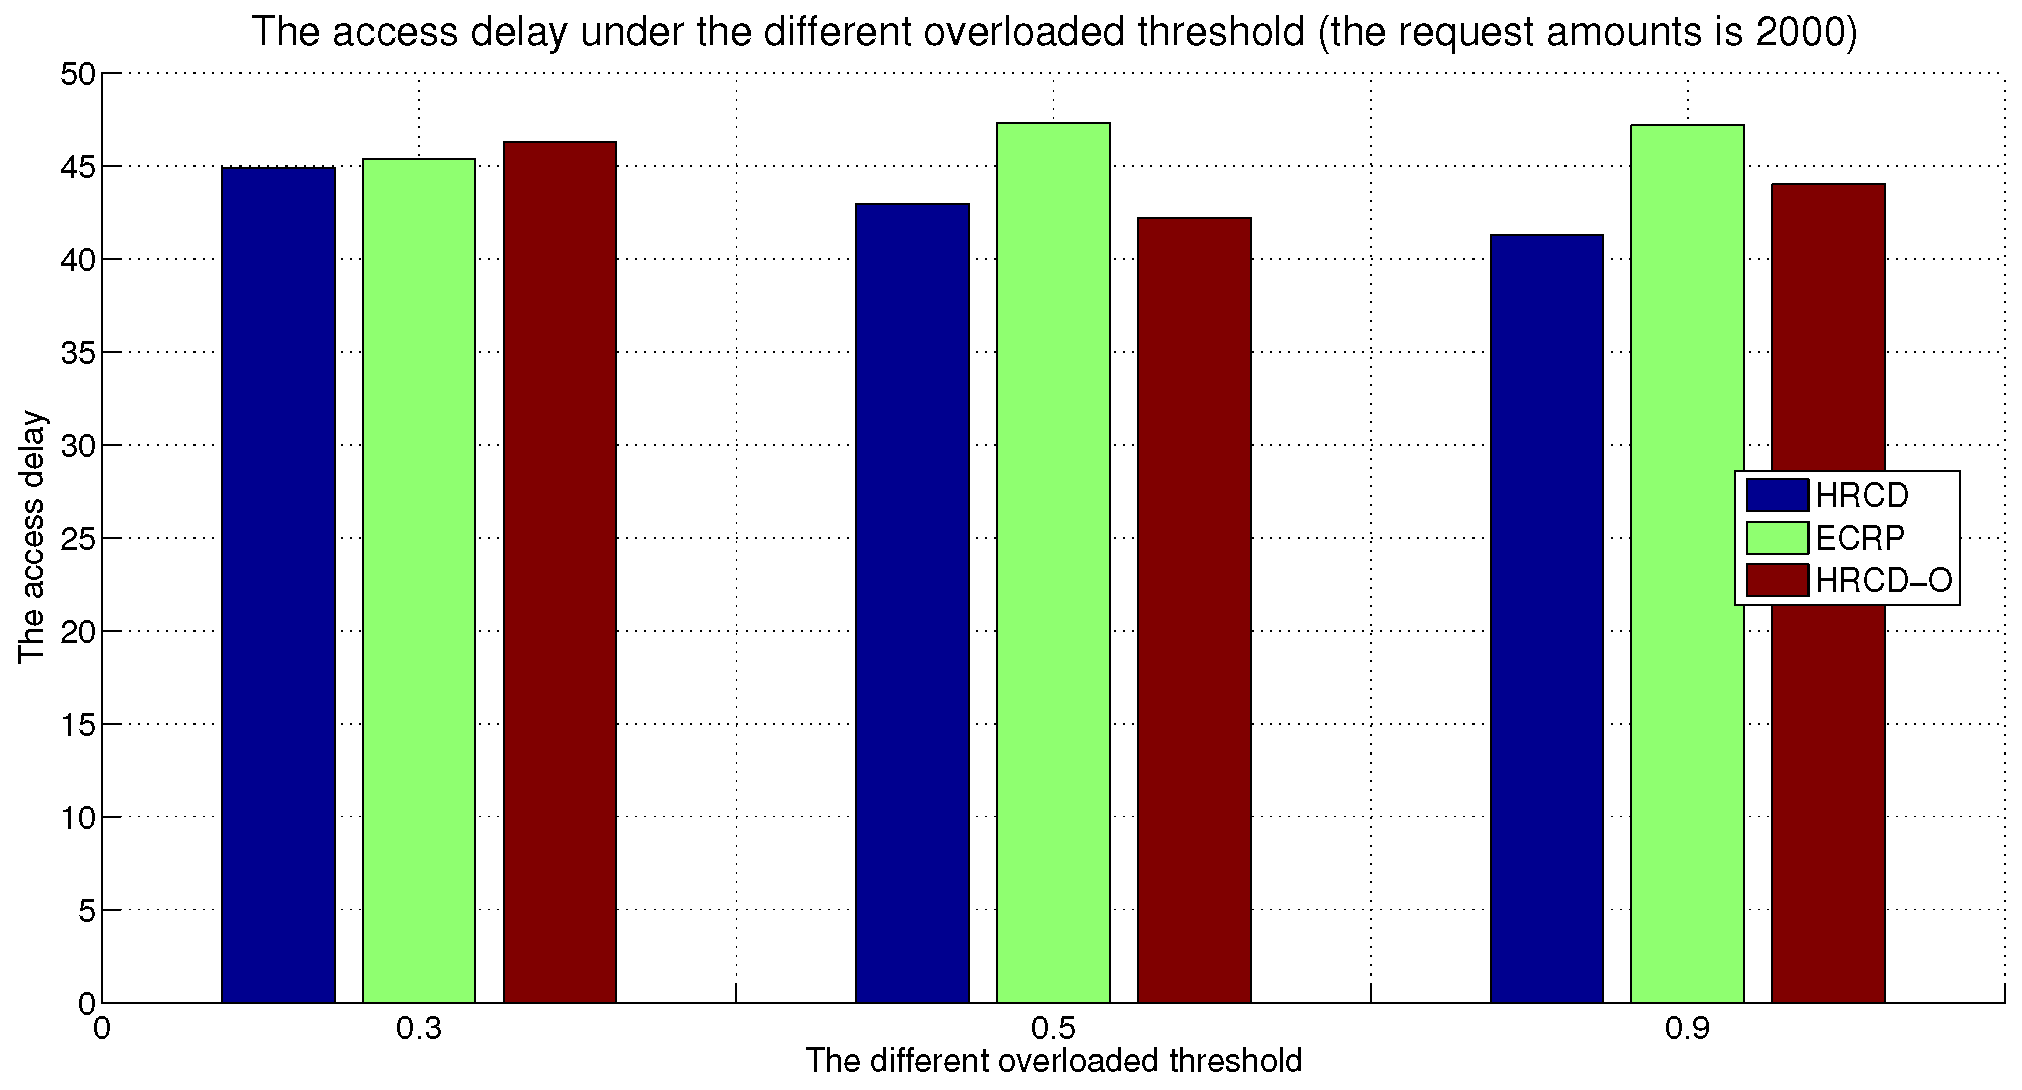
Figure 8, Figure 9 and Figure 10 show the average access latency of different methods to verify the HRCD can obtain the lower access latency.
From Figure 8, Figure 9 and Figure 10, it is evident that the HRCD has the lowest access latency, while the ECRP exhibits the highest latency. Specifically, the HRCD has reduced the average access latency by 6 time units compared to the ECRP, and the HRCD-O has decreased it by approximately 3.5 time units. This is because both the HRCD and HRCD-O place replicas on UE, bringing the replica closer to the access source and thereby reducing access latency. When selecting a replica placement node, the HRCD prioritizes selecting multiple nodes with a higher similarity to the optimal virtual node based on the clustering situation. This approach not only considers the “optimal” node but also takes into account the load balancing within the stable set of the UE and the time-varying nature of nodes. In contrast, the HRCD-O only selects the node with the highest similarity to the virtual “optimal” node as the replica placement node, without considering the time-varying nature of the node and the load-balancing issue of UE nodes. Consequently, the average access latency of the HRCD is lower than that of the HRCD-O.
From Figure 8, Figure 9 and Figure 10, it is apparent that there is a close correlation between latency and the number of requests within a unit time. Specifically, as the number of requests increases, the access delay also rises. This trend is characterized by rapid growth in the early stages and relatively gradual changes in the later stages. The reason for this phenomenon is that as the number of requests increases, the load on the replica nodes gradually reaches a predetermined threshold, rendering them overloaded and unable to respond to further requests. In the early stages of request growth, the HRCD and HRCD-O primarily rely on the UE that host replicas use to respond to requests. Consequently, as the number of requests increases, the average access delay also increases rapidly. However, as the number of requests continues to grow, the UE becomes unable to handle all the requests, and they are increasingly processed by ESs. This shift in responsibility results in more gradual changes in access latency.
In summary, the HRCD can effectively reduce data access latency.

6.3.3. The Success Rate of Replica Accessing

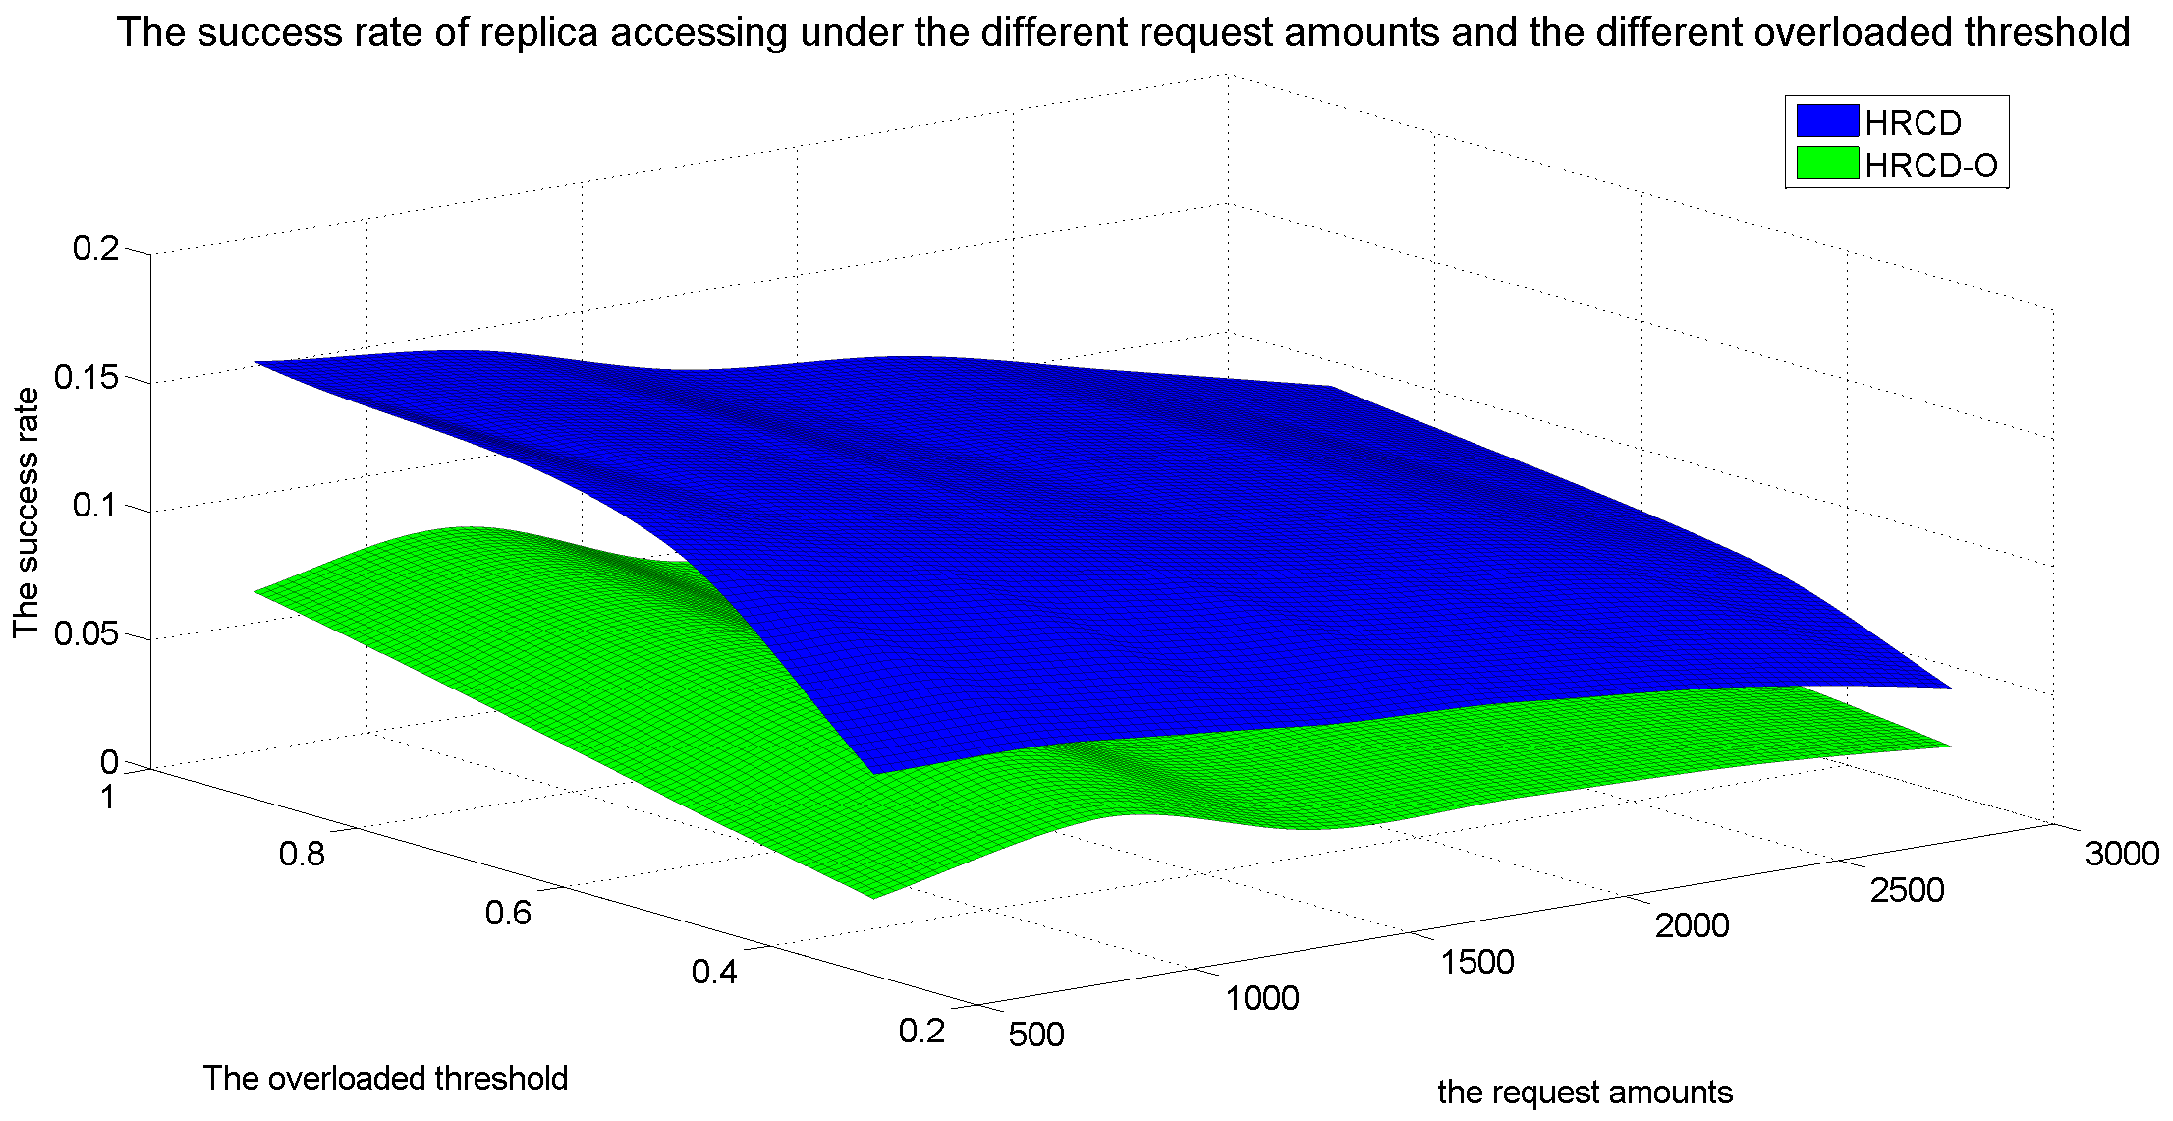
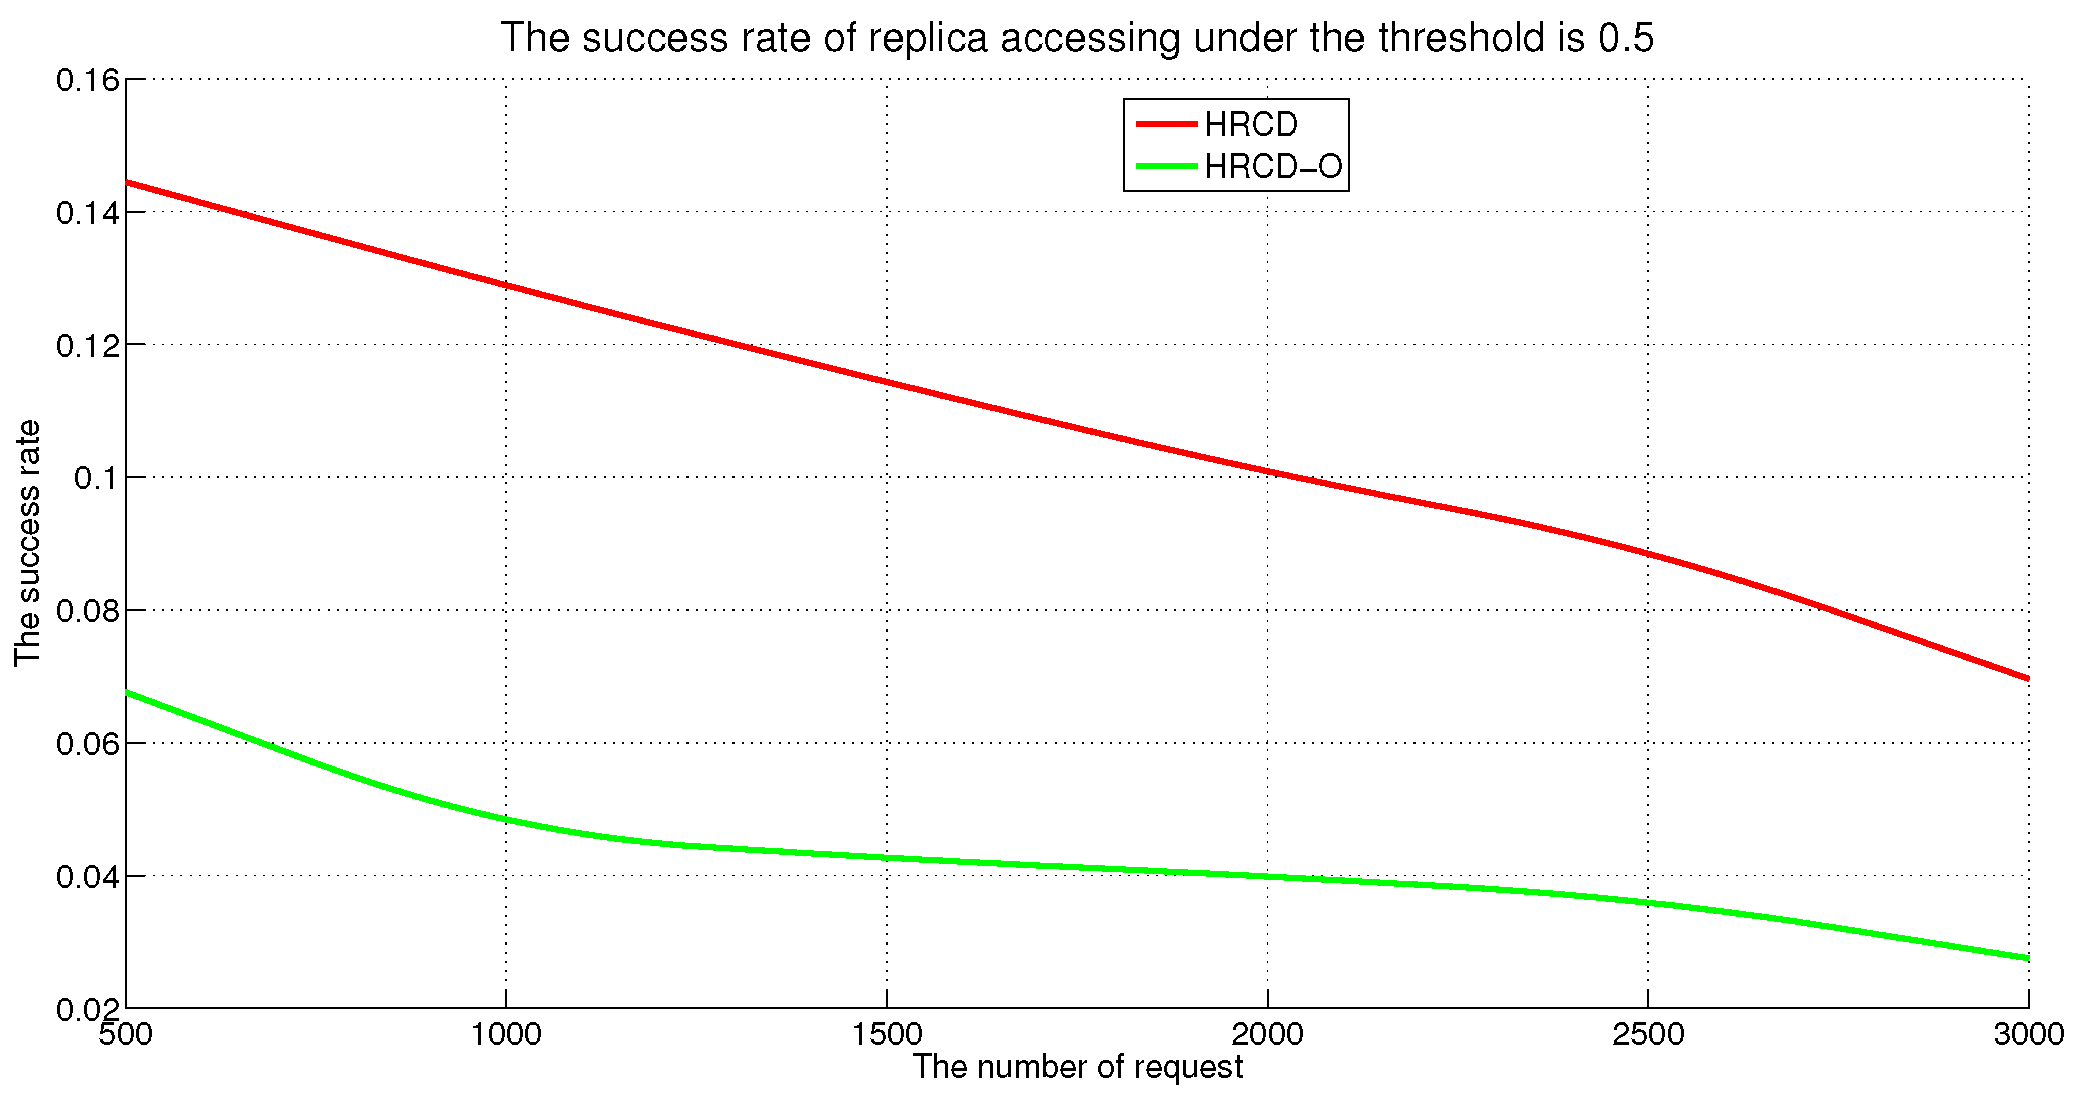
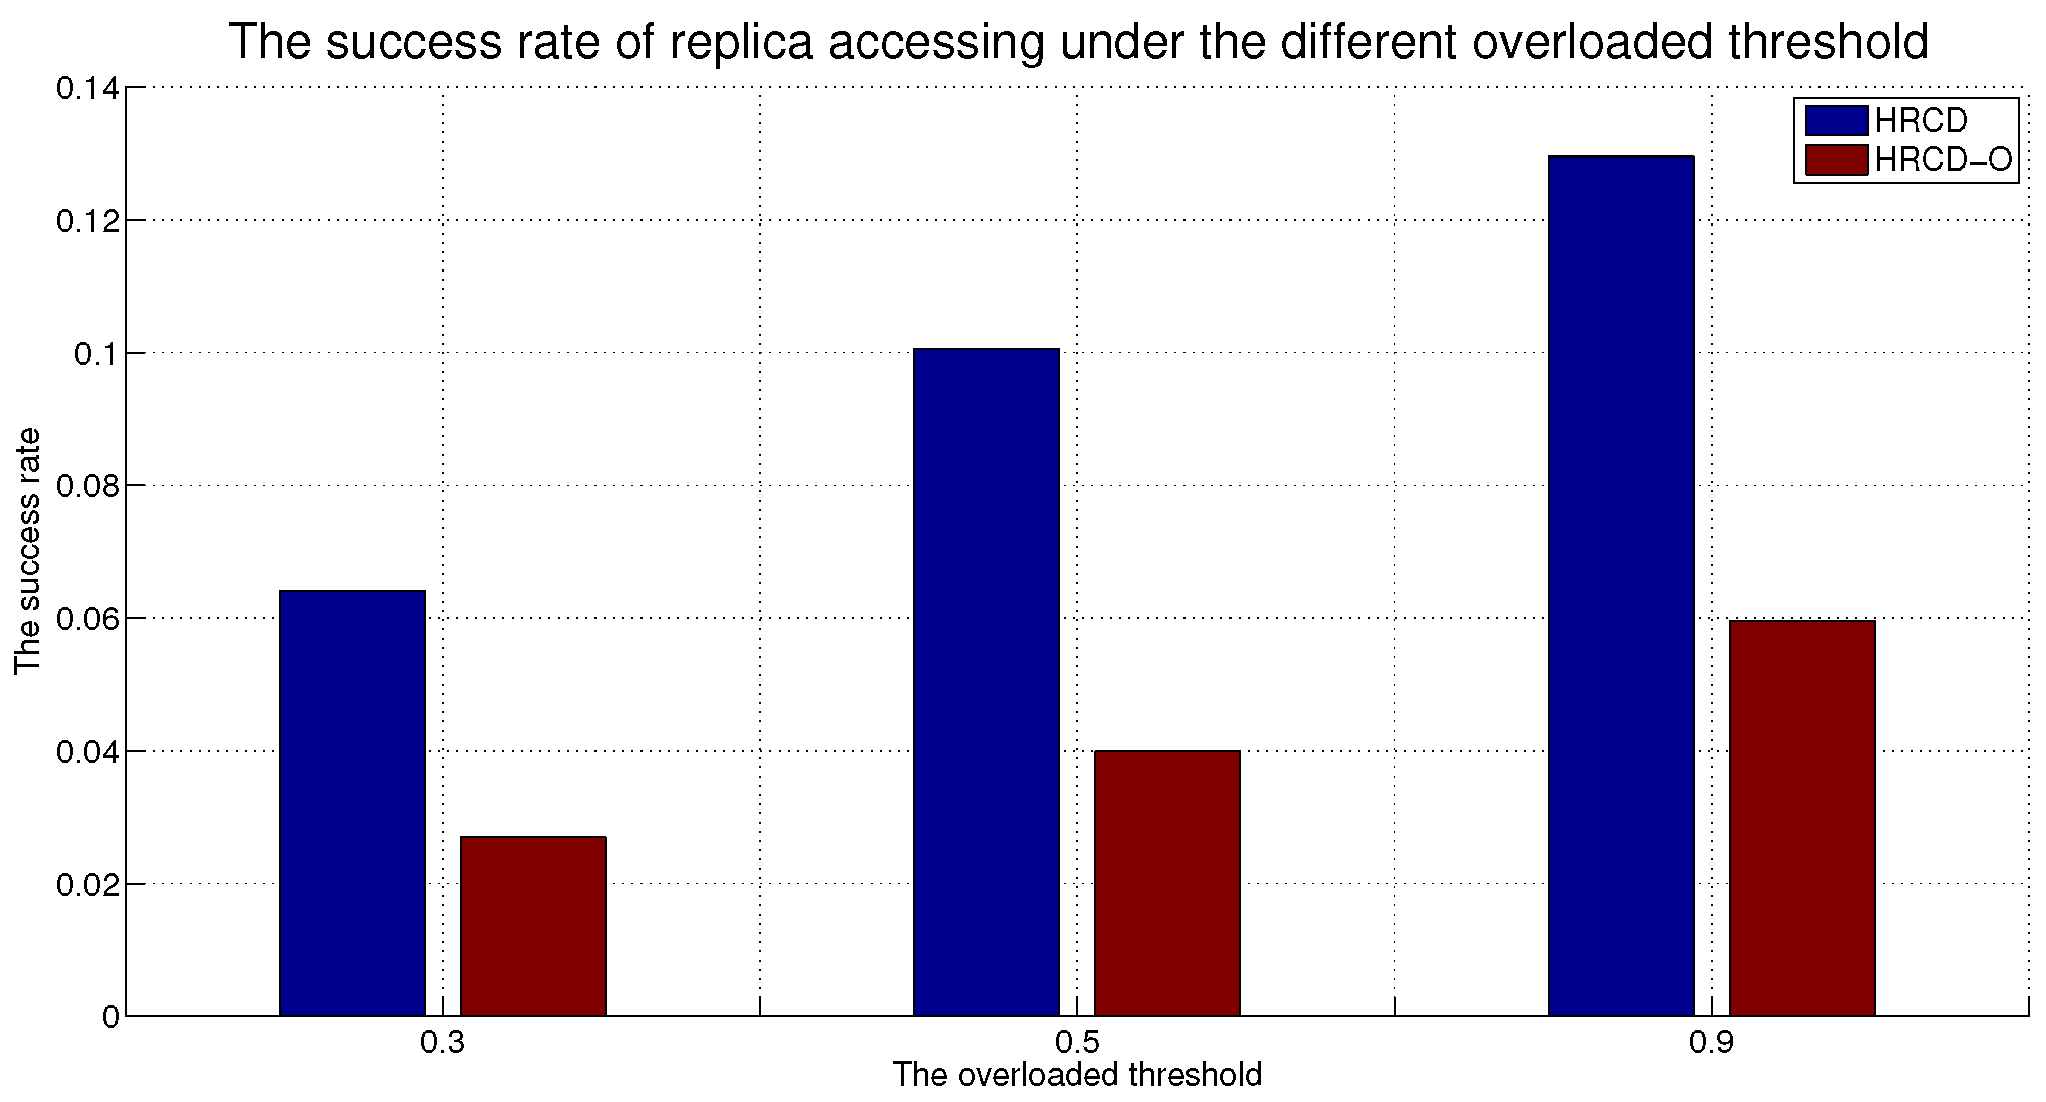
Figure 11, Figure 12 and Figure 13 show the success rates of replica access for different methods under different requests to verify that the HRCD can ensure the success rate of replica access.
From Figure 11, Figure 12 and Figure 13, it is evident that the HRCD has a higher success rate for replica requests compared to the HRCD-O, with an improvement of approximately 3%. This advantage can be attributed to the method the HRCD employs for selecting replica creation objects. Specifically, the HRCD uses a uniform distribution to select hotspot data for replication, based on the proportion of requests for each type of data. This approach ensures that not only does hotspot data have a high probability of being replicated, but also that “sub-hot” data has a chance of being selected as a replica. In contrast, the HRCD-O selects hotspot data for replication solely based on the data request situation, in a sequential order. This method does not guarantee that “sub-hot” data will be replicated, which may limit its effectiveness in handling a diverse range of data requests. Consequently, when UE within the stable set requests data, the HRCD has a higher probability of successful replica requests due to its more inclusive and balanced approach to replica selection.
From Figure 12, we can observe a trend where the success rate decreases as the number of requests grows. This is because the load on the replica nodes gradually reaches a predetermined overload threshold as the number of requests increases within a unit of time, rendering them overloaded. At this point, the replica nodes are unable to respond to further requests, resulting in a decrease in the success rate of replica requests. Furthermore, Figure 13 reveals a strong correlation between the success rate and the overload threshold. Specifically, as the overload threshold increases, the success rate also rises. Recalling the definition of the success rate, which solely considers replicas on UE, it becomes clear that a higher overload threshold allows the UE to handle more requests. Consequently, the success rate increases in tandem with the overload threshold.
Moreover, the HRCD outperforms the HRCD-O even in this context, demonstrating its superiority in managing replica requests effectively.

6.3.4. The Replica Coefficient

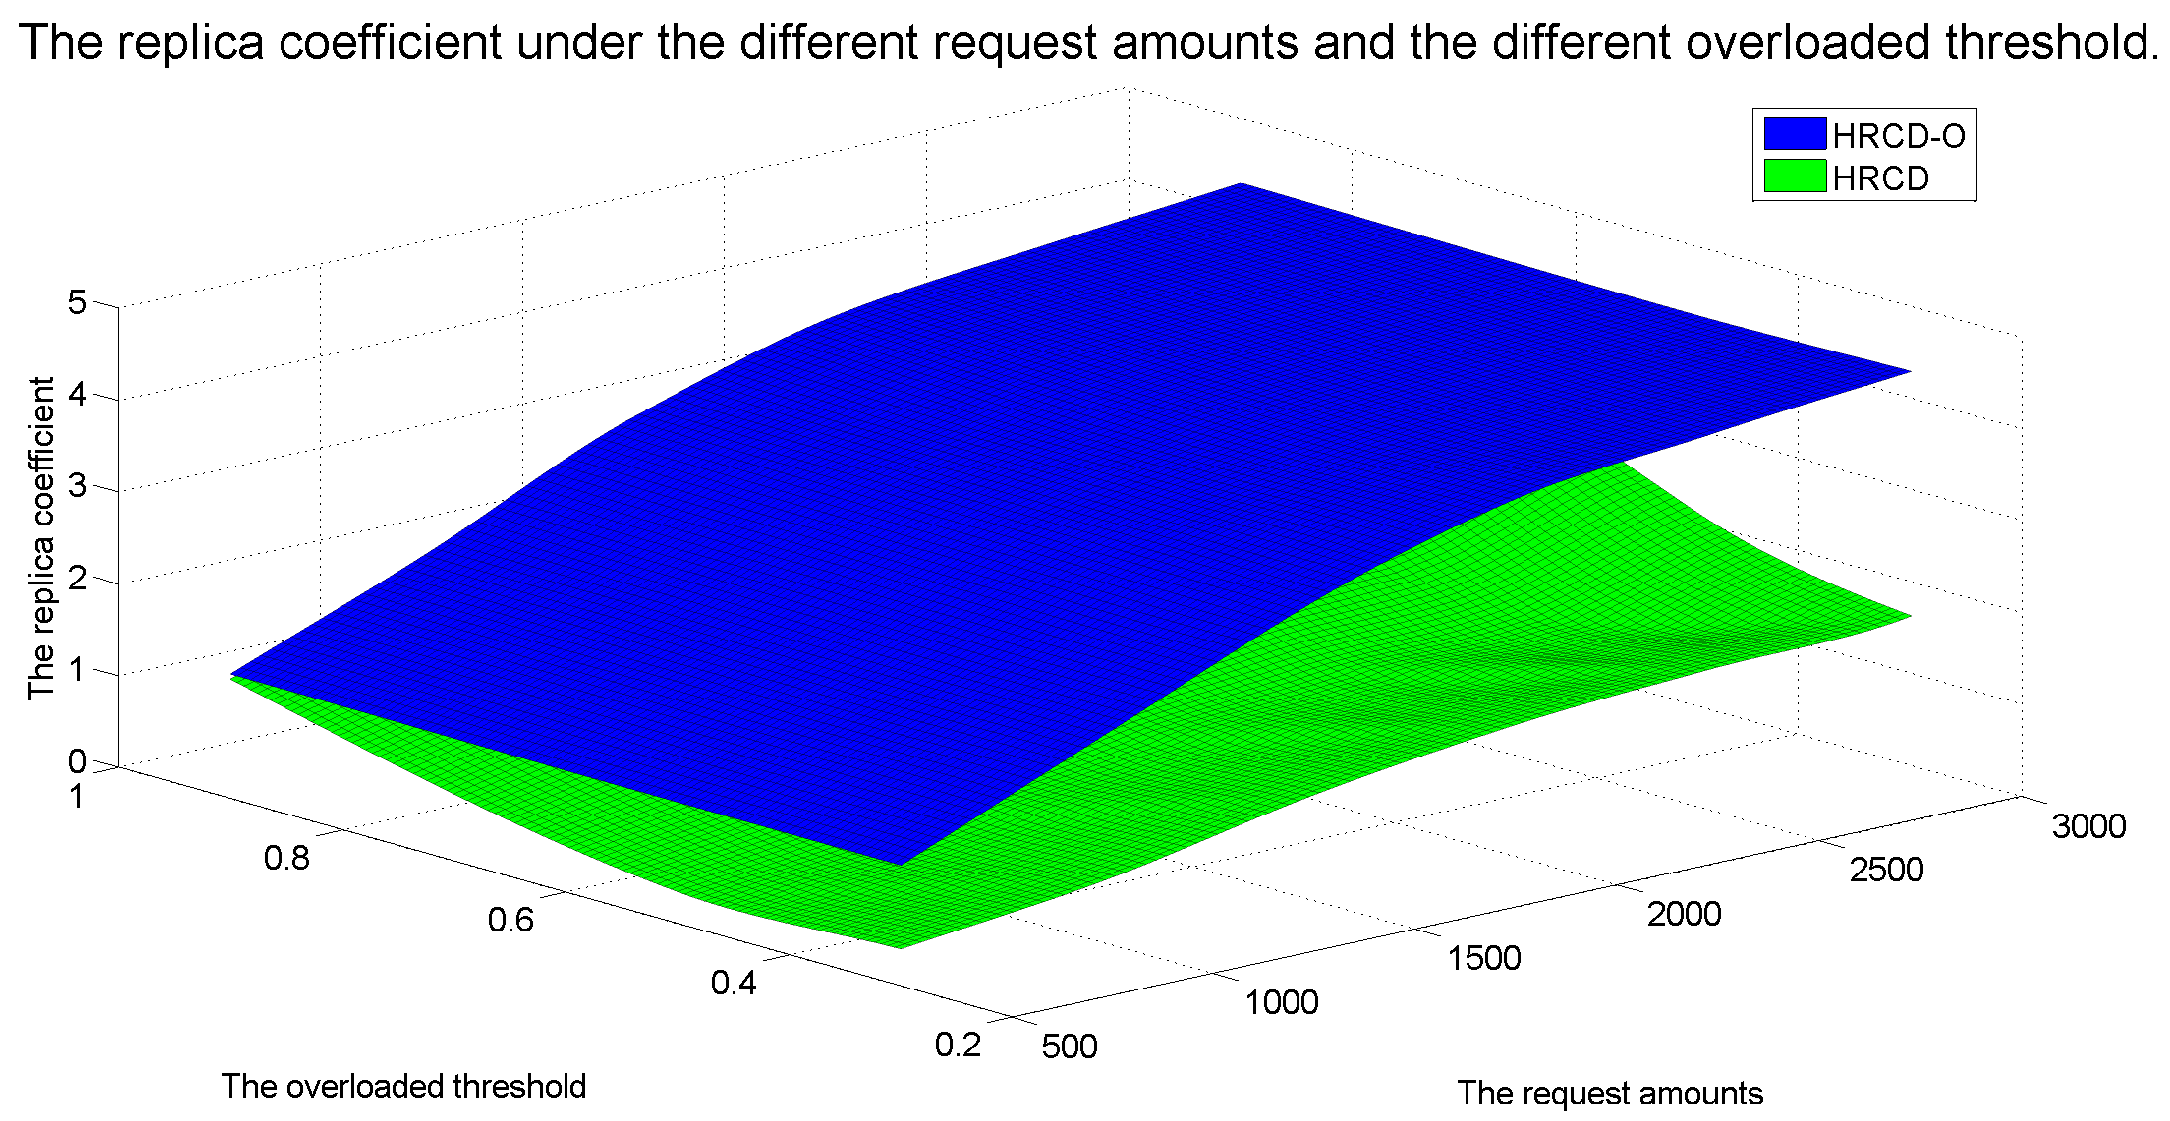
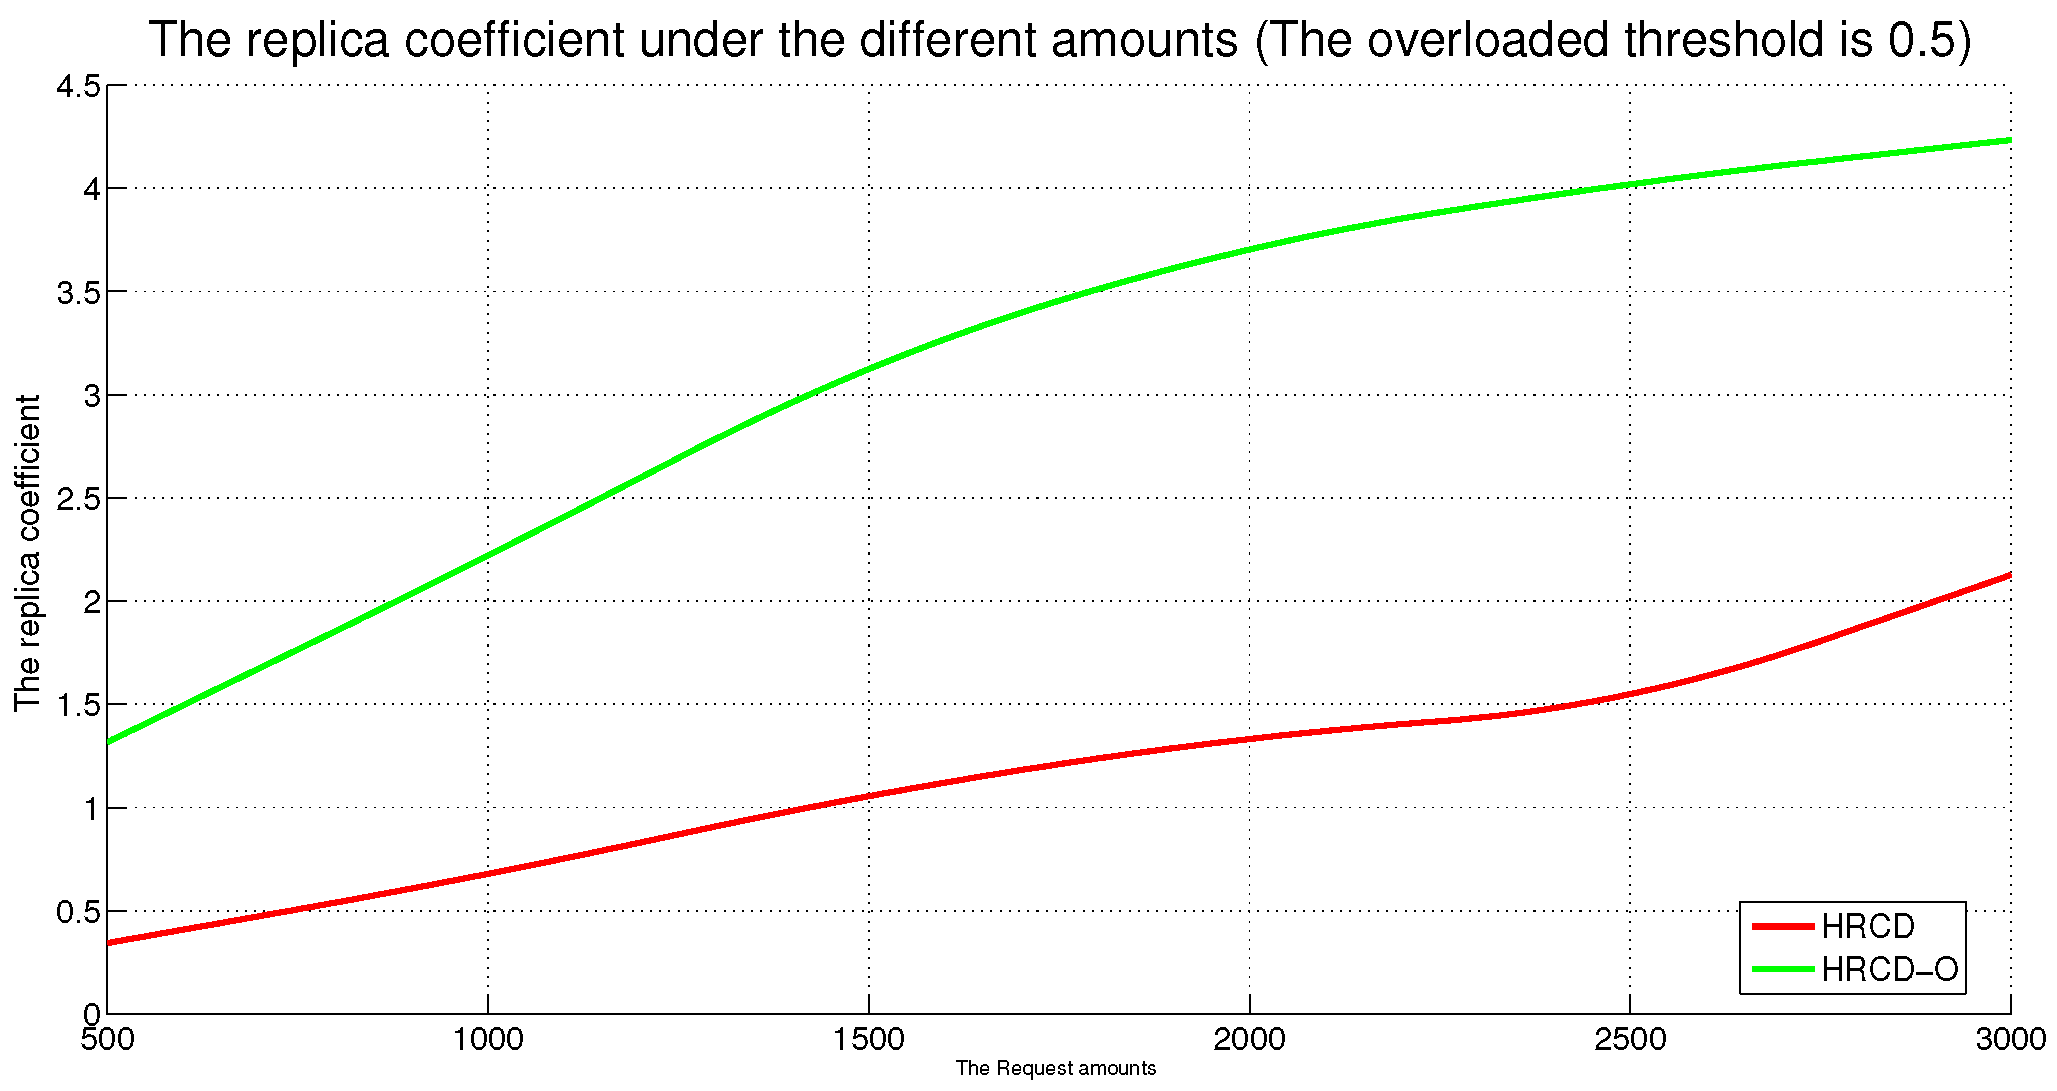
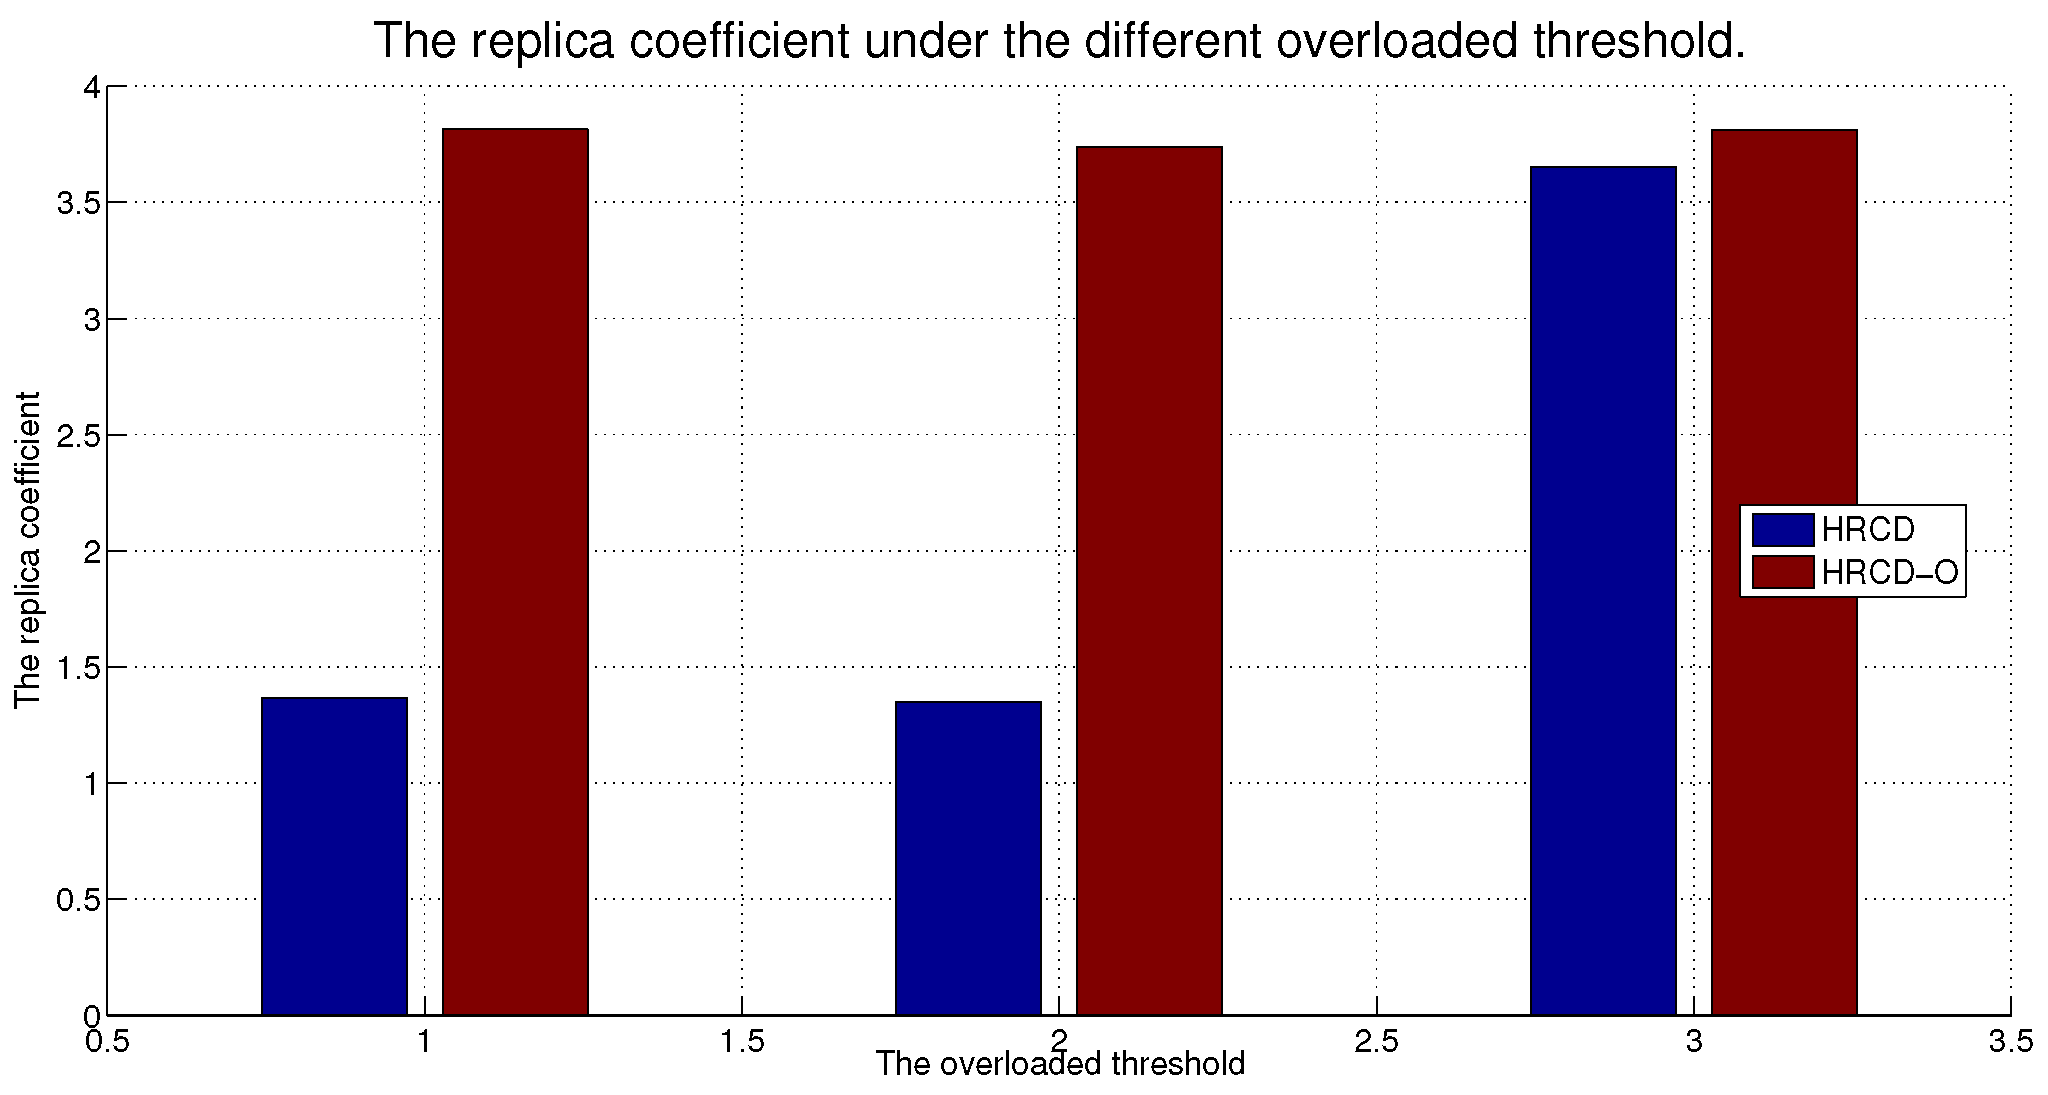
Figure 14, Figure 15 and Figure 16 show the replica coefficients of different methods to verify that the HRCD can achieve better system performance with fewer replicas.
From Figure 14, Figure 15 and Figure 16, we can know that the replica coefficients increase with the number of requests. Since the request amounts are increasing, the number of replicas required to meet UE data access is increasing too. The replica coefficient will increase as the number of requests increases, too.
Meanwhile, from Figure 14, Figure 15 and Figure 16, we can also know that the replica coefficient of the HRCD is lower than that of the HRCD-O, and the gap between the two gradually increases as the number of requests increases. Compared to the HRCD-O, the HRCD has decreased by about 0.2 coefficients on average. Review the previous content. Since the data under edge servers has geographical locality characteristics, the data category frequently accessed within the communication area of ESs tends to be certain data categories. The HRCD first obtains the type of replica creation according to the request situation when selecting data to create new replicas. That is, it prioritizes selecting data with local features as replicas according to the request. The HRCD-O did not consider the principle that edge data of a given ES has geographic locality features but only selected data to create a replica according to the heat of the data, resulting in the selection of replica creation objects that may not match the geographical locality characteristics of the given ES. To meet the requirement of the data requested within the stable set, the HRCD-O needs to create more replicas. Therefore, compared to the HRCD, the HRCD-O has a higher replica coefficient.

6.3.5. Experimental Summary

Summarized in Table 1 (Section 2), existing replica placement methods primarily focus on edge servers (ESs) or end-devices (UE) separately. Compared to ES-based methods [12,14,23], the HRCD reduces average access latency by 2∼5% (Figure 2 and Figure 5) by leveraging hybrid placement. Unlike UE-based methods [19,20] that rely on predictive caching, the HRCD achieves 3% higher replica hit rates (Figure 11) through community-driven stable sets. Furthermore, the HRCD’s fuzzy clustering approach balances node load more effectively than hybrid methods [27,28], as shown in Figure 5. Meanwhile, compared to ES-based methods, the HRCD can achieve better system performance with fewer replicas too.

7. Conclusions

In large-scale 6G edge computing communities, placing replicas on ESs can significantly reduce data access latency for UE. However, the rapid growth in the amount of UE and ES communications has led to a progressive increase in the service pressure on ES, adversely impacting their service performance. To mitigate this issue, this article proposes placing replicas on UE to alleviate the service pressure on ESs. However, the time-varying nature of UE under Edge presents challenges in replica placement. To address this problem, this paper draws inspiration from community discovery algorithms and introduces a hybrid replica placement method called the HRCD. The HRCD aims to place replicas on both UE and ESs to balance system load and minimize data access latency. It begins by defining labels for UE and ESs based on data access patterns. UE records the labels of ESs they encounter during their movement in a distributed and adaptive manner. Using membership functions, the HRCD divides UE within the ES service area into multiple stable service sets based on the recorded labels and inherent attributes of the UE. Next, the HRCD employs fuzzy clustering analysis to select “excellent” node candidate sets as replica placement nodes within these stable sets. When choosing the replica creation object, the HRCD prioritizes hotspot data with geographic locality characteristics based on data access patterns. the HRCD also creates an appropriate number of replicas according to the load of ESs and UE, and selects replica placement nodes from the candidate set in the order determined by fuzzy clustering. Additionally, it places hotspot data within the ES service area directly on ESs to further reduce data access latency. Compared to ES/UE-based methods in Table 1, the HRCD uniquely integrates community division and fuzzy clustering to achieve load balancing (Section 6.3.1) and low latency (Section 6.3.2) in dynamic 6G edge environments.
Although the HRCD has demonstrated relatively superior performance compared to other similar methods under 6G Edge for large-scale community, it has a notable limitation: it not only places replicas on the UE but also redundantly on the ES. This approach has a high tendency to repeatedly deploy the same replicas, leading to a significant number of redundant replicas and a considerable waste of ES storage space. Additionally, the HRCD operates as a replica placement algorithm that requires nodes to engage in label exchange, replica management, and algorithm execution during their mobility. Meanwhile, the reliability of D2D communication (such as terminal disconnections, edge node failures, or unreliable communication links) also impacts the the HRCD replication strategy. These operations consume node resources, resulting in a decrease in service capacity. Therefore, in the future, we plan to conduct in-depth research on determining which replicas should be placed on ESs, as well as examining the energy consumption of nodes, to achieve a balanced optimization between storage utilization and system performance, and we also plan to conduct an in-depth study on the impact of D2D communication reliability on replica placement to better align with the needs of real-world scenarios.
Supplementary Materials

The following supporting information can be downloaded at: https://www.mdpi.com/article/10.3390/computers14110454/s1: Simulation code, initial data, and generated data. File S1: [evaluation.zip] (Description: Contains the complete simulation code and a README file with instructions for replication); File S2: [data.zip] (Description: The initial data used as input for the simulations).

Author Contributions

S.S., as the corresponding author, completed the main writing and organization of the paper. Y.D. was responsible for the argumentation of the proposed viewpoints and experimental work. D.W. undertook the experimental method design, experimental data collection and arrangement. J.Z. as the corresponding author too, argued the rationality and advancement of the proposed method, roughly set the organization of the paper, and provided the necessary experimental scenarios. S.L. conducted experimental data collection and organization work. All authors have read and agreed to the published version of the manuscript.

Funding

This work was partly supported by the Henan Province Science and Technology Research Projects (NO:232102210139).

Data Availability Statement

The simulation code and data supporting the findings of this study are available as Supplementary Material alongside the published article.

Conflicts of Interest

The funders had no role in the design of the study; in the collection, analyses, or interpretation of data; in the writing of the manuscript; or in the decision to publish the results.

References

  1. Huang, S.; Wang, B.; Li, X.; Zheng, P.; Mourtzis, D.; Wang, L. Industry 5.0 and Society 5.0-Comparison, complementation and co-evolution. J. Manuf. Syst. 2022, 64, 424–428. [Google Scholar] [CrossRef]
  2. Kong, L.; Tan, J.; Huang, J.; Chen, G.; Wang, S.; Jin, X.; Zeng, P.; Khan, M.; Das, S.K. Edge-computing-driven Internet of Things: A Survey. Acm Comput. Surv. 2023, 55, 174. [Google Scholar] [CrossRef]
  3. Kim, N.; Kim, G.; Shim, S.; Jang, S.; Song, J.; Lee, B. Key Technologies for 6G-Enabled Smart Sustainable City. Electronics 2024, 13, 268. [Google Scholar] [CrossRef]
  4. Saad, W.; Bennis, M.; Chen, M. A vision of 6G wireless systems: Applications, trends, technologies, and open research problems. IEEE Netw. 2019, 34, 134–142. [Google Scholar] [CrossRef]
  5. Saeedi Taleghani, E.; Maldonado Valencia, R.I.; Sandoval Orozco, A.L.; García Villalba, L.J. Trust Evaluation Techniques for 6G Networks: A Comprehensive Survey with Fuzzy Algorithm Approach. Electronics 2024, 13, 3013. [Google Scholar] [CrossRef]
  6. Nguyen, D.C.; Ding, M.; Pathirana, P.N.; Seneviratne, A.; Li, J.; Niyato, D.; Dobre, O.; Poor, H.V. 6G Internet of Things: A comprehensive survey. IEEE Internet Things J. 2021, 9, 359–383. [Google Scholar] [CrossRef]
  7. Shome, D.; Waqar, O.; Khan, W.U. Federated learning and next generation wireless communications: A survey on bidirectional relationship. Trans. Emerg. Telecommun. Technol. 2022, 33, e4458. [Google Scholar] [CrossRef]
  8. Han, C.; Kim, G.J.; Alfarraj, O.; Tolba, A.; Ren, Y. Zt-bds: A secure blockchain-based zero-trust data storage scheme in 6g edge iot. J. Internet Technol. 2022, 23, 289–295. [Google Scholar]
  9. Qi, W.; Cunqun, F. An aggregated edge computing resource management method for space-air-ground integrated information networks. Chin. J. Comput. 2023, 46, 690–710. [Google Scholar]
  10. Wang, W.; Tornatore, M.; Zhao, Y.; Chen, H.; Li, Y.; Gupta, A.; Zhang, J.; Mukherjee, B. Infrastructure-efficient virtual-machine placement and workload assignment in cooperative edge-cloud computing over backhaul networks. IEEE Trans. Cloud Comput. 2022, 11, 653–665. [Google Scholar] [CrossRef]
  11. Li, B.; He, Q.; Cui, G.; Xia, X.; Chen, F.; Jin, H.; Yang, Y. READ: Robustness-oriented edge application deployment in edge computing environment. IEEE Trans. Serv. Comput. 2020, 15, 1746–1759. [Google Scholar] [CrossRef]
  12. Xia, X.; Chen, F.; He, Q.; Grundy, J.; Abdelrazek, M.; Jin, H. Online collaborative data caching in edge computing. IEEE Trans. Parallel Distrib. Syst. 2020, 32, 281–294. [Google Scholar] [CrossRef]
  13. Xia, X.; Chen, F.; He, Q.; Grundy, J.C.; Abdelrazek, M.; Jin, H. Cost-effective app data distribution in edge computing. IEEE Trans. Parallel Distrib. Syst. 2020, 32, 31–44. [Google Scholar] [CrossRef]
  14. Xia, X.; Chen, F.; He, Q.; Cui, G.; Lai, P.; Abdelrazek, M.; Grundy, J.; Jin, H. Graph-based data caching optimization for edge computing. Future Gener. Comput. Syst. 2020, 113, 228–239. [Google Scholar] [CrossRef]
  15. Liu, Y.; He, Q.; Zheng, D.; Xia, X.; Chen, F.; Zhang, B. Data Caching Optimization in the Edge Computing Environment. IEEE Trans. Serv. Comput. 2020, 15, 2074–2085. [Google Scholar] [CrossRef]
  16. Kumar, D.; Baranwal, G.; Shankar, Y.; Vidyarthi, D.P. A survey on nature-inspired techniques for computation offloading and service placement in emerging edge technologies. World Wide Web 2022, 25, 2049–2107. [Google Scholar] [CrossRef]
  17. Yan, L.; Wei, Q.; Hongke, Z. Standardization of 6G Key Technologies: Thoughts and Suggestions. Strateg. Study CAE 2023, 25, 18–26. [Google Scholar]
  18. Xu, X.; Wang, Q.; Fan, C.; Liang, Z.; Xue, Y.; Wang, S. Edge computing resource fusion management method for space space integrated information network. Chin. J. Comput. 2023, 46, 690–710. [Google Scholar] [CrossRef]
  19. Xia, Q.F.; Jiao, Z.W.; Xu, Z.C. Online Learning Algorithms for Context-Aware Video Caching in D2D Edge Networks. IEEE Trans. Parallel Distrib. Syst. 2024, 35, 1–19. [Google Scholar] [CrossRef]
  20. Maher, S.M.; Ebrahim, G.A.; Hosny, S.; Salah, M.M. A Cache-Enabled Device-to-Device Approach Based on Deep Learning. IEEE Access 2023, 11, 76953–76963. [Google Scholar] [CrossRef]
  21. Fantacci, R.; Picano, B. A Matching Game with Discard Policy for Virtual Machines Placement in Hybrid Cloud-Edge Architecture for Industrial IoT Systems. IEEE Trans. Ind. Inform. 2020, 16, 7046–7055. [Google Scholar] [CrossRef]
  22. Du, L.; Huo, R.; Sun, C.; Wang, S.; Huang, T. Adaptive joint placement of edge intelligence services in mobile edge computing. Wirel. Netw. 2024, 30, 10220038. [Google Scholar] [CrossRef]
  23. Aral, A.; Ovatman, T. A Decentralized Replica Placement Algorithm for Edge Computing. IEEE Trans. Netw. Serv. Manag. 2018, 15, 516–529. [Google Scholar] [CrossRef]
  24. Li, C.; Pan, H.; Qian, H.; Li, Y.; Si, X.; Li, K.; Zhang, B. Hierarchical sharding blockchain storage solution for edge computing. Future Gener. Comput. Syst. 2024, 161, 162–173. [Google Scholar] [CrossRef]
  25. Yuan, L.; He, Q.; Tan, S.; Li, B.; Yu, J.; Chen, F.; Yang, Y. CoopEdge+: Enabling decentralized, secure and cooperative multi-access edge computing based on blockchain. IEEE Trans. Parallel Distrib. Syst. 2022, 34, 894–908. [Google Scholar] [CrossRef]
  26. Li, C.; Wang, Y.; Tang, H.; Zhang, Y.; Xin, Y.; Luo, Y. Flexible replica placement for enhancing the availability in edge computing environment. Comput. Commun. 2019, 146, 1–14. [Google Scholar] [CrossRef]
  27. Liu, Z.; Zhang, J.; Gu, Z. Network and computing-aware edge datacenter placement and content placement in edge compute first networking. In Proceedings of the 2022 Asia Communications and Photonics Conference (ACP), Shenzhen, China, 5–8 November 2022. [Google Scholar]
  28. Liu, Y.; Huang, W.; Han, L.; Wang, L. A cache placement algorithm based on comprehensive utility in big data multi-access edge computing. Ksii Trans. Internet Inf. Syst. 2021, 15, 3892–3912. [Google Scholar] [CrossRef]
  29. Moradan, A.; Draganov, A.; Mottin, D.; Assent, I. UCoDe: Unified Community Detection with Graph Convolutional Networks. Mach. Learn. 2021, 112, 5057–5080. [Google Scholar] [CrossRef]
  30. Palla, G.; Derényi, I.; Farkas, I.; Vicsek, T. Uncovering the overlapping community structure of complex networks in nature and society. Nature 2005, 435, 814–818. [Google Scholar] [CrossRef] [PubMed]
  31. Xu, X.; Zheng, X. An Overlapping Community Discovery Algorithm Based on Label Propagation Constructing a K-Clique Network. In Proceedings of the 2022 IEEE 5th International Conference on Big Data and Artificial Intelligence (BDAI), Fuzhou, China, 8–10 July 2022; pp. 232–236. [Google Scholar]
  32. Wei, X.; Wang, J.; Zhang, S.; Zhang, D.; Zhang, J.; Wei, X. ReLSL: Reliable Label Selection and Learning Based Algorithm for Semi-Supervised Learning. Chin. J. Comput. 2022, 45, 1147–1160. [Google Scholar]
  33. Raghavan, U.N.; Albert, R.; Kumara, S. Near Linear Time Algorithm to Detect Community Structures in Large-Scale Networks. Phys. Rev. E 2007, 76 Pt 2, 036106. [Google Scholar] [CrossRef] [PubMed]
  34. O’Neil, E.J.; O’Neil, P.E.; Weikum, G. The LRU-K page replacement algorithm for database disk buffering. ACM Sigmod Rec. 1993, 22, 297–306. [Google Scholar] [CrossRef]
  35. Dunn, J.C. A Fuzzy Relative of the ISODATA Process and Its Use in Detecting Compact Well-Separated Clusters. J. Cybern. 1973, 3, 32–57. [Google Scholar] [CrossRef]
  36. Bezdek, J.C. Pattern Recognition with Fuzzy Objective Function Algorithms; Plenum Press: New York, NY, USA, 1981. [Google Scholar]
  37. Ali, M.M.; Nadarajah, S. A truncated Pareto distribution. Comput. Commun. 2006, 30, 1–4. [Google Scholar] [CrossRef]
  38. Contour Detection and Image Segmentation Resources. Available online: https://www2.eecs.berkeley.edu/Research/Projects/CS/vision/grouping/resources.html (accessed on 1 September 2025).
Figure 1. Application scenarios of the HRCD.
Computers 14 00454 g001
Figure 2. The average load under the different request amounts and different overloaded thresholds.
Computers 14 00454 g002
Figure 3. The average load under the different request.
Computers 14 00454 g003
Figure 4. The average load under the different overloaded thresholds.
Computers 14 00454 g004
Figure 5. The average load of ESs under the different request amounts and different overloaded threshold.
Computers 14 00454 g005
Figure 6. The average load of ES under the different request numbers.
Computers 14 00454 g006
Figure 7. The average load of ES under the different overloaded threshold.
Computers 14 00454 g007
Figure 8. The average access delay under different request amounts and different overloaded thresholds.
Computers 14 00454 g008
Figure 9. The average access delay under different number of requests.
Computers 14 00454 g009
Figure 10. The average access delay under different overloaded thresholds.
Computers 14 00454 g010
Figure 11. The success rate of replica accessing under different request numbers and different overloaded thresholds.
Computers 14 00454 g011
Figure 12. The success rate of replica accessing under different request numbers.
Computers 14 00454 g012
Figure 13. The success rate of replica accessing under different overloaded thresholds.
Computers 14 00454 g013
Figure 14. The replica coefficient under different request numbers and different overloaded thresholds.
Computers 14 00454 g014
Figure 15. The replica coefficient under different request numbers.
Computers 14 00454 g015
Figure 16. The replica coefficient under different overloaded thresholds.
Computers 14 00454 g016
Table 1. Comparison of existing papers addressing replica placement problems.
PaperLocation of ReplicasTargetMethod Adopted
 [10]Edge, cloudReducing service latency for end usersMixed integer linear programming
 [12]EdgeMinimizing system costsConstrained optimization
 [14]EdgeMinimizing data caching costsInteger linear programming
 [15]EdgeMaximizing Service Provider RevenueInteger linear programming
 [23]EdgeRelieving cloud server loadContinuously monitor data requests from edge nodes. The principle of geographic locality of data
 [24]EdgeMitigating the integration challenges of edge computing and blockchainUsing community discovery algorithm to cluster edge devices with similar performance and geographical location into the same set
 [25]EdgeRelieving the collaborative computing problem of edge nodes in untrusted environmentsAdopting an election mechanism to select nodes and using blockchain to alleviate node trust issues
 [26]EdgeImproving system performance with fewer replicasDynamically adjust replicas based on the relationship between data access frequency and number of replicas
 [27]Edge, cloudMinimizing latency and bandwidth consumptionUser behavior preferences
 [28]Edge, endOptimizing cache performanceCombination optimization, search algorithm
 [20]EndImproving cache hit rateUsing deep learning to predict content popularity and dynamically adjust cache
Table 2. Key notations.
NotationsMeanings
U E i The i-th UE.
E s i The i-th ES, assuming there are M ESs under 6G Edge, denoted as { E s 1 , E s 2 , E s M }
S d r i The E s i service area, assuming there are N pieces of UE under E s i , denoted as S d r i = { U E 1 , U E 2 , , U E N }
f i The requesting data, assuming there are L different file under 6G Edge, denoted as { f 1 , f 2 , , f L }
K i Data category, assuming there are k different category under 6G Edge, denoted as { K 1 , K 2 , , K k }
Given data f i , it belongs to K i , f i K i
mConstant, U E i can record the number of labels.
C r i The number of new label been recorded.
d i , j The backhaul distance between U E i and E s i .
q i The load of U E i .
R s i U E i ’s remaining storage space for replicas.
R w i The remaining bandwidth of U E i .
Table 3. The initial matrix.
Cps all The Evaluation Indicators
Cr j d i , j q j Rs j Rw j
U E 1 C r 1 d i , 1 q 1 R s 1 R w 1
U E 2 C r 2 d i , 2 q 2 R s 2 R w 2
U E k 3 C r k 3 d i , k 3 q k 3 R s k 3 R w k 3
U E v r C r v r d i , v r q v r R s v r R w v r
Table 4. The parameter list.
ParameterValue
β 2
γ 1 0.5
γ 2 0.5
γ 2
θ 2
The overloaded threshold q i 0.3 ∼ 0.9
Disclaimer/Publisher’s Note: The statements, opinions and data contained in all publications are solely those of the individual author(s) and contributor(s) and not of MDPI and/or the editor(s). MDPI and/or the editor(s) disclaim responsibility for any injury to people or property resulting from any ideas, methods, instructions or products referred to in the content.