Abstract
This study focused on the impact of Netflix’s interactive entertainment on Filipino consumers, seamlessly combining vantage points from consumer behavior and employing data analytics. This underlines the revolutionary aspect of interactive entertainment in the quickly expanding digital media ecosystem, particularly as Netflix pioneers fresh content distribution techniques. The main objective of this study was to find the factors impacting the real usage of Netflix’s interactive entertainment among Filipino viewers, filling a critical gap in the existing literature. The major goal of using advanced data analytics techniques in this study was to understand the subtle dynamics affecting customer behavior in this setting. Specifically, the random forest classifier with hard and soft classifiers was assessed. The random forest compared to LightGBM was also employed, alongside the different algorithms of the artificial neural network. Purposive sampling was used to obtain responses from 258 people who had experienced Netflix’s interactive entertainment, resulting in a comprehensive dataset. The findings emphasized the importance of hedonic motivation, underlining the requirement for highly engaging and rewarding interactive material. Customer service and device compatibility, for example, have a significant impact on user uptake. Furthermore, behavioral intention and habit emerged as key drivers, revealing interactive entertainment’s long-term influence on user engagement. Practically, the research recommends strategic platform suggestions that emphasize continuous innovation, user-friendly interfaces, and user-centric methods. This study was able to fill in the gap in the literature on interactive entertainment, which contributes to a better understanding of consumer consumption and lays the groundwork for future research in the dynamic field of digital media. Moreover, this study offers essential insights into the intricate interaction of consumer preferences, technology breakthroughs, and societal influences in the ever-expanding environment of digital entertainment. Lastly, the comparative approach to the use of machine learning algorithms provides insights for future works to adopt and employ among human factors and consumer behavior-related studies.
1. Introduction
The entertainment industry is a vast and ever-changing area that encompasses a wide range of media and content creation. In detail, the phrase “entertainment industry” refers to the production of theater, film, visual art, dance, opera, music, book publishing, television, and radio [1]. Nowadays, technological improvements have played a key influence in the innovation of the entertainment industry. Consumers now have fast access to the specific material they want to consume, according to Ahuja [2], thanks to the rise of the entertainment business as well as the era of smartphones, smart televisions, and tablets. With the rapid growth of technology, several streaming services have emerged to give effective and convenient access to various movies, programs, and television series.
The Philippine entertainment landscape has undergone a remarkable transformation, driven by the global disruptions brought about by the COVID-19 pandemic. As movie theaters and live events became inaccessible due to lockdowns, Filipinos turned to in-home entertainment, reshaping their entertainment preferences in profound ways. Additionally, improved internet infrastructures in the Philippines were fueling the country’s online population growth, which was among the greatest in the Asia Pacific region. Filipino internet users also spend the most time connected to the internet, averaging over 10 h every day [3]. The Philippines’ increased reliance on streaming platforms for digital content consumption is owing to several factors, including a profound shift in entertainment preferences caused by lockdowns and the widespread unavailability of movie theaters and live events during the COVID-19 pandemic, as well as the country’s growing online population and extensive daily internet usage habits [3]. As a result, despite many users’ desires to watch material in HD or Ultra HD [4], streaming has emerged as the distinguishing feature of the “new normal”, with a considerable majority of Filipino internet users using video streaming subscription services as of April 2022 [5]. This striking change in consumer behavior underscores the growing reliance on streaming platforms for digital content consumption.
In light of the developing landscape of streaming and digital entertainment platforms, it is critical to note that the Filipino market is not immune to global trends influencing the sector. Evidently, streaming has been a popular means to watch television shows, since streaming services offer a diverse choice of genres and material [6,7]. As a result, streaming services provide content collections, allowing viewers and users to choose whatever matches their tastes. For example, Subscription Video on Demand (SVoD) services have flourished in the Philippines, as they have in other areas, with platforms such as Netflix, Amazon Prime Video, iflix, HBO Go, and Viu becoming key participants in the entertainment industry. This growth reflects the variety of alternatives accessible to Filipino viewers, providing a diverse range of programming possibilities to cater to a variety of likes and inclinations [8]. With streaming platforms, the demand for movies to be screened in cinemas is declining as more people choose the more convenient and affordable option of watching movies at home.
At the forefront of this streaming revolution in the Philippines stands Netflix. Netflix has risen from its humble origins as a DVD-by-mail business to become one of the world’s most popular video streaming services [4]. Despite facing competition, Netflix continued to dominate the market, boasting a commanding 31 percent market share as of the first quarter of 2022 [5]. This enduring appeal to Filipino audiences highlights Netflix’s ability to adapt to the evolving dynamics of the local entertainment industry, thanks to its evolving strategies and rich content offerings. It is noteworthy that while traditional cable channels still have a substantial viewership share, the allure of ad-free, content-rich streaming platforms has proven irresistible to Filipino audiences. In 2021, an estimated 6.4 million Filipinos actively used video streaming services, reinforcing the digital transformation of entertainment consumption in the country [5].
In this expanding sea of streaming options vying for viewers’ attention, Netflix has skillfully maintained its preeminent position in the Philippine market. Despite the intensifying competition, Netflix remains the streaming platform of choice for a significant portion of Filipino viewers. A global survey by Finder.com (accessed on 2 March 2024) in the first quarter of 2022 revealed that Netflix held an impressive 40 percent of subscriptions in the country [9]. This datum underscores Netflix’s resilience and adaptability, solidifying its status as the preferred streaming service for a substantial segment of the Filipino population. Netflix’s ability to retain its top position despite growing competition highlights its evolving strategies and diverse content offerings, which play a pivotal role in sustaining its leadership. According to Statista [10], the number of active Netflix streaming subscribers in the Philippines was more than 296,000 in 2020, but according to the International Telecommunication Union (ITU) World Telecommunication/Internet Day, the number of Filipinos with access to Netflix or Netflix offerings via other websites (e.g., video sharing websites that skirt or circumvent copyright laws) could be closer to 50% in 2020. According to the World Bank’s ICT Indicators Database, digitization and streaming have had a substantial influence on the Philippine entertainment industry, which includes both global and local businesses.
In the dynamic landscape of streaming services in the Philippines, Netflix has strategically harnessed the power of interactive entertainment to fortify its position as the number one choice for Filipino viewers. However, Netflix’s long-standing status as a streaming service pioneer is beginning to wane as new competitors learn its techniques. As a result, Netflix stimulated its innovation by generating interactive entertainment that no other platform could perform [11]. The chance that Netflix is leading the way in interactive entertainment is likely because the streaming service’s management sees it as both a content and a technical firm [12]. With this, the introduction of interactive elements into its content offerings has provided an immersive and participatory experience for users. Currently, Netflix’s interactive entertainment has received a lot of attention, such as Black Mirror: Bandersnatch, in which customers may pick what action the main character will do at various stages from the beginning to the end of the film. This boosted the number of subscribers to Netflix in 2018. Netflix recently published the series Kaleidoscope, which gave customers the choice of watching the episodes in whatever order they wanted. Customers noted that alternate episode sequences created distinct feelings about the overall tale—giving the entire story regardless of the sequence viewers pick. An extra 13.5 million unique viewers and 39 million hours of watching time were amassed ten days after the publication of Kaleidoscope, and all viewers obtained almost 59 million views [13]. By allowing viewers to influence the narrative’s course through their choices, Netflix has enhanced viewer engagement and satisfaction. This innovative approach represents Netflix’s commitment to meeting the evolving preferences of its Filipino audience, effectively addressing the challenges posed by a competitive streaming landscape.
Netflix’s success, which has altered how people consume entertainment material, may be attributed to its ability to adapt to changing consumer tastes. Studies conducted in other countries, such as the research papers in Brazil and Portugal [14] and the reflections on Netflix series in the Philippines and international realities [15], have also observed similar trends in the growing popularity of Netflix and other streaming platforms. These studies have highlighted the impact of streaming services on traditional media consumption patterns, including a decline in cable television viewership and a shift towards on-demand, ad-free content. According to Myers [16], customers do not feel bombarded with commercials all the time, which is one of the benefits of using streaming services. As a result, people choose Netflix since they are not interrupted by commercials when binge-watching. Furthermore, Netflix’s monthly membership pricing is reasonable, making it accessible to a wide range of users without requiring long-term commitments [17]. This, according to Annissa et al. [17], allows users to be more flexible when unsubscribing. This also encourages people to subscribe in the long term because they may see many films in a month for a cheap fee instead of spending money at movie theaters or purchasing DVDs. Aside from that, Netflix allows several users per account to share content, lowering costs and promoting the use of the streaming site. Furthermore, having Netflix on many devices allows users to access and watch Netflix whenever they want because there are numerous binge-watching alternatives. Lobato and Lotz [18] demonstrate this by stating that the notion of the second screen evolved because of the growth in mobile usage, showcasing how Netflix may be used concurrently to enhance the watching experience.
In the face of changing consumer preferences and technical breakthroughs, the expanding world of interactive entertainment on streaming platforms such as Netflix brings both possibilities and problems. One significant problem is ensuring the smooth incorporation of interactive features into the watching experience without jeopardizing narrative integrity or overloading viewers with decision paralysis [19]. While interactive storytelling has generated a lot of interest and engagement, there is a fine balance between giving viewers agency and keeping the tale coherent. Furthermore, the usefulness of interactive elements might change across demographics and cultural contexts, demanding careful consideration of user variety and preferences during the design and implementation process [20]. The technological constraints of creating and distributing interactive content provide substantial obstacles, notably in improving user interfaces, decreasing latency, and assuring interoperability across several devices and platforms [21]. In addition, issues about data privacy and user tracking may develop when collecting user interaction data for customization purposes, mandating transparent policies and strong security measures to protect user trust and privacy [22]. Addressing these multidimensional difficulties requires multidisciplinary collaboration between researchers, content makers, and technology specialists to manage the complex interplay between user experience, technical innovation, and ethical considerations in the interactive entertainment industry.
Today, Netflix is constantly updating its platform and introducing new elements, such as games and interactive entertainment, to increase user experience and engagement, which rival streaming platforms have yet to address. With the newly developed technology implanted in Netflix, it is necessary to assess the aspects influencing interactive entertainment among Netflix series and movies. This would assist the corporation in moving forward with the existing streaming platform by understanding why people would embrace the newly built interactive entertainment. With this, one theory is reported to be frequently used when assessing new technology, which is the Unified Theory of Acceptance and Use of Technology 2 (UTAUT2), which demonstrates several elements of analyzing behavioral intention, user behavior, and technological acceptance [23].
By utilizing the Unified Theory of Acceptance and Use of Technology 2 (UTAUT2), this study sought to understand the intricate dynamics that shape Filipinos’ behavioral intentions and actual usage of Netflix with their interactive entertainment. Through rigorous data analysis, the study uncovered patterns and correlations within these variables to provide a nuanced understanding of how Filipinos engage with Netflix as a streaming platform. Moreover, another goal of this research is to apply machine learning techniques to supplement and improve existing modeling approaches, resulting in a more robust and complete knowledge of the factors impacting Netflix user behavior in the Filipino environment. According to past studies [24,25], the use of machine learning algorithms can enhance and validate conclusions, since other studies have shown the limits of multivariate analyses such as Structural Equation Modeling [26]. With this, the study was able to identify patterns and connections across these characteristics through rigorous data analysis, allowing for a more sophisticated understanding of how Filipinos interact with Netflix and its interactive entertainment as a streaming platform. This dual approach seeks to demonstrate the utility and application of both theoretical frameworks, as well as their relative strengths in explaining user behavior, thus contributing to a more comprehensive understanding of Netflix uptake in the Philippines.
This research extends beyond Netflix as a single platform and serves as a valuable contribution to the broader field of consumer behavior in the context of streaming services. By shedding light on the behavioral intentions of Filipino viewers, this study can inform content creators, streaming platforms, and the entertainment industry at large about how to better cater to the needs and desires of this specific audience. Moreover, the insights gained from this research can be extrapolated to offer guidance to streaming services worldwide as they seek to optimize user experiences and content offerings. The significance of this study extends beyond the confines of a single streaming platform or geographical location, encompassing broader implications for various stakeholders. Firstly, within the Philippines, this research stands to revolutionize how entertainment is created, distributed, and consumed. By deciphering the unique preferences and behaviors of Filipino viewers, content creators and distributors can tailor their offerings more effectively, ultimately enhancing viewer satisfaction and engagement. This not only reinvigorates the local entertainment industry but also sets a precedent for a more data-driven approach to content creation and distribution.
Furthermore, in an era where digital entertainment continues to transform the way individuals consume media, understanding how interactive entertainment influences customer behavior is invaluable not only for Netflix but for all individuals invested in the future of entertainment consumption. This study addresses a pressing gap in the literature surrounding interactive entertainment and sets the stage for a more immersive, engaging, and data-informed entertainment landscape, benefiting both industry players and audiences alike. It promotes a paradigm shift towards data-driven decision making, ensuring that the evolving needs and preferences of viewers are met in an increasingly competitive digital entertainment ecosystem.
This study was able to contribute to the limited research on the technological development within the entertainment industry. Being a benchmark to analyze factors affecting consumer behavior, human factors, and acceptance of the emerging market of interactive entertainment, implications about how to effectively promote and develop the system were elaborated. In addition, the evaluation of this type of technology has yet to be established among consumers. Therefore, one of the main contributions of this study was assessing the acceptance of user behavior within the main markets of interactive entertainment. With the deployment and applicability of virtual and augmented reality in the current generation, this study could be considered and extended to evaluate even its acceptance, usage behavior among consumers, and implications for further development using the findings and output. Lastly, the trend in machine learning and utility as an advanced analytical tool for assessing nonlinear relationships and large models was deemed to be applicable. With a higher comparable accuracy rate, the tool utilized in this study could be employed and considered for future research.
2. Conceptual Framework
This study considered the UTAUT2 model, developed by Venkatesh et al. [23], an extension of the original UTAUT by Venkatesh [23,27]. It was stated that the original model, UTAUT, covered aspects such as performance and effort expectancy, social influence, and facilitating conditions. The explanation of Venkatesh et al. [27] portrayed several limitations, such as its utility only on established models [28], as well as only being focused on the technology without external factors. This, in turn, was modified to create the UTAUT2, to which it reflects additional constructs such as habit, hedonic motivation, and price value. As explained by Yuduang et al. [29], the use of the UTAUT2 is essential for benchmarking, as the UTAUT is somewhat like the Technology Acceptance Model. It was expressed that this is only applicable when users have established the utility of the technology, and external variables do not really reflect the behavioral intention or actual use of the technology. As the evaluation of Netflix’s interactive entertainment has yet to be explored, a benchmark on technology use assessment was performed using the UTAUT2.
This study sought to understand the factors influencing actual usage of Netflix’s interactive entertainment among Filipinos. Figure 1 illustrates the theoretical framework employed, which encompasses crucial variables that help elucidate this phenomenon. This conceptual framework facilitates a comprehensive comprehension of the forces driving consumer behavior by examining aspects such as the influence of societal norms, perceived value of Netflix, the pleasure derived from its use, external factors affecting usage, habitual behavior, ease of use, perceived utility, stated willingness to use, and actual utilization.
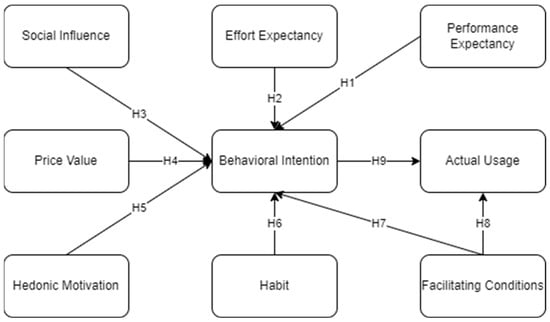
Figure 1.
Conceptual framework.
Interactive entertainment on Netflix is a relatively new form of entertainment that has yet to be extensively studied in academic literature. This type of entertainment integrates technology into the viewing experience, allowing users to interact with the content as they navigate through it. Understanding the impact of interactive entertainment on consumer behavior and the acceptance of this technology is crucial in today’s digital entertainment landscape. In particular, consumer behavior is significantly influenced by the availability and accessibility of interactive entertainment on platforms like Netflix. As users engage with this innovative form of content, their preferences and viewing habits evolve. To comprehend these changes in behavior and preferences, it becomes essential to study how users perceive and accept interactive entertainment technology.
The UTAUT2 is a framework that considers the fundamental latent factors for technology evaluation resulting from the improvement of the UTAUT [23]. With this, the utilization of the Unified Theory of Acceptance and Use of Technology 2 (UTAUT2) is the most suitable model for assessing the acceptance and usage of interactive entertainment on Netflix. The framework considers various factors influencing technology adoption, including performance expectancy, effort expectancy, social influence, price value, hedonic motivation, facilitating conditions, and habit. These factors align with the unique aspects of interactive entertainment and user behavior on Netflix. Moreover, performance expectancy and effort expectancy within the UTAUT2 model can help us understand how users perceive the benefits and ease of using interactive entertainment features on Netflix. Social influence is crucial in gauging the impact of recommendations and social media on users’ intentions to use this technology. Price value relates to how users perceive the cost-benefit ratio of interactive entertainment, while hedonic motivation explores the pleasure and enjoyment users derive from it. Facilitating conditions account for external factors like device accessibility and internet connectivity, which influence usage behavior. Finally, habit reflects users’ recurring behaviors related to interactive content consumption.
Performance expectancy (PE) gauges the extent to which a consumer foresees that the entertainment platform will enhance their ability to carry out their tasks [27]. As indicated by Venkatesh et al. [27], performance expectancy consistently emerges as the most influential predictor of user behavioral intentions across various models. In the context of Netflix, it pertains to the degree to which consumers believe that engaging with interactive entertainment will enrich their overall movie-watching experience. On the other hand, effort expectancy (EE) is defined as the level of simplicity an individual associates with the use of a particular technology [30]. Given users’ preference for technology that is user-friendly and straightforward, it is anticipated that utilization will increase as complexity diminishes [31]. This assertion is particularly relevant to Netflix, a widely embraced platform, and is closely linked to consumers’ expectations regarding the ease of interacting with interactive entertainment. For instance, in the case of Bandersnatch, a piece of popular interactive entertainment that Netflix provided first during the last month of 2018, Netflix expected users to effortlessly navigate and employ the system to make decisions that dictate the main character’s next actions. In this context, both PE and EE may and are likely to play pivotal roles in the acceptance and adoption of this technology [27]. As a result, the following hypotheses were proposed:
H1.
Performance expectancy significantly influences the behavioral intention to use Netflix in the Philippines, which, in turn, leads to actual usage.
H2.
Effort expectancy significantly influences the behavioral intention to use Netflix in the Philippines, which, in turn, leads to actual usage.
Social influence (SI) pertains to how consumers perceive the beliefs of others [32]. When individuals frequently encounter recommendations from others, particularly those who are avid users and hold positive views, they tend to take these recommendations seriously. SI becomes manifest when social groups exert an influence on consumers’ behavior [33]. In the context of this study, it delves into how social influence can serve as an indicator of consumers’ intentions to utilize Netflix for interactive entertainment viewing. The surge in interactive entertainment offerings on Netflix, exemplified by the emergence of productions like Kaleidoscope and Bandersnatch [34], suggests that word of mouth and the impact of social media may have played pivotal roles in their popularity. In detail, Netflix released the film with little promotion, and the strategic marketing approach worked because Bandersnatch quickly became a global trend on Twitter and in less than 24 h upon its release. Additionally, Reddit threads and fan sites created their own flowcharts to track the film’s multiple endings and complex story paths [35]. Similarly, Kaleidoscope, which was deployed for the masses in January 2023, had 13.5 unique viewers 10 days after its release [13]. This underscores the significance of one’s social circle in promoting engagement with interactive entertainment content. Furthermore, the role of cultural inclusion in people’s alignment with others when it comes to staying abreast of entertainment trends is also significant. With this, the following hypothesis was proposed:
H3.
Social influence significantly influences the behavioral intention to use Netflix in the Philippines, which, in turn, leads to actual usage.
Furthermore, one of the fundamental factors influencing consumers’ perceptions in the market context is pricing [36]. Within this framework, the interplay between what is received and what is offered unveils the components of benefits and costs. Usage intentions may be swayed by the potential costs, benefits, and implications of price value [37]. Additionally, Mulla [38] expounded upon how pricing exerts an impact on behavioral intentions within the realm of streaming platforms. This directly pertains to the pricing of Netflix, which can significantly influence the decision to either subscribe to or unsubscribe from the service.
In the Philippines, Netflix offers a range of subscription plans to cater to different user preferences and needs. The most affordable option is the Mobile Plan, priced at Php 149 per month, which allows for streaming on one device at a time. The Basic Plan, at Php 249 per month, also permits one concurrent stream. For those looking to share their account, the Standard Plan is available at Php 399 per month and allows streaming on up to two devices simultaneously. Moreover, users can add extra member slots for Php 149 each per month with this plan. The Premium Plan, priced at Php 549 per month, is designed for larger households or individuals with multiple devices and allows for streaming on up to four devices concurrently, with the option to add extra member slots for Php 149 per month each [39].
In contrast, Netflix subscription rates in the United States differ from those in the Philippines. In the USA, Netflix offers a Standard Plan with ads at $6.99 per month. Users who prefer an ad-free experience can opt for the Standard Plan without ads at $15.49 per month, with the ability to add extra member slots for $7.99 each per month. The Premium Plan, priced at $19.99 per month, includes ad-free streaming and allows simultaneous viewing on up to four devices, with the option to add extra member slots for $7.99 per month each [39].
The comparison of Netflix subscription rates in the Philippines and the United States sheds light on Hypothesis 4. The substantial disparity in pricing structures between these two locations demonstrates the impact of price value on customers’ behavioral desire to use Netflix. The availability of low-cost subscription options in the Philippines may influence consumers’ desire to subscribe and subsequent intention to utilize the site. Higher pricing in the United States, on the other hand, may impact customers’ impressions differently. This pricing disparity highlights the possible link between price sensitivity, behavioral intention, and actual Netflix usage, which supports Hypothesis 4 in this study. Furthermore, the option to share accounts between Netflix users can and was seen to mitigate the perceptions of monthly costs among consumers [18]. It could therefore be deduced that price value may influence behavioral intention and actual use of consumers. Consequently, the following hypothesis has been formulated:
H4.
Price value significantly influences the behavioral intention to use Netflix in the Philippines, which, in turn, leads to actual usage.
Malewar and Bajaj [40] elaborated on how hedonic motivation has been a driving force behind the engagement of Indian consumers on streaming platforms, and this trend is expected to continue to grow in the years ahead. Moreover, the sheer enjoyment that consumers derive from watching movies or series not only serves as a key driver of their engagement but also underpins the hypothesis that the adoption of these platforms significantly influences usage behavior. In detail, hedonic motivation captures the fun or pleasure derived from using technology, price value is linked to the tradeoff between a user’s perceived benefits of the application and the monetary cost of use, and habit labels automatically performed behavior [23]. Researchers define users’ enjoyment of entertainment as hedonic, signifying their motivation for engaging with content [41]. According to Mulla [38], hedonic motivation is characterized by the reasons why customers make purchases with the expectation of deriving enjoyment and entertainment. In the case of Netflix, it serves as a streaming platform that offers viewers a wide array of hedonistic benefits, encompassing amusement, relaxation, and a temporary escape from the demands of daily life—not to mention that it can be watched anywhere and anytime, being available on common smart phones and tablets. As a newly developed form of entertainment, interactive content continues to gain prominence, and consumers may develop varying perspectives and feelings regarding its value. Consequently, the study puts forth the following hypothesis:
H5.
Hedonic motivation significantly influences the behavioral intention to use Netflix in the Philippines, which, in turn, leads to actual usage.
According to the studies of Venkatesh et al. [27] and Kim et al., [42], habit as a behavior significantly influences an individual’s intention and actual usage, in this study, of Netflix in the Philippines. Habit, within the realm of consumer behavior, is characterized by the extent to which individuals engage in certain behaviors automatically and unconsciously due to their previous experiences [27]. It signifies a repetitive process driven by ingrained, unconscious behaviors. In the context of Netflix, subscribers often exhibit habitual behaviors such as binge-watching entire series or revisiting their favorite films during their leisure time. These behaviors can be viewed as routines that individuals have established in their entertainment consumption patterns. In essence, individuals may form habitual behaviors related to specific types of content or viewing habits, further emphasizing the complex interplay of habit formation and evolution. According to Venkatesh et al. [43], there is a favorable association between intention and actual utilization of technology. This suggests that a person’s purpose in using Netflix can influence their actual usage of the service. Consequently, the following hypothesis has been formulated:
H6.
Habit significantly influences the behavioral intention to use Netflix in the Philippines, which, in turn, leads to actual usage.
Facilitating conditions significantly impact the behavioral intention to utilize Netflix in the Philippines, subsequently leading to actual usage. Facilitating conditions encompass external factors, such as ease of access to devices and internet connectivity, that can either facilitate or hinder an individual’s ability to use Netflix effectively. Past research has demonstrated the significance of external determinants, including resource availability and technical support, in influencing technology adoption and utilization [23]. Therefore, this hypothesis posits that factors like user-friendliness and technical support can notably influence an individual’s actual use of Netflix [27,44]. As explained by Venkatesh et al. [23], facilitating conditions would be a latent variable that affects consumer behavior because facilitating conditions are associated with a user’s sense of accessible resources and assistance—leading to an effect on actual usage. Perez et al. [45] indicated that facilitating conditions are strongly related to technology use and affect actual usage. Additionally, Van Droogenbroeck and Hove [46] hypothesized that facilitating conditions had a positive effect on actual usage and technology adoption. Consequently, the following hypotheses have been formulated:
H7.
Facilitating conditions significantly influence the behavioral intention to use Netflix in the Philippines.
H8.
Facilitating conditions significantly influence the actual usage of Netflix in the Philippines.
Furthermore, behavioral intention, as influenced by various factors, including performance expectancy, effort expectancy, social influence, price value, and hedonic motivation, serves as a pivotal precursor to actual usage of different technologies [23]. Intentions reflect an individual’s purpose and willingness to engage with new technologies (in this case, Netflix for interactive entertainment). It encapsulates the user’s conscious decision to utilize the platform for their viewing needs. Venkatesh et al. [43] have underscored the significant relationship between behavioral intention and the subsequent utilization of technology, suggesting that an individual’s intent strongly correlates with their actual usage of the service. Based on related studies, the generation of the UTUAT2 impacting behavioral intentions was shown to have a considerable favorable effect [44,47]. Therefore, it is proposed that behavioral intention, shaped by a myriad of factors and motivated by the habitual behaviors entrenched in entertainment consumption, plays a substantial role in influencing the actual utilization of Netflix’s interactive entertainment in the Philippines. Consequently, the following hypothesis has been formulated:
H9.
Behavioral intention significantly influences the actual usage of Netflix in the Philippines.
3. Methodology
3.1. Demographics
Table 1 displays the descriptive data of the respondents. During March–April 2023, 258 valid responses were collected using convenience sampling. The research on Netflix Customer Behavior of Filipinos was evaluated using a digital survey. Due to stringent COVID-19 regulations and comprehensive online learning, an online survey was sent via Google Forms to various social media sites such as Facebook and Instagram to reach respondents. Purposive sampling was considered in the sampling, and only those who have considered and watched interactive entertainment such as Bandersnatch and Kaleidoscope were considered. The survey, which used a 5-point Likert Scale, complied with the Data Privacy Act (Republic Act No. 10173) of the Philippines, in which respondents were asked to fill out and sign a consent form. Respondents who agreed would proceed with the survey questionnaire, while those who disagreed would not. Table 1 represents the demographic profile of the respondents.

Table 1.
Demographic Characteristics.
There were 258 respondents that participated in the survey. In terms of age, most respondents (37%) were between the ages of 18 and 24, followed by those between the ages of 25 and 34 (32.9%) and those between the ages of 35 and 44 (5.80%). Meanwhile, 8.50% of respondents were aged 55 and up, with 3.5% being under the age of 17. In terms of educational attainment, most respondents (76.70%) had a bachelor’s degree, followed by a master’s degree (18.2%), elementary school (2.7%), and senior high school (2.35%). In terms of work status, 56.60% were employed, while 23.30% were students. Lastly, most respondents (55.80%) were from Luzon.
3.2. Questionnaire
This study’s survey questionnaire is broken into two portions. The first portion comprises questions about the respondents’ demographic profile, such as their name, gender, age, place of residence, educational background, employment, monthly household income, streaming platform subscriptions, and daily usage of streaming platforms. The second portion evaluates the different characteristics using a Likert scale with a five-point type, where 1 denotes the lowest and 5 indicates the greatest (5 = strongly agree, 1 = strongly disagree). The survey included 31 items covering the following nine latent variables: performance expectancy, effort expectancy, social impact, price value, hedonic motivation, enabling condition, habit behavior, behavioral intention, and actual use. The questionnaire items were adapted from the establishment of Venkatesh et al. [23]. The specifications of the items were adjusted to adhere with the objectives of this study. The measure items included both the original statement and the adapted items with corresponding reliability measures.
3.3. Data Pre-Processing
The data points were cleaned using correlation analysis following numerous studies as a means of implementing a feature selection technique [24,25]. A correlation coefficient of 0.20 with a p-value of 0.05 was chosen for significant indications. Additionally, the mean of significant indications was used to represent the latent variables in data aggregation. The Python normalization package (min_max scalar) was used. After data cleaning process was implemented, it was seen that all measure items were within the threshold for feature selection. These were then aggregated per variable, which represented the input nodes for the machine learning algorithms. The output variable, actual usage, was rescaled to be set as the output node. To distinguish the best output, several iterations and optimization processes of parameter per algorithm were considered.
To execute the machine learning methods, the Python Integrated Development Environment—Spyder 5.0 was utilized for random forest classifier and MATLAB R2021a for the neural network analysis. The ensemble’s optimization was then carried out [48]. Figure 2 depicts the systematic flowchart of the detailed procedure, of which the optimization process considered 60%, following the suggestion of German et al. [49]. This is because their test presented significance level against correlational values and a presence greater than 60% is deemed significant. Accordingly, better accuracy would be obtained if the results are higher. As attested by the results from the study of Öztürk and Başar [50], the comparison between multiple linear regression and neural network analyses provided close outcome, with neural network having more accurate output. The distinction was made at an acceptance level of 60–70%, but about 90% is desirable. Similar insights were obtained from a study by Asadikia [51].
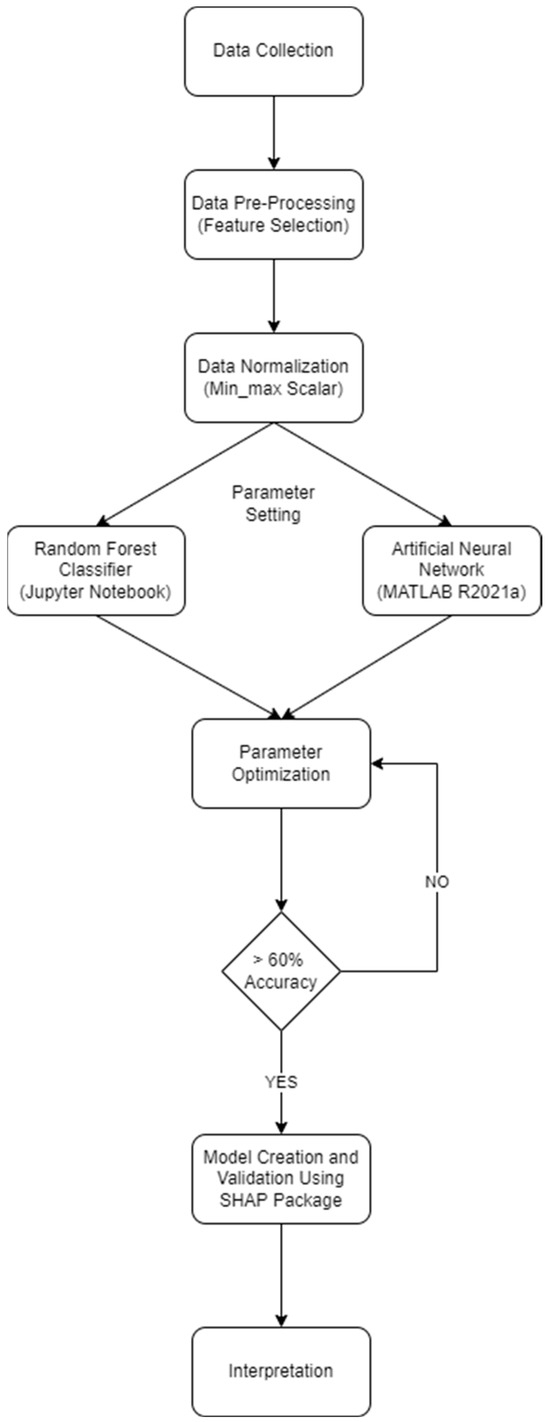
Figure 2.
Methodological Flowchart.
For the Python software, the sklearn package was employed, considering sklearn model selection, tree, decisiontreeclassifier, train_test_split, and metrics. Accordingly, the sklearn.ensemble with randomforestclassifier import was considered alongside sklearndataset and make_classification packages and libraries. Lastly, the classification_report and confusion_matrix were employed for training and testing output reports. For the MALTAB program, the machine learning package was employed, utilizing the neural network fit with the Levenberg-Marquart Algorithm, Bayesian Regularization, and Scaled Conjugated Gradient. The iterative process using the package was considered while finetuning the different parameters.
As expressed by related studies, the current trend nowadays focuses on machine learning as analysis tools because this promotes higher accuracy rates compared to multivariate analytical tools [52,53]. As expressed in previous studies [54,55,56,57] and by Hair et al. [58], structural equation modeling (SEM) is one of the most prominent multivariate analysis tools that encompasses path analysis, multiple linear regression, and factor analysis. However, recent studies have already presented numerous limitations of SEM. For example, Fan et al. [59] explored the strength between relationships of variables. It was presented that the presence of mediating factors reduces the significance level. Accordingly, the farther the variable is to the target object, the lesser the significance seen [60]. This is especially true when multiple paths are needed to be considered for a variable to be significant. In relation, the recent development of SEM as a higher-order reflective construct has been considered [61]. However, this may not always be applicable in all theoretical frameworks.
With that, studies such as that of German et al. [49] utilized machine learning algorithm using Python to analyze behavioral domain significance. In addition, the study by Gumasing et al. [52] highlighted the relevance of machine learning compared to SEM, especially when building consumer segmentation and customer selling strategies. The effectiveness of machine learning is its capability to assess nonlinear relationship models, promoting higher accuracy rates [62]. This denotes the connotation of SEM limitations. In addition, the error rates are encompassed in every iteration, presenting better analysis than SEM. Therefore, both random forest classifier and neural network are considered in this study, as these types of machine learning algorithm provide easier analysis, take less time, and provide efficient output [48,49,62].
3.4. Random Forest Classifier
Random forest classifier (RFC) stands out as a machine learning algorithm specialized in classification tasks. In their work, Chen et al. [48] emphasized RFC’s superiority over standard decision trees due to its ability to construct more accurate trees. This increased accuracy is a pivotal factor. In past studies [49,62], they harnessed the power of RFC to classify human factors affecting the adoption and real-world use of an application compared to traditional decision trees. They discovered RFC’s exceptional capability to dissect the influencers in individual decision-making processescompared to the basic decision tree, which promotes lower accuracy rates.
In line with this approach, data cleaning procedures included correlation analysis, following a protocol where a coefficient threshold of 0.20 and a p-value of 0.05 for acceptance were employed. This methodology was inspired by German et al. [49], who advocated for the removal of indicators with coefficients below 0.20, indicating weak or non-significant relationships as a form of feature selection. Applying this threshold, all indicators in the study were considered significant (≥0.20), aligning with the findings of Gumasing et al. [52]. Consequently, data aggregation was conducted using mean values to emphasize the latent variables under consideration. Remarkably, no missing values were detected, and no data points were eliminated during the initial data preprocessing stage.
To ensure data uniformity and comparability, the min–max scalar package was applied for data normalization. In the implementation of RFC using the Python Integrated Development Environment—Spyder 5.0, various parameters were fine-tuned to attain the optimal decision tree structure. The RFC algorithm from the sklearn package was employed, with considerations including criteria such as entropy or Gini, training–testing ratios ranging from 60:40 to 90:10, splitters like random or best, and tree depths spanning from 4 to 7. This exhaustive optimization process encompassed a total of 6400 runs, with 100 runs executed for each parameter combination, contributing significantly to the study’s rigor and comprehensiveness.
3.5. Artificial Neural Network Classification
An artificial neural network, also known as ANN, is a potent computational framework inspired by the intricate functioning of a biological brain and its neural system. It seeks to complete a specific job set to it while simultaneously learning from the data it consumes via a network of linked processors known as neurons [62]. These are typically used to address problems by utilizing dataset similarities and relationships. It is made up of three main levels: the input layer (which accepts data), the hidden layers (which calculate the input data), and the output layer (which produces results). Many researchers have used ANNs with different activation functions to identify complicated relationships due to the model’s capacity to handle nonlinear functions that help map any input to the output for any data [61].
In contemporary research, the fusion of ANNs in consumer behavior research has gained prominence for categorizing factors that influence human behavior. ANNs, designed to mimic neuronal signal transmission in the brain, offer a solution to the limitations of SEM by performing intricate calculations that yield more accurate outcomes [62]. Yuduang [29] applied a SEM–ANN hybrid to discern the determinants of perceived usability of a mental health mobile application among users. Their findings underscored the efficacy of ANN in forecasting factors influencing human behavior. Furthermore, Kalinic et al. [56] employed ANN to assess consumer satisfaction, illustrating its capacity to efficiently identify significant factors amidst noisy datasets and nonlinear relationships. Thus, ANN could be posited as a tool that could have higher accuracy rate, which was employed in this study together with RFC to provide insights on usage behavior of Netflix interactive entertainment in the Philippines.
The integration of ANNs and consumer behavior research has gained steam in recent years, providing a novel way to dissect the dense web of influences driving human choices. Furthermore, an ANN model was used to assess data and predict behavioral intentions in a study by Yidana et al. [63] that attempted to examine the behavioral intentions of economics students in Ghana to use tablets for learning. The model’s output produced correct predictions, resulting in high accuracy in identifying human behavior. The article concludes that the ANN model can be effective in forecasting students’ intentions toward certain technologies, particularly for learning. Similarly, Huang [64] and Talwar et al. [65] employed ANN as the major tool for forecasting people’s behavioral intentions about telecare, mobile learning technology, and travel.
MATLAB R2021a was used in this research paper to uncover major latent factors influencing academic use of communicational AI. Using the pre-processed data in RFC, an overall run for the neural networks accessible was calculated to discover the best parameters through the least Root Mean Square Error (RMSE) value. The MATLAB application was programmed using 75% training, 15% validation, and 10% testing sets. Accordingly, the Levenberg–Marquardt, Bayesian Regularization, and Scaled Conjugated Gradient algorithms, as well as varied hidden layer nodes by 10s, were examined as optimization processes [62].
4. Results
4.1. Random Forrest Classifier
The random forest classifier was used in this study to evaluate the major elements influencing Netflix consumer behavior regarding interactive entertainment. Following the optimization procedure, depth 5 yielded the highest average accuracy of 96% with a standard deviation of 0.00. This demonstrates how the tree gave consistent results across all runs (Figure 3). Table 2 shows a summary of the decision tree from the random forest classifier mean accuracy result, including the F1-Score. This process considered a hard voting classifier.
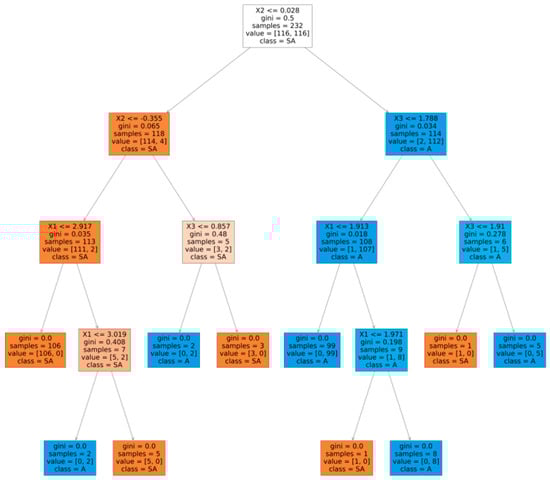
Figure 3.
Decision Tree from random forest classifier. Legend: X1—facilitating condition, X2—hedonic motivation, X3—behavioral intention.
Table 2.
Mean Accuracy—Hard Voting Classifier (Random Forest).
For the soft voting classifier, a summarization of the total decision tree output with the random forest classifier was implemented [66,67]. It can be seen that between the outputs (Table 3), variance on the accuracy rate was obtained. Despite the high accuracy rate (92%), the implications could be that the outputs are subjective and inconsistent since the standard deviation represents differences in output (StD = 0.512). Accordingly, applying another soft voting classifier, LightGBM, the accuracy rate obtained was only 88.46%. This was deemed acceptable, but better accuracies would represent the intended measure objectives [66,67].
Table 3.
Soft Voting Classifier.
Since there was no significant difference in the findings using ANOVA, this study chose the best accuracy with the lowest standard deviation. It was discovered that using gini as the criteria and best as the splitter at a training and testing ratio of 90:10 resulted in maximum accuracy. Figure 4 indicates the best decision tree from the random forest classifier for determining factors influencing usage behavior. As seen in Figure 4, hedonic motivation (X2) is the parent node that would define aspects impacting Netflix user behavior in terms of interactive entertainment. It will consider the child nodes enabling circumstances (X1) and behavioral purpose (X3). X2 with a value of −0.355 will be considered if the criterion is less than or equal to 0.028. If this is not satisfactory, X1 will be examined, as will behavioral intention (X3), resulting in extremely high usage behavior of Netflix consumers for interactive entertainment. This implies that Netflix customers have a larger hedonic motive to watch interactive entertainment; nevertheless, if −0.355 is satisfied, it will consider X2, which will result in extremely high consumption behavior of Netflix users owing to interactive entertainment.
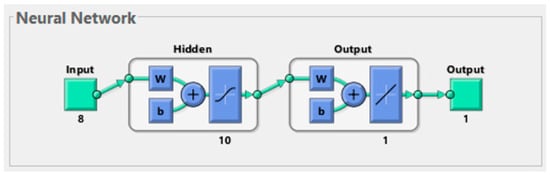
Figure 4.
Neural Network Model.
Following the random forest classifier, the first node’s false is considered X3. Either meeting the requirement will consider X1 and X2, resulting in high consumption behavior of Netflix’s interactive entertainment. As a result, it is possible to conclude that X1, X2, and X3 will result in high consumption behavior of Netflix’s interactive entertainment. Astley [11] stated that Netflix spurred their invention by providing interactive entertainment that no other platform could provide. Netflix is expected to be at the forefront of interactive entertainment since the streaming service’s management sees it as both a content and a technology company [12]. The incorporation of interactive features into its content offerings has offered viewers an immersive and engaged experience. Currently, Netflix’s interactive entertainment has gotten a lot of attention, such as Black Mirror: Bandersnatch, in which consumers may choose what action the main character will do at various points during the film, from the beginning to the end.
4.2. Artificial Neural Network Classification
The Levenberg–Marquardt algorithm produced the best r-squared value and lowest RMSE during the optimization process, with values of 0.87367 for training, 0.83369 for validation, 0.90035 for testing, and 0.86972 overall. Bayesian Regularization, on the other hand, has RMSEs of 0.81921 for training, 0.91569 for testing, and 0.82773 overall. Finally, the RMSE for Scaled Conjugate Gradient was 0.81919 for training, 0.87504 for validation, 0.70913 for testing, and 0.82017 overall. Therefore, continuous optimization among the different hidden node numbers showed the best r-squared output of 0.86972 overall and 0.90035 for the test at 10 with the Levenberg–Marquardt algorithm. This was considered the optimum ANN model as presented in Figure 4. Moreover, the output of the different algorithms is presented in Figure 5 (Levenberg–Marquardt), Figure 6 (Bayesian Regularization), and Figure 7 (Scaled Conjugate Gradient).
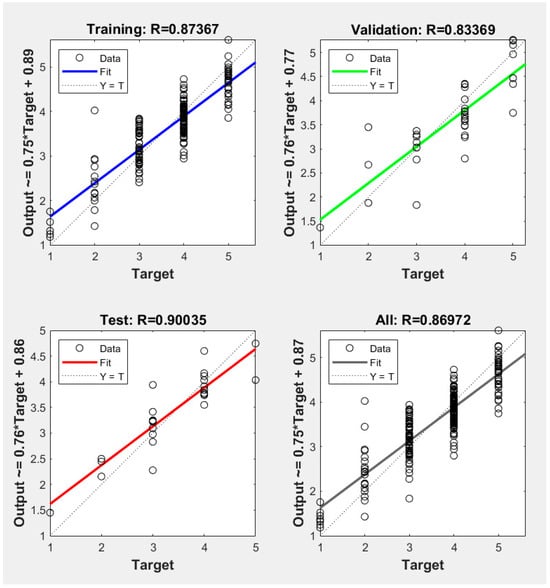
Figure 5.
Levenberg–Marquardt.
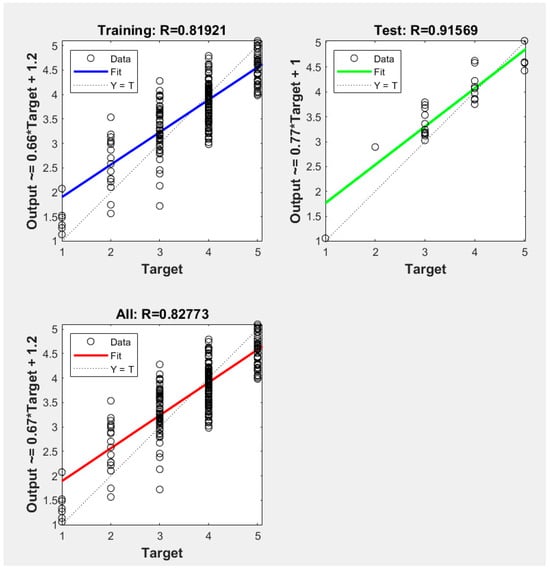
Figure 6.
Bayesian Regularization.
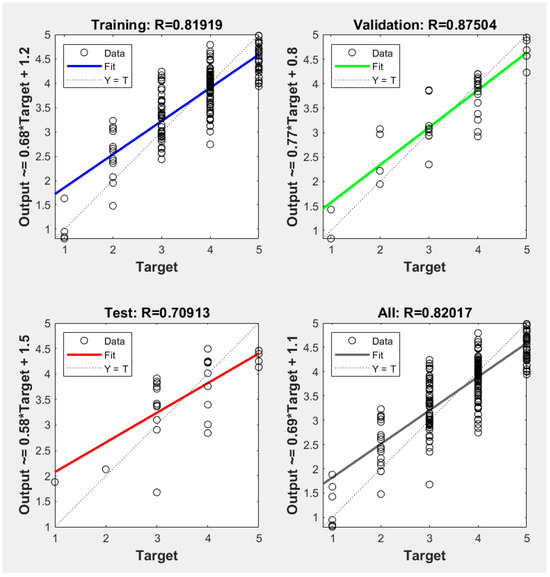
Figure 7.
Scaled Conjugate Gradient.
According to Garoosiha et al. [68] and Roy et al. [69], the use of the Levenberg–Marquardt algorithm in ANN has better performance compared to the Bayesian framework method. Like these papers, our results showed that the use of the Levenberg–Marquardt algorithm has better performance. Accordingly, the validation of the output is presented in Table 4, where the SHAP package was utilized to generate the score of importance.
Table 4.
Score of importance.
5. Discussion
Since the creation and availability of internet streaming platforms, many have seized the opportunity and pushed their own version. Netflix, as one of the market’s pioneers, pioneered a new way of watching television shows and movies. Netflix’s Interactive products, whether directed by the spectator (e.g., Bandersnatch) or sequential (e.g., Kaleidoscope), is still relatively new, having been released in 2018 and 2022, respectively. No other streaming services have produced anything like or close to what Netflix has. Others, such as Disney+ and Pixar, AppleTV+, and Paramount+, are centered on the original plot and are only available on their own platforms. Thus, the purpose of this study was to assess interactive entertainment consumption behavior to discover key factors influencing usage behavior.
According to the findings from the ANN and RFC, hedonic motivation exhibited the greatest influence among the latent variables. Based on the respondents, it was seen that interactive entertainment is entertaining, fun, and pleasurable to watch. According to the studies of Jia et al. [70] and Camilleri and Falzon [71], the satisfaction, amusement, and pleasure obtained from entertainment or technology have a big impact on its adoption and utilization. Hedonic motivation, which is based on good sentiments and satisfaction, emerges as a critical component in determining user adoption of entertainment and technology. Similarly, a study by Malewar and Bajaj [40] explains that hedonic motivation is also the most significant latent variable in their study, and their research focused on the engagement of Indian consumers on streaming platforms. Individuals are more inclined to accept interactive entertainment when there is a high amount of hedonic incentive throughout their interaction. For interactive entertainment, people appreciate and engage in it when it provides them with a lot of delight and satisfaction.
The number two most significant latent variable is the facilitating condition. Based on the respondents, the availability of critical resources indicates that adopting and employing interactive entertainment has a big influence, especially when backed by appropriate equipment gained from the worlds of entertainment or technology. Netflix has made it possible for customers to request assistance through calls and chats, which are available on each individual account [72]. Aside from that, Netflix is available on any sort of device, including Windows or Mac laptops or PCs, Android or IOS phones, tablets, or iPads. This encourages its enabling circumstances. Similarly, a study by Venkatesh et al. [23] explains that the facilitating condition is among the latent variables in their study, and their research is focused on consumer behavior. Individuals are therefore more inclined to accept interactive entertainment when there is a high number of facilitating conditions. It was seen that people appreciate and engage in interactive entertainment when the essential resources and expertise are available, as well as when equipment capable of handling interactive entertainment is provided.
The third most significant latent variable is the behavioral intention. Based on the survey respondents, they frequently exhibit a strong desire to embrace the technical marvel of interactive entertainment, particularly through streaming platforms, with a clear aim to continue doing so in the future. By delving into the complexities of behavioral intention, it elucidates a consumer’s determination to use a specific technology, impacting their usage patterns [73]. The essential tenet asserts that individuals are likely to carry out a predetermined course of action [73]. Based on this assumption, Raman and Don [74] contend that behavioral intention is the most accurate predictor of consumption behavior. Furthermore, the findings of Zahra et al. [75] support the notion that behavioral intention represents a commitment to the continued use of technology. Furthermore, they emphasize the pervasiveness of behavioral intention in the setting of interactive entertainment. Even when provided with several alternatives, people tend to stick with viewing and participating in interactive material. This highlights the critical significance of behavioral intention, emphasizing the strong association between individuals’ intent and subsequent technological usage. The study, in essence, underlines the predictive potential inherent in individuals’ resolve to form their actual usage patterns in the changing world of interactive entertainment.
Habit is found to be the next most significant latent variable. The responses reflect a common pattern of regular involvement with Netflix’s interactive material, displaying behaviors that border on addiction, while not totally inherent. This is consistent with Venkatesh et al.’s [27] conceptual paradigm, in which habituation and hedonic drive mix to produce automatic and perhaps addictive behaviors during exchanges with Netflix’s content. A sizable majority of respondents spend significant time navigating the platform, implying increased familiarity and validating the strong nature of the observed habitual propensity. This increased participation underscores the importance of Netflix’s interactive entertainment offerings in terms of adoption and retention. Netflix’s consistent presence in the Philippine streaming market since 2016 lends credence to this habitual preference. The COVID-19 epidemic worked as a catalyst, boosting widespread adoption and establishing watching habits, which corresponds to Perez-Grajo’s [76] views on the significance of habituation in molding usage behavior, particularly during lengthy home confinement. When delving into the subtle level of habituation, as defined by Herting et al. [77], it includes instinctive actions anchored in earlier experiences. The observed phenomena of binge-watching or returning films highlight this automaticity. This viewpoint is consistent with Yoo et al.’s [78] investigation of changing entertainment preferences, emphasizing the favorable impact of habit creation via streaming platforms to total consumption behavior. As a result, this shortened study retains the depth and rigor observed in the preceding discussion on hedonic motivation, stressing the critical role of habituation in determining the dynamic landscape of interactive entertainment adoption.
The next significant latent variable is social influence. Based on the respondents, it was seen that the proclivity to engage in interactive entertainment on streaming platforms is favorably related to the preferences of respected persons who have influence over the individual’s behavior. According to Shah and Mehta [79], social influence exhibits a positive significant relationship with real and continuous usage of over-the-top streaming services. In terms of social impact, it was demonstrated that other people watch interactive entertainment and are influenced by it. Interestingly, it contradicts various articles describing how Netflix enhanced interactive entertainment to display the news on social media platforms [80,81]. The variations in results about the impact of interactive entertainment on social media may be due to methodological differences, highlighting the need for rigorous study design in understanding complex consumer behaviors. The findings supported Steiner and Wu’s [82] argument that there is cultural inclusion when people relate with others about entertainment trends.
The succeeding significant latent variable is effort expectancy. Based on the respondents, people regard their participation in interactive entertainment on streaming platforms as both transparent and reasonable. This delight is heightened by the perceived ease with which the skills connected with viewing interactive content on these streaming platforms may be mastered. As Venkatesh et al. [27] describe, effort expectation is a latent variable focusing on the knowledge received via the application of technology. In this regard, this study concentrated on the entertainment component rather than the knowledge individuals would get. When it comes to health, knowledge, or other information-related resources, effort expectation is a crucial driver [83]. However, this study concluded that the use of entertainment technology may have no major consequences, particularly when people have formed the habit of utilizing the technology in a repeated manner.
The succeeding and second-to-least-significant latent variable and is price value. It was presented that subscriptions to streaming platforms are acknowledged to be reasonably priced. According to the respondents, these memberships provide good value for money. Furthermore, shared account access enhances the present value proposition, adding to the evaluation of subscriptions to streaming platforms as an exceptional value at their current cost. This is comparable to Perez-Grajo’s [76] research. This sort of entertainment is especially popular in the Philippines, where income levels are lower than in wealthy nations. According to the demographics, most respondents have a monthly salary of 40,000 PHP or less. This implies they earn around 35,000 PHP after taxes, making them part of the group of citizens who are lower-income to poor [84]. However, this only accounts for 16.77% of the total, with the remainder being mostly lower. With less expensive options for entertainment, such as account sharing, this highlighted how price is a crucial driver in this research.
The least significant and final variable is performance expectancy. Based on the respondents, individuals perceive a gain in their daily lives from engaging in interactive entertainment on streaming platforms, according to research into the hidden variable of performance expectation. This involvement is considered to be promoting the speedy acquisition of the pleasurable experience associated with viewing movies, eventually contributing to an increase in individual productivity. With this, people find it advantageous to utilize the streaming platform; Netflix’s interactive entertainment fulfills leisure demands and aids in productivity. According to Jia et al. [70], the value acquired from continuous viewing on a streaming platform was more important than other variables such as perceived advantages and perceived sacrifices. Similarly, Shah and Mehta [79] found a positive significant relationship between performance expectancy and actual and ongoing usage of over-the-top streaming services.
In the overarching analysis of the latent variable of actual usage, a noteworthy trend emerges as individuals consistently prioritize interactive entertainment over conventional movie options. This tendency is not sporadic; rather, it builds a consistent pattern in which consumers actively participate in frequent watching of interactive material on streaming platforms, devoting substantial time to these activities. The findings reveal a significant preference for the compelling and diversified content provided by streaming platforms, emphasizing the importance of interactive entertainment as a ubiquitous and everyday part of people’s media consuming habits. It is important to emphasize that the discussion and interpretation of these findings were driven by a nuanced evaluation that included the significance score. Furthermore, the use of sophisticated machine learning methods, such as artificial neural networks and random forest classifiers, adds a layer of resilience to the results. With an artificial neural network accuracy level of 86.76% and a random forest classifier accuracy level of 96%, these findings not only provide valuable insights but also lay the groundwork for future research endeavors in the dynamic realm of interactive digital entertainment.
5.1. Theoretical Implication
In this study, the Unified Theory of adoption and Use of Technology 2 (UTAUT2) was used, which gave useful insights into the aspects impacting the adoption and use of interactive entertainment on Netflix. The framework, which is based on the original UTAUT, has proven to be an effective model for analyzing the intricate dynamics of consumer behavior in the context of developing entertainment technology. One of the techniques utilized in this study is an artificial neural network, which is mostly used for pattern recognition since it mimics the biological component of neurons in the brain [85]. This is often used for large dataset categorization, time series forecasting, and function approximation or regression [86]. Because it allows a multi-layer examination of complicated datasets, artificial neural networks have been proven to have a greater degree of predictive and classification capability when compared to statistical approaches such as function approximation or regression [87].
In addition, a random forest classifier was also utilized as another machine learning approach. According to Biau et al. [88], this decision-tree-based approach is one of the most accurate and trustworthy classifiers accessible. In comparison to existing research papers, this study presented a novel and comprehensive way of studying consumer behavior, encompassing the behavioral intention to use and actual usage behavior of the consumers of Netflix’s interactive entertainment. Having said that, the findings of this investigation show an artificial neural network accuracy level of 86.76%, which is commensurate with the random forest classifier results of 96%. It may be concluded that the accuracy levels of both machine learning algorithms can serve as a foundation for future research in the same area.
5.2. Practical Implication
The findings of this study provided significant insights with practical implications for Netflix and other streaming platforms looking to increase consumer acceptance and engagement with interactive entertainment. For starters, the importance of hedonic motivation emphasizes the need to emphasize highly interesting and pleasurable interactive material. Investing in the ongoing enhancement of the joy and satisfaction obtained from user experiences can encourage positive engagement. Second, facilitating conditions such as accessible customer assistance and device compatibility play an important part in streamlining the user adoption process. To improve facilitating conditions, Netflix, for example, may keep its great customer care channels while still ensuring seamless compatibility. Third, to recognize and build on good behavioral intentions, platforms must continually provide creative and technologically sophisticated interactive elements. Active communication regarding the distinct advantages of interactive entertainment strengthens user appreciation and preference. Finally, because interactive entertainment is habit-forming, platforms may profit from this characteristic by constantly inventing content and services. Encouragement of frequent use via individualized suggestions helps to create a natural and pleasurable integration of interactive material into users’ viewing habits. These practical recommendations are customized to meet the study’s particular latent factors and provide strategic counsel for streaming platforms to maximize their offers and drive continuous user engagement.
In addition to ideas for improving interactive entertainment, producers and streaming platforms must prioritize user-centric techniques. Prioritizing continual innovation and user-friendly interfaces for Netflix developers will help create a seamless and engaging interactive experience. Using machine learning algorithms to adapt suggestions based on user choices might improve user happiness and habit development even further. Maintaining an open conduit for customer comments and preferences is critical for Netflix to remain on top of changing audience expectations. Strategic collaboration with content developers to expand interactive offers guarantees a dynamic and compelling content inventory. Collaboration with other streaming sites in industry forums may help to create best practices and raise the bar for interactive entertainment throughout the digital streaming environment. These larger methods are consistent with the identified latent factors, resulting in a comprehensive framework for long-term success in the fast-expanding world of interactive digital entertainment.
5.3. Limitations
While this study provides useful insights into the elements impacting the actual use of interactive entertainment on streaming platforms, there are certain limitations to be aware of. To begin, the study focuses largely on the Filipino community, which may restrict the findings’ generalizability to a larger cultural setting. Future research can use a more diversified and expansive approach to expand on the current study and solve its shortcomings. Similar studies in diverse cultural settings would allow for a more thorough knowledge of the cross-cultural dynamics driving interactive entertainment consumption. Furthermore, relying on self-reported data involves the possibility of response bias, as participants may produce replies that are socially desirable. The cross-sectional form of the study gives a snapshot of user activity; however, a longitudinal approach might provide more dynamic insights into changes over time. Longitudinal studies have the potential to capture the changing nature of user preferences and behaviors across time. Exploring the complexities of interactive entertainment consumption on platforms other than Netflix would help develop a more sophisticated understanding of user behavior in the larger streaming ecosystem.
Moreover, the study focuses on the environment of Netflix, and differences in user behavior across various interactive platforms remain an issue for further research. A mixed-methods approach that blends qualitative and quantitative data might provide a more comprehensive picture of user motives and experiences. Researching the influence of upcoming technologies like virtual reality and augmented reality on interactive entertainment engagement might give significant insight into the future of digital entertainment consumption. Lastly, future research may take into consideration the implementation of deep learning. That is, several parameters of the ANN may be employed to find the optimum output. For example, activation functions may be considered, alongside the number of hidden layers, optimizers, and even different feature selection techniques. Having one whole algorithm, as in this paper, is beneficial for ease of use, cost, and convenience. However, other studies have suggested that using activation functions like tanh, sigmoid, swish, among others, as well as adam, SGD, or RMSProp for ANN may be more meticulous in analysis, promoting higher accuracy rates [89]. To this end, other algorithms may also be helpful, such as the clustering of factors, association rule mining of domains, and even forecasting using long short-term memory.
6. Conclusions
This study dives into the diverse world of interactive entertainment consumption on streaming platforms, with a particular emphasis on Netflix and its influence on Filipino consumers. The study of latent variables such as hedonic motivation, enabling circumstances, behavioral intention, habit, social influence, effort expectation, price value, and performance expectancy has shown important aspects impacting users’ decisions and engagement patterns. The findings revealed a strong preference for interactive material, depicting it as a regular and essential part of people’s media consumption habits. Using advanced analytics, such as artificial neural networks and random forest classifiers, not only strengthened the study’s findings, but also cleared the path for future investigations into the changing environment of digital entertainment.
However, it is critical to acknowledge the study’s shortcomings, such as its cultural distinctiveness and dependence on self-reported data. Despite these limits, the findings provide a good framework for further research into the worldwide landscape of interactive entertainment. The study recommends for continued research to adapt methodology, include varied cultural settings, and investigate future technologies as the digital environment advances. In the field of interactive entertainment, the dynamic interactions between user preferences, technology breakthroughs, and societal influences provide fertile ground for scholarly investigation, offering a greater knowledge of the expanding landscape of digital media consumption.
Author Contributions
Conceptualization, R.R.A.G. and A.K.S.O.; methodology, R.R.A.G. and A.K.S.O.; software, R.R.A.G. and A.K.S.O.; validation, R.R.A.G. and A.K.S.O.; formal analysis, R.R.A.G. and A.K.S.O.; investigation, R.R.A.G. and A.K.S.O.; resources, R.R.A.G. and A.K.S.O.; data curation, R.R.A.G. and A.K.S.O.; writing—original draft preparation R.R.A.G. and A.K.S.O.; writing—review and editing, R.R.A.G. and A.K.S.O.; visualization, R.R.A.G. and A.K.S.O.; supervision, A.K.S.O.; project administration, A.K.S.O.; funding acquisition, A.K.S.O. All authors have read and agreed to the published version of the manuscript.
Funding
This research was funded by Mapua University Directed Research for Innovation and Value Enhancement (DRIVE).
Institutional Review Board Statement
This study was approved by Mapua University Research Ethics Committees (FM-RC-23-01-50).
Informed Consent Statement
Informed consent was obtained from all subjects involved in this study (FM-RC-23-02-50).
Data Availability Statement
The data presented in this study are available upon request from the corresponding author.
Acknowledgments
The authors would like to thank all the respondents who answered our online questionnaire. We would also like to thank our friends for their contributions in the distribution of the questionnaire.
Conflicts of Interest
The authors declare no conflicts of interest.
References
- Finsterwalder, J.; Kuppelwieser, V.G.; de Villiers, M. The effects of film trailers on shaping consumer expectations in the entertainment industry—A qualitative analysis. J. Retail. Consum. Serv. 2012, 19, 589–595. [Google Scholar] [CrossRef]
- Ahuja, V. Transforming the media and entertainment industry. J. Cases Inf. Technol. 2022, 23, 1–17. [Google Scholar] [CrossRef]
- Statista Internet Usage in the Philippines. Available online: https://www.statista.com/topics/5660/internet-economy-in-the-philippines/ (accessed on 14 April 2024).
- Estopace, E. Netflix’s Answer to Slow Internet: Adaptive Streaming. Available online: https://www.philstar.com/business/technology/2016/06/06/1590535/netflixs-answer-slow-internet-adaptive-streaming (accessed on 14 April 2024).
- Statista Streaming in the Philippines. Available online: https://www.statista.com/topics/8367/streaming-in-the-philippines/ (accessed on 14 April 2024).
- Lüders, M. Self-determined or controlled, seeking pleasure, or meaning? Identifying what makes viewers enjoy watching television on streaming services. Poetics 2022, 92, 101639. [Google Scholar] [CrossRef]
- Lüders, M.; Sundet, V.S. Conceptualizing the experiential affordances of watching online TV. Telev. New Media 2021, 23, 335–351. [Google Scholar] [CrossRef]
- Wayne, M.L. Netflix, Amazon, and branded television content in subscription video on-demand portals. Media Cult. Soc. 2017, 40, 725–741. [Google Scholar] [CrossRef]
- Malasig, J. Philippines Ranks 4th among Countries with Most Number of People Subscribed to Streaming Service. Available online: https://interaksyon.philstar.com/hobbies-interests/2021/07/01/195036/philippines-ranks-4th-among-countries-with-most-number-of-people-subscribed-to-streaming-service/ (accessed on 14 April 2024).
- Statista Netflix: Number of Subscribers Philippines 2017–2020. Available online: https://www.statista.com/statistics/607624/philippines-netflix-subscribers/ (accessed on 14 April 2024).
- Astley, S. “Are You Still Playing?”: What the Future Holds for Netflix’s Interactive Entertainment. Available online: https://www.polygon.com/23272871/netflix-interactive-entertainment (accessed on 14 April 2024).
- Griffin, D. Netflix’s Interactive Movie and TV Show Initiative Explained—State of Streaming. Available online: https://www.ign.com/articles/netflixs-interactive-movie-and-tv-show-initiative-explained-state-of-streaming (accessed on 14 April 2024).
- PlumResearch Netflix’s “Kaleidoscope”. Available online: https://plumresearch.prowly.com/225808-the-unfortunate-fate-of-netflixs-1899 (accessed on 14 April 2024).
- Oliveira, A.; Azevedo, A.; da Silva, M. Streaming Services Consumer Behaviour: A Netflix User Case Study in Brazil and Portugal. Available online: https://docslib.org/doc/11143046/streaming-services-consumer-behaviour-a-netflix-user-case-study-in-brazil-and-portugal (accessed on 14 April 2024).
- San Juan, D.M. Cinema Pandemia: Reflections on the underrated Netflix series La révolution vis-à-vis current Philippine & International Realities. Plaridel 2022. [Google Scholar] [CrossRef]
- Myers, J. The Power of Netflix on Consumer Behavior. Available online: https://www.spscommerce.com/blog/consumer-behavior/ (accessed on 14 April 2024).
- Annissa, I.; Susilawati, W.; Suseno, N.; Hamdani, N.A. Netflix consumer preference analysis. J. Pendidik. Manaj. Bisnis 2020, 20, 42–46. [Google Scholar]
- Lobato, R.; Lotz, A.D. Imagining global video: The Challenge of Netflix. J. Cine. Media Stud. 2020, 59, 132–136. [Google Scholar] [CrossRef]
- Schewe, K.-D. Computation on structures—The challenge of seamless integration of theory and rigorous scientific practice. Front. Comput. Sci. 2021, 3, 670602. [Google Scholar] [CrossRef]
- Yates, J.F.; de Oliveira, S. Culture and Decision Making. Available online: https://www.ncbi.nlm.nih.gov/pmc/articles/PMC7126161/ (accessed on 14 April 2024).
- Khan, M.; Khusro, S.; Alam, I.; Ali, S.; Khan, I. Perspectives on the design, challenges, and evaluation of Smart TV user interfaces. Sci. Program. 2022, 2022, 2775959. [Google Scholar] [CrossRef]
- Anant, V.; Donchak, L.; Kaplan, J.; Soller, H. The Consumer-Data Opportunity and the Privacy Imperative. Available online: https://www.mckinsey.com/capabilities/risk-and-resilience/our-insights/the-consumer-data-opportunity-and-the-privacy-imperative (accessed on 14 April 2024).
- Venkatesh, V.; Thong, J.Y.; Xu, X. Consumer acceptance and use of information technology: Extending the unified theory of acceptance and use of Technology. MIS Q. 2012, 36, 157. [Google Scholar] [CrossRef]
- German, J.D.; Ong, A.K.; Perwira Redi, A.A.; Robas, K.P. Predicting factors affecting the intention to use a 3PL during the COVID-19 pandemic: A machine learning ensemble approach. Heliyon 2022, 8, e11382. [Google Scholar] [CrossRef] [PubMed]
- Ong, A.K. A machine learning ensemble approach for predicting factors affecting STEM students’ future intention to enroll in chemistry-related courses. Sustainability 2022, 14, 16041. [Google Scholar] [CrossRef]
- Dash, G.; Paul, J. CB-SEM vs. PLS-SEM methods for research in Social Sciences and Technology forecasting. Technol. Forecast. Soc. Change 2021, 173, 121092. [Google Scholar] [CrossRef]
- Venkatesh, V.; Morris, M.G.; Davis, G.B.; Davis, F.D. Davis User acceptance of information technology: Toward a unified view. MIS Q. 2003, 27, 425. [Google Scholar] [CrossRef]
- Ghalandari, K. The Effect of Performance Expectancy, Effort Expectancy, Social Influence and Facilitating Conditions on Acceptance of E-Banking Services in Iran: The Moderating Role of Age and Gender. Bus. Econ. 2012, 12, 801–807. [Google Scholar]
- Yuduang, N.; Ong, A.K.; Vista, N.B.; Prasetyo, Y.T.; Nadlifatin, R.; Persada, S.F.; Gumasing, M.J.J.; German, J.D.; Robas, K.P.; Chuenyindee, T.; et al. Utilizing structural equation modeling–artificial neural network hybrid approach in determining factors affecting perceived usability of mobile mental health application in the Philippines. Int. J. Environ. Res. Public Health 2022, 19, 6732. [Google Scholar] [CrossRef]
- Sair, S.; Danish, R. Effect of performance expectancy and effort expectancy on the mobile commerce adoption intention through personal innovativeness among Pakistani consumers. Bus. Econ. 2018, 12, 501–520. [Google Scholar]
- Kang, S. Factors influencing intention of mobile application use. Int. J. Mob. Commun. 2014, 12, 360. [Google Scholar] [CrossRef]
- Nikolopoulou, K.; Gialamas, V.; Lavidas, K. Habit, hedonic motivation, performance expectancy and technological pedagogical knowledge affect teachers’ intention to use mobile internet. Comput. Educ. Open 2021, 2, 100041. [Google Scholar] [CrossRef]
- Abbas Naqvi, M.H.; Jiang, Y.; Miao, M.; Naqvi, M.H. The effect of social influence, trust, and entertainment value on social media use: Evidence from Pakistan. Cogent Bus. Manag. 2020, 7, 1723825. [Google Scholar] [CrossRef]
- Poniewozik, J. Streaming Changed TV. Is TV Changing Streaming Back? Available online: https://www.nytimes.com/2023/01/06/arts/television/kaleidoscope-netflix-streaming.html (accessed on 14 April 2024).
- Strause, J. “Black Mirror” Duo on the Challenges of Netflix’s First Interactive Movie—And Why They Would Do It Again. Available online: https://www.hollywoodreporter.com/tv/tv-news/black-mirror-team-complexity-bandersnatch-netflix-data-1213270/ (accessed on 14 April 2024).
- Levrini, G.R.; dos Santos, M.J. The influence of price on purchase intentions: Comparative study between cognitive, sensory, and neurophysiological experiments. Behav. Sci. 2021, 11, 16. [Google Scholar] [CrossRef] [PubMed]
- Zhao, H.; Yao, X.; Liu, Z.; Yang, Q. Impact of pricing and product information on consumer buying behavior with customer satisfaction in a mediating role. Front. Psychol. 2021, 12, 720151. [Google Scholar] [CrossRef]
- Mulla, T. Assessing the factors influencing the adoption of over-the-top streaming platforms: A literature review from 2007 to 2021. Telemat. Inform. 2022, 69, 101797. [Google Scholar] [CrossRef]
- Netflix Help Center Plans and Pricing. Available online: https://help.netflix.com/en/node/24926 (accessed on 14 April 2024).
- Malewar, S.; Bajaj, S. Acceptance of OTT video streaming platforms in India during covid-19: Extending UTAUT2 with content availability. J. Content Community Commun. 2020, 12, 89–106. [Google Scholar] [CrossRef] [PubMed]
- Khatimah, H.; Susanto, P.; Abdullah, N.L. Hedonic Motivation and Social Influence on Behavioral Intention of E-Money: The Role of Payment Habit as a Mediator. Int. J. Entrep. 2019, 23, 1–9. [Google Scholar]
- Kim, D.J.; Ferrin, D.L.; Rao, H.R. A trust-based consumer decision-making model in electronic commerce: The role of trust, perceived risk, and their antecedents. Decis. Support Syst. 2013, 44, 461–469. [Google Scholar] [CrossRef]
- Venkatesh, V.; Davis, F.D. A theoretical extension of the technology acceptance model: Four longitudinal field studies. Manag. Sci. 2000, 46, 186–204. [Google Scholar] [CrossRef]
- Alalwan, A.A.; Dwivedi, Y.K.; Rana, N.P. Factors influencing adoption of mobile banking by Jordanian Bank customers: Extending UTAUT2 with trust. Int. J. Inf. Manag. 2017, 37, 99–110. [Google Scholar] [CrossRef]
- Perez, W.D.; Prasetyo, Y.T.; Cahigas, M.M.; Persada, S.F.; Young, M.N.; Nadlifatin, R. Factors influencing non-fungible tokens (NFT) game engagement during the covid-19 pandemic: The theory of planned behavior (TPB) and hedonic motivation system adoption model (HMSAM) approach. Heliyon 2023, 9, e19847. [Google Scholar] [CrossRef]
- Van Droogenbroeck, E.; Van Hove, L. Adoption and usage of E-grocery shopping: A context-specific UTAUT2 model. Sustainability 2021, 13, 4144. [Google Scholar] [CrossRef]
- Schomakers, E.-M.; Lidynia, C.; Vervier, L.S.; Valdez, A.C.; Ziefle, M. Applying an extended UTAUT2 model to explain user acceptance of lifestyle and Therapy Mobile Health Apps: Survey Study. JMIR mHealth uHealth 2022, 10, e27095. [Google Scholar] [CrossRef] [PubMed]
- Chen, J.; Li, Q.; Wang, H.; Deng, M. A machine learning ensemble approach based on Random Forest and radial basis function neural network for risk evaluation of Regional Flood Disaster: A case study of the yangtze river delta, China. Int. J. Environ. Res. Public Health 2019, 17, 49. [Google Scholar] [CrossRef] [PubMed]
- German, J.D.; Ong, A.K.; Redi, A.A.; Prasetyo, Y.T.; Robas, K.P.; Nadlifatin, R.; Chuenyindee, T. Classification modeling of intention to donate for victims of Typhoon odette using Deep Learning Neural Network. Environ. Dev. 2023, 45, 100823. [Google Scholar] [CrossRef]
- Öztürk, O.B.; Başar, E. Multiple linear regression analysis and artificial neural networks based decision support system for energy efficiency in shipping. Ocean. Eng. 2022, 243, 110209. [Google Scholar] [CrossRef]
- Asadikia, A.; Rajabifard, A.; Kalantari, M. Systematic prioritisation of sdgs: Machine learning approach. World Dev. 2021, 140, 105269. [Google Scholar] [CrossRef]
- Gumasing, M.J.; Prasetyo, Y.T.; Ong, A.K.; Nadlifatin, R.; Persada, S.F. Determining factors affecting the perceived preparedness of super typhoon: Three broad domains of Ergonomics Approach. Sustainability 2022, 14, 12202. [Google Scholar] [CrossRef]
- Ganesapillai, M.; Sinha, A.; Mehta, R.; Tiwari, A.; Chellappa, V.; Drewnowski, J. Design and analysis of Artificial Neural Network (ANN) models for achieving self-sustainability in sanitation. Appl. Sci. 2022, 12, 3384. [Google Scholar] [CrossRef]
- Abdolrasol, M.G.; Hussain, S.M.; Ustun, T.S.; Sarker, M.R.; Hannan, M.A.; Mohamed, R.; Ali, J.A.; Mekhilef, S.; Milad, A. Artificial Neural Networks based optimization techniques: A Review. Electronics 2021, 10, 2689. [Google Scholar] [CrossRef]
- Al-Mashraie, M.; Chung, S.H.; Jeon, H.W. Customer switching behavior analysis in the telecommunication industry via push-pull-mooring framework: A machine learning approach. Comput. Ind. Eng. 2020, 144, 106476. [Google Scholar] [CrossRef]
- Kalinić, Z.; Marinković, V.; Kalinić, L.; Liébana-Cabanillas, F. Neural network modeling of consumer satisfaction in Mobile Commerce: An empirical analysis. Expert Syst. Appl. 2021, 175, 114803. [Google Scholar] [CrossRef]
- Ong, A.K.; Prasetyo, Y.T.; Velasco, K.E.; Abad, E.D.; Buencille, A.L.; Estorninos, E.M.; Cahigas, M.M.; Chuenyindee, T.; Persada, S.F.; Nadlifatin, R.; et al. Utilization of random forest classifier and artificial neural network for predicting the acceptance of reopening decommissioned nuclear power plant. Ann. Nucl. Energy 2022, 175, 109188. [Google Scholar] [CrossRef]
- Hair, J.F.; Black, W.C.; Babin, B.J.; Anderson, R.E. Multivariate Data Analysis: A Global Perspective; Pearson Education: Upper Saddle River, NJ, USA, 2010. [Google Scholar]
- Fan, Y.; Chen, J.; Shirkey, G.; John, R.; Wu, S.R.; Park, H.; Shao, C. Applications of structural equation modeling (SEM) in Ecological Studies: An updated review. Ecol. Process. 2016, 5, 19. [Google Scholar] [CrossRef]
- Woody, E. An SEM perspective on evaluating mediation: What every clinical researcher needs to know. J. Exp. Psychopathol. 2011, 2, 210–251. [Google Scholar] [CrossRef]
- Sarstedt, M.; Hair, J.F.; Cheah, J.-H.; Becker, J.-M.; Ringle, C.M. How to specify, estimate, and validate higher-order constructs in PLS-SEM. Australas. Mark. J. 2019, 27, 197–211. [Google Scholar] [CrossRef]
- Ong, A.K.; Chuenyindee, T.; Prasetyo, Y.T.; Nadlifatin, R.; Persada, S.F.; Gumasing, M.J.J.; German, J.D.; Robas, K.P.; Young, M.N.; Sittiwatethanasiri, T. Utilization of random forest and deep learning neural network for predicting factors affecting perceived usability of a COVID-19 contact tracing mobile application in Thailand “Thaichana”. Int. J. Environ. Res. Public Health 2022, 19, 6111. [Google Scholar] [CrossRef] [PubMed]
- Yidana, M.B.; Arthur, F.; Kaku, D.W.; Partey, P.A. Predictors of economics students’ behavioural intention to use tablets: A two-staged structural equation modelling–artificial neural network approach. Mob. Inf. Syst. 2023, 2023, 9629405. [Google Scholar] [CrossRef]
- Huang, J.-C. Exploring the acceptance of telecare among senior citizens: An application of back-propagation network. Telemed. e-Health 2011, 17, 111–117. [Google Scholar] [CrossRef] [PubMed]
- Talwar, S.; Srivastava, S.; Sakashita, M.; Islam, N.; Dhir, A. Personality and travel intentions during and after the COVID-19 pandemic: An Artificial Neural Network (ANN) approach. J. Bus. Res. 2022, 142, 400–411. [Google Scholar] [CrossRef]
- Hadhri, S.; Hadiji, M.; Labidi, W. A voting ensemble classifier for stress detection. J. Inf. Telecommun. 2024, 1–18. [Google Scholar] [CrossRef]
- Chatterjee, S.; Byun, Y.-C. Voting ensemble approach for enhancing alzheimer’s disease classification. Sensors 2022, 22, 7661. [Google Scholar] [CrossRef] [PubMed]
- Garoosiha, H.; Ahmadi, J.; Bayat, H. The assessment of Levenberg–Marquardt and bayesian framework training algorithm for prediction of concrete shrinkage by the Artificial Neural Network. Cogent Eng. 2019, 6, 1609179. [Google Scholar] [CrossRef]
- Roy, R.B.; Rokonuzzaman; Amin, N.; Mishu, M.K.; Alahakoon, S.; Rahman, S.; Mithulananthan, N.; Rahman, K.S.; Shakeri, M.; Pasupuleti, J. A comparative performance analysis of ANN algorithms for MPPT Energy Harvesting in solar PV system. IEEE Access 2021, 9, 102137–102152. [Google Scholar] [CrossRef]
- Jia, X.; Pang, Y.; Huang, B.; Hou, F. Understanding consumers’ continuance intention to watch streams: A value-based continuance intention model. Front. Psychol. 2023, 14, 1073301. [Google Scholar] [CrossRef] [PubMed]
- Camilleri, M.A.; Falzon, L. Understanding motivations to use online streaming services: Integrating the Technology Acceptance Model (TAM) and the Uses and Gratifications Theory (UGT). Span. J. Mark.—ESIC 2020, 25, 217–238. [Google Scholar] [CrossRef]
- Lotz, A.D.; Eklund, O.; Soroka, S. Netflix, library analysis, and Globalization: Rethinking Mass Media Flows. J. Commun. 2022, 72, 511–521. [Google Scholar] [CrossRef]
- Lavorata, L. Influence of retailers’ commitment to sustainable development on store image, Consumer Loyalty and consumer boycotts: Proposal for a model using the theory of planned behavior. J. Retail. Consum. Serv. 2014, 21, 1021–1027. [Google Scholar] [CrossRef]
- Raman, A.; Don, Y. Preservice teachers’ acceptance of learning management software: An application of the UTAUT2 model. Int. Educ. Stud. 2013, 6, 157. [Google Scholar] [CrossRef]
- Zahra, F.; Alexandri, M.B.; Purnomo, M.; Arifianti, R.; Muftiadi, A.; Herawati, T.; Nugroho, D.; Ruslan, B. User behaviour intention using UTAUT2 model: A systematic literature review. Russ. J. Agric. Socio-Econ. Sci. 2019, 92, 265–273. [Google Scholar] [CrossRef]
- Perez-Grajo, J. Netflix Therapy as Healing in the Time of the Pandemic. Philipp. e-J. 2021, 4, 19–26. [Google Scholar]
- Herting, D.C.; Pros, R.C.; Tarrida, A.C. Habit and social influence as determinants of PowerPoint use in Higher Education: A study from a technology acceptance approach. Interact. Learn. Environ. 2020, 31, 497–513. [Google Scholar] [CrossRef]
- Yoo, J.; Lee, J.; Lee, D. A verification of motivations for over-the-top binge and short viewing of audio-visual content. New Rev. Hypermedia Multimed. 2020, 26, 93–122. [Google Scholar] [CrossRef]
- Shah, S.; Mehta, N. Over-the-top (OTT) streaming services: Studying users’ behaviour through the UTAUT model. Manag. Labour Stud. 2022, 48, 531–547. [Google Scholar] [CrossRef]
- Adams, P. Netflix’s Hit “Bandersnatch” Takes Interactive Marketing to New Level. Available online: https://www.marketingdive.com/news/netflixs-hit-bandersnatch-takes-interactive-marketing-to-new-level/545202/ (accessed on 14 April 2024).
- Han, A. “kaleidoscope” Review: Netflix Series’ Time Scramble Offers Mild Confusion More than a Compelling Hook. Available online: https://www.hollywoodreporter.com/tv/tv-reviews/kaleidoscope-netflix-tv-review-1235288236/#! (accessed on 14 April 2024).
- Steiner, E.; Xu, K. Binge-watching motivates change: Uses and gratifications of streaming video viewers challenge traditional TV research. Converg. Int. J. Res. Into New Media Technol. 2018, 26, 82–101. [Google Scholar] [CrossRef]
- Gao, Y.; Li, H.; Luo, Y. An empirical study of wearable technology acceptance in healthcare. Ind. Manag. Data Syst. 2015, 115, 1704–1723. [Google Scholar] [CrossRef]
- Gumasing, M.J.; Prasetyo, Y.T.; Ong, A.K.; Persada, S.F.; Nadlifatin, R. Factors influencing the perceived usability of wearable chair exoskeleton with market segmentation: A structural equation modeling and K-means clustering approach. Int. J. Ind. Ergon. 2023, 93, 103401. [Google Scholar] [CrossRef]
- Shiruru, K. An introduction to artificial neural network. Int. J. Adv. Res. Innov. Ideas Educ. 2016, 1, 27–30. [Google Scholar]
- Gallo, C. Artificial Neural Networks tutorial. Encycl. Inf. Sci. Technol. Third Ed. 2014, 6369–6378. [Google Scholar] [CrossRef]
- Duykuluoglu, A. The Significance of Artificial Neural Networks in Educational Research A Summary of Research and Literature. Technium BioChemMed 2021, 2, 107–116. [Google Scholar]
- Biau, G.; Devroye, L.; Lugosi, G. Consistency of Random Forests and Other Averaging Classifiers. J. Mach. Learn. Res. 2008, 9, 2015–2033. [Google Scholar]
- Ong, A.K.; Prasetyo, Y.T.; Yuduang, N.; Nadlifatin, R.; Persada, S.F.; Robas, K.P.; Chuenyindee, T.; Buaphiban, T. Utilization of random forest classifier and artificial neural network for predicting factors influencing the perceived usability of COVID-19 contact tracing “Morchana” in Thailand. Int. J. Environ. Res. Public Health 2022, 19, 7979. [Google Scholar] [CrossRef] [PubMed]
Disclaimer/Publisher’s Note: The statements, opinions and data contained in all publications are solely those of the individual author(s) and contributor(s) and not of MDPI and/or the editor(s). MDPI and/or the editor(s) disclaim responsibility for any injury to people or property resulting from any ideas, methods, instructions or products referred to in the content. |
© 2024 by the authors. Licensee MDPI, Basel, Switzerland. This article is an open access article distributed under the terms and conditions of the Creative Commons Attribution (CC BY) license (https://creativecommons.org/licenses/by/4.0/).