Article

Deep Learning Based Breast Cancer Detection Using Decision Fusion

by
Doğu Manalı
1,
Hasan Demirel
1 and
Alaa Eleyan
2,*
1
Department of Electrical and Electronic Engineering, Eastern Mediterranean University, Famagusta 99628, Turkey
2
College of Engineering and Technology, American University of the Middle East, Egaila 54200, Kuwait
*
Author to whom correspondence should be addressed.
Computers 2024, 13(11), 294; https://doi.org/10.3390/computers13110294
Submission received: 3 October 2024 / Revised: 9 November 2024 / Accepted: 13 November 2024 / Published: 14 November 2024

Abstract

:
Breast cancer, which has the highest mortality and morbidity rates among diseases affecting women, poses a significant threat to their lives and health. Early diagnosis is crucial for effective treatment. Recent advancements in artificial intelligence have enabled innovative techniques for early breast cancer detection. Convolutional neural networks (CNNs) and support vector machines (SVMs) have been used in computer-aided diagnosis (CAD) systems to identify breast tumors from mammograms. However, existing methods often face challenges in accuracy and reliability across diverse diagnostic scenarios. This paper proposes a three parallel channel artificial intelligence-based system. First, SVM distinguishes between different tumor types using local binary pattern (LBP) features. Second, a pre-trained CNN extracts features, and SVM identifies potential tumors. Third, a newly developed CNN is trained and used to classify mammogram images. Finally, a decision fusion that combines results from the three channels to enhance system performance is implemented using different rules. The proposed decision fusion-based system outperforms state-of-the-art alternatives with an overall accuracy of 99.1% using the product rule.

1. Introduction

Breast cancer was previously a societal taboo and source of embarrassment, leading to infrequent detection and diagnosis. References to breast cancer in literary works beyond medical publications were uncommon. Women’s active engagement and openness regarding illness have emerged as relatively new phenomena, gaining ground in recent decades. In the 1990s, the pink ribbon symbolized a revolution in the fight against this disease [1]. The uncontrolled growth and spread of abnormal cells are the primary causes of tumor formation [2]. This growth often affects the mammary ducts or glands, resulting in the formation of masses or other similar structures in the breast. Cancer cells can settle and proliferate in specific locations within surrounding tissues, growing rapidly. Unlike malignancies in other abdominal organs, breast tumors are often evident on peritoneal biopsy, providing a favorable environment for growth and dissemination [3]. Tumors that have spread beyond their original location and invaded nearby healthy tissue are known as invasive tumors. Breast cancer is the most common cancer type in women. Doctors have been aware of breast cancer since the early 20th century. Due to visible symptoms, especially in later stages, the illness is mentioned in nearly all available historical records [1]. The majority of breast structure is composed of numerous tiny lobes and fat. Each lobe contains numerous alveoli, or cavities. These cavities are surrounded by myoepithelial cells that connect them to the epithelial cells that secrete milk. Milk is drawn from the lobes into tiny, duct-like tubes created by myoepithelial cells. A network of pipes connects these tubes, ending at the nipple. The density, mass, or calcification of a breast on a mammogram is indicated based on the affected area of the breast anatomy. Figure 1 illustrates the breast’s anatomy and malignant tumor. Breast cancer is characterized by excessive cell and cell group proliferation, which can lead to the development of malignant structures. Breast cancer is the most prevalent cancer type in women, affecting females of all ages. According to World Health Organization records, over 2 million women were affected globally in 2020, accounting for 25% of all cancer cases in females. While women can also develop ovarian and cervical cancer, breast cancer remains a significant cause of cancer-related deaths [4]. Routine screening is recommended for women above a certain age, as early detection and treatment significantly improve the survival rates. To ensure prompt detection, it is crucial to be aware of common symptoms and undergo regular mammograms.
The early detection of breast cancer is crucial for improving patient outcomes. Prioritizing disease prevention measures and leveraging modern technologies, such as machine learning, can significantly increase the chances of early diagnosis [5,6,7,8]. Support vector machine (SVM) is a well-known machine learning algorithm used for classification and regression analysis [9]. SVMs identify the optimal hyperplane to separate different classes of data points in a feature space. Deep learning, a subset of machine learning that utilizes multi-layer neural networks, has been a driving force behind the diagnosis advancements [10]. With the rise in CNN deep learning model architectures since 2012, in addition to emerging advanced computational resources such as GPUs and TPUs during the past decade, several methods have been proposed for the classification of tumors based on the fine-tuning of existing state-of-the-art CNN models such as ResNets and VGG16, which have already been found to be successful for various computer vision tasks [11,12,13,14].
Deep learning algorithms have been extensively used for breast cancer prediction on various medical datasets, demonstrating promising accuracy [15,16,17,18,19]. Khourdifi et al. [20] compared four machine learning algorithms (SVM, random forest (RF), naive Bayes, and k-nearest neighbors) on the Wisconsin Breast Cancer Dataset (WBCD). Using the Weka tool, SVM was found to be the most effective and efficient. Bah and Davud [21] compared RF, SVM, k-NN, and CNN on the breast cancer dataset where CNN outperformed the other methods in terms of accuracy. Mahmud et al. [22], on the other hand, used pre-trained deep transfer learning models (ResNet50, ResNet101, VGG16, and VGG19) to diagnose breast cancer from histopathology images. ResNet50 achieved the best performance with a 90.2% accuracy rate. Amgad et al. [23] employed deep learning approaches to diagnose breast cancer from biopsy images. DenseNet169, ResNet50, and ResNet101 achieved the highest accuracy without preprocessing. Ensemble learning further improved the performance to 92.5%. Jaffer [24] developed a novel model using CNN and SVM to automatically detect cancer in mammograms. The model achieved 93% accuracy on the Digital Database for Screening Mammography (DDSM) dataset, outperforming existing methods. Liu et al. [25] utilized a CNN to analyze and identify breast cancer in T1 DCE-MRI images from a cohort of 438 patients that included 131 participants from the I-SPY clinical trials and 307 from Columbia University. This work considered normally excluded image features including background enhancement of the parenchyma, slice images of the breast MRI as well as involvement of the axilla/axillary lymph nodes. These considerations increased efficiency, decreased subjective bias, and allowed for a thorough evaluation of the entire image. The use of multi-institutional images from multiple time points increased the generalizability of the algorithm. Their model showed an AUC of 92.0% and 94.0% accuracy.
The chosen classifiers were CNN, ResNet50 + SVM, and LBP + SVM, since their effectiveness has been widely demonstrated and have particular benefits that will help to optimize the objectives within the scope of this study. CNNs are highly regarded for their strength in image classification, offering a strong baseline through hierarchical feature learning; this is important for extracting useful features from images. ResNet50 uses residual connections to alleviate the vanishing gradient problem, which allows for the training of much deeper networks with better feature extraction and performance. Combined with SVM, the approach improves classification accuracy in high-dimensional data scenarios. LBP is very effective at capturing local texture features, making it very applicable in scenarios where lighting can be a source of variation in the quality of image data. Along with SVM, it provides the basis for a very lightweight and efficient classification mechanism. This selection not only guarantees high accuracy, but also optimizes resources on computational use and training times, making these models very appropriate for real-time applications. In contrast, architectures as complex as EfficientNet and DenseNet require much more computation, time, and memory which may not be suitable where quick inference and efficiency matters. Therefore, CNN, ResNet50 + SVM, and LBP + SVM as a combination will represent a strategic choice that balances between performance and practicality according to what the study may require for its needs.
This study evaluated the effectiveness of CNNs alone and in combination with SVMs for mammogram image classification. The proposed framework employs three classification channels:
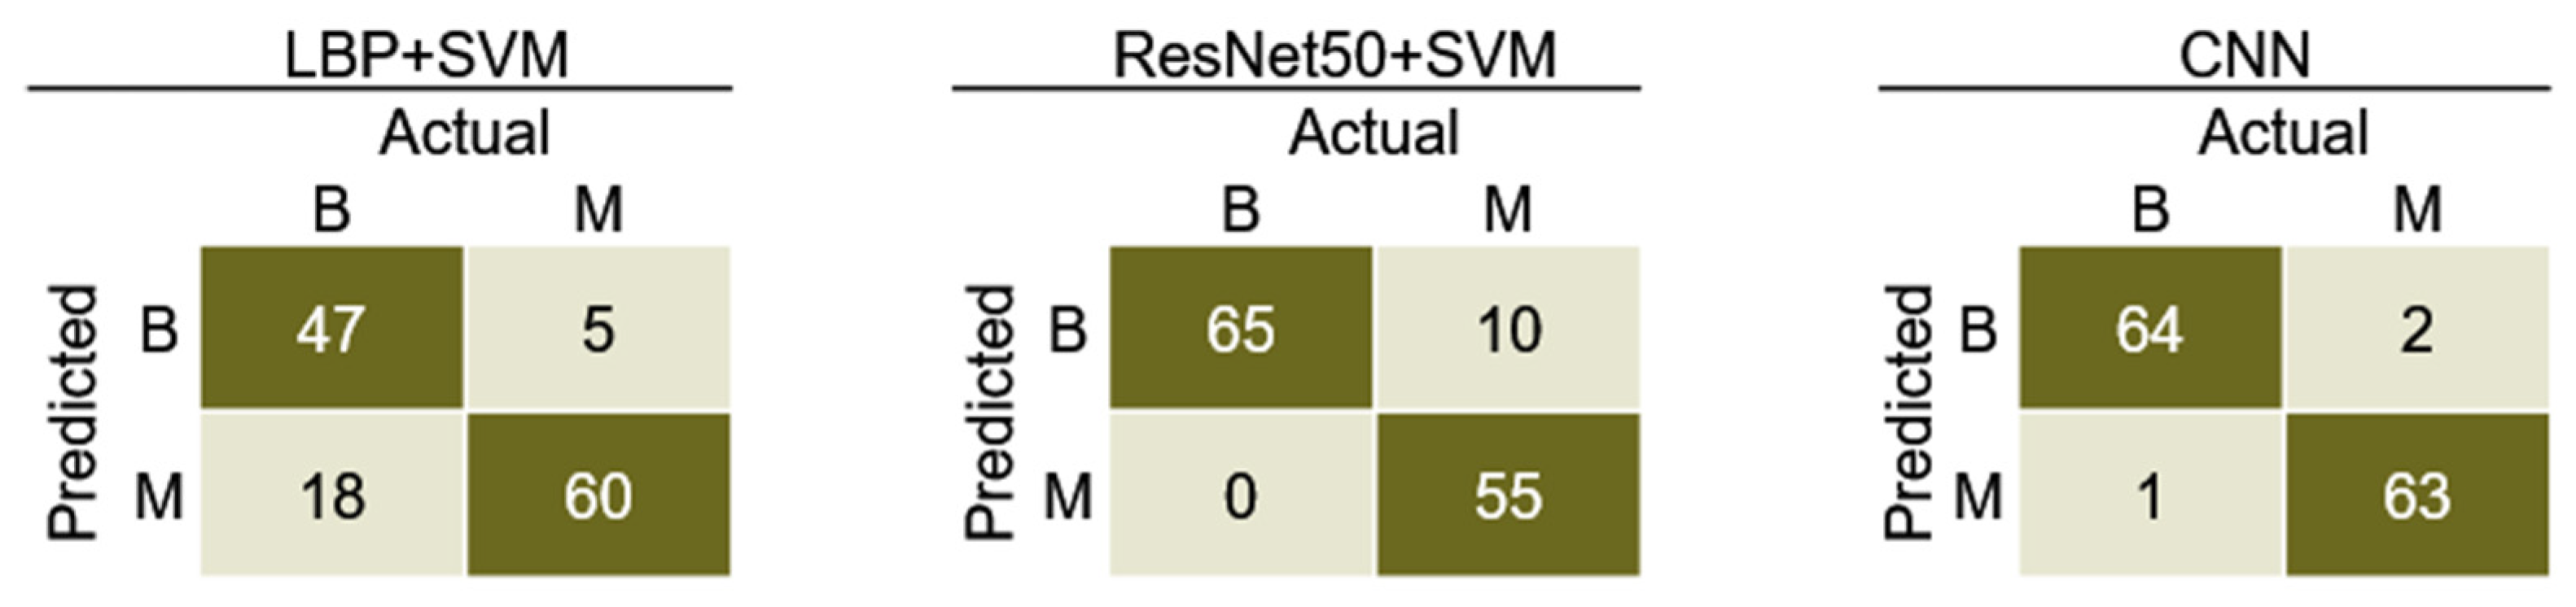
  • Dedicated CNN architecture: A custom CNN architecture, trained on the subset of the DDSM dataset, is used for direct classification.
  • SVM with ResNet50 features: SVM is applied to features extracted from a pre-trained ResNet50 CNN model.
  • SVM with LBP features: SVM is used with local binary pattern (LBP) features for classification.
Decision fusion is a more suitable approach in this context compared to combining texture and shape features. This is because combining these features can increase the complexity of feature extraction, making it harder to capture the full variability of the dataset. Additionally, the resulting high-dimensional feature space can lead to overfitting. Each classification model has inherent limitations. Decision fusion can help mitigate these limitations and leverage the strengths of individual models. By combining CNN and SVM, we aimed to improve the precision and robustness of the mammography image classification system. The proposed ensemble approach enhances the overall classification performance, as measured by accuracy and F1-score.This study’s primary contribution is the development of a novel ensemble-based CAD system that integrates CNN and SVM for early breast cancer diagnosis, outperforming state-of-the-art methods.
The remainder of this paper is organized as follows. Section 2 presents the details of the proposed experimental procedure including information on the dataset, software and hardware platform, decision fusion methods, and hyper-parameters for the system architecture. Section 3 discusses the results and evaluation of the proposed framework based on the experimental findings and comparisons with alternative studies reported in the literature. Finally, the last section elaborates the conclusions and potential future directions.

2. Materials and Methods

2.1. Dataset

Machine learning algorithms require substantial amounts of sampled and labeled data for training. Data acquired from mammography imaging for breast cancer are a primary source of sampled data for the proposed deep learning model. Several well-known mammography datasets can be adopted for implementing and testing various deep learning algorithms. The Digital Database for Screening Mammography (DDSM) is provided by the Department of Radiology at the University of South Florida [26]. The DDSM is a representative resource of mammograms in a digitally archived format with metadata, annotations, and ground truth labels indicating the category or outcome of each image (i.e., whether an image is benign or malignant). In this study, the Curated Breast Imaging Subset DDSM dataset was used, comprising images from screening and diagnostic procedures representing various breast abnormalities [27]. The dataset was divided into a training subset and a test subset for unbiased evaluation. It also used a validation split for performance assessment during training, showing how well the model will generalize on unseen data. This process helps with hyper-parameter tuning and model optimization to reduce the overfitting risk, where the models learn patterns in the training data as opposed to generalizable features. Furthermore, keeping an equal number of images from each class in the training, validation, and test splits will support balanced learning. This subset contained 434 grayscale images in total, divided into two categories: benign and malignant. Each category had 217 images. Figure 2 shows samples of the mammogram images from both classes in the dataset.

2.2. Software Platform

MATLAB was selected as the preferred software tool for developing the breast cancer detection model based on its efficiency, ease of use, and extensive library of tools. After evaluating various options, MATLAB emerged as the most suitable choice for implementing the SVM-based machine learning algorithms and CNN-based deep learning algorithms. Key factors considered during the selection process included the simplicity of the programming language, availability of relevant toolboxes and libraries, and compatibility with the available hardware resources. Compared to Python, MATLAB also has better support for matrix and linear algebra operations through built-in functions, which are used extensively in machine learning and deep learning applications. This support enables optimized performance and more a straightforward handling of data structures, which are essential for image-based modeling tasks [28]. MATLAB Release 2022 with the necessary toolboxes was installed on a hardware platform equipped with an NVIDIA GTX 1660i GPU with 8 GB of VRAM and 16 GB of RAM to support the computational demands of the proposed models.

2.3. Decision Fusion

Decision fusion is a powerful technique that improves the classification accuracy by combining the outputs of multiple models or methods. In the context of breast cancer diagnosis, it integrates the probability scores from various models to provide a unified decision regarding whether a mammogram image is benign, malignant, or non-cancerous. The three common decision fusion methods employed in this study were:
  • Sum rule: The probabilities from each model are simply added together.
  • Product rule: The probabilities are multiplied together.
  • Majority voting: The class with the highest number of votes from the individual models is selected.
The mathematical formulations for these methods are presented in Equations (1)–(3).
Sum   Rule :   P c = 1 N i = 1 N P i
Product   Rule :   P c = i = 1 N P i
Majority   Voting : P c = a r g m a x j ( i = 1 N I ( v i = c j ) )
where
  • P c : Combined probability for each class;
  • N : The number of classifiers;
  • P i : The probability assigned by the ith classifier for a particular class;
  • v i : The predicted class by the ith classifier;
  • c j : Each of the possible classes;
  • I ( . ) : The indicator function;
  • a r g m a x j : Returns the class index j that maximizes the sum.

2.4. Proposed Breast Cancer Detection System

To ensure optimal performance, the images underwent preprocessing to enhance their quality and consistency. This involved resizing the images to 224 × 224 pixels to match the input requirements of the ResNet50 model [29]. Manually cropping out irrelevant regions to reduce noise and improve efficiency was chosen over automated cropping to ensure precise attention to detail, especially in cases where the boundaries between relevant and irrelevant areas were not well-defined. This preprocessing improved the dataset efficiency and relevance, thereby enhancing the model performance.
Three classification channels were utilized after image preprocessing:
  • Pre-trained ResNet50: The final classification layer of ResNet50 was removed, and the extracted feature vector after flattening was used by an SVM classifier.
  • SVM with LBP features: LBP feature vectors were used by an SVM classifier.
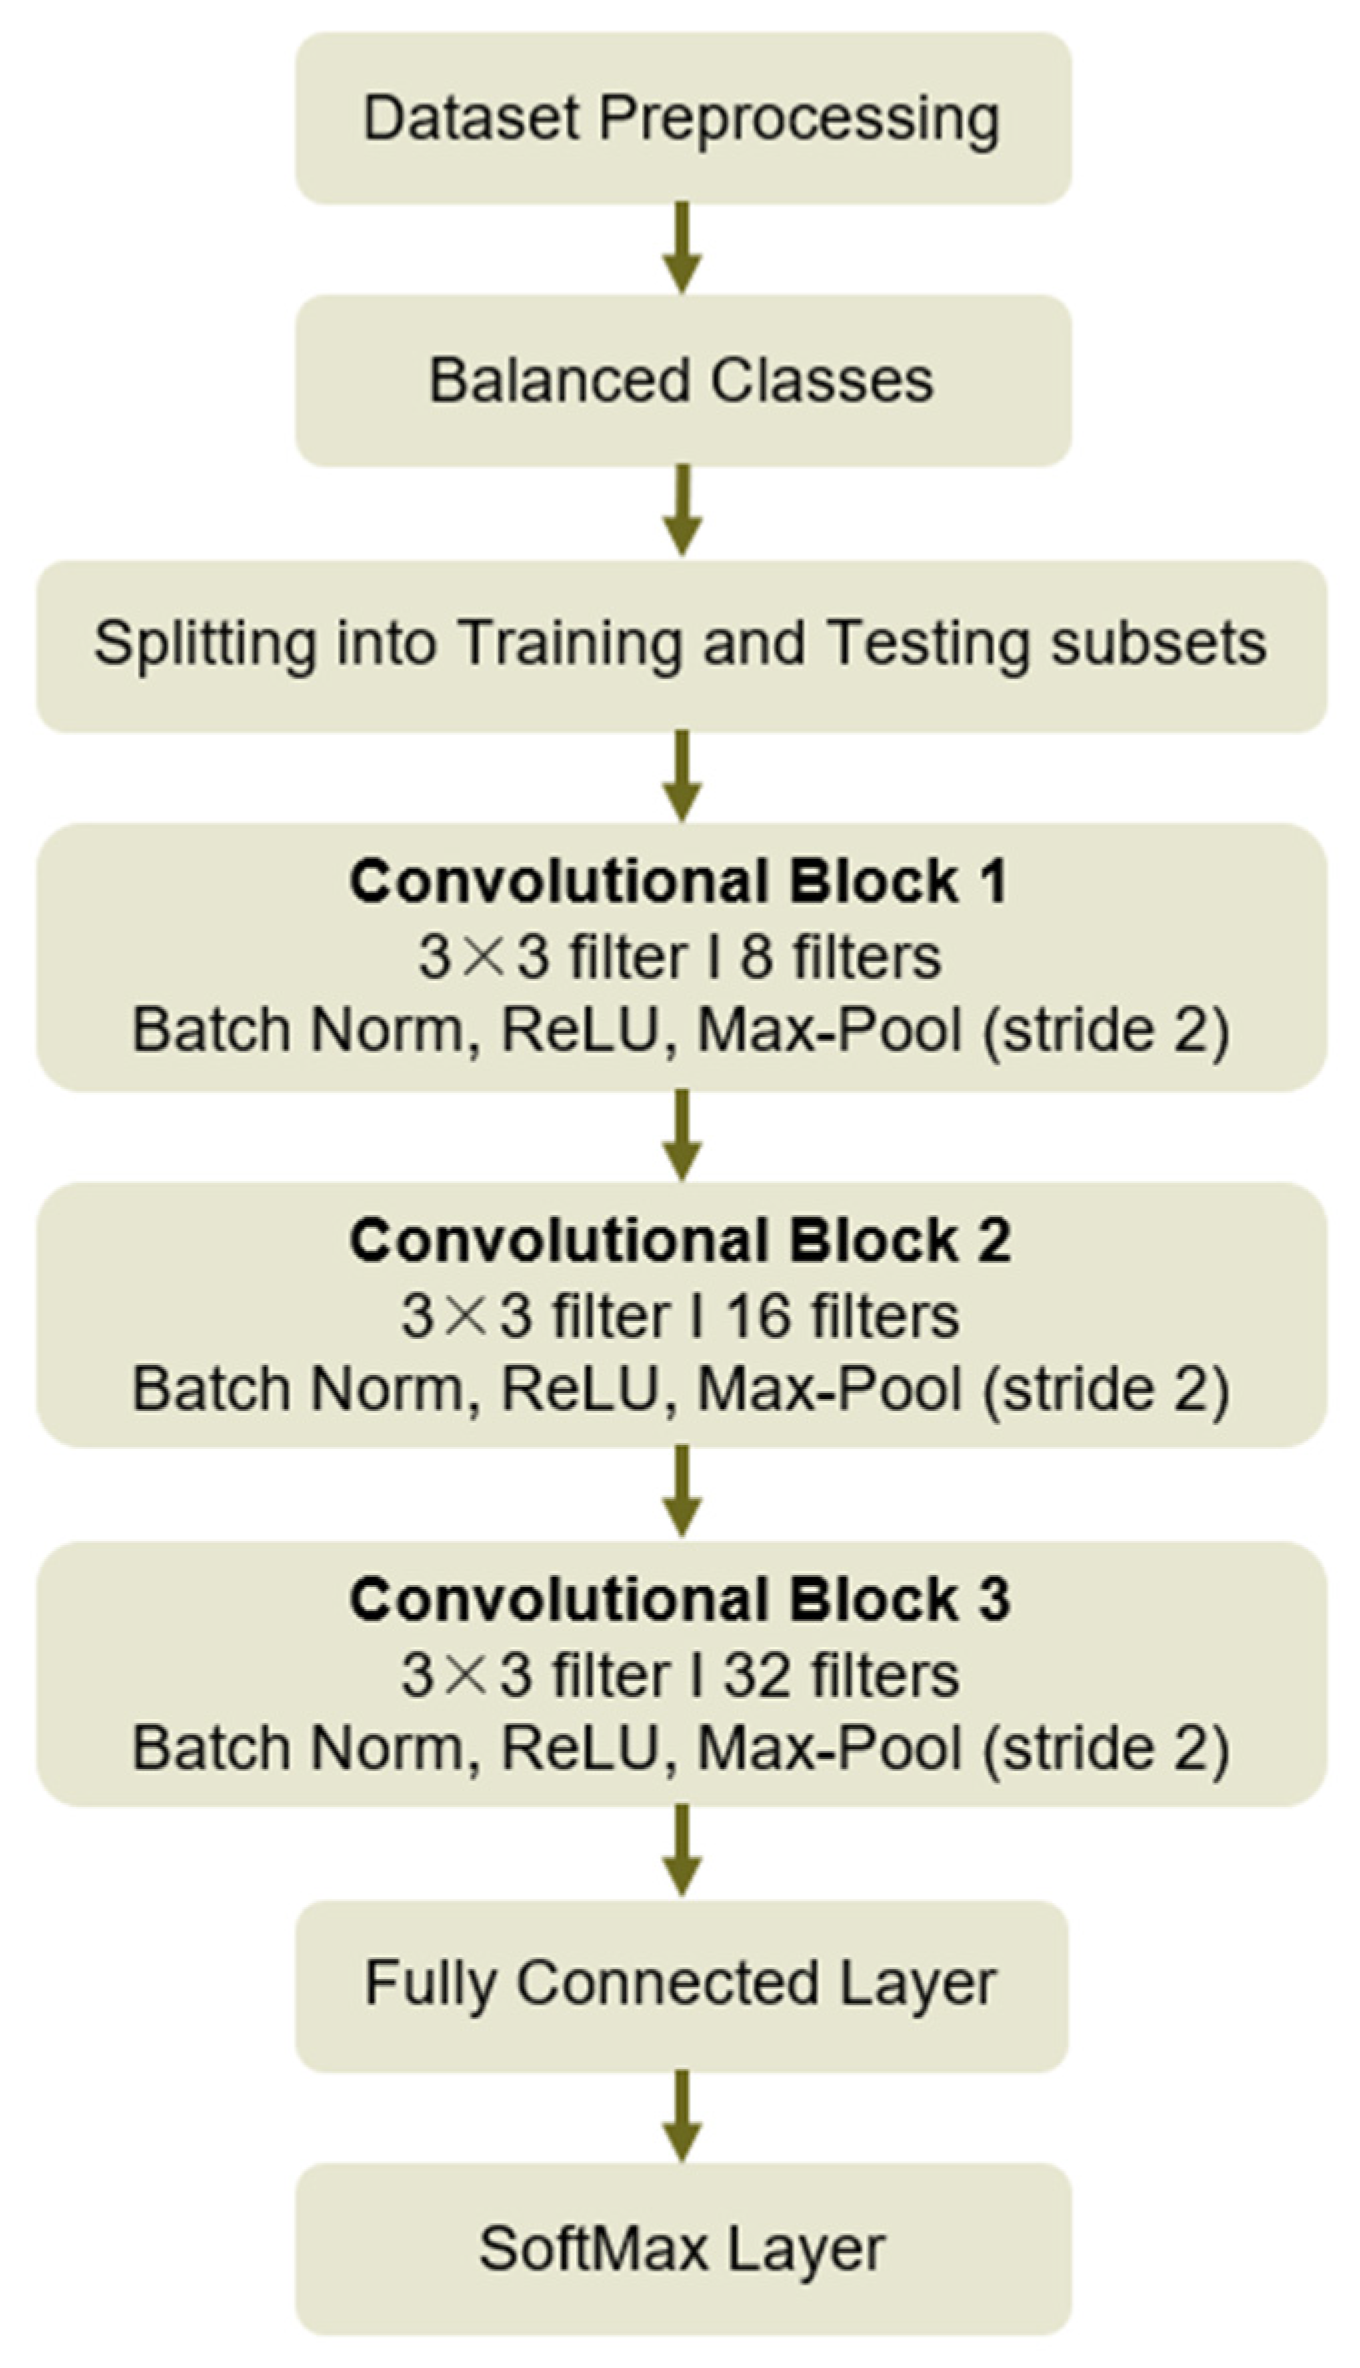
  • Dedicated CNN architecture: A custom CNN architecture with three convolutional layers was used.
The probability-based decisions from these three channels were combined using the sum rule, product rule, and majority voting decision fusion techniques to generate a unified overall decision. Figure 3 illustrates the proposed breast cancer detection pipeline.
It is important to note that the adopted database offers balanced classes, ensuring an equal number of samples in each category. This helps mitigate overfitting. In the supervised learning process, the dataset is partitioned into two subsets: a training set and a testing set. A specialized CNN architecture was developed in MATLAB using its deep learning toolbox and layer graph API that consisted of several layers. Three convolutional blocks were used. Each block applies a 3 × 3 filter, with increasing number of filters (8, 16, and 32, respectively), followed by batch normalization to stabilize training. The network is then able to learn intricate patterns by introducing nonlinearity through the activation function. Next, downsampling is carried out while maintaining the spatial hierarchies by applying max-pooling with a stride of 2. Following these blocks is a single fully connected layer that connects the output classes to the learned features. A SoftMax output layer classifies the samples into their appropriate categories to achieve the final classification. In this study, we explored various components of CNN architecture to improve the model performance by systematically adjusting the structural and training parameters. The major items considered were network structure, learning rate, number of epochs, and configurations of the convolutional and pooling layers in order to observe how these changes would affect accuracy and computational efficiency.
The optimized architecture consisted of a sequential arrangement of convolutional layers, batch normalization, and activation functions, interleaved with pooling layers, and concluded with fully connected and classification layers. For training, hyperparameters were finetuned to enhance stability and accuracy including a reduced learning rate, a limited number of epochs, and frequent validation intervals. This configuration achieved a good balance between accuracy and computational efficiency, which definitely shows the importance of adjusting the architectural and training parameters in optimizing CNNs. Figure 4 shows details of the developed CNN model architecture.

2.4.1. CNN Architecture

In the context of the described CNN architecture, several important mathematical formulas can help us understand how different operations are performed. Below are the key formulas, from Equations (4) to (11), associated with the convolutional layers, pooling layers, batch normalization, and the final classification [30,31,32,33,34,35,36].
  • Convolution Operation
The convolution operation applies a filter (kernel) to the input image. For a single output pixel, the operation can be defined as:
Y i , j = m   n   X i + m , j + n K m , n
where Y ( i , j ) is the output pixel value at position ( i , j ) . X ( i + m , j + n ) is the input pixel value at position ( i + m , j + n ). K ( m , n ) represents the filter (kernel) value at position ( m , n ) . The sums are taken over the dimensions of the kernel.
  • Output Size Calculation
For a convolutional layer, the output size can be calculated using:
Output   Size = Input   Size Filter   Size + 2 Padding Stride + 1
  • Max-Pooling Operation
Max-pooling reduces the spatial dimensions of the input by taking the maximum value in each window. The operation can be represented as:
Y i , j = m a x m , n   X S i + m , S j + n
where S i and S j represent the starting indices for the pooling operation, determined by the stride. The maximum is taken over the pooling window.
  • Batch Normalization
Batch normalization normalizes the output of the previous layer using the mean and variance:
X ^ = X μ σ 2 + ϵ
where X ^ is the normalized output. X is the input to the batch normalization layer. μ is the mean of the mini-batch. σ 2 is the variance of the mini-batch. ϵ is a small constant to prevent division by zero. The output is then scaled and shifted:
Y = γ X ^ + β                                
where γ and β are the learned parameters for scaling and shifting, respectively.
  • Fully Connected Layer
The output Y of a fully connected layer can be calculated using the following formula:
Y = σ W x + b
Here, x represents the input vector. W is the weight matrix of the fully connected layer, with dimensions. b is the bias vector, with dimensions equal to the number of neurons in the layer. σ is an activation function applied element-wise to the resulting vector.
  • SoftMax Function
The SoftMax function is used for multi-class classification, transforming raw output scores into probabilities:
P y i = e z i j     e z j
P y i is the probability of class i . z i is the output score for class i . The denominator sums over all classes.
  • Cross-Entropy Loss
The loss function L for training the model can be defined as cross-entropy loss, which measures the difference between predicted and true distributions:
L = i   y i log P y i
where y i is the true label (1 for the correct class, 0 otherwise).

2.4.2. Ablation Study

After defining the network layers for the developed CNN model, we performed an ablation study comparing different combinations of activation functions and optimizers in terms of performance metrics. Table 1 shows two activation functions: ReLU and LeakyReLU. The optimizers used were SGD (stochastic gradient descent) and Adam, which are among the most common optimizers in machine learning. Each row presents a unique combination of these activation functions and optimizers. The best accuracy was with ReLU + SGD (97.7%), followed closely by LeakyReLU + Adam (96.1%). Moreover, ReLU + SGD had the highest sensitivity (98.5%), suggesting that it is very effective at finding all positives. Finally, for F1-score, which balances precision and sensitivity, ReLU + SGD also scored the highest here (97.7%), followed by LeakyReLU + Adam (96.2%). On the other hand, LeakyReLU with the Adam optimizer stood out for its high specificity and precision, which may be more desirable for applications where avoiding false positives is crucial. In conclusion, the results show that the ReLU activation function with SGD optimizer achieved the best overall performance, with the highest scores in accuracy, sensitivity, and F1-score, indicating that this configuration had a balanced and effective model performance.
Based on the performed ablation study, all training parameters were configured as shown in Table 2. These parameters, aside from selecting an optimizer and activation function based on ablation study, included specifying parameters such as the mini-batch size, number of epochs, initial learning rate, data shuffling, validation data, and plotting preferences. These settings guide the training process, enabling effective model optimization.
To prevent overfitting, the training data were randomly shuffled before the start of each subsequent epoch (epoch shuffling). The learning rate and validation frequency were also determined. Validation frequency affects how often the system is evaluated during training, while the learning rate influences the time of convergence.
The second classification channel is powered by ResNET50 and SVM. A pre-trained ResNet-50 convolutional neural network is initially trained up to the final classification layer (i.e., layer FC100) with a batch size of 32. The flattened feature vectors are then extracted for SVM training. To accelerate the training with high-dimensional CNN feature vectors, a fast stochastic gradient descent (SGD) solver is employed by setting the ‘Learners’ parameter of the fitcecoc function to ‘Linear’. The fitcecoc function is used for multiclass classification using error-correcting output codes, enabling the model to handle multiple classes effectively. By using linear learners in conjunction with the efficient SGD optimization algorithm, which updates model parameters iteratively based on randomly selected subsets of data, training is significantly accelerated. This combination enhances the speed and effectiveness of processing large feature sets derived from CNN. The SVM classifier takes the 512-dimensional input vectors extracted from ResNet50 and outputs a binary classification (benign or malignant classes).
In the final classification channel, an SVM classifier is trained using features extracted by the LBP method. LBP is a texture analysis method that converts an image into binary patterns with which the textures can be captured in local regions. Specifically, LBP works by dividing the image into small, non-overlapping regions and comparing each pixel with its surrounding neighbors. If the central pixel has a higher intensity than a neighboring one, surround it with 1; otherwise, 0. These binary values are then combined to form an LBP code that represents the local texture pattern. It then implements an effective SGD solver to reduce the training time. The SGD solver incrementally updates the SVM model parameters by going through a subset of the training samples, in contrast to going through the whole dataset at once. In this way, this incremental approach leads to faster convergence compared to traditional solvers, which usually need more time since they go through the whole training set at every iteration. Finally, the decisions from multiple channels are combined using decision fusion rules.

3. Results and Discussion

The proposed framework was first evaluated for each model separately for various training and testing ratios. This comprehensive evaluation assessed the framework’s effectiveness and provides insight into its performance when diagnosing patients. Each method was subjected to fivefold cross-validation to minimize the result variability. The following tables compare the three models (LBP + SVM, ResNet50 + SVM, and CNN) in terms of five performance metrics: sensitivity, specificity, precision, F1-score, and accuracy. These metrics were evaluated under three different dataset splits: 30% for training and 70% for testing (Table 3), 50% for training and 50% for testing (Table 4), and 70% for training and 30% for testing (Table 5).
The CNN model consistently delivered the best results in terms of sensitivity, precision, and accuracy, making it the most robust model across various training/testing splits. The ResNet50 + SVM model also performed well, particularly in minimizing false positives, but was slightly less sensitive than the CNN. The LBP + SVM model, while showing some improvements with more training data, did not perform as well as the deep learning models. ResNet50 + SVM tends to have higher specificity, but sometimes at the cost of sensitivity, especially with smaller training datasets. As the size of the training dataset increased, all models improved, but CNN demonstrated the most significant performance gains among them.
Figure 5 and Figure 6 illustrate the confusion matrices and receiver operating characteristic (ROC) curves for the 70% training, 30% testing dataset split. Benign represents positive samples and malignant represents negative samples. The same as the observed results in Table 4, the CNN model showcased the best performance overall, combining high sensitivity and specificity. The ResNet50 + SVM model, while perfect in sensitivity, showed a higher number of false positives. LBP + SVM lagged behind in sensitivity but maintained decent specificity.
Based on the ROC curves in Figure 6, CNN exhibited the highest area under the curve, indicating superior classification performance compared to the other methods. Individual classification results were obtained and combined using various fusion rules to enhance accuracy. These rules included the product rule (multiplying probabilities), the sum rule (adding confidence scores), and the majority vote rule (considering multiple predictions). To ensure balanced contributions, an average fusion was also implemented. These fusion techniques aim to improve robustness and leverage the strengths of different classifiers. The combined prediction results provide a more comprehensive and reliable classification outcome. Table 6 presents the performances using different decision fusion rules with a 70% training, 30% testing split.
The table compares three decision fusion rules (sum rule, product rule, and majority voting) across five performance metrics. The product rule consistently outperformed the others, achieving the highest scores in specificity (99.4%), precision (99.7%), F1-score (99.4%), and accuracy (99.1%). This makes it highly effective at minimizing both false positives and false negatives, offering a well-rounded performance. The sum rule showed a good balance with strong sensitivity (98.3%) and F1-score (98.7%), but slightly lagged in precision (98.5%) and accuracy (98.5%) compared to the product rule. Majority voting, while still performing well, had the lowest sensitivity (98.1%) and precision (98.2%), but its F1-score (99.1%) was competitive. Overall, the product rule emerged as the most reliable decision fusion approach, particularly in contexts where high precision and accuracy are paramount due to its effectiveness in downweighting uncertain or contradictory predictions while better leveraging the probabilistic outputs of individual classifiers.
Table 7 compares the accuracy results from various studies using different models and datasets to classify breast cancer. The accuracy metric was used to evaluate the relative performance of these methods. The SVM model in [16] on the WDBC dataset achieved the highest accuracy of 97.9%, which was outperformed by the product rule accuracy from our decision fusion-based approach results (99.1%). The researchers in [17] who used the CNN model on the breast cancer dataset had a lower accuracy of 89%, and using ResNet50 on breast histopathology images achieved 90.2% in [18]. When comparing against these studies, our product rule decision fusion approach showed superior accuracy, particularly in comparison to other models like CNNs and ensemble techniques, which performed slightly lower, with accuracies ranging between 85% and 90.2%. This indicates that our decision fusion-based approach, particularly with the product rule, offers a competitive and robust solution for breast cancer classification.

4. Conclusions

The early detection of breast cancer is crucial for women’s health. This work proposes a user-friendly, fusion-based method to aid radiologists in efficiently diagnosing breast cancer. The proposed approach utilizes a three parallel channel framework. First, the SVM uses local binary pattern (LBP) features to distinguish between different tumor types. Second, a pre-trained CNN (ResNet50) extracts features for a standard SVM classifier to identify potential tumors. Third, a newly developed and trained convolutional neural network (CNN) classifies mammogram images. Finally, decision fusion using different rules combines the decisions from all three channels to improve the overall accuracy. Compared to individual classifiers, the proposed framework demonstrated significant improvements in classification performance. This robustness was further reinforced by surpassing the accuracy of previous methods in this field. The system achieved an impressive overall accuracy of 99.1%, outperforming current alternatives. Therefore, this approach has the potential to streamline diagnosis and enhance patient care.
Future research could significantly enhance predictive models by incorporating a trainable decision fusion layer. This layer would adaptively combine decisions from different component models, optimizing the decision-making process. Additionally, alternative deep learning architectures such as transformers and diffusion models as well as different datasets can be explored for breast cancer classification.

Author Contributions

Conceptualization, D.M. and H.D.; Methodology, D.M. and H.D.; Software, D.M. and H.D.; Validation, D.M., H.D. and A.E.; Formal analysis, D.M., H.D. and A.E.; Investigation, D.M., H.D. and A.E.; Resources, H.D. and A.E.; Data curation, D.M.; Writing—original draft preparation, D.M., H.D. and A.E.; Writing—review and editing, D.M., H.D. and A.E.; Visualization, D.M., and A.E.; Supervision, H.D. and A.E.; Project administration, H.D. and A.E.; Funding acquisition, A.E. All authors have read and agreed to the published version of the manuscript.

Funding

This research received no external funding.

Institutional Review Board Statement

Ethical review and approval were waived based on the ethical guidelines of Eastern Mediterranean University, https://bayek.emu.edu.tr/en/regulations (accessed on 12 June 2024), since the research involved the use of the publicly available Curated Breast Imaging Subset DDSM dataset with the collection of data that contained only non-identifiable data about human beings.

Informed Consent Statement

The study received a waiver of written patient consent, as all cases were anonymized, and personal identifying information was removed.

Data Availability Statement

The data used in this study from the Curated Breast Imaging Subset DDSM Dataset (Mammography) are openly available at https://www.kaggle.com/datasets/awsaf49/cbis-ddsm-breast-cancer-image-dataset (accessed on 12 June 2024).

Conflicts of Interest

The authors declare no conflicts of interest.

References

  1. American College of Obstetricians and Gynecologists. Breast cancer risk assessment and screening in average-risk women. Pract. Bull. 2017, 130, 1–16. [Google Scholar] [CrossRef]
  2. Lakhtakia, R. A Brief History of Breast Cancer: Part I: Surgical domination reinvented. Sultan Qaboos Univ. Med. J. 2014, 14, e166–e169. [Google Scholar] [PubMed]
  3. Breast Cancer. Available online: https://www.who.int/news-room/fact-sheets/detail/breast-cancer (accessed on 2 October 2024).
  4. Sung, H.; Ferlay, J.; Siegel, R.L.; Laversanne, M.; Soerjomataram, I.; Jemal, A.; Bray, F. Global cancer statistics 2020: Globocan estimates of incidence and mortality worldwide for 36 cancers in 185 countries. CA A Cancer J. Clin. 2021, 71, 209–249. [Google Scholar] [CrossRef] [PubMed]
  5. Hossain, A.; Islam, M.T.; Islam, M.T.; Chowdhury, M.E.H.; Rmili, H.; Samsuzzaman, M. A Planar Ultrawideband Patch Antenna Array for Microwave Breast Tumor Detection. Materials 2020, 13, 4918. [Google Scholar] [CrossRef]
  6. Ara, S.; Das, A.; Dey, A. Malignant and Benign Breast Cancer Classification using Machine Learning Algorithms. In Proceedings of the 2021 International Conference on Artificial Intelligence (ICAI), Islamabad, Pakistan, 5–7 April 2021; pp. 97–101. [Google Scholar] [CrossRef]
  7. Naseem, U.; Rashid, J.; Ali, L.; Kim, J.; Ul Haq, Q.E.; Awan, M.J.; And Imran, M. An Automatic Detection of Breast Cancer Diagnosis and Prognosis Based on Machine Learning Using Ensemble of Classifiers. IEEE Access 2022, 10, 78242–78252. [Google Scholar] [CrossRef]
  8. Eleyan, A. Breast cancer classification using moments. In Proceedings of the 2012 20th Signal Processing and Communications Applications Conference (SIU), Mugla, Turkey, 18–20 April 2012; pp. 1–4. [Google Scholar] [CrossRef]
  9. Amin, S.A.; Al Shanabari, H.; Iqbal, R.; Karyotis, C. An Intelligent Framework for Automatic Breast Cancer Classification Using Novel Feature Extraction and Machine Learning Techniques. J. Signal Process. Syst. 2023, 95, 293–303. [Google Scholar] [CrossRef]
  10. Alzubaidi, L.; Zhang, J.; Humaidi, A.J.; Al-Dujaili, A.; Duan, Y.; Al-Shamma, O.; Santamaría, J.; Fadhel, M.A.; Al-Amidie, M.; Farhan, L. Review of deep learning: Concepts, CNN architectures, challenges, applications, future directions. J. Big Data 2021, 8, 53. [Google Scholar] [CrossRef]
  11. Papageorgiou, V. Brain Tumor Detection Based on Features Extracted and Classified Using a Low-Complexity Neural Network. Trait. Du Signal 2021, 38, 547–554. [Google Scholar] [CrossRef]
  12. Koti, M.S.; Nagashree, B.A.; Geetha, V.; Shreyas, K.P.; Mathivanan, S.K.; Dalu, G.T. Lung cancer diagnosis based on weighted convolutional neural network using gene data expression. Sci. Rep. 2024, 14, 3656. [Google Scholar]
  13. Eleyan, A.; Bayram, F.; Eleyan, G. Spectrogram-Based Arrhythmia Classification Using Three-Channel Deep Learning Model with Feature Fusion. Appl. Sci. 2024, 14, 9936. [Google Scholar] [CrossRef]
  14. Hasan, M.Z.; Ahamed, M.S.; Rakshit, A.; Hasan, K.Z. Recognition of jute diseases by leaf image classification using convolutional neural network. In Proceedings of the 2019 10th International Conference on Computing, Communication and Networking Technologies (ICCCNT), Kanpur, India, 6–8 July 2019; IEEE: Piscataway, NJ, USA, 2019; pp. 1–5. [Google Scholar]
  15. Papageorgiou, V.E.; Dogoulis, P.; Papageorgiou, D.P. A convolutional neural network of low complexity for tumor anomaly detection. In Proceedings of the International Congress on Information and Communication Technology, London, UK, 20–23 February 2023; Springer Nature: Singapore, 2023; pp. 973–983. [Google Scholar]
  16. Shrestha, A.; Mahmood, A. Review of deep learning algorithms and architectures. IEEE Access 2019, 7, 53040–53065. [Google Scholar] [CrossRef]
  17. He, K.; Zhang, X.; Ren, S.; Sun, J. Deep residual learning for image recognition. In Proceedings of the IEEE Conference on Computer Vision and Pattern Recognition, Las Vegas, NV, USA, 27–30 June 2016; pp. 770–778. [Google Scholar]
  18. Carriero, A.; Groenhoff, L.; Vologina, E.; Basile, P.; Albera, M. Deep Learning in Breast Cancer Imaging: State of the Art and Recent Advancements in Early 2024. Diagnostics 2024, 14, 848. [Google Scholar] [CrossRef] [PubMed]
  19. Nasser, M.; Yusof, U.K. Deep Learning Based Methods for Breast Cancer Diagnosis: A Systematic Review and Future Direction. Diagnostics 2023, 13, 161. [Google Scholar] [CrossRef] [PubMed]
  20. Khourdifi, Y.; Bahaj, M. Applying best machine learning algorithms for breast cancer prediction and classification. In Proceedings of the 2018 International Conference on Electronics, Control, Optimization and Computer Science (ICECOCS), Kenitra, Morocco, 5–6 December 2018; IEEE: Piscataway, NJ, USA, 2018; pp. 1–5. [Google Scholar]
  21. Bah, A.; Davud, M. Analysis of Breast Cancer Classification with Machine Learning based Algorithms. In Proceedings of the 2022 2nd International Conference on Computing and Machine Intelligence (ICMI), Istanbul, Turkey, 15–16 July 2022; IEEE: Piscataway, NJ, USA, 2022; pp. 1–4. [Google Scholar]
  22. Mahmud, M.I.; Mamun, M.; Abdelgawad, A. A Deep Analysis of Transfer Learning Based Breast Cancer Detection Using Histopathology Images. In Proceedings of the 2023 10th International Conference on Signal Processing and Integrated Networks (SPIN), Delhi, India, 23–24 March 2023; IEEE: Piscataway, NJ, USA, 2023; pp. 198–204. [Google Scholar]
  23. Amgad, N.; Ahmed, M.; Haitham, H.; Zaher, M.; Mohammed, A. A Robust Ensemble Deep Learning Approach for Breast Cancer Diagnosis. In Proceedings of the 2023 Intelligent Methods, Systems, and Applications (IMSA), Giza, Egypt, 15–16 July 2023; IEEE: Piscataway, NJ, USA, 2023; pp. 452–457. [Google Scholar]
  24. Jaffar, M.A. Deep learning-based computer aided diagnosis system for breast mammograms. Int. J. Adv. Comput. Sci. Appl. 2017, 8, 286–290. [Google Scholar]
  25. Liu, M.Z.; Swintelski, C.; Sun, S.; Siddique, M.; Desperito, E.; Jambawalikar, S.; Ha, R. Weakly supervised deep learning approach to breast MRI assessment. Acad. Radiol. 2022, 29 (Suppl. S1), S166–S172. [Google Scholar] [CrossRef]
  26. Logan, J.; Kennedy, P.J.; Catchpoole, D. A review of the machine learning datasets in mammography, their adherence to the FaIR principles and the outlook for the future. Sci. Data 2023, 10, 595. [Google Scholar] [CrossRef]
  27. Lee, R.S.; Gimenez, F.; Hoogi, A.; Miyake, K.K.; Gorovoy, M.; Rubin, D.L. **A curated mammography data set for use in computer-aided detection and diagnosis research. Sci. Data 2017, 4, 170177. [Google Scholar] [CrossRef]
  28. Jenis, J.; Ondriga, J.; Hrcek, S.; Brumercik, F.; Cuchor, M.; Sadovsky, E. Engineering applications of artificial intelligence in mechanical design and optimization. Machines 2023, 11, 577. [Google Scholar] [CrossRef]
  29. Hossain, M.B.; Iqbal SH, S.; Islam, M.M.; Akhtar, M.N.; Sarker, I.H. Transfer learning with fine-tuned deep CNN ResNet50 model for classifying COVID-19 from chest X-ray images. Inform. Med. Unlocked 2022, 30, 100916. [Google Scholar] [CrossRef]
  30. Eleyan, A.; Alboghbaish, E. Multi-Classifier Deep Learning based System for ECG Classification Using Fourier Transform. In Proceedings of the 5th International Conference on Bio-engineering for Smart Technologies (BioSMART), Paris, France, 7–9 June 2023; pp. 1–4. [Google Scholar] [CrossRef]
  31. Papageorgiou, V.E.; Zegkos, T.; Efthimiadis, G.; Tsaklidis, G. Analysis of digitalized ECG signals based on artificial intelligence and spectral analysis methods specialized in ARVC. Int. J. Numer. Methods Biomed. Eng. 2022, 38, e3644. [Google Scholar] [CrossRef]
  32. Szegedy, C.; Liu, W.; Jia, Y.; Sermanet, P.; Reed, S.; Anguelov, D.; Erhan, D.; Vanhoucke, V.; Rabinovich, A. Going deeper with convolutions. In Proceedings of the IEEE Conference on Computer Vision and Pattern Recognition, Boston, MA, USA, 7–12 June 2015; pp. 1–9. [Google Scholar]
  33. Scherer, D.; Müller, A.; Behnke, S. Evaluation of pooling operations in convolutional architectures for object recognition. In Proceedings of the International Conference on Artificial Neural Networks, Thessaloniki, Greece, 15–18 September 2010; Springer: Berlin/Heidelberg, Germany, 2010; pp. 92–101. [Google Scholar]
  34. Pessoa, D.; Petmezas, G.; Papageorgiou, V.E.; Rocha, B.M.; Stefanopoulos, L.; Kilintzis, V.; Maglaveras, N.; Frerichs, I.; de Carvalho, P.; Paiva, R.P. Pediatric Respiratory Sound Classification Using a Dual Input Deep Learning Architecture. In Proceedings of the 2023 IEEE Biomedical Circuits and Systems Conference (BioCAS), Toronto, ON, Canada, 19–21 October 2023; IEEE: Piscataway, NJ, USA, 2023; pp. 1–5. [Google Scholar]
  35. Bayram, F.; Eleyan, A. COVID-19 detection on chest radiographs using feature fusion-based deep learning. Signal Image Video Process. 2022, 16, 1455–1462. [Google Scholar] [CrossRef] [PubMed]
  36. Eleyan, A.; Alboghbaish, E. Electrocardiogram signals classification using deep-learning-based incorporated convolutional neural network and long short-term memory framework. Computers 2024, 13, 55. [Google Scholar] [CrossRef]
  37. Jiao, Z.; Gao, X.; Wang, Y.; Li, J. A deep feature-based framework for breast masses classification. Neurocomputing 2016, 197, 221–231. [Google Scholar] [CrossRef]
  38. Sajid, U.; Khan, R.A.; Shah, S.M.; Arif, S. Breast cancer classification using deep learned features boosted with handcrafted features. Biomed. Signal Process. Control 2023, 86, 105353. [Google Scholar] [CrossRef]
  39. Wang, Z.; Li, M.; Wang, H.; Jiang, H.; Yao, Y.; Zhang, H.; Xin, J. Breast cancer detection using extreme learning machine based on feature fusion with CNN deep features. IEEE Access 2019, 7, 105146–105158. [Google Scholar] [CrossRef]
  40. Ahmed, M.; Bibi, T.; Khan, R.A.; Nasir, S. Enhancing Breast Cancer Diagnosis in Mammography: Evaluation and Integration of Convolutional Neural Networks and Explainable AI. arXiv 2024, arXiv:2404.03892. [Google Scholar]
Figure 1. Side view of a healthy breast (left) and a breast with malignant tumor (right).
Computers 13 00294 g001
Figure 2. Examples from the DDSM dataset [27] of benign (top row) and malignant (bottom row) images.
Computers 13 00294 g002
Figure 3. Block diagram of the proposed decision fusion-based breast cancer detection model.
Computers 13 00294 g003
Figure 4. The developed CNN model architecture.
Computers 13 00294 g004
Figure 5. Confusion matrices for the LBP + SVM, ResNet50 + SVM, and CNN models (B: benign, M: malignant).
Computers 13 00294 g005
Figure 6. ROC curves for the LBP + SVM, ResNet50 + SVM, and CNN models.
Computers 13 00294 g006
Table 1. Ablation study comparing different combinations of activation functions and optimizers in terms of performance metrics for the developed CNN model.
ParametersAccuracySpecificity PrecisionSensitivityF1 Score
ReLU + SGD97.797.096.998.597.7
LeakyReLU + SGD94.696.796.992.694.7
ReLU + Adem93.895.295.392.593.9
LeakyReLU + Adem96.198.398.494.196.2
Table 2. Experimentally tuned hyper-parameters settings for the developed CNN model.
Hyper-ParameterValue/Metric
Epochs6
OptimizerSGD with momentum
Batch size10
Activation functionReLU
Stride2
ShuffleEvery epoch
Validation frequency3
Initial learning rate10−4
Table 3. Performance comparison for a 30% training and 70% testing dataset split.
ModelSensitivitySpecificityPrecisionF1-ScoreAccuracy
LBP + SVM71.790.187.979.080.9
ResNet50 + SVM94.777.780.987.386.2
CNN90.890.890.890.890.8
Table 4. Performance comparison for a 50% training and 50% testing dataset split.
ModelSensitivitySpecificityPrecisionF1-ScoreAccuracy
LBP + SVM71.390.788.579.081.0
ResNet50 + SVM96.386.187.491.691.2
CNN94.797.094.496.696.8
Table 5. Performance comparison for a 70% training and 30% testing dataset split.
ModelSensitivitySpecificityPrecisionF1-ScoreAccuracy
LBP + SVM72.392.390.480.382.3
ResNet50 + SVM10084.686.792.992.3
CNN98.597.096.997.797.7
Table 6. Performance comparison using different decision fusion rules for 70% training and 30% testing dataset split.
Decision Fusion Rule SensitivitySpecificityPrecisionF1-ScoreAccuracy
Sum rule98.398.998.598.798.5
Product rule98.999.499.799.499.1
Majority voting98.198.498.299.198.9
Table 7. Comparison of the proposed decision fusion model with different algorithms from the literature.
ReferenceClassesTraining/Test
Ratio
DatasetModelAccuracy
[8]Benign, Malignant40/60WBCDMoments + SVM96.6
[20]Benign, Malignant-WBCDSVM97.9
[21]Benign, Malignant80/20Breast Cancer DataSVM87.0
CNN89.0
[22]Benign, Malignant80/20Breast Histopathology ImagesResNet5090.2
[23]Benign, Malignant80/20BCIAverage Weighted
Ensemble
85.0
[24]Benign, Malignant-DDSMCNN + SVM93.0
[25]Benign, Malignant-ISPY-1 DataCNN94.0
[37]Benign, Malignant-DDSMDCNN + SVM96.7
[38]Benign, Malignant-DDSMLBP + HOG + CNN91.5
[39]Benign, Malignant-Hospital ImagesCNN + SVM74.5
[40]Benign, Malignant90/10DDSMResNet5072.0
VGG1656.0
Inception V356.0
Ours
Individual
Benign, Malignant70/30DDSMLBP + SVM82.3
ResNet50 + SVM92.3
Developed CNN97.7
Ours
Decision Fusion
Benign, Malignant70/30DDSMSum rule fusion98.7
Majority voting fusion98.9
Product rule fusion99.1
Disclaimer/Publisher’s Note: The statements, opinions and data contained in all publications are solely those of the individual author(s) and contributor(s) and not of MDPI and/or the editor(s). MDPI and/or the editor(s) disclaim responsibility for any injury to people or property resulting from any ideas, methods, instructions or products referred to in the content.

