1. Introduction
The growth in road traffic and demand for transportation in recent years has produced major congestion, delays, accidents, and environmental concerns, particularly in large cities. Traffic congestion has become a true nuisance that affects both developed and developing countries. It impacts both automobiles and public transportation passengers, and it has numerous negative social consequences in addition to diminishing economic efficiency. The alarming part is that this modern-day manifestation has been escalating without showing any indications of slowing down, resulting in a nightmare that undermines the quality of urban living. Various factors, such as increased purchasing power of middle-income socioeconomic classes, greater availability of credits, relative price reductions, and greater supply of used vehicles, have all contributed to a rapid increase in the number of vehicles in developing countries over the last few decades. Increased individual mobility has resulted from an increased availability of vehicles, which, along with population expansion in cities, has resulted in increased congestion. With the progress of urbanization, a lot of traffic problems are appearing, especially when comparing the rising number of cars and the far lower extension of road safety in different cities around the world.
Reducing traffic congestion in urban areas has become a necessity; in addition to the economic and social benefits of reducing traffic congestion, it has a direct impact on air quality and environmental status of cities and citizens’ well-being. The intelligent Transportation System Market is expected to grow from USD 17.9 billion to USD 36.5 billion in 2025 [
1]. The market growth can be attributed to several factors, including the rising number of vehicles on the road. Statistical analysis has shown that the use of vehicles, especially cars, has increased since 2006. The global use of passenger cars and commercial vehicles has seen a big growth over the period 2006–2015 [
2]. The graph clearly shows a big growth in vehicle usage.
This problem exists globally and in Morocco as well; according to the Moroccan Ministry of Equipment, Transport and Logistics, the number of vehicles has increased from 2,791,004,000 in 2010 to 4,056,598,000 in 2017.
More specifically, in the region of Tangier-Tetouan where this research’s data were collected, the number of vehicles on the road has increased, as shown
Figure 1.
Traffic management methods not only affect public safety and comfort, but they can also cause poor air quality in urban environments, which may directly affect public health. Road travel is a significant contributor to air pollution in cities and towns as the emissions from vehicles on the road can have negative impacts on air quality. These emissions include a variety of harmful substances, such as carbon monoxide, nitrogen oxides, and particulate matter, which can cause a range of health problems. In particular, traffic pollution can contribute to the formation of smog, a mixture of air pollutants that can reduce visibility and cause respiratory issues.
Other modes of transportation, such as cargo ships, diesel trains, and heavy vehicles, can also contribute significantly to air pollution, particularly in areas with high levels of transportation activity. These modes of transportation rely on fossil fuels to operate. The use of fossil fuels for transportation is a major contributor to air pollution. When fossil fuels are burned, they release a variety of harmful substances into the air, including particulate matter, nitrogen oxides, and carbon dioxide.
Particulate matter, or PM, is a type of air pollution that consists of tiny particles suspended in the air. These particles can be inhaled deep into the lungs, where they can cause respiratory and cardiovascular problems. Nitrogen oxides are a group of gases that are produced when fossil fuels are burned. They contribute to the formation of smog and can cause respiratory problems. Carbon dioxide is a greenhouse gas that contributes to climate change.
In addition to their direct impacts on air quality, the emissions from these modes of transportation also contribute to greenhouse gases, which trap heat in the Earth’s atmosphere and contribute to global warming. The impact of these emissions can be particularly significant in densely populated areas, where there are more people exposed to the polluted air [
3].
The problem is mainly caused by private cars users, and some vehicles cause more congestion than others. A bus, for example, can transport up to 50 people, whereas a passengers car, on average, can take up to 4 people only. The behaviors of passenger cars’ drivers also represent a major factor for congestion to occur: there are certain drivers that have no regard for other road users. Many drivers in some places, such as Tangier or Casablanca, strive to save a few seconds by forcing their way into junctions and blocking the passage of other automobiles, resulting in economic losses to others that are far higher than their own gains.
Knowing the impact that traffic congestion has on our lives, it becomes more important to find a solution. With the latest achievements in information technologies, including the Internet of Things (IoT), machine learning, and edge computing and networking, the intelligent management of traffic congestion has become a growing area of research [
4]. Therefore, our research focused mainly on passenger cars and how to identify congestion caused by this category of drivers, and the goal is to propose a solution to lower traffic congestion levels.
Traffic in most Moroccan cities is highly congested due to many reasons, including infrastructure, number of vehicles, and the low quality and capacity of public transportation. According to the Ministry of Equipment, Transport and Logistics, traffic congestion has an impact on Moroccan economic growth and represents a challenge in terms of social and sustainable development.
Traffic congestion has major impact on public health as road noise has been shown to increase the short-term risk of death from specific diseases of the cardiovascular, respiratory, and hormonal systems. People who live in areas with a higher level of congestion and face a lot of traffic stress have a lower health status and higher depressive symptoms than people living in areas with less traffic congestion [
5].
Our research aims to improve the daily life of drivers and contribute to the well-being of urban populations, including both drivers and people living in areas with high levels of traffic congestion. We started with the city of Tangier, where data were collected using a mobile app that was installed on taxi drivers’ phones. Taxi drivers are ideal for collecting data on traffic conditions in urban areas because they spend a significant amount of time on the road and have a good understanding of traffic patterns and congestion. By installing the mobile application on their phones, we could collect real-time data on traffic conditions, including information about traffic flow, speed, and congestion. This dataset could then be used to determine the most efficient route for drivers to take based on current traffic conditions. In addition to their expertise and experience on the road, taxi drivers are also a good source of data because they cover a wide range of routes and times of day. This helps to ensure that the data collected are representative of traffic conditions in the city at different times and in different locations. Our study was later expanded to Casablanca and will continue to expand to other cities in the future.
This research resulted in the development of an algorithm capable of predicting road traffic conditions based on the collected data, even in areas where data were not collected. We also developed a mobile application with a simple user interface to provide users with the shortest and most convenient routes to take within urban areas. The strength of our application is that it not only shares real-time information but also generates maps and predicts road conditions in the future based on the data collected from different time frames. The Ezzi-traffic application developed by our team allows users to check the real-time state of roads, as well as the congestion levels in the future based on any chosen timeslot and location. Our goal is to eventually direct drivers based on the projected level of congestion at the time they will arrive at a given location, rather than the current or past level of congestion.
2. Related Work
Optimal routing of vehicles, also known as vehicular routing or fleet management, refers to the process of determining the most efficient routes and schedules for a fleet of vehicles to follow in order to transport goods or passengers from one location to another. This can involve minimizing the total distance traveled, minimizing the total time spent on the road, or maximizing the number of deliveries or passengers that can be transported within a given timeframe.
In the past, researchers have tackled the problem of vehicular routing from a variety of perspectives, including mathematical optimization, artificial intelligence, and control theory.
One early approach to vehicular routing is to use mathematical optimization techniques to find the shortest or quickest route for a single vehicle to follow. This could be accomplished using algorithms, such as the Dijkstra’s algorithm or the A* search algorithm, which are commonly used to find the shortest path between two points in a graph.
To address the issues related to traffic congestion due to multiple vehicles on the road, researchers have proposed a variety of more sophisticated methods for optimizing the routes and schedules of a fleet of vehicles. For example, some approaches have used mixed-integer programming or linear programming to find the optimal routes and schedules for a fleet of vehicles, while taking into account the specific constraints and requirements of each vehicle and each delivery [
6]. Other researchers have used machine learning techniques, such as neural networks or genetic algorithms, to learn from past data and adaptively improve the efficiency of the vehicular routing process over time.
In addition to these mathematical and computational approaches, researchers have also explored the use of control theory and feedback control to optimize the navigation of vehicles in real time. This can involve using sensors to gather data about the current state of vehicles and their surrounding environment, and then using these data to adjust the routes and schedules of the vehicles in real time in order to respond to changing conditions or unexpected events.
There are various approaches that can be taken based on artificial intelligence (AI) to solve traffic congestion problems in urban areas (
Table 1).
The following is a list of some possible solutions:
Traffic prediction and optimization: Machine learning algorithms, such as neural networks or support vector machines, can analyze traffic data from sensors, cameras, and other sources to predict traffic congestion and optimize traffic flow. These algorithms can learn patterns in the data and make predictions about future traffic conditions.
Intelligent transportation systems (ITS): Advanced technologies, such as sensors, cameras, and communication networks, can be used to develop intelligent transportation systems (ITS) that improve the efficiency and safety of transportation. For example, traffic management systems can optimize traffic flow and reduce congestion, and autonomous vehicles can navigate roads and avoid collisions.
Demand-based pricing: Real-time traffic data can be analyzed to adjust the price of transportation services based on demand, thereby encouraging the use of alternative modes of transportation or shifting demand to off-peak times.
Public transit optimization: Optimization techniques, such as machine learning or statistical modeling, can analyze data based on rider demand, route performance, and vehicle utilization to improve the efficiency of public transit systems. These techniques can identify patterns in the data and suggest changes to routes or schedules to reduce congestion and improve overall performance.
Artificial intelligence needs a lot of data to achieve its potential results, which is why a lot of startups are collecting data by connecting hundreds of sensors at traffic lights to obtain a general idea on why congestion is happening and how to manage it in real time.
For instance, Rapid Flow Technologies is testing its Surtrac traffic management system in the East Liberty neighborhood in Pittsburgh, USA. Rapid Flow’s technology deployed at intersections allows coordination among all the lights where it has been installed, for example, allowing a light to stay green longer to clear traffic at a particular intersection. “We have communication between intersections”, said Mr. Barlow, the co-founder and CTO of Rapid Flow Technologies [
15]. The Surtrac system has reduced waiting times at traffic lights in the area by as much as 42%, according to Mr. Barlow. This not only gets people to their destinations quicker, but it also helps reduce auto emissions because cars are spending less time on the road.
A startup called Vivacity Labs [
16] is taking a different approach in the town of Milton Keynes, England. It is focusing on gathering data on traffic patterns with custom-made sensors installed at traffic lights throughout the town, with the aim of eventually using the system to provide predictive traffic information and guidance to drivers. In the near future, controlling traffic lights is expected to come into play. These sensors will not simply gather information; each will be a powerful computer attached to a camera and capable of analyzing the traffic it can see at its intersection.
Currently, Vivacity uses its sensors at intersections to gather traffic information that is continually sent back to a central computer. The systemwide data can be analyzed not only to recognize current traffic conditions but also to predict how traffic patterns will develop [
17].
Waze is a powerful tool for real-time traffic information and management. Its strength lies in its user-generated content as drivers who use the Waze app share information about traffic, accidents, and road conditions. The data are analyzed by Waze in real time to provide the most optimal route to drivers 24 h a day. While Waze is a valuable resource, it does have limitations, such as its inability to predict road conditions in advance [
18].
Traffic congestion has a major impact on public health as road noise has been shown to increase the short-term risk of death from specific diseases of the cardiovascular, respiratory, and hormonal systems. People who live in areas with a higher level of congestion and face a lot of traffic stress have a lower health status and higher depressive symptoms than people living in areas with less traffic congestion [
19].
This research is conducted to make drivers’ daily life easier and to participate in the well-being of urban population (both drivers and people living in areas with higher congestion levels). This study started with Tangier city, was expanded to Casablanca, and will be expanded to other cities in the future.
This study has resulted in the development of an algorithm that is capable of predicting road traffic condition based on the data collected, while also able to predict congestion in areas where no data have been collected. A mobile application for users was developed with a simple UI in order to give them the shortest and most convenient route to take for their movement inside urban areas.
The power of our application and the added value are the ability to not only share real-time information but also generate maps and predict road conditions in the future based on data collected on different time frames. The application is applied offline, and once a user goes online, the data are updated with new one. Users can choose their destination and check on road state in real time or even check on congestion level in the future as the Ezzi-traffic application offers the possibility of predicting any chosen timeslot of the day and on different locations. Eventually, it should be able to direct drivers based not only on how busy the road is now, or how busy it has been a few minutes ago, but how busy it will be when they get there.
3. Methodology
The methodology for this study involved several key steps. Firstly, a mobile application was developed to collect data on taxi driver movements in Tangier, Morocco. The application automatically transmitted the exact position every 10 s, and the data were collected throughout the year. Then, a radius of 50 m was selected around each node, and the congestion index for each node was calculated by averaging the time spent by each driver within the 50 m radius around the node. The cost of a road between two nodes was defined as the average time spent by users on that road, which was calculated based on the congestion index of the two nodes and the distance between them. The A* algorithm was used to predict the shortest route between the two points based on the calculated road cost.
A mobile application was developed with a user-friendly interface that allows users to select a destination, check real-time road conditions, and predict future congestion levels at any chosen time and location. The application also generates maps and updates data when a user goes online. The model was then expanded to other cities by developing a model that could automatically generate road congestion levels and suggest the best roads to take in a certain area at different time slots based on the data collected from another area with similar characteristics. This model was applied to Tangier and Casablanca, Morocco.
Node and area matching was then conducted by selecting nodes and factor elements (such as schools, supermarkets, and restaurants) in both Tangier and Casablanca, and calculating the weight of each area based on the location and number of these elements. Two areas were then matched based on their weights, and the nodes were matched within each area based on their type, number of exits and entries, and maximum occupancy. The matched nodes were used to suggest the best roads to take in the destination city based on the data collected in the source city.
Finally, the effectiveness of the mobile application and the accuracy of the predicted routes were evaluated using real-time data and feedback from users. The effectiveness of expanding the mobile application to other cities was also evaluated.
4. Nodes’ Determination and Data Collection
Tangier is one of the biggest cities in Morocco. It has a high level of congestion caused mainly by passenger cars, which leads to congestion at different intersections.
We chose nodes distributed all around the city based on the level of congestion, the distance between them, and the importance of these nodes in the daily traffic of a normal passenger.
A mobile application was developed by our team to collect data on different road segments as shows
Figure 2. It works on taxi drivers’ phones, and it is easy to install and very smooth to use:
An account is created for each taxi driver (
Figure 3);
The application automatically starts sending the exact position every 10 s;
The application works fine on background and when the phone is locked, which helps getting less interruption in receiving data;
The application is energy efficient (very small battery consumption).
The data were collected during all times of the year, as the congestion level can be different from one year period to the other. Many factors can affect traffic distribution and level, as discussed in the subsections below.
4.1. Holidays
Vacations take visitors on routes that they have never traveled before. They can become confused, their attention is drawn to the GPS rather than the road, and they can make mistakes. Furthermore, visitors add to the general traffic congestion as most of them use their private cars to move around the visited city, which leads to a higher congestion level and road saturation.
The dates of Eid al-Fitr and Eid al-Adha are determined by the lunar calendar and change every year. In 2009–2017, Eid al-Fitr was mostly during the summer and Eid al-Adha was between September and November. Given the significance of these two holidays, it is possible that taxi drivers will either not work or reduce the length of their shifts. This should reduce the number of vehicles in the city, which would reduce congestion on those dates [
19].
4.2. Special Days
4.2.1. Christmas
During Christmas, most countries around the world have a higher level of traffic congestion from 23 December to 3 January: this increase in traffic flow is mostly caused by leisure trips. According to the AAA [
20], in USA only, over 100 million Americans plan to get to their holiday destination via cars. In 2020, 78.5 million hit the road for Christmas and New Year’s Day. This period sees a high level of mobility, so it is important to be taken into consideration while calculating the impact factor.
4.2.2. Ramadan
During the holy month of Ramadan, the Iftar time is observed throughout the Arab and Muslim world at sundown each day. Iftar is the evening meal when Muslims break their fast, and it is historically celebrated by families and communities.
Unfortunately, Ramadan is also a time of the year when there is a spike in traffic congestion, accidents, deaths, and injuries, with the majority of these accidents occurring either before or during the Iftar meal.
The following behaviors have been reported by traffic policing departments across the MENA region: As the sun sets, there is an increase in traffic congestion and rule violations; roads around malls, mosques, and markets become congested; and more drivers speed, disobey traffic signals, and talk on their phones while driving.
The following analysis could be attributed to the reasons for the Ramadan road safety concern: Fasting during Ramadan causes a significant disruption in one’s daily routine. It has the potential to affect one’s diet and digestion, as well as sleeping patterns [
21].
4.2.3. Summer
During summertime, not only the number of tourists increases but also people’s behavior and routine is different. Summer evenings and nights are the peak time in terms of traffic congestion as most of the road users are private car users who enjoy driving around the city and exploring it using mostly the same roads, which leads to higher traffic congestion.
Summertime is also different as the government shifts into daylight saving time (DST), and car accidents and traffic jams decrease when the clock changes to DST and increases when the clock changes back to standard time. This could be explained by the increased amount of light available during the evening rush hour when the clock changes to DST [
22].
4.3. Congestion Determination and Data Processing
The term “congestion” is frequently used in the context of road traffic, both by technicians and by the general public.
It is defined as “a condition of overcrowding or overburdening” by Webster’s Third New International Dictionary, while “to congest” means “to overcrowd, overburden, or fill to excess so as to obstruct or hinder” something, e.g., road traffic in this case.
It is commonly understood as describing a situation in which a large number of vehicles are circulating, all of which are moving slowly and irregularly. These definitions, however, are of a subjective nature and are insufficiently precise.
The mutual interference between vehicles in the traffic flow is the primary source of congestion. Vehicles can circulate at a reasonably, freely defined speed up to a particular volume of traffic, which is governed by the legal speed limit, the frequency of intersections, and other conditioning factors. However, with increasing levels of traffic, each extra car obstructs the flow of the others, resulting in the phenomenon of traffic congestion. “Congestion is the condition in which the entrance of an additional vehicle into a traffic flow increases the journey times of the others”, as stated by one objective definition [
23].
Congestion, according to two well-known experts [
24], in transportation modeling occurs when demand exceeds the capacity of the travel infrastructure, resulting in significantly longer transit times than in low-demand conditions [
24]. Although this definition matches a common citizen’s opinions, it does not provide precise boundaries for when the phenomenon begins.
It is critical to figure out road congestion level. As a result, numerous traffic congestion definitions have been proposed. A study [
25] defined traffic congestion rank as the state in which the number of cars on the route exceeds the conventional road service level’s carrying capacity. Another study [
26] employed a congestion index that took into account the saturation level, the travel speed, and a combination of the two. A different study [
27] adjusted for the speed performance index by categorizing congestion levels as four, three, or two, depending on the situation.
In this research, the congestion index level was determined as the time a vehicle spends inside a node radius, which was determined using the data collected.
In this study, we used data from taxi drivers and nodes located throughout Tangier to investigate the occurrence of congestion at different locations. To obtain the most accurate results, we chose a radius of 50 m around each node and tested the data in 30 min increments. For example, at node 0 (Trial atlas),
Table 2 shows data entries for taxi 1 every 10 s from 8:00 to 8:30. During this time, taxi 1 enters the 50 m radius around node 0 at 8:13:20 and leaves at 8:16:40, spending a total of 4 min inside the radius. This gives a congestion index of 4 for this particular case.
To calculate the congestion index for each node as shows
Table 3, we took the average congestion index of all taxi drivers at that location. Any congestion index values that were null or over 5 min were eliminated as these were considered to represent parked vehicles rather than congestion.
A node’s congestion index is determined by calculating the average of congestion of all drivers in each node as shows
Table 4:
4.4. Cost Determination
In the context of traffic, the cost or weight of a node can refer to various factors that may affect the movement of vehicles through that node. Below are some common examples of what the cost of a node might represent:
Length of a route: the cost of a node could represent the distance that a vehicle needs to travel to reach that node.
Travel time: the cost of a node might also represent the amount of time it takes for a vehicle to travel through that node.
Maximum occupancy: the cost of a node could reflect the maximum number of vehicles that can pass through it at any given time.
Using the average time obtained from the calculation of the average time each driver has spent inside a specific node’s radius is crucial to determine nodes that have a high level of congestion.
The cost of node i
1, denoted as cost(i
1), is the average time that the studied taxi drivers spend in the determined radius of node 0 within a certain time frame. According to
Table 1, this time is 4 min within the time frame between 8:00 and 8:30. Similarly, the cost of node j
1, denoted as cost(j
1), is the average time that the studied taxi drivers spend in the determined radius of node 1 within the same time frame. For example, this time is 1 min within the time frame between 8:00 and 8:30.
The
can be calculated as shown in the following equation:
For example, the estimated time to travel from
to
is shown in
Table 5.
The time it takes for a user to travel from node i
1 to node j
1 is recorded as starting at 8:13:20 and ending at 8:16:26 as shows the
Table 5. This duration can be approximately calculated as 0.051 h.
The cost of a road between two nodes, i
1 and j
1, is defined as the average time spent by users traveling on that road as shows
Table 6. If the time spent on the road is null or greater than 5 min, it is eliminated from the calculation as it is assumed that the vehicle is either not moving or parked. The cost of the road between i
1 and j
1 is calculated by averaging the remaining time spent on the road by users:
The average speed of vehicles within urban areas is assumed to be 40 km/h. The optimal time it would take to travel from node A to node B can be calculated using this speed and the distance between the two nodes, which is 0.53 km. The optimal time is determined by assuming that the vehicle is traveling at a constant speed of 40 km/h and no delays or disruptions are encountered along the way.
4.5. Shortest Path Algorithm
While most people are familiar with the concept of finding the shortest path between two places, such as from point A to point B, computer scientists approach the shortest path problem from a different perspective. They may need to consider more complex scenarios that involve multiple points and constraints and, thus, require different methods to solve. In this sense, the shortest path problem takes on a new dimension in the realm of computer science and may require a more nuanced understanding of the problem and its solutions.
The shortest path issue in graph theory is the task of finding a path between two vertices (or nodes) in a graph that minimizes the sum of the weights of its constituent edges. The challenge of determining the shortest way between two intersections on a road map can be described as a specific case of the shortest path problem in graphs, where the vertices correspond to the intersections and the edges correspond to the road segments, with each being weighted by the segment’s length.
Shortest path algorithms work on a graph, which is made up of vertices and edges that connect them, for simplicity. A graph can be directed, undirected, weighted, or any combination of these. These distinctions dictate which method will work better for specific graph types than others.
Shortest path algorithms have various uses, with the most notable being route planning software, such as Google Maps, Waze, and our method (Ezzi-traffic) as we make use of shortest path algorithms to generate routes.
As there are a number of different shortest path algorithms, we studied the most important to help us determine the best one to use in our research.
4.5.1. Dijkstra’s Algorithm
Dijkstra’s algorithm computes the shortest path from one node to every other node inside the same graph data structure, and this sets it apart from the other algorithms. This means that instead of only finding the shortest path from the starting node to another specific node, this algorithm searches for the shortest way to every single reachable node—as long as the network remains unchanged [
28].
The procedure continues until all of the nodes that are reachable have been visited. As a result, we would only need to run the Dijkstra’s algorithm once and preserve the results to be utilized again without having to re-run the process—unless the network data structure has changed in any manner.
4.5.2. Bellman–Ford’s Algorithm
The Bellman–Ford algorithm, like Dijkstra’s algorithm, seeks to discover the shortest path between a given node and all other nodes in a given graph. Although slower than the former, the Bellman–Ford algorithm compensates for this with its adaptability. Unlike the Dijkstra’s algorithm, the Bellman–Ford algorithm is capable of dealing with graphs with negative edge weights.
It is important to note that if a graph has a negative cycle (i.e., the edges add to a negative value), there is no shortest or cheapest path. Because it ends on a negative cycle, the algorithm is restricted from finding the correct route. The Bellman–Ford algorithm has the ability to detect and report on negative cycles [
29].
4.5.3. Floyd–Warshall Algorithm
Unlike the preceding two algorithms, the Floyd–Warshall algorithm is not a single-source algorithm. Rather than starting from a single node, it calculates the shortest distance between every pair of nodes in the network. It solves the main shortest path problem by splitting the major problem into smaller ones and then combining the answers [
30].
4.5.4. A Star Algorithm
The A* algorithm is just like the Dijkstra’s algorithm, and the only difference is that the A* algorithm tries to look for a better path by using a heuristic function, which gives priority to nodes that are supposed to be better than others, while the Dijkstra’s algorithm just explores all possible ways [
31].
In our study, both the Dijkstra’s algorithm and the A* algorithm were shown to be effective for finding the shortest paths on maps, but the A* algorithm was found to be more efficient for larger-scale maps due to its heuristic search approach. The A* algorithm will deliver the solution faster than the Dijkstra’s algorithm on a big-scale map. Because of the heuristic value used in the calculation, the A* algorithm scans the region solely in the direction of the destination, but the Dijkstra algorithm searches by stretching out equally in all directions and frequently ends up searching a considerably greater area before finding the target, making it slower than the A* algorithm. The loop counts of the Dijkstra and A* algorithms demonstrate this: the more points (nodes) that are searched, the greater the discrepancy between the loop count and the time.
Heuristic Function
The heuristic function h(n) tells the A* algorithm an estimate of the minimum cost from any vertex n to the goal. If h(n) is always lower than (or equal to) the cost of moving from n to the goal, then the A* algorithm is guaranteed to find the shortest path. The lower h(n) is, the more node the A* algorithm expands, making it slower.
Even if the heuristic function underestimates the true cost to reach the goal, the A* algorithm will still find the shortest paths. However, because the heuristic is not very accurate, the A* algorithm will have to explore more nodes to find the shortest path, which will result in a slower performance. If the heuristic function overestimates the true cost to reach the goal, the A* algorithm may not find the optimal (i.e., shortest) path, but it will run faster because it explores fewer nodes.
The capacity of the A* algorithm to change its behavior based on the heuristic and cost functions can be quite beneficial. To identify a solution faster, the tradeoff between speed and accuracy can be utilized. The most important is to choose an admissible heuristic.
Heuristics are not always associated with lower costs. Admissible heuristics, on the other hand, do not overestimate the true or lowest possible cost of a solution. This characteristic can ensure that the solution is optimal. By reducing the original problem to a less constrained problem and simplifying it in terms of constraints, an admissible heuristic can be found.
The A* algorithm computes f(n) = g(n) + h(n). Two values must be on the same scale in order to be added: g(n), the cost function, is calculated using minutes as a scale, so h(n) should also be calculated on the same scale.
The heuristic function used in our research is the perfect time (in minutes) that a user should spend inside a node moving from node A to node B. Considering the perfect speed inside urban areas to be 40 km/hour, and knowing the distances between all nodes, the algorithm is capable of calculating the heuristic for every situation.
The A* algorithm steps are as follows:
Set all point distances to infinity, with the exception of the initial point, which should be set to 0.
Make all nodes, including the initial point, non-visited.
Assign the current node “C” to the non-visited node with the shortest current distance.
Add the current distance of “C” to the weight of the edge connecting “C”—“N” and the weight to the target point for each of the current node’s neighbors “N” (heuristic). Set it as the new current distance of “N” if it is less than the current distance of “N”.
Check the box next to the current node “C” to indicate that it has been visited.
Repeat steps 3–6 until one of the neighbor’s “N” becomes the goal’s location.
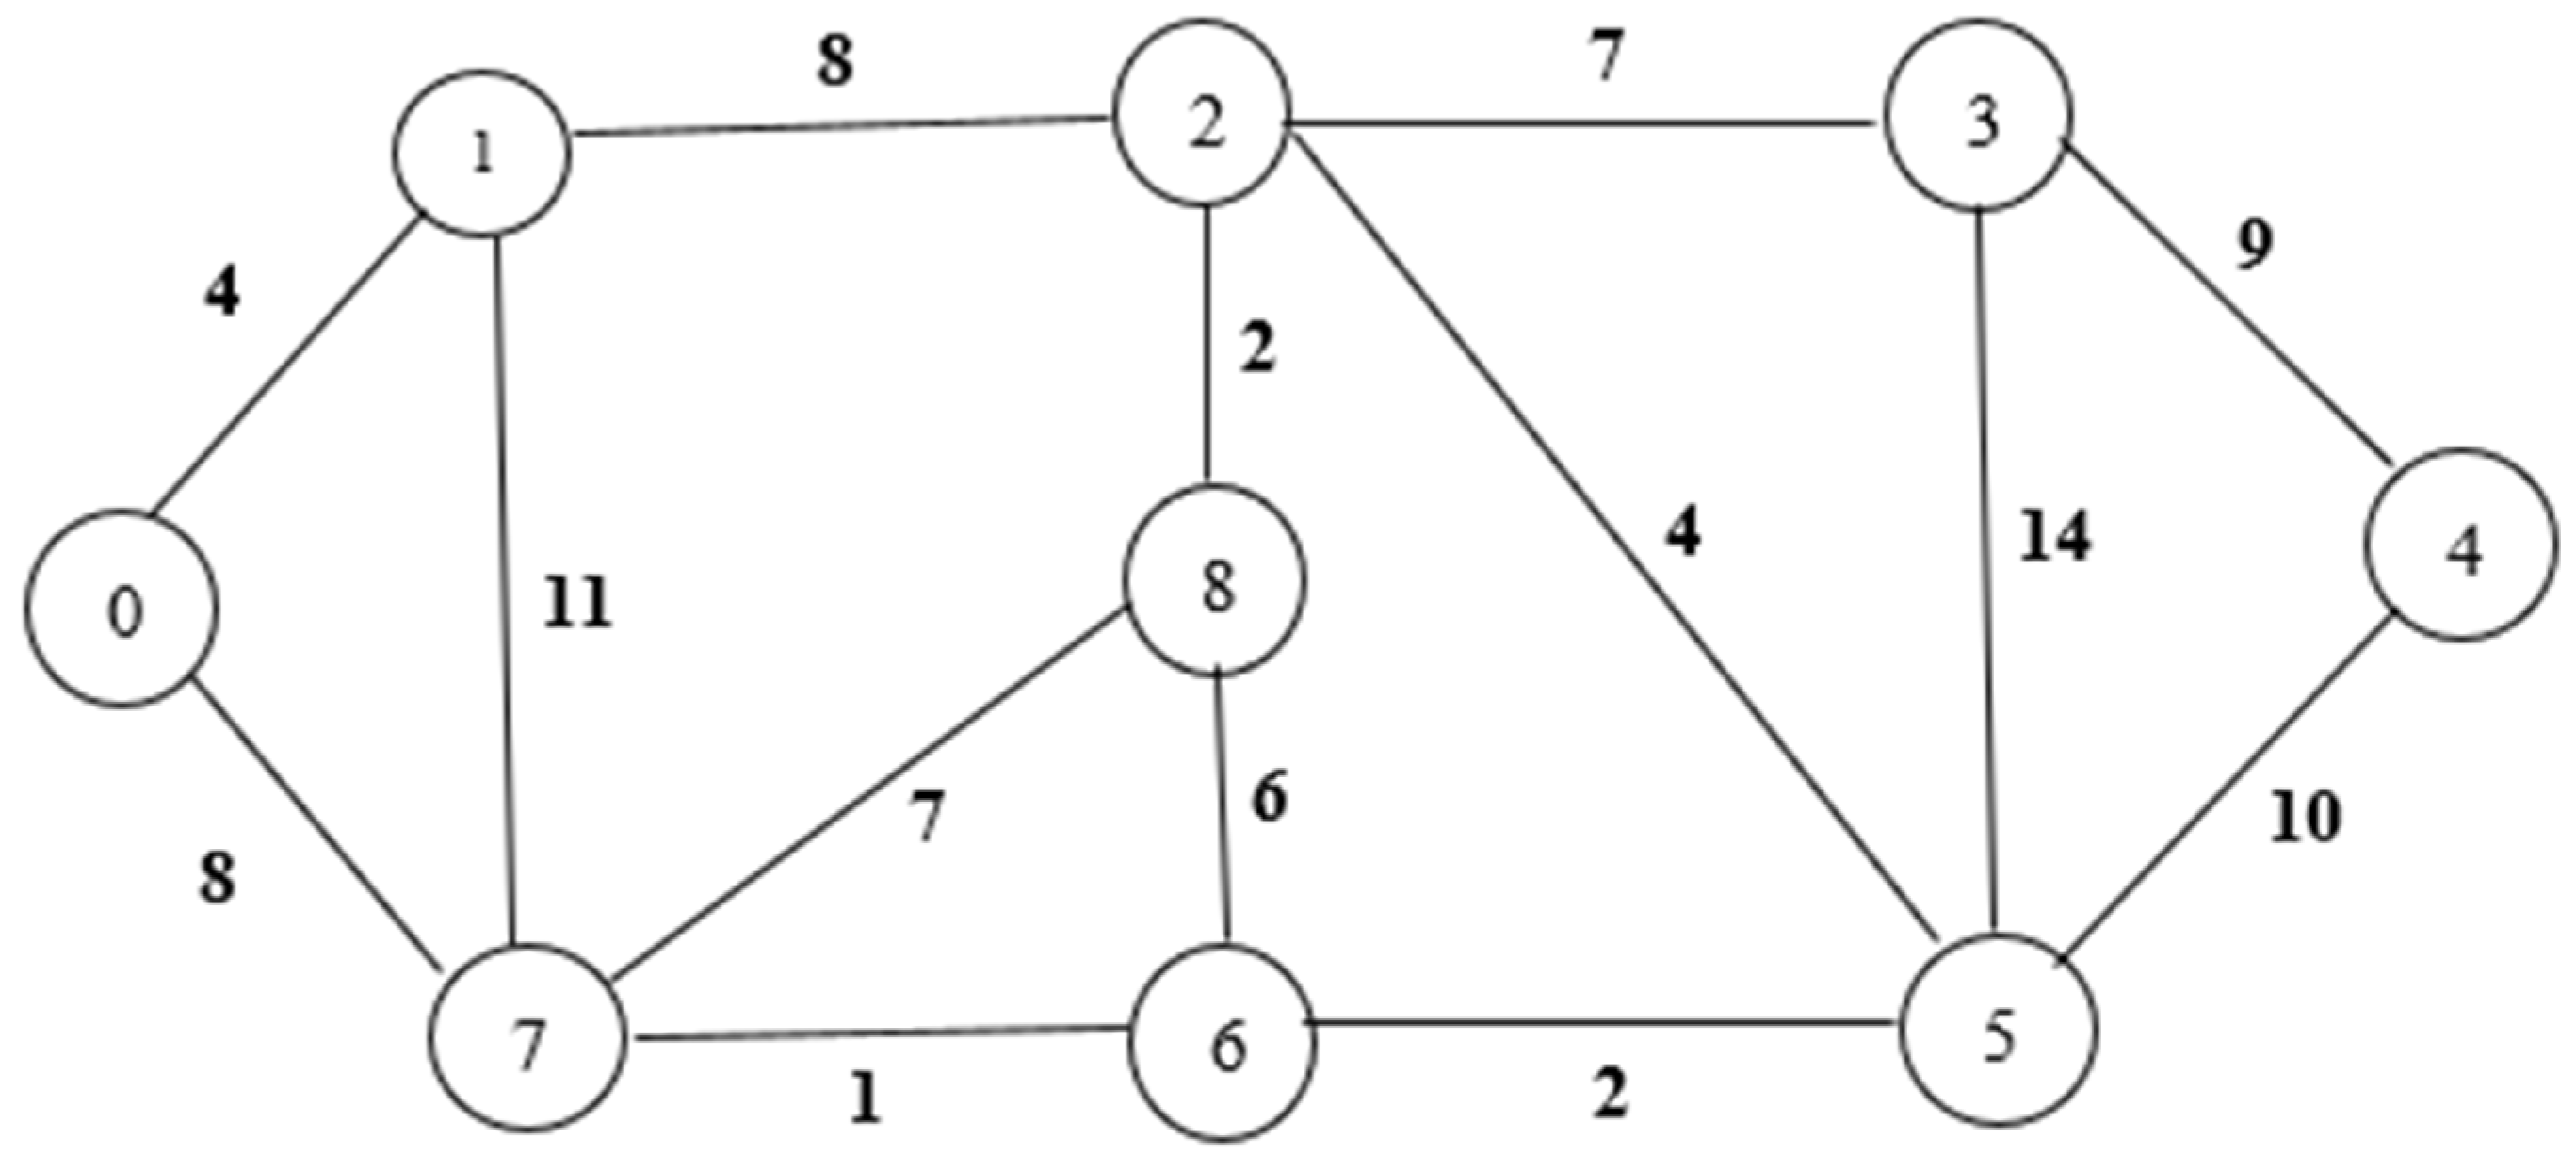
Figure 4 demonstrates how the cost calculations are performed. After the calculation of the exact cost of every node, we were able to calculate the cost between two nodes, and based on this calculation and using the A* algorithm, we were able determine the shortest road based on the following factors:
Vehicle speed;
Time;
Source;
Destination.
The function path () is the function responsible for defining the best road to go through; this function receives the vehicle speed, time, source node, and destination node, and based on the information, it suggests the best road to take to avoid congestion.
To make sure the application works in offline mode as well, the solution used in this research is to store the data locally on users’ devices instead of using remote cloud servers or APIs; the text files are downloaded automatically from the internet and saved for later offline use. The data files are placed in the Documents directory of a device. On Android, it is the AppData directory, and on iOS, it is the NSDocumentDirectory.
Exiting the application, restarting, or shutting down the device does not cause a loss of data. The data are only deleted when the corresponding application is deleted.
The flowchart in
Figure 4 illustrates the steps involved in identifying the shortest path, including the calculation of the cost for both the starting and destination nodes.
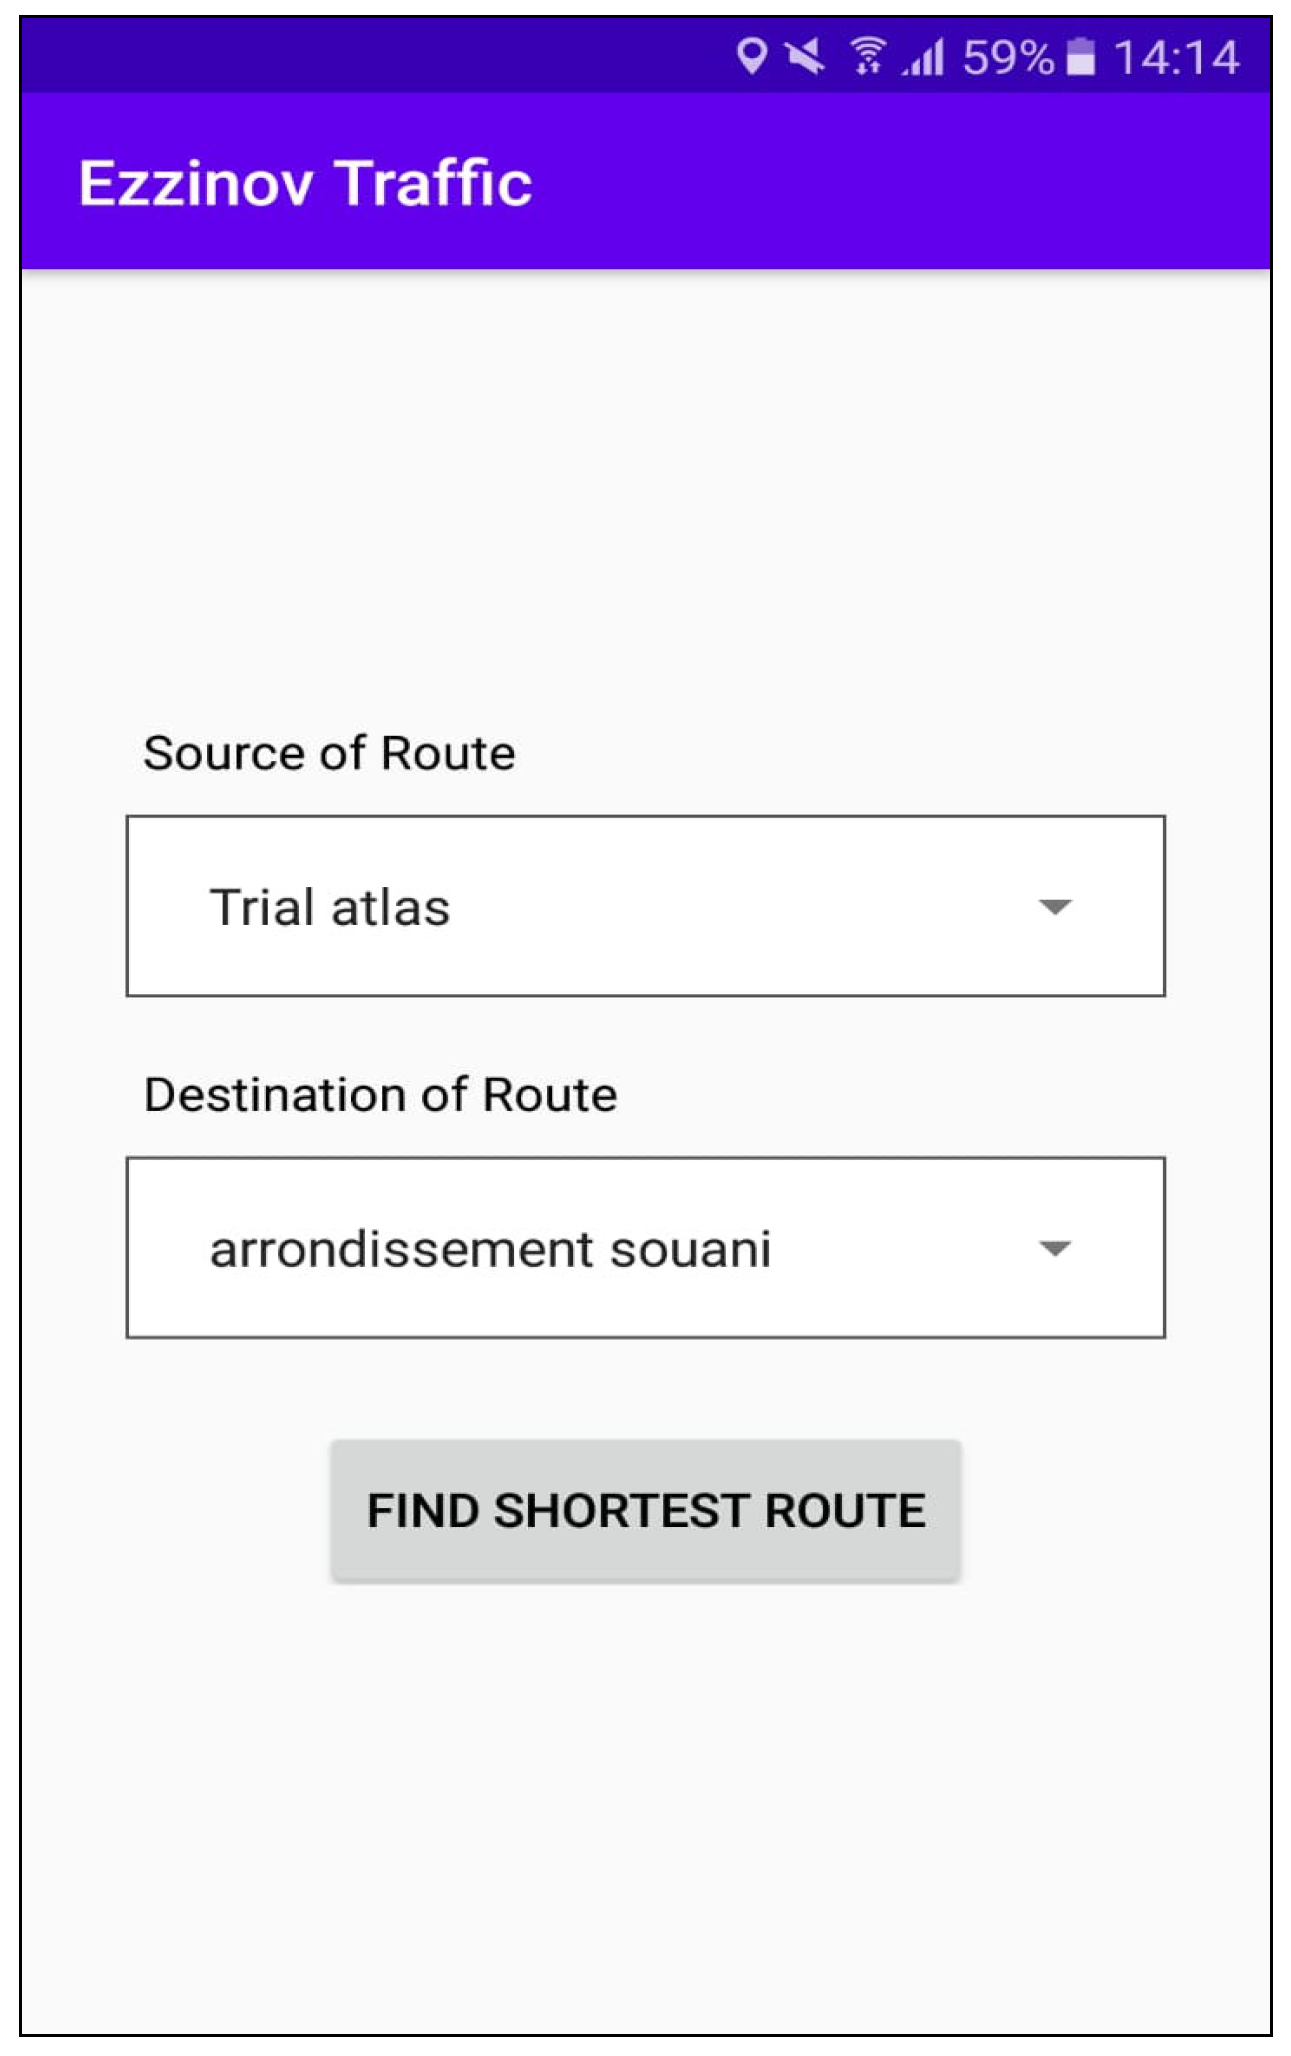
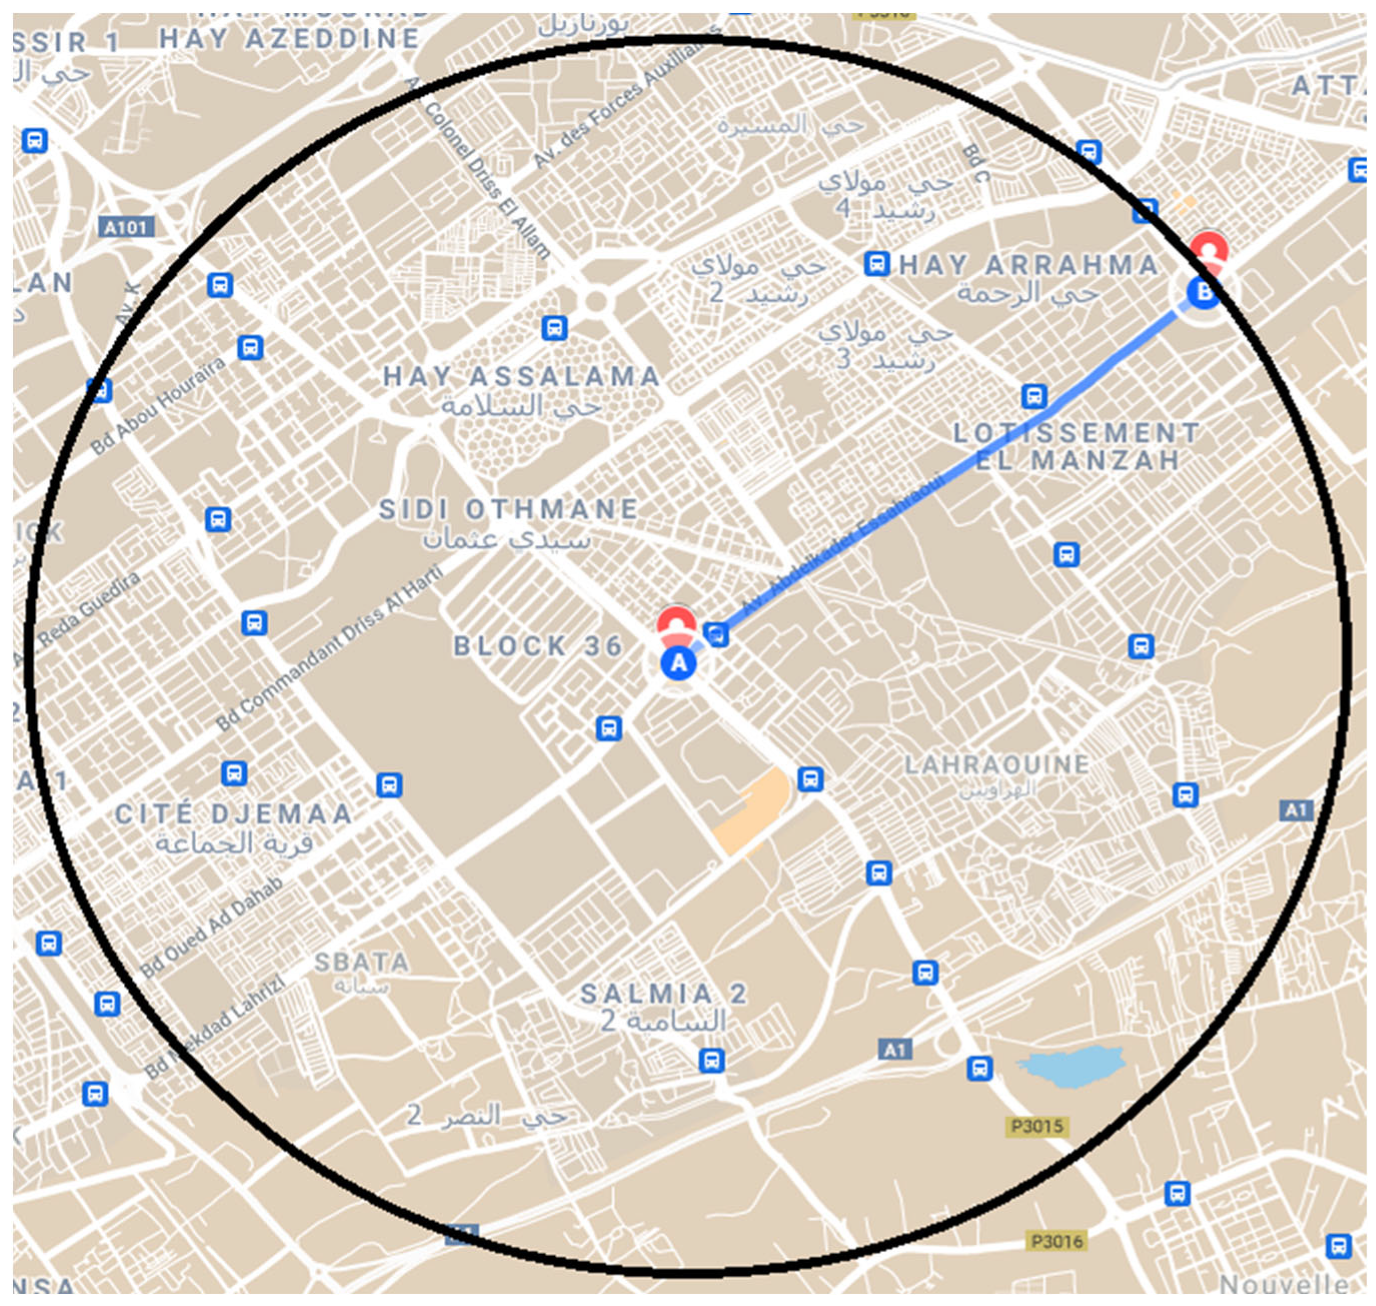
A basic version of the mobile application was developed by our team to represent the algorithm’s results and suggest the shortest road users of this application can take based on the selected source and destination nodes on a certain time slot (
Figure 5,
Figure 6 and
Figure 7). This application uses our algorithm’s API in online mode and the downloaded text files in offline mode.
As the data are divided to different time frames during the day on a 30 min frame starting from 08:00 of morning, the text files are also divided in the same way. The cost of every node and road is saved into a text file, and when a call is made from the app, the time is automatically detected and the data are retrieved from the appropriate file that corresponds to that specific time frame. If a user starts their journey in a time frame and the journey ends in another time frame, data are retrieved according to the time, and the results are updated continually depending on the new data.
5. Expanding Study to Other Cities
As Morocco’s economy develops and its cities experience rapid growth, urban mobility challenges have become more prevalent. These challenges are being addressed with the help of disruptive technologies. For example, Rabat, which has seen its population increase by 18% in the last 10 years, is expected to see a daily increase in passenger movements from 1.49 million in 2014 to 1.94 million in 2024. Passenger movements refer to the transportation of people using any form of motorized, non-motorized, collective, or individual transportation.
Casablanca’s 2019 figure of 7.8 million movements per day is expected to rise to 10 million by 2030. This sustained increase will require a harmonized effort between public and private players, as well as the integration of various modes of transportation in and between cities [
32].
In this research, we collected and analyzed taxi trajectory data from the city of Tangier in order to propose more efficient routes for travel at different times. Using an algorithm, we were able to develop an API that takes vehicle speed, time, source, and destination as its input, and generates the least congested route map according to a specific time slot.
Collecting and analyzing data from taxi drivers in Tangier, a large city in Morocco, was a time-consuming and labor-intensive process. However, the goal of this research was to establish a solution that could be applied to other cities in Morocco that have similar characteristics, road conditions, and driver behaviors. To achieve this, we developed a model that is able to automatically generate congestion levels for roads in a certain area and suggest the best route to take at different times based on input from an area with similar characteristics. In this study, we focused on both Tangier and Casablanca.
The goal of matching areas in Tangier with areas in Casablanca was achieved through the following steps:
Selection of nodes in both cities.
Selection of factor elements in both cities.
Selection of the studied area.
Calculation of area weights.
Matching of areas.
Matching of nodes.
Suggestion of the best road.
These steps allowed us to identify and compare areas in both cities that have similar characteristics and suggest the most efficient routes for travel based on this information.
5.1. Node’s Selection in Both Cities
The establishment of a balanced distribution of nodes is critical for this study. It is important to cover the entire city territory and collect data from all significant intersections and traffic points in order to obtain accurate and reliable results.
Figure 8 and
Figure 9 show graphical representations of the maps of Tangier and Casablanca, respectively, highlighting the locations of some of the selected nodes in each city. Ensuring that the nodes are distributed evenly across the city allows a comprehensive understanding of traffic patterns and congestion levels.
5.2. Factor Elements’ Selection in Both Cities
In this study, we considered the following elements when analyzing traffic patterns in both Tangier and Casablanca:
Number of schools;
Number of supermarkets;
Number of restaurants.
Manually determining the number of schools, supermarkets, and restaurants in each city would be a time-consuming and labor-intensive process. To automate this task, we developed a python-based Google Maps data scraper that can collect this information for both Tangier and Casablanca, as well as any other city around the world.
The data scraper not only provides the number of restaurants, supermarkets, and schools, but also their exact coordinates (longitude and latitude), the number of reviews, and the rating of each place. This information is valuable because the number of reviews and the rating can indicate if a place is frequently visited or not.
Figure 10 and
Figure 11 show some of the data collected using our scraper in Casablanca and Tangier, respectively.
In our research, we recognized that each element (number of schools, supermarkets, and restaurants) has a different value and impact on traffic patterns. Therefore, we determined the values for each element and included them in the formula used to match areas. This allowed us to accurately compare the characteristics of different areas and suggest the most efficient routes for travel.
The value of an element, V, is calculated using the following formula:
where QI is the quality importance of the element, and RI is the visit importance of the element.
The value of an element is determined by the rating and number of reviews it has received, with the quality and visit importance factors influencing the final value. This value is then used in the process of matching areas and suggesting the best routes for travel.
Congestion is often related to an increase in the number of visits to an element (such as a school, supermarket, or restaurant) during a certain time interval, T []. The quality of services offered by each element also influences the return rate of customers and the longevity of the services provided.
In our study, the time interval parameter T [] is an important factor for analyzing congestion levels. Therefore, we assigned a higher value (60%) to the visit importance (VI) factor than the quality importance (QI) factor (40%). This reflects the relative importance of the time interval and the frequency of visits in our analysis of congestion levels and suggestion of the best routes for travel.
The element value V is processed through a process called normalization in order to improve the accuracy and reliability of the data. Normalization involves formatting the data in a way that reduces anomalies and makes it easier to visualize and analyze.
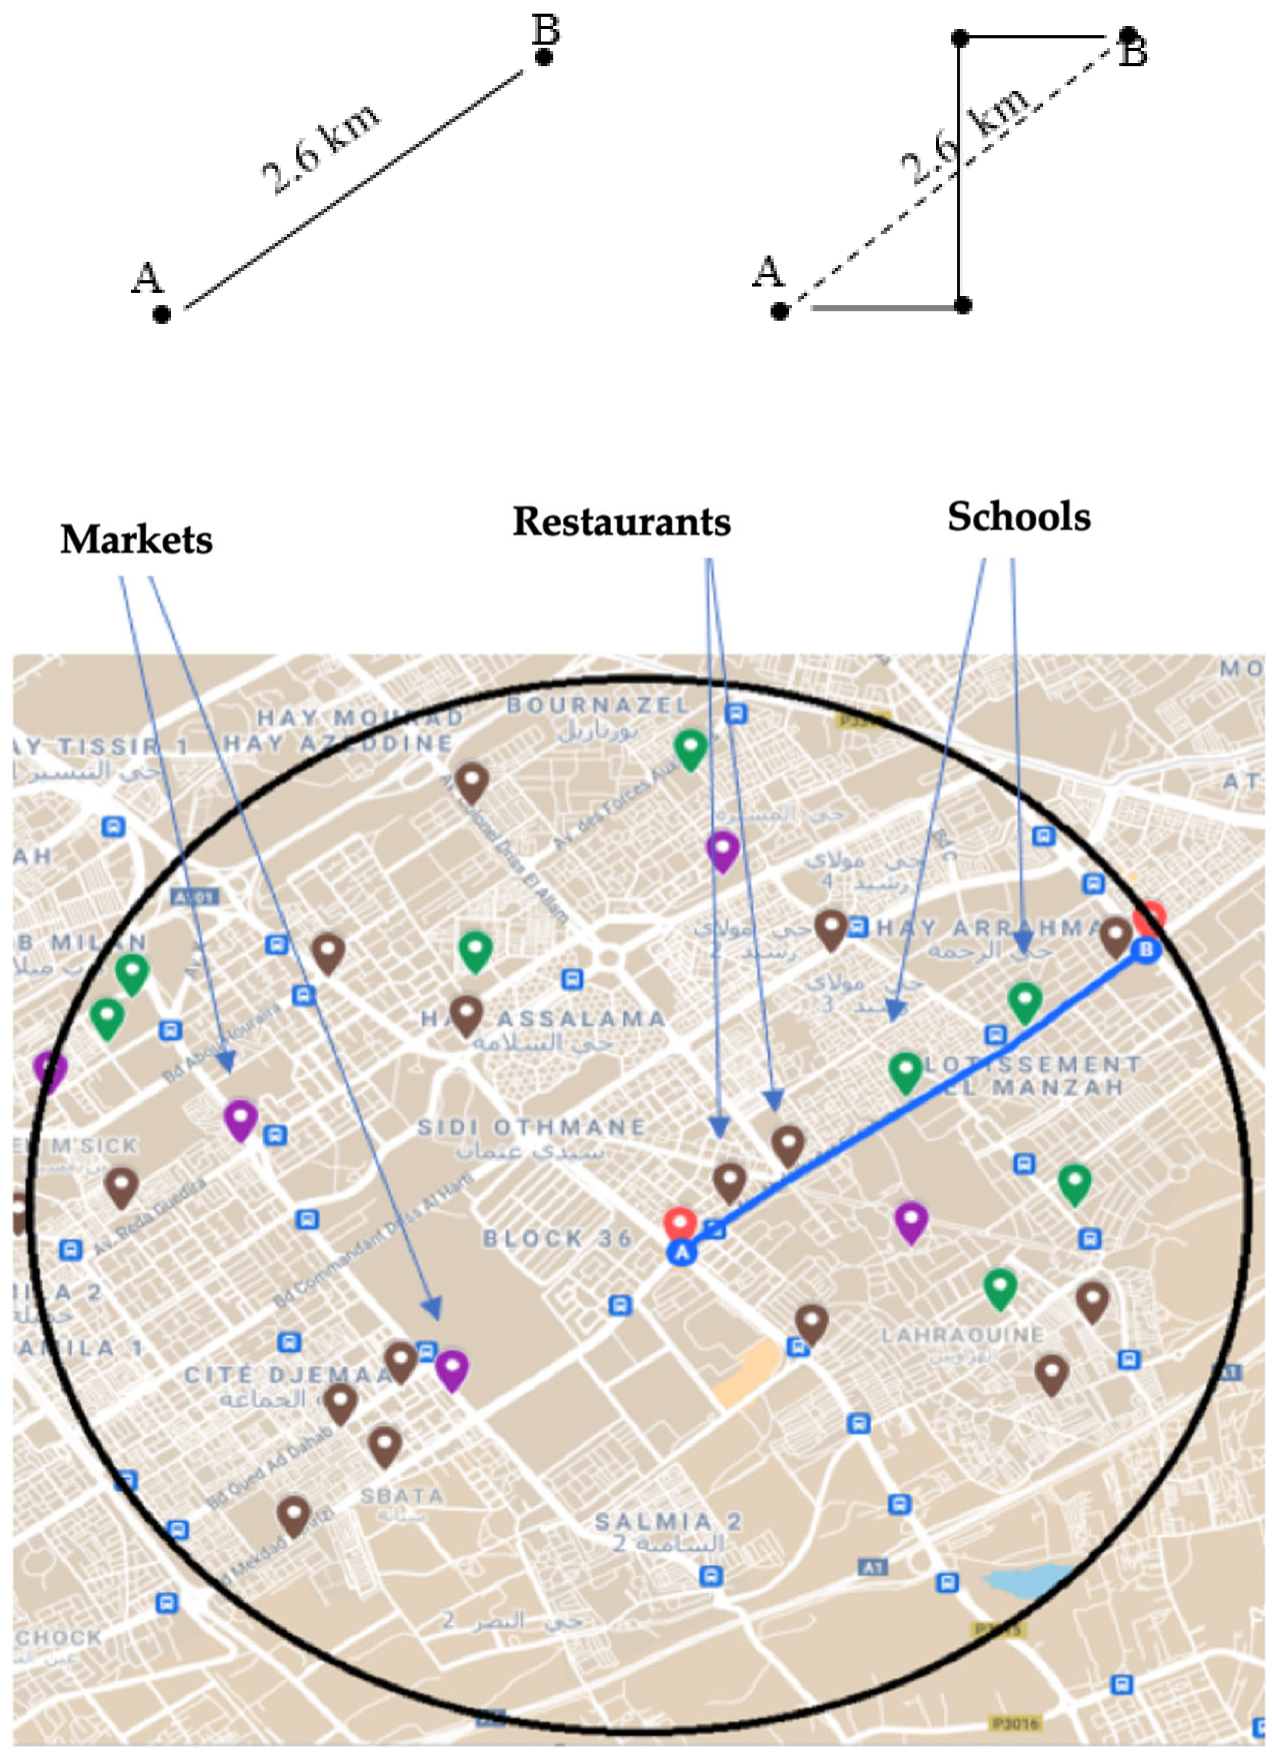
All schools, restaurants, and supermarkets in Tangier were mapped along with the nodes and their associated costs. An algorithm was used to compare the positions of these elements with previously recorded congestion data. The analysis revealed that areas with a higher concentration of schools tend to experience higher levels of congestion compared to areas with fewer schools but more restaurants and supermarkets. An impact factor value was then determined for each element to better understand the relationship between the presence of certain types of establishments and congestion levels in different parts of the city.
Figure 12 shows the impact that schools, restaurants, and supermarkets have on traffic flow.
The data were collected throughout the year, and the impact factor for each element was found to be variable depending on the time of year. For example, the impact factor for schools decreases to 25.8% during June and to 7.3% during the summer months (July and August) and on holiday periods. In contrast, the impact factor for restaurants tends to increase during the summer and holiday periods due to a higher number of visitors, estimated at 35.7%.
Special days, such as Christmas, are also taken into consideration. On these days, the impact factor for restaurants increases to 40.8%, the impact factor for supermarkets increases to 45.7%, and the impact factor for schools decreases to 13.5%. Another particular case that is considered is Ramadan, the holy month for Muslims, during which most restaurants in the country are closed during the day. As a result, the impact factor for restaurants decreases to 10.2% during the day and increases to 30.4% in the evening. These variations in the impact factors are taken into account to ensure that the developed algorithm works efficiently in all circumstances.
5.3. Area Determination
To extend the scope of the study to the city of Casablanca, we implemented a method of determining areas based on the source and destination routes of users. Specifically, when a user in Casablanca plans to travel from node A to node B, our algorithm calculates the distance between the two nodes using data that are specific to the city. Subsequently, the area in the studied city corresponding to this distance is identified and included in the analysis (
Figure 13).
Area Radius
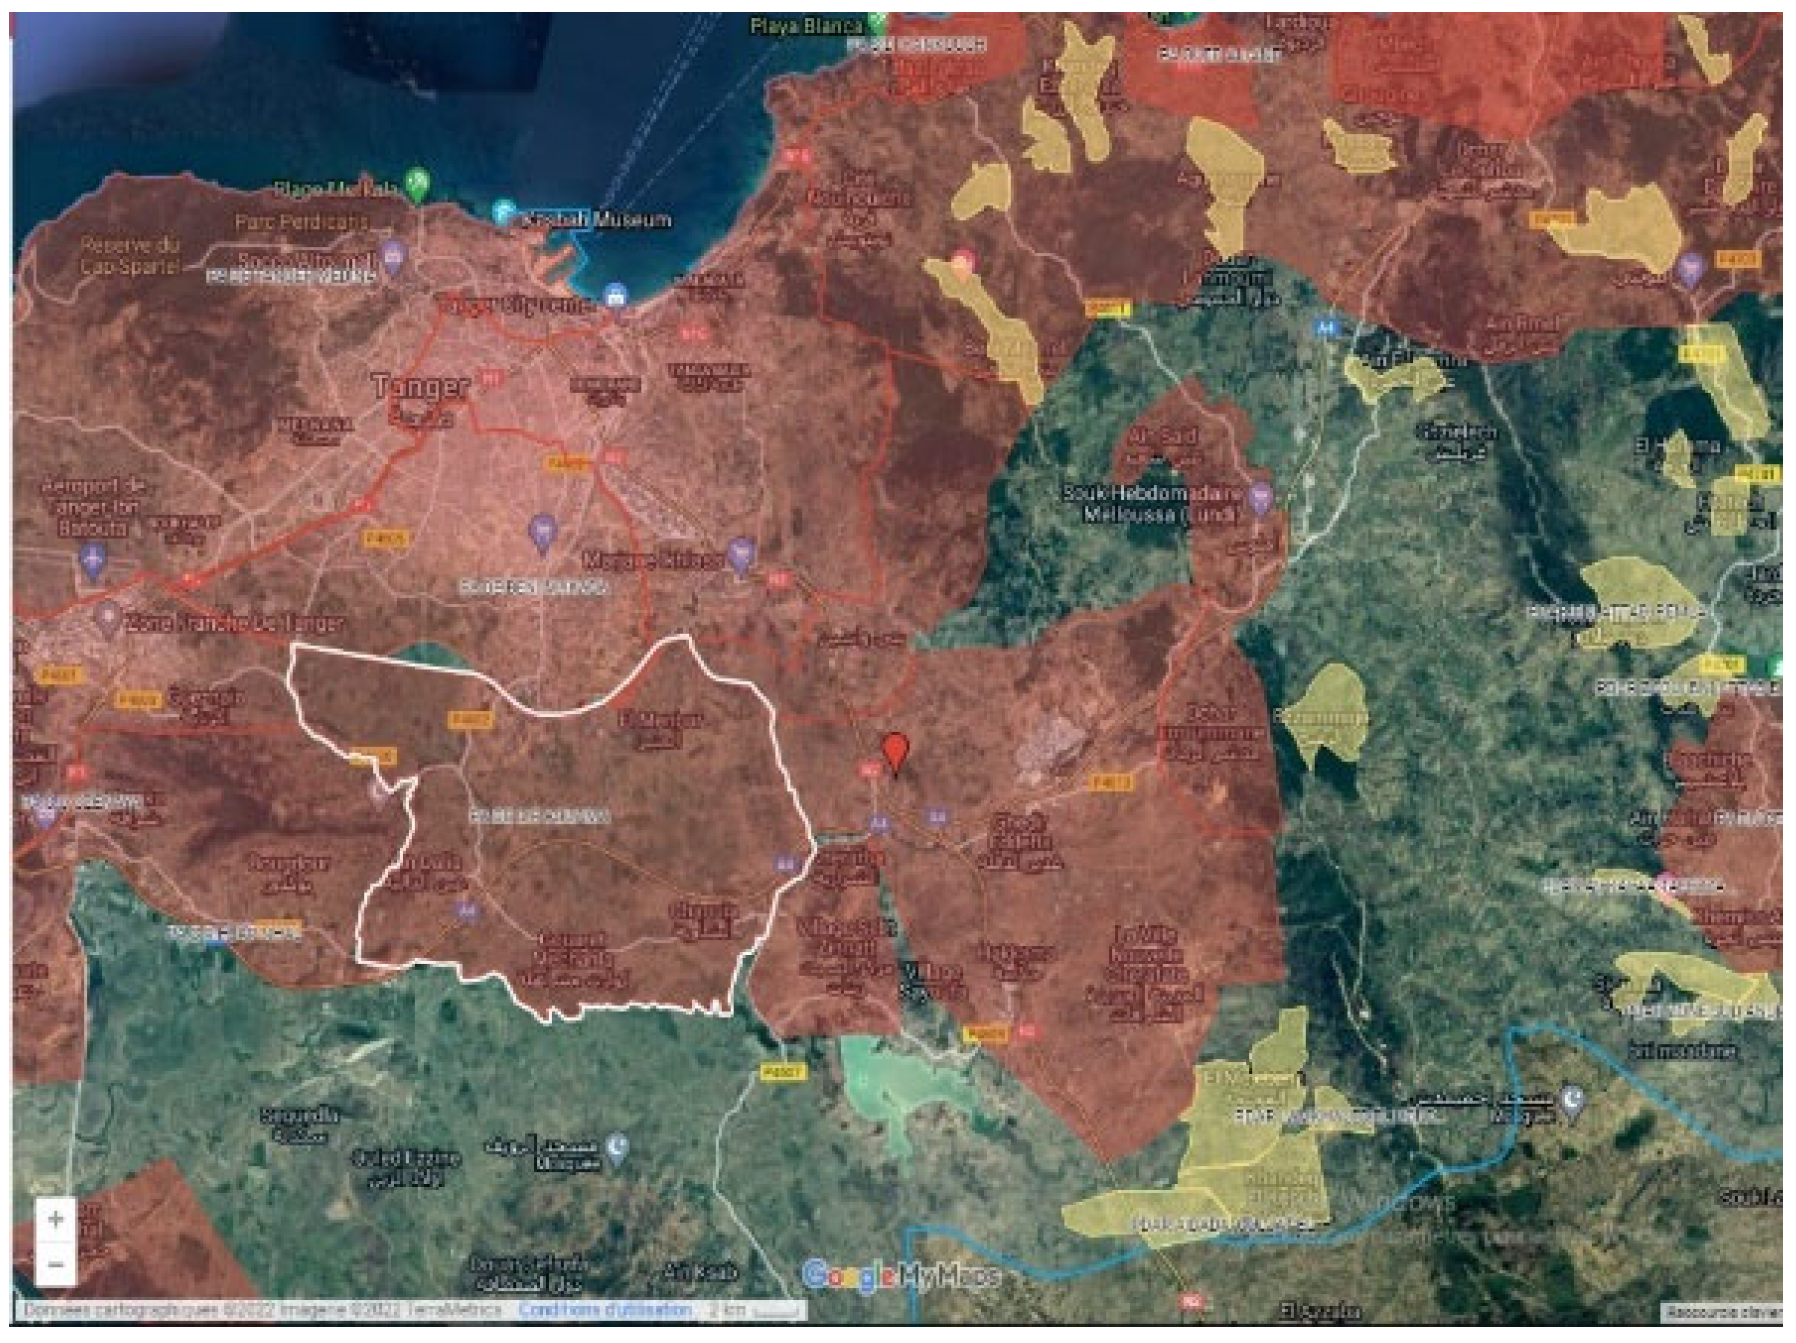
The distance between node A and node B is approximately 2.6 km, which represents the radius of the area under consideration. Whether the source node and the destination have a direct route connecting them or are connected through other nodes, the radius remains unchanged. This approach allows us to accurately analyze the traffic patterns and congestion levels within a defined area, regardless of the specific route taken by a user.
In order to identify the area more clearly, the algorithm uses the collected data to determine the number of schools, restaurants, and supermarkets that are located within this radius (
Figure 14).
5.4. Area Weight Calculation
Areas are referred to as study cases (SC) and are determined using the method described earlier. Upon receiving a user’s request, the algorithm automatically calculates the weight of the area using a predetermined formula:
with NI: node importance, FI: impact factor and EI: element importance.
In the process of matching areas, it is important to consider both the characteristics of the elements within the area and the architecture of the area as defined by the number of nodes. The latter factor is particularly important for determining the efficiency of the results and simplifying the matching process. Therefore, we assigned a value of 40% to the element importance (EI) factor and a value of 60% to the node importance (NI) factor in our analysis. This reflects the relative importance of these factors in the matching process and the accuracy of the results.
Using the data collected, the algorithm determines the following as shows
Table 7:
The number of nodes in the selected area.
The presence and element value (V) of schools, restaurants, and supermarkets in the selected area.
5.5. Matching Areas
In order to match the areas in Casablanca with those in Tangier, it is first necessary to identify the areas in Tangier. According to the data from the urban agency [
33], Tangier is divided into 12 zones. These zones serve as the basis for defining and analyzing traffic patterns and congestion levels in the city.
In order to collect data and define nodes, our study focused on four specific zones in Tangier where taxi drivers are permitted to operate. Within these four zones, smaller areas were defined based on their characteristics as shows
Figure 19, such as whether they are commercial or residential areas. This allowed us to more accurately analyze traffic patterns and congestion levels within these specific areas of the city.
Commercial areas are locations, districts, or neighborhoods in a city that are mainly composed of commercial structures, such as malls, office parks, downtown, central business district, financial district, “Main Street”, or shopping centers. The purchasing and selling of goods and services in retail enterprises, wholesale buying and selling, financial facilities, and a wide range of other purposes that are generically classed as “business” are all examples of commercial activity in cities. An area is considered to be commercial if a lot of businesses are grouped in the same perimeter. In Tangier only, more than 113 commercial areas was identified.
Low-density residential area (Villa areas):
Villa areas are residential urban areas intended for individual housing in the form of detached villas (5 to 10 res/ha), semi-detached villas (10 to 20 res/ha), strip villas (15 to 40 res/ha), and holiday residences made up of detached and/or semi-detached villas. These areas are characterized by their calm and low traffic. An area is considered to be a villa area if it contains a large number of villas. In Tangier, more than 110 villa areas were identified.
Medium-density residential area (Building area):
A medium-density residential area is characterized as an area that takes up 100 to 150 res/ha. It has a medium level of density in terms of habitants and commercial activities.
High-density residential area (Building and modern Moroccan house area):
A high-density residential area is characterized as an area that takes up 160 res/ha (modern Moroccan houses) to 250 res/ha (Medinas and neighborhoods of economic housing). It has a high level of density in terms of habitants and commercial activities.
The algorithm is used as follows (
Table 8):
If the weights of more than two areas match, we prioritize them according to the following criteria:
Number of nodes;
Element value (V) of schools;
Element value (V) of restaurants;
Element value (V) of supermarkets.
Based on the results shown in
Table 7 and
Table 8, we can determine that the SC1 area in Casablanca matches with the SG2 area in Tangier. By analyzing these results, we can also infer the type of the SC1 area (e.g., commercial or residential). This information allows us to more accurately compare and match the areas in the two cities and suggest the most efficient routes for travel.
5.6. Generating the Global Cost Matrix
The cost matrix as shows
Figure 20 and
Figure 21 below depends on the time parameter, and on each selected timeslot of the day, a matrix is generated.
5.7. Extract the SG (Sub-Graph) Matrix from the Global Cost Matrix
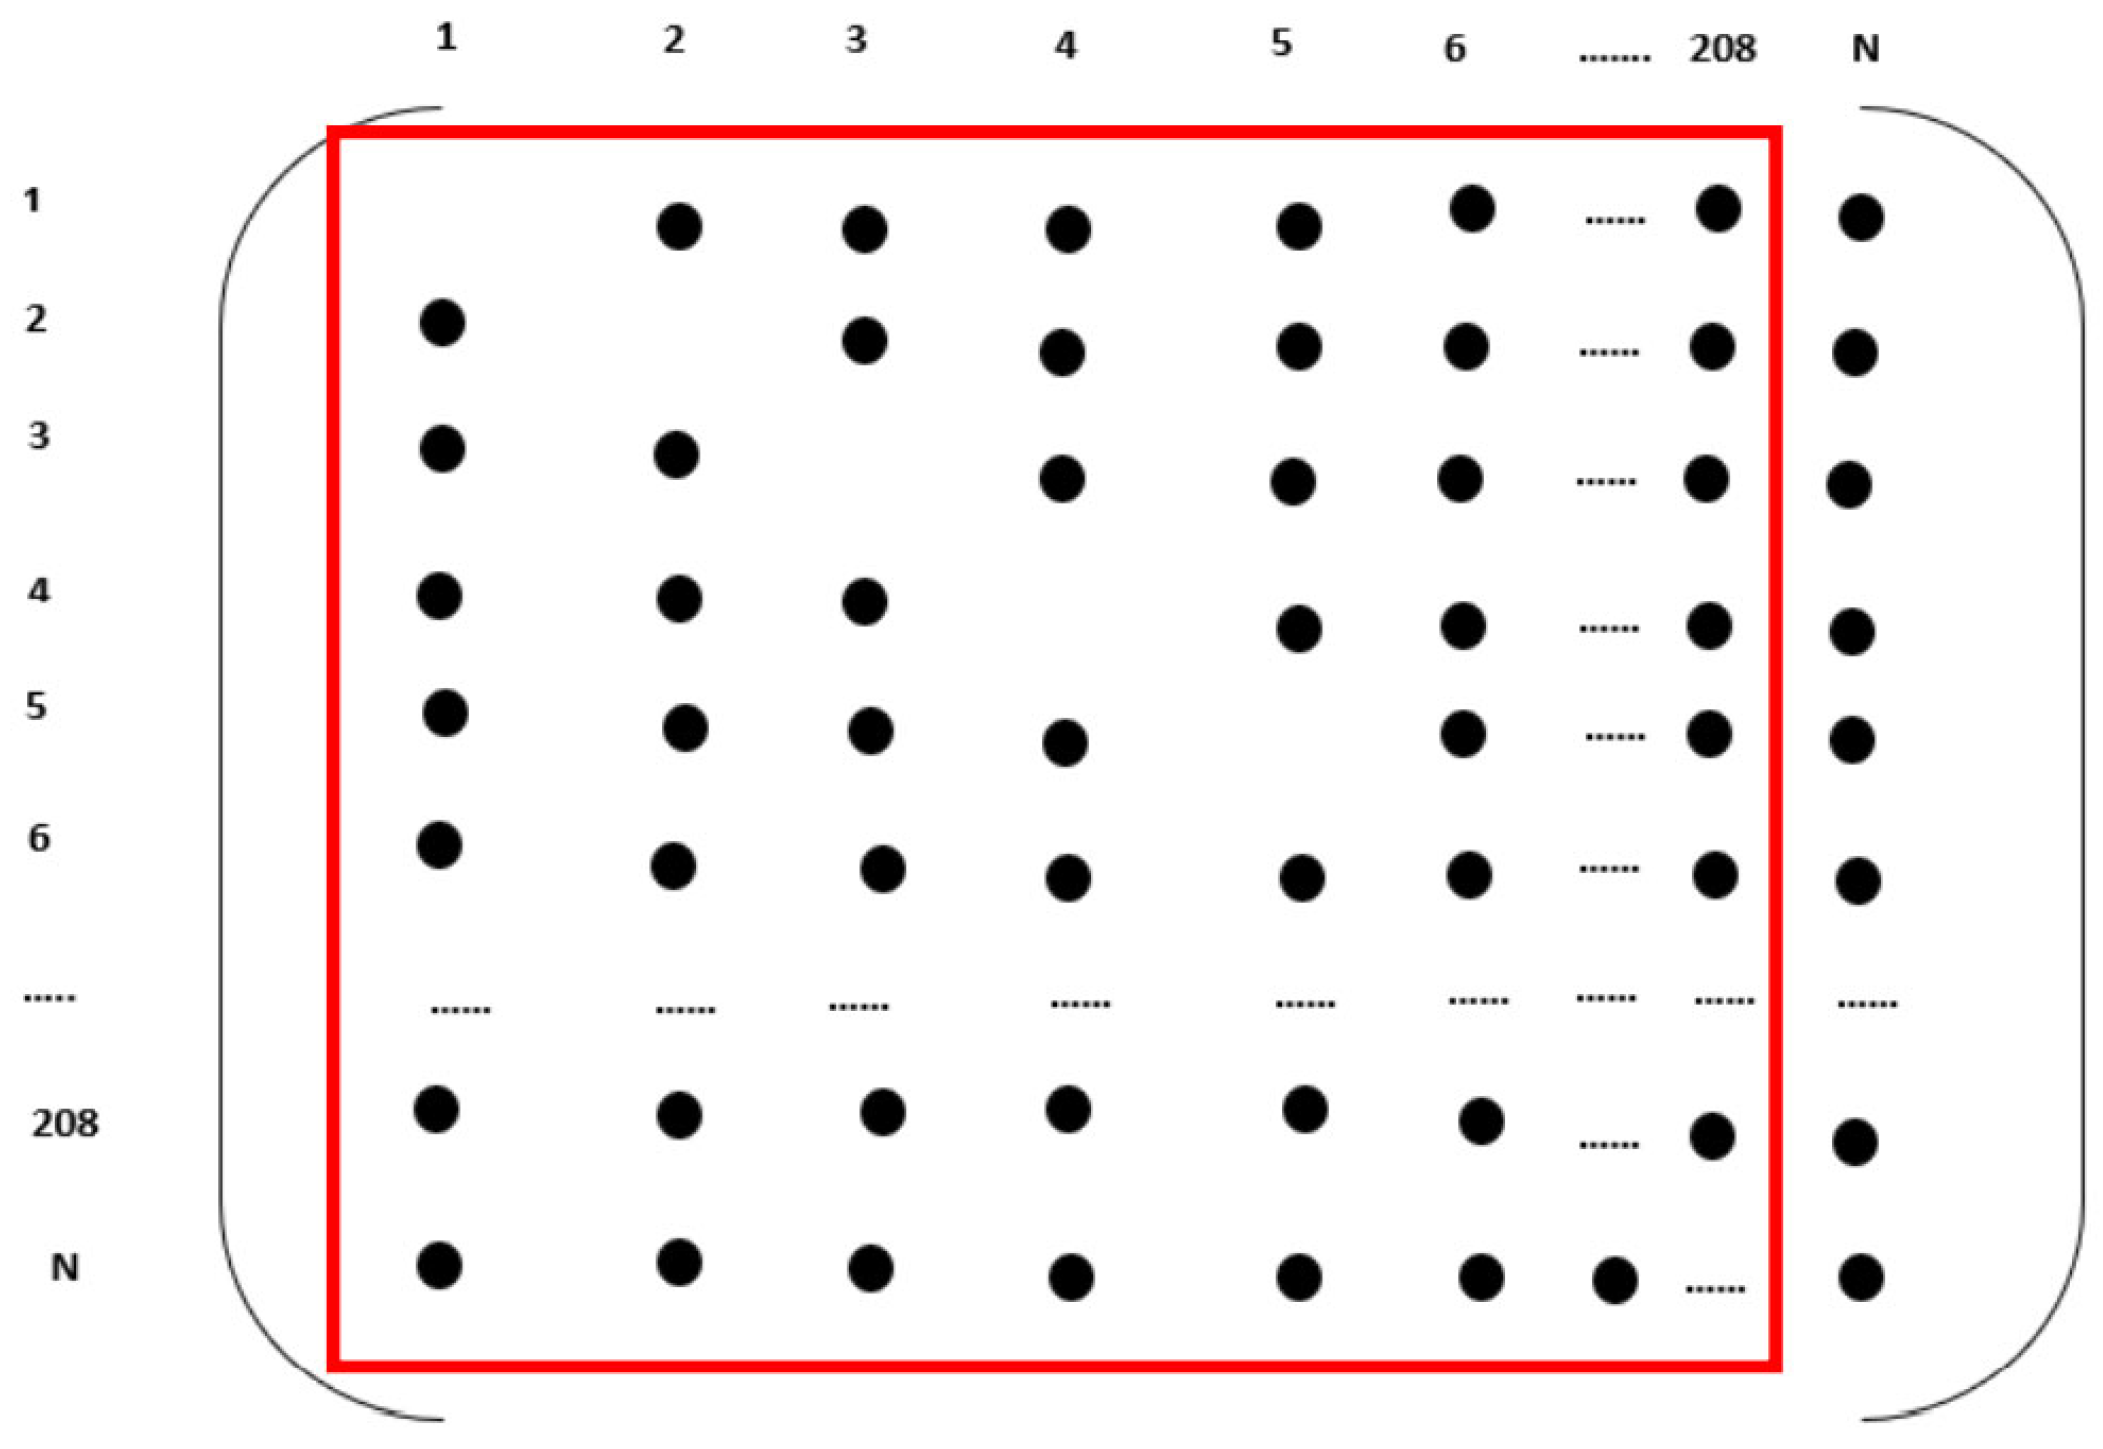
To initiate the matching process between the areas in Tangier and Casablanca, a comparison of the weights of their respective areas is carried out. At a particular timeslot (X), it is determined that the SG2 area in Tangier corresponds to the SC1 area in Casablanca. The SG2 area, consisting of nodes 1 to 208, can be depicted as shown in
Figure 22.
5.8. Mapping SG2 on SC1 and Matching Nodes
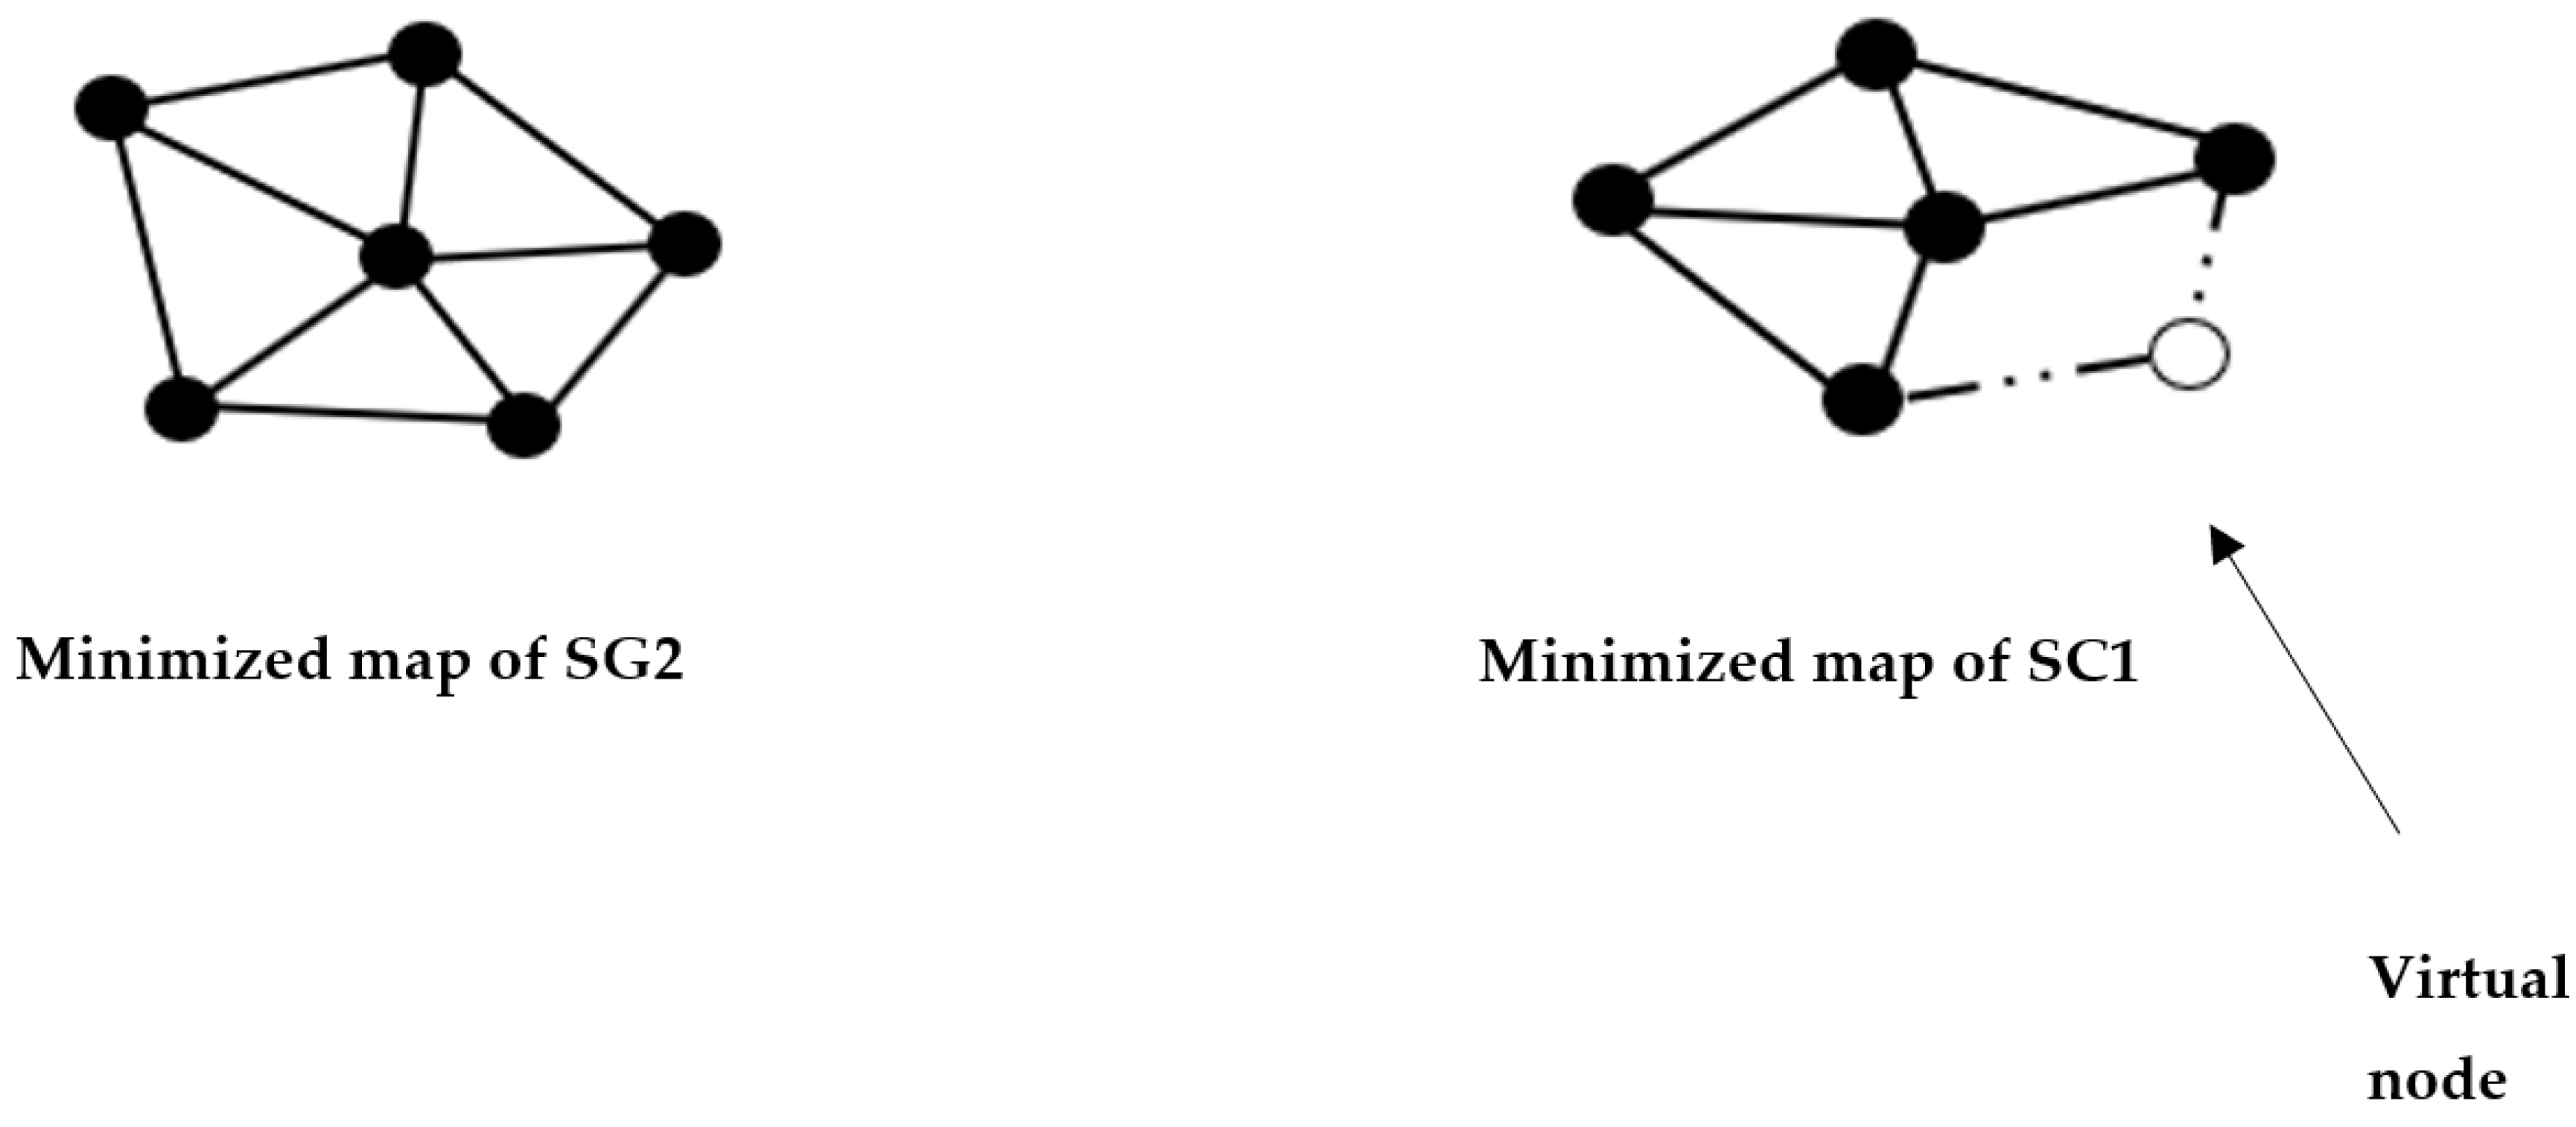
Case 1: Number of nodes from SG is higher than SC:
The SG2 and SC1 areas were determined to have approximately the same weight. While the SG2 area contains 208 nodes, the SC1 area has only 200 nodes. For the purpose of simplicity, in the representation below, we assumed that the SG2 area has six nodes and the SC1 area has five nodes (
Figure 23):
In order to match each node in the SG2 area with a corresponding node in the SC1 area, we added a virtual node to the minimized version of the SC1 area to bring the number of nodes in the two areas to the same level. This allowed us to establish a projection of the cost of each node in the SG2 area onto the corresponding node in the SC1 area. In the actual version of the analysis, eight additional nodes would be added to the SC1 area in order to match it with the SG2 area.
Matching SG2 nodes with SC1 nodes:
In order to match node X from the SG2 area with node Y from the SC1 area, we take into consideration the following factors:
Type of node:
In this study, the nodes in all cities are classified into one of three categories:
Light intersection: an intersection with traffic lights that control the flow of vehicles.
Traffic point: a location with a high volume of traffic, such as a busy intersection or a roundabout.
Normal intersection (no light): an intersection without traffic lights, where vehicles are expected to yield to each other based on the rules of the road.
By accurately identifying the type of node, we can more accurately compare and analyze the traffic patterns and congestion levels in the two cities and suggest the most efficient routes for travel.
Number of exits:
In the data collection phase, along with the nodes’ positions, each node’s number of exits was extracted too. Node A in
Figure 24, for example, has four exits.
Number of entries:
In the data collection phase, along with the number of exits, each node’s number of entries was extracted too. Node A in
Figure 24, for example, has four entries.
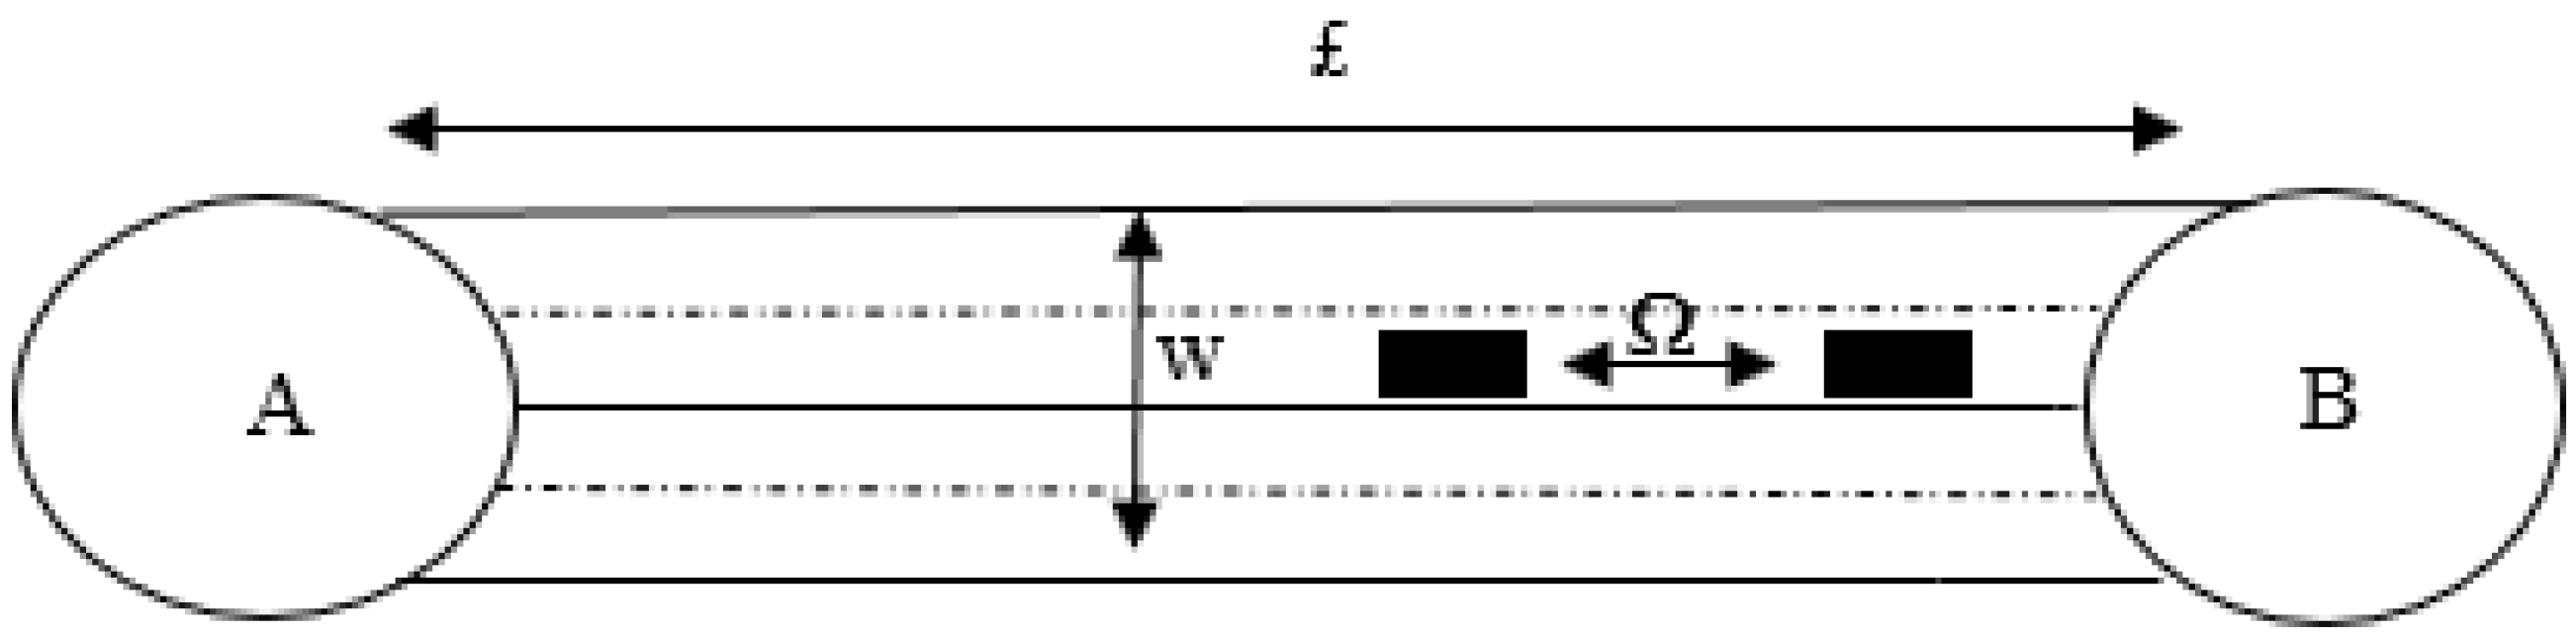
Maximum occupancy:
Each node has a different number of exits and entries, and the density of the roads leading in and out of the node’s radius can impact congestion levels. The road density is calculated in the worst-case scenarios, taking into account the distance between two vehicles (denoted by Ω), the width of the road (W), which determines the number of lanes, and the length of the road (£). In urban areas, a standard lane is approximately 3 m wide. Higher road densities generally result in lower levels of congestion (
Figure 25).
The maximum occupancy of a road is estimated based on its width and length, as well as the number of exits and entries. For example, the width of road [A, B] is 12 m, which indicates it has 4 lanes. In the worst-case scenario, the distance between vehicles (Ω) is assumed to be 1 m, and the length of the road (£) has already been extracted in the data collection phase. Using these factors, we are able to accurately estimate the maximum occupancy of a road and understand its impact on congestion level.
Considering the average car length is 4.6 m [
34], the maximum occupancy is calculated using the following formula:
In the [A, B] case, the total maximum occupancy that will be used in the weight formula is equal to the maximum occupancy × 4 (four lanes).
Using the node’s type, number of exits, length of exits, and the road’s maximum occupancy, the algorithm calculates the weight of each node as follows:
where
α: importance of node type;
β: importance of number of exits;
µ: maximum occupancy importance.
In this study, we calculated the weight of each node using a specific formula that takes into consideration the type of node, the number of exits and entries, and the maximum occupancy of the roads leading in and out of the node. The resulting weights were then arranged in a list in descending order, with the node that had the highest weight placed at the top. This process was performed for both SC1 and SG2 (
Table 9 and
Table 10).
The algorithm utilizes the list of nodes sorted by weight to match each node in SC1 with the corresponding node in SG2. If two nodes have similar weights, the algorithm assigns one of the nodes from SC1 randomly to one of the similar nodes from SG2.
Case 2: Number of nodes from SG is smaller than SC:
In this research, the process of matching areas involves comparing the weight of two areas, study case (SC) and sub-graph (SG). If the weight of SC and SG are approximately equal, the algorithm proceeds to match the nodes of SG with the nodes of SC. However, if the number of nodes in SG and SC are not equal, the algorithm either adds virtual nodes to SC or selects unmatched nodes as shows
Figure 26 from SC and matches them with nodes from the same area using similarities in terms of node type, number of exits, number of entries, and road maximum occupancy. This method is used to accurately match the nodes of SG with the nodes of SC, allowing for an efficient suggestion of the best road to take in a certain area at a specific time.
5.9. Determining the SC Matrix
The formula used for cost calculation (
Figure 27) is as follows:
To determine the cost of the road between nodes i
1 and j
1 in SC, the algorithm uses information about the road’s length and width, as well as the average speed inside urban areas, which is assumed to be 40 km/h. Assuming a road’s length of 1.2 km, the algorithm calculates the cost of this road as follows:
The new matrix for the study case is created by including the cost of traveling from node 1 to node 208, while omitting the costs of the virtual nodes as shows
Figure 28. The cost for each real node in SC1 is accurately determined before generating the new matrix (
Figure 29).
5.10. Path Determination Algorithm
The algorithm used for the global map of Tangier is also used for the study cases of other cities. A cost matrix API was created to generate the best route based on the input of the source and the destination as shows
Figure 30, just like the previous algorithm.
6. Evaluation of the System
To evaluate the performance of the developed system, we implemented an accuracy rate module in the mobile application where users can rate the accuracy of the suggested routes after reaching their destinations.
This module allows users to rate the accuracy of the route prediction after they have chosen a route and reached their destination. The module presents the user with four options: “Very accurate”, “Somewhat accurate”, “Not very accurate”, and “Not accurate at all”.
By collecting this feedback, we can calculate the overall accuracy rate of the system for both the city of Tangier, where data were collected from taxi drivers, and the city of Casablanca, where the expansion model was applied. This allows us to not only evaluate the effectiveness of the system in each city individually, but also to compare the performance of the expansion model to that of the model for Tangier.
Below are two tables showing the user feedback for each city.
The dataset of the Tangier city:
| User | Accuracy Rate |
| User1 | Very accurate |
| User2 | Somewhat accurate |
| User3 | Not very accurate |
| User4 | Very accurate |
| User5 | Not accurate at all |
| User6 | Somewhat accurate |
| User7 | Very accurate |
| User8 | Not very accurate |
| User9 | Very accurate |
| User10 | Somewhat accurate |
| … | … |
The feedback for the Tangier model is as follows:
Very accurate: 30%.
Somewhat accurate: 50%.
Not very accurate: 15%.
Not accurate at all: 5%.
Based on these results, we can see that the model for Tangier has an accuracy rate of 80% (30% + 50%).
| User | Accuracy Rate |
| User1 | Very accurate |
| User2 | Somewhat accurate |
| User3 | Very accurate |
| User4 | Not very accurate |
| User5 | Very accurate |
| User6 | Somewhat accurate |
| User7 | Not accurate at all |
| User8 | Somewhat accurate |
| User9 | Very accurate |
| User10 | Not very accurate |
| … | … |
The feedback for the Casablanca model is as follows:
Based on these results, we can see that the model for Casablanca has an accuracy rate of 75% (35% + 40%).
7. Conclusions
Congestion is unavoidable in metropolitan environments, especially at times of peak demand, and may even be desired, within certain boundaries, because the expenses it incurs are less than those required to eliminate it entirely. Attempting to eliminate traffic congestion entirely would incur expenses, including those associated with road capacity expansion investments, which may outweigh the costs associated with moderate levels of congestion, and those resulting from the redirection of users to other routes, modes of transportation, or travel periods.
Furthermore, under-utilization of available road space results in a loss of societal benefits, and it should not be forgotten that congestion is the result of human activity, which, despite the congestion it causes, provides benefits to those who make the journeys in question. Naturally, a city with a low level of activity will not experience congestion. It is, therefore, not a question of attempting to entirely eradicate traffic congestion, as this is either impossible or ridiculously expensive, and it may not even be desired. The most important thing is to keep traffic under control, since if it worsens, it will have a negative impact on the long-term viability of large cities.
Our study’s major goal is to assure that our solution will help reduce pressure on certain nodes in specific time slots and assure the well-being of people living in congested areas. To do so, we first established a working model in one city and then expanded the model to another Moroccan city with similar roads and infrastructures. The development of computer science and the availability of big data have led researchers to apply different models in this field, and most of these solutions have either failed to predict traffic congestion in the right way or do not provide drivers an easy platform to use to avoid congestion. The results here are very interesting as users could benefit from this application by getting the best road to travel at any time. Furthermore, this application could be used offline with a possibility of updating data each time a user goes online. The current model works based on the data collected from various taxi drivers using a mobile app, and this could be changed in the future by collecting data in new cities using the Ezzi-traffic application.
Based on the results and the user feedback, the developed model for route prediction in Tangier has a higher overall accuracy rate compared to the model for Casablanca. The model for Tangier has an accuracy rate of 80%, while the model for Casablanca has an accuracy rate of 75%. This difference in accuracy might be due to a variety of factors, such as differences in road network, traffic patterns, and other variables that could affect the accuracy of the model.
One potential explanation for the higher accuracy rate in Tangier could be that the model was trained on a larger dataset of taxi trajectories from the city, allowing it to better learn the patterns of traffic flow and congestion.
On the other hand, the model for Casablanca was expanded from the model for Tangier and might not have had as much data to work with in order to accurately predict traffic conditions in the city.
This research is considered to be innovative due to the combination of real-time data collection and prediction capabilities, as well as the ability to expand the study to other cities using a systematic method for matching areas and suggesting routes. It provides a unique and innovative solution for predicting traffic conditions in urban areas, which can be useful for drivers, city planners, and policy makers in improving the efficiency and safety of transportation systems.
Overall, the results suggest that both models perform well, with the model for Tangier having a slightly higher accuracy rate. Further research and analysis should be conducted to better understand the factors that contribute to the accuracy of the models and to identify potential ways to improve their performance.


