Article

Proposal of a Model for the Analysis of the State of the Use of ICT in Education Applied to Technological Institutes of Higher Education

by
William Villegas-Ch.
1,*,
Santiago Jácome-Vásconez
2,
Joselin García-Ortiz
1,
Javier Calvache-Sánchez
2 and
Santiago Sánchez-Viteri
3
1
Escuela de Ingeniería en Tecnologías de la Información, FICA, Universidad de Las Américas, Quito 170125, Ecuador
2
Departamento de Investigación e Innovación, Instituto Tecnológico Universitario ISMAC, Quito 170184, Ecuador
3
Departamento de Sistemas, Universidad Internacional del Ecuador, Quito 170411, Ecuador
*
Author to whom correspondence should be addressed.
Computers 2022, 11(7), 112; https://doi.org/10.3390/computers11070112
Submission received: 8 June 2022 / Revised: 22 June 2022 / Accepted: 3 July 2022 / Published: 8 July 2022
(This article belongs to the Special Issue Interactive Technology and Smart Education)

Abstract

:
The inclusion of information and communication technologies in education has become a priority for all educational models, particularly for higher education institutes that have observed the need to integrate these technologies in the classroom. However, to guarantee educational quality and learning, establishing a process that allows the identification of the response of the students towards its use is necessary. For this purpose, there are several works that address the issue and have determined the functionality of these technologies, but each environment is different, and this is recognized by the higher education institutes of Ecuador that have limited economic, technological, and academic resources. This work seeks to create a method that allows the needs and doubts of students about the use of educational technologies in the classroom to be established without affecting their academic performance. To perform this, a process has been designed that identifies learning needs through the validation of data obtained from surveys and a comparison of two groups of students, in which one group makes use of technologies in the classroom and the other group uses a model of traditional education. By obtaining the results of the analysis, the method determines the impact of technology on learning.

1. Introduction

Currently, society is experiencing a change in the way it carries out its activities, and this is mainly due to the pandemic caused by the coronavirus disease 2019 (COVID-19) [1]. COVID-19 has brought many consequences for people and their organizations, and most of these have been disastrous and full of desolation due to the loss of life. However, the consequences are still present, and they are visualized in the economy and in education, in the affective part and the psychological part [2,3]. These fields include some that have greater relevance to people’s lives and where a large amount of scientific work has been focused. The same fields generate detailed analyses of the consequences of the pandemic in the period of isolation and beyond it where isolation or quarantine were tools that governments used to somehow avoid a higher level of contagion [4]. Other studies focus on analyzing the consequences of the pandemic in a new reality in which restrictions have been lifted and health measures have been relaxed.
The field of action of this study is limited to the field of education and takes the new norm as a reference. Education has been one of the fields most affected by COVID-19, since at the beginning of it, the academic system applied, as a first step, the suspension of all face-to-face activity and used information and communication technologies (ICT) to provide continuity to its activities [5,6]. To respond to the needs of the student population, ICT were integrated into the educational environment and content platforms, learning management systems (LMSs), video conference platforms, etc., were generated or updated, with the aim of adapting to remote education. The adaptability of ICT during the pandemic has become a starting point for educational institutions, and they have defined the next stage in the way they generate their educational models [7].
The influence of ICT in education is not new, however, as several institutions and students, even before the pandemic, viewed the face-to-face education model as the best environment for the development of learning. This has currently been re-evaluated with the use of technology in the classroom. This work was developed in Ecuador, where there is a group of educational institutions that have viewed ICT as an advantage for their educational model [8]. This group includes higher technological institutes, and their academic program is based on a degree that takes a period between 2 and 3 years for completion, unlike engineering, which takes between 4 and 5 years to graduate. This represents a competitive advantage for a specific population of students who have specific needs in relation to study time, schedules, and costs.
The students who generally take advantage of this study model are people who work a full schedule and require schedules that fit their work and family life. In addition, another parameter that influences the integration of these models is the age of the students, which is a large percentage higher than the age of the students who are enrolled in engineering or bachelor’s degrees. Technology degrees in Ecuador have become an option desired by the population, including those who require a degree for their personal and professional growth, and these technologies are regularized by the corresponding government entities of the country. Therefore, these models go beyond a rapid degree program; on the contrary, they respond to a complete educational model based on specific themes that provide the student with the necessary knowledge to put it into practice in the community. However, the institutions that offer this educational model generally do not have all the resources that a university has, both economically and technologically, and in its academic structure, most teachers are employed on hourly class contracts [9,10]. The last point indicated marks a key difference with other educational institutions, since, by having a minimum of full-time teachers, the evolution and updating of academic curricula and research on the needs of students are basic or deficient.
With the pandemic, technology institutes have used ICT to meet the needs of their students and to improve their educational model, making it more appealing to the generation of new professionals with an education that suits their needs. However, including ICT in this educational model represents a greater challenge in relation to universities. Among the main reasons are the previously mentioned resources and the availability of students for the acquisition and management of ICT [11,12]. This work proposes the design of a framework that allows identifying the responses of the students of technology with respect to the use of ICT as educational tools. To meet this objective, student data are acquired by conducting surveys; in addition, a comparison of learning is made in two groups of the same career. The comparison consists of activities proposed during a period of 7 weeks in which one group works these activities with the use of ICT and the other group works with traditional methods. With the results obtained, creating an academic model based on the use of ICT that guarantees student learning is proposed.
This work is divided into the following sections that have been considered key to achieving the proposed objectives: Section 2 defines the method used in the investigation; Section 3 presents the results obtained from the analysis; Section 4 presents the discussion of the results obtained with the proposal of an analysis model for the application of ICT in education; Section 5 presents the conclusions found in the development of the work.

2. Materials and Methods

The method is composed of two stages: in the first stage, a process is carried out to identify the feelings of the student population about the inclusion and use of ICT as educational tools. In the second stage, a comparison is made on the use of ICT in the classroom and a case is presented with two parallel groups where several activities are proposed, where the groups of participants will develop them with and without the use of ICT and then move on to a data analysis model that identifies the state of learning and the implications of ICT in education [13].

2.1. Identification of the Problem

Education is a sector that, by concept, admits the use of technologies; even within its planning, the teaching of ICT is established as a necessary tool in the application of various subjects. However, the new needs of students demand a change in the use of ICT, where these are included in a model attached to the student. Currently, educational models are immersed in a methodological change, with new resources that allow the progressive improvement of learning. In these methods, the teacher has a guiding role for the student and their activities depend on the use of ICT, to establish parameters previously not considered, such as motivation, innovation, and research by the student. In these new models, it is necessary to understand how the learner learns and what they want to learn. Technology makes it possible to create personalized learning models that adapt to the characteristics of the students. However, for some institutions, such as the one participating in this study, the integration of ICT in the classroom is a process that requires a greater effort given its nature and the resources available to them.
Technological institutes of higher education often have limited financial and educational resources and their use is vital to the improvement of education. In addition, the student population has very different needs from those of other institutions. This is one of the main problems that requires attention in the educational field, since, having a student population that does not have an adequate means or handling of ICT, it is impossible to speak of technological integration in education. Considering the educational population and the resources that exist in these institutions, it is necessary to generate a process to identify the students’ feelings regarding the use of ICT. However, the information that leads to the identification of the feeling must be real and effective since the process to be executed in the implementation of ICT in the classroom depends on it.
In addition to the validation of the instruments that allow obtaining information about the students’ feelings regarding the inclusion of ICT in their learning, it is necessary to create testing environments. These environments make it possible to establish variables that adjust the use of ICT in each educational environment, making adequate use of existing resources, as well as guaranteeing learning. From this problem, it is possible to identify the main objectives or questions to be answered with this work. In the first stage, we wish to know if a survey is an adequate instrument to obtain information from students that will allow us to define whether the inclusion of ICTs meets their needs. Once the validity of the instrument has been established, it is possible to answer students’ feelings about the inclusion of ICT in their learning. In the second stage, it is necessary to define whether there is a gradual change in learning with the use of ICT, for which it will be important to make a comparison between two groups, one focused on learning with a traditional model and the other oriented to the inclusion of ICT.

2.2. Review of Previous Works

The review of previous works has been divided into two groups. The first group includes works that approach the creation of academic resources in a pedagogical context. The second group includes works that analyze the viability of the use of ICT in education based on the new needs of the student body.
The first group of papers reviewed takes the educational model from the point of view of the creation of new pedagogies, competencies, and teaching profiles. The works that emphasize this proposal have ICT as the main actor and point out that they should be used to make the student’s experience more attractive and capture their interest in learning. In addition, the basis of the proposal they make takes as background that the duality of ICT in education is an opportunity to optimize learning time [14,15]. The contribution of these works to our proposal is mainly because, when moving from a traditional educational model to a model that includes ICT in its execution, a change in pedagogy is necessary. In the design of the new pedagogy, the implementation of innovative strategies that motivate creativity and generate inclusive education is proposed [16,17]. Therefore, teachers should be accompanied and trained to be part of this educational model, developing new learning skills, and taking advantage of technologies to be a motivating channel for the student [18].
The second group of reviewed works proposes several data analysis architectures; their purpose is to determine the factors that affect learning in an educational model that uses ICT as a fundamental element of learning. In these works, the main success of education expressly depends on the connection between the learner’s feelings and an educational modality governed by technology [19,20]. Here, interaction with teachers and other students is reduced to a minimum, generating a greater emphasis on self-learning. The proposed architectures use analysis techniques that allow the identification of patterns in the data of students, teachers, and areas involved in education [21,22]. The analysis of the data seeks to give value and generate knowledge about them, with this knowledge it is possible to explain the phenomenon to determine the degrees of incidence that various factors in education have with the use of ICT.

2.3. Identification of the Feeling in the Use of ICT as Educational Tools

In Figure 1, a flow chart is presented with the stages that are part of the analysis to identify the students’ feeling about the use of ICT. This is defined by five phases that are responsible for a specific task in this stage.

2.3.1. Population Identification

This work is developed in a higher technological institute in Ecuador that offers 10 careers in the on-site modality. It has a population of about 1200 students and 95 persons, between administrators and teachers, who supervise the management of academic quality and the verification of student learning achievement.
The analysis is carried out in the administration career. This selection is made considering that the institute has determined to create a pilot plan where this career is included. In addition, it has the largest number of students, with a total population of 360. However, the 2021 cohort has been chosen for the pilot plan, considering that the students of this cohort started their studies using distance learning during the pandemic and the 2022 period is face-to-face. Therefore, this group has already gone through an experience with the use of ICT in education. This cohort includes 75 students who are part of the study. Another factor why this career has been selected is the age of the students, where more than 50% of the students are over 40 years old. This is a factor that can be considered as a limitation for the use of technologies, as well as the fact that the availability of study time is limited by their work activities. To properly structure the surveys and the participating students, equation 1 has been applied to the total population, which refers to the calculation of the most representative sample, to give greater validity to the proposed prototype [23]. This means that to consider a survey valid, the minimum number of participating individuals must reach the result stipulated in the equation.
The variables and data of the equation are the following:
n = N * Z 2 * p * q e 2 * ( N 1 ) + Z 2 * p * q
where:
  • N = Population size: 75.
  • Z = Confidence level: 1.960.
  • p = Percentage of the population that has the desired attribute: 50%.
  • q = Percentage of the population that does not have the desired attribute: 50%.
  • e = Maximum accepted estimation error: 3%.
Substituting the values, we obtain that the finite sample size is 70.14, which means that there must be at least 70 students taking the survey to consider it a valid tool and that it defines the most representative sample for the study.

2.3.2. Survey Preparation

The objective of the surveys is to obtain data to determine the factors that affect learning when ICT are used as educational tools. For this purpose, several questions have been generated that are aligned with variables that can be analyzed and are the product of the review of similar works where the different needs of students have been identified. The reviewed works establish that to guarantee the veracity of the answers, the surveys must be objective and must comply with certain guidelines that prevent the respondent from losing motivation in the development of the survey. Therefore, a test-type survey is considered adequate when it contains fewer than 20 questions [24]. In this work, 13 general questions have been considered and their results can be analyzed to define which of the variables has the greatest influence on the explanation of the phenomenon studied [25,26].
The variables are listed below:
  • Usability of ICT.
  • Technological resources.
  • Disadvantages.
  • Training.
The survey questions are designed to obtain as much real information from the respondent as possible, so they should be clear, direct, and objective [27]. The response model is presented by levels of acceptance or rejection; in this way, the respondent does not generate a state of discomfort or discomfort that punishes the veracity of the answers. The questions that evaluate the variables have been worked considering the use of technologies, the inconveniences that the student perceives in their use, the availability of devices for the use of ICT, etc. In this group of questions there are four questions that are evaluated with a "Yes" or "No", these questions in the analysis are taken as complementary to the basic questions that allow the population, gender, and age to be defined [28].
  • Gender
    • Male/Female.
  • Age
    • Rating (20, 30]; (30, 40]; (40, 50]; (50, 60]; (more of 60).
  • Has used information technologies for their education (computers–cell phones–tablet–etc.)
    • Yes/No.
  • What skills do you have in managing IT?
    • I do not use, low, medium, good, very good.
  • You have the necessary tools to use technology in education at home.
    • I do not have, with limitations, sometimes, I have some, if I have.
  • From your perspective, how important is the use of information technologies in education?
    • None, little, necessary, important, very important.
  • Do you believe that technological resources can favor their learning?
    • Yes/No.
  • Select one disadvantage of technology platforms in education.
    • None, no support, lack of training, Internet access, outdated technology.
  • Which of the following activities do you enjoy the most with information technology?
    • Entertainment, social media, browsing, education, research.
  • How often do you use information technology in your education?
    • Never, hardly ever, occasionally, regularly, always.
  • Which of the following options do you consider to be a problem with the use of information technology in education?
    • Access to false information, danger of exposure of personal data, exposure to inappropriate content, decreased manual skills, risk of inequality and exclusion.
  • Do you consider that the excessive use of technology can affect your health?
    • Yes/No.
  • Would you like to receive training on this topic?
    • Yes/No.

2.3.3. Application and Data Acquisition

The design of the survey depends on the tools available in each institution, in addition to the skill of those in charge of programming the questions. Currently, there are online tools that facilitate this work, many of which even provide templates that can be used, if the objectivity of the questions is maintained. For the development of this survey, Google Forms has been used; the advantage of this tool and other similar ones is that they offer reports and graphs that facilitate the interpretation of the information.
With the survey developed, the application depends on the existing means in the institution. Currently, it is common to use LMS or academic systems in educational institutions [29]. For the method, it is recommended to link the survey directly to the institutional LMS and adequately track its development. In addition, if linked to the LMS, the time limit may vary depending on the need for information, usually a survey with the number of questions presented in the design and considering that the development time is less than 10 min, it can remain open for 7 days [30].
In the first stage of the analysis, the main objective is to determine the validity of the data acquisition instrument. To meet this objective, it is necessary to determine the number of surveys received, verify the information received and transform it, if appropriate. Table 1 shows an example of the type of data obtained in the surveys, these responses are those provided by the instrument; however, to perform the analysis it is necessary to transform these responses into numerical values and perform the corresponding calculations to estimate the correspondence between the variables.
Table 2 presents an example of the transformation of the answers, so that the survey can be analyzed. The answers are transformed into a scale from one to five, considering 1 as the lowest value that can be assigned to each criterion. For example, no driving = 1, poor = 2, average = 3, good = 4, very good = 5.

2.3.4. Tool Evaluation

To evaluate the effectiveness of the data acquisition tool, it is necessary to analyze the incidence of each variable in the study phenomenon. The proposed method uses factor analysis, which is a statistical analysis widely used to determine the validity of a survey. Factor analysis identifies the underlying variables or factors that explain the configuration of correlation in a set of observed variables. In other words, the main objective of factor analysis is to analyze the correlation between a series of variables to discover structures that are not directly observable. To this end, a reduction of the information provided by “p” observed variables is sought with the least possible loss of information.
As main components of the factor analysis to determine the validity of the survey, we have the correlation matrix. This matrix shows the Pearson correlation values, which measure the degree of linear relationship between each pair of variables. Correlation values can be between −1 and +1. However, in practice, items usually have positive correlations. If the two items tend to increase or decrease at the same time, the correlation value is positive. The interpretation of the correlation matrix evaluates the strength and direction of the relationship between two items or variables. A high and positive correlation value indicates that the items measure the same ability or characteristic. Table 3 presents an example of the correlation matrix, where all items are highly correlated with each other. Item 1 and item 2 have a positive linear correlation of 0.903. Item 1 and item 3 have a positive linear correlation of 0.867, while item 2 and item 3 have a positive linear correlation of 0.864. Therefore, these items appear to measure the same characteristic.
Another component that makes it possible to assess the goodness of fit or adequacy of the analyzed data to a factorial model are two statistics, the Kaiser–Meyer–Olkin (KMO) sample adequacy measure and the Bartlett sphericity test. The KMO is an index that compares the magnitude of the observed correlation coefficients with the magnitude of the partial correlation coefficients. Bartlett’s sphericity test tests the null hypothesis that the observed correlation matrix is an identity matrix. If the data come from a multivariate normal distribution, the Bartlett statistic is approximately distributed according to the chi-square probability model and is a transformation of the determinant of the correlation matrix. If the critical level (Sig.) is greater than 0.05, the null hypothesis of sphericity cannot be rejected and, consequently, it is not possible to ensure that the factorial model is adequate to explain the data. In Table 4, an example of the results of the calculation of KMO and Bartlett’s test is presented. According to the KMO concept that establishes the ranges of the coefficients as a significant set, the following is obtained: the closer to 1 the value obtained from the KMO test is implies that the relationship between the variables is high. If KMO ≥ 0.9, the test is very good; notable for KMO ≥ 0.8; median for KMO ≥ 0.7; low for KMO ≥ 0.6; and very low for KMO < 0.5.
The next component is the total explained variance calculation. Table 5 presents an example with values to detail its interpretation. In the analysis of the total percentage of variance explained, it is expected that, in the minimum cumulative total of the survey, it explains 50% of the phenomenon in the calculation of several components. In the example, this is not fulfilled since the variables included in the analysis explain the phenomenon in one component, but the cumulative percentage only reaches 26.670%. Therefore, with the results obtained so far, it is determinant that the instrument in the current conditions is not able to explain the phenomenon.
In this case, the method will be able to determine that the survey can explain the phenomenon studied. There are several complementary steps in the factor analysis, which are reflected in the results and whose objective is to determine the incidence of each question on education. If in the analysis performed, the instrument is not able to explain the phenomenon by 50%, the process must return to the survey design stage, make the corresponding corrections based on the incidence per question and continue with the next stage. On the other hand, if the instrument explains the phenomenon with a cumulative percentage higher than 50%, the next stage is continued, guaranteeing the effectiveness of the data acquired.

2.3.5. Results Presentation

In this phase, the results of the analysis are interpreted and presented, the fundamental objective of which is to identify the degree of incidence that each question has on the phenomenon under study. For example, the influence value of the availability of ICT devices that students have for the use of technologies in education. To determine these values, descriptive statistics are included in the analysis to determine the standard deviation of each survey question in relation to the total number of interactions corresponding to the number of surveys received. This statistical analysis includes the interpretation of the correlation matrix, the communalities, and the rotated components matrix. The results of this analysis make it possible to establish the most relevant questions for the study of the phenomenon. In addition, the method makes it possible to identify the questions that have less influence or do not contribute to the study and eliminate them so that they can be updated in the survey.

2.4. Comparative on the Use of ICT in the Classroom

The second stage of the method consists of the evaluation of activities in two different groups: in one of these groups the activities are used by ICT and in the other they are carried out in a traditional way. In Figure 2, the phases of the comparison on the use of ICT in the classroom are presented.

2.4.1. Identification of Activities

The identification of the activities depends on the group that participates in the study, for the comparison it is a priority that there is a group that uses ICT in the proposed activities and another that performs them in a traditional way. The groups of students considered for the method belong to the same cohort, so the proposed academic activities evaluate a similar subject matter and have been divided in relation to their parallel [31,32]. With this segmentation of the group, the management of the activities is facilitated, without additional burden on the teacher’s work. The activities that evaluate the use of ICT are specific within the course and what is sought with them is to measure the degree of learning without demotivation on the part of the teacher or the student.
According to the syllables that are an integral part of each course belonging to the technological institute that participates in this study, learning is evaluated through forums, questionnaires, and assignments. The assignments may include group work, playful games, remote talks or conferences, mental maps, creation of comics, etc. In groups, the use of the institutional LMS is mandatory, since this system is used as the main repository for grades [9,33].

2.4.2. Analysis of Data

The data is obtained directly from the LMS, and the analysis model used in each case will depend on the volume of existing data. In this case, since it is data that represents a direct rating, it is not necessary to establish a process for cleaning or granular transformation of the data [34]. However, if the volume of data is high and data is extracted from various sources, it will be necessary to include a more efficient data extraction, transformation, and loading (ETL) process in the model [35,36]. If this is the case, it is possible to use an analysis process similar to that used in business intelligence, including concepts such as data mining or online analytical processing cubes. With the use of this tool, even higher technological institutes are provided with a system capable of evaluating learning and making decisions efficiently and that guarantee results [37,38].

2.4.3. Decision on the Use of ICT in the Classroom

In this phase, the results obtained in the data analysis are interpreted. If there is acceptance of the use of ICT by the students and this is reflected in their learning, the results are presented to the department in charge of academic quality, so that a comprehensive process is established in the use of ICT in the educational model. Otherwise, the institution will initiate a training process in the use of ICT and educational platforms, both for teachers and students [39,40,41].

3. Results

For the evaluation of results, the method is applied in a case study at the higher technological institute that participated in this study. In the design of the method, general data of the population that is part of the analysis has been mentioned, as well as the design of the survey; therefore, the application of the case study is part of the application and acquisition of data.

3.1. Identification of the Feeling in the Use of ICT as Educational Tools

To identify the feeling of students towards the use of ICT, the 2021 cohort has been taken and divided into two groups. The segmentation has been made based on two existing parallels, the first group is called parallel “A” and consists of 38 students. In parallel “B” there are 37 students, reaching a total of 75 students in the cohort.

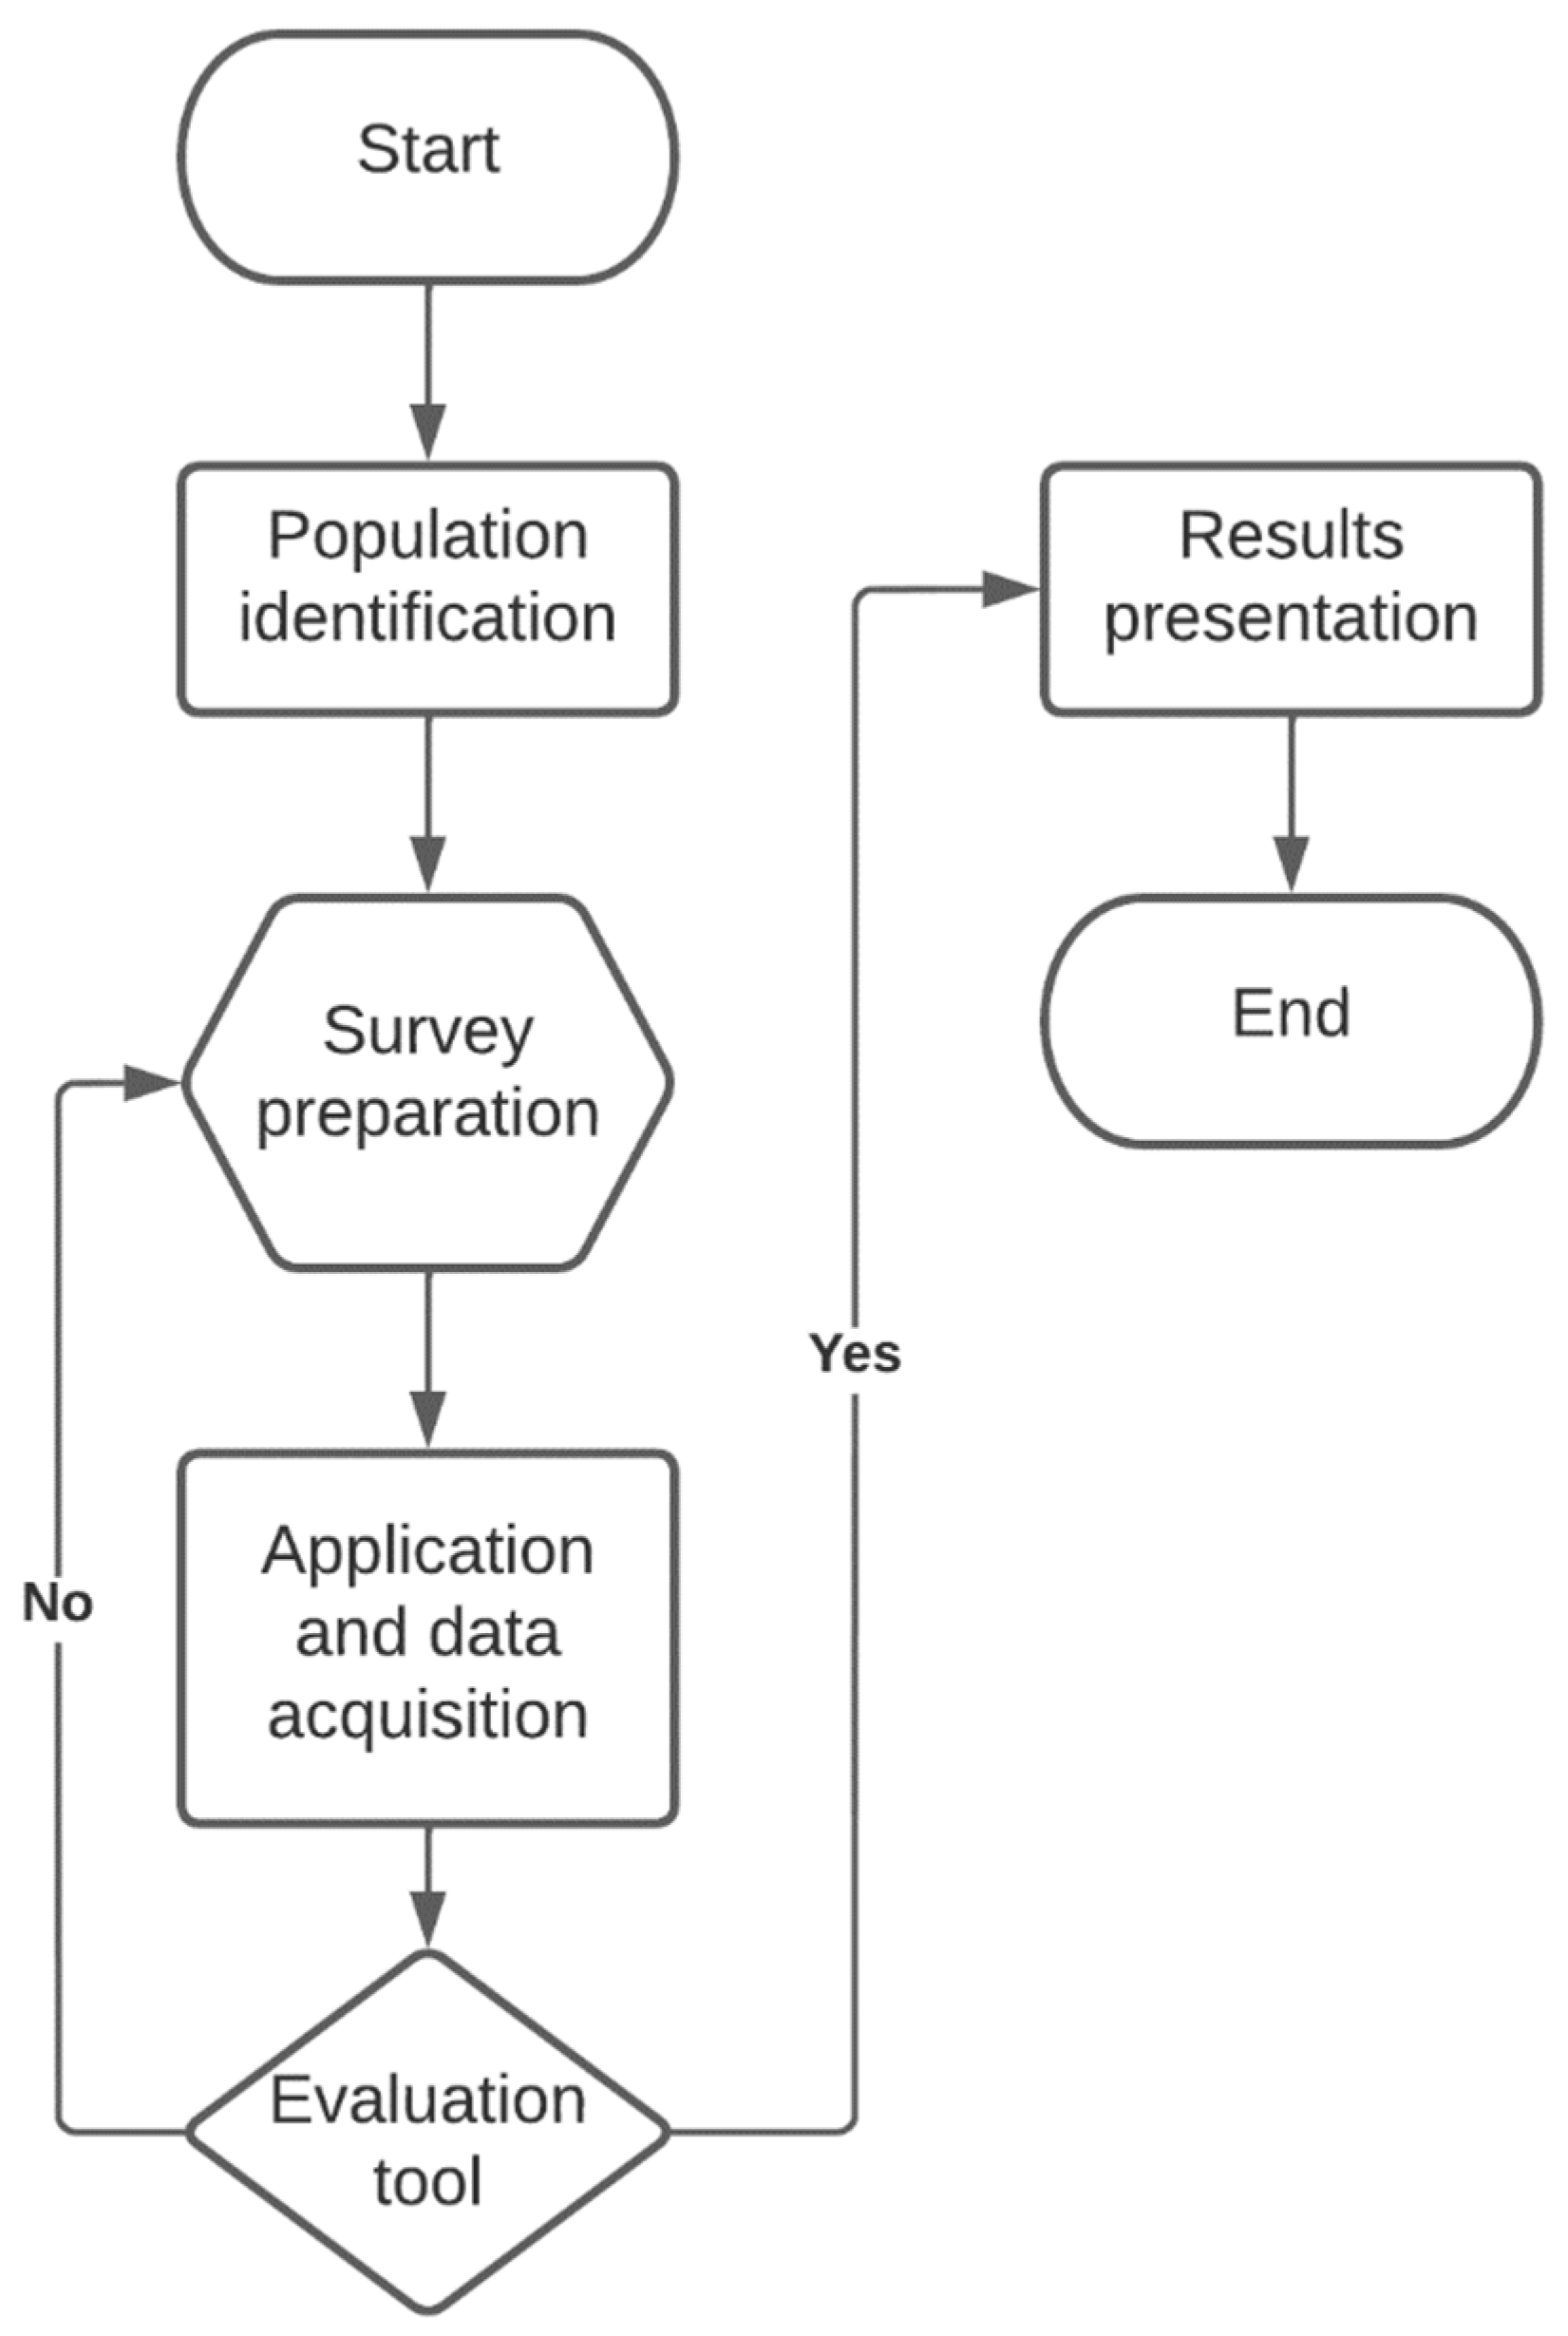
3.1.1. Application and Data Acquisition

The survey was applied to the 2021 cohort, which is the sample with which the method works. The total population of the cohort is 75 students; according to the results of the most representative population, for the survey data to be valid, it is necessary to receive at least 70 surveys. Table 6 shows that this condition is met in the work, since there were 71 students who completed the survey, therefore, the most representative sample is available to continue the analysis. The group of surveyed students is divided into 31 males and 40 females. Table 6 shows the age range of the population analyzed. In general, the dominant age range is between 40–50 years, of which 24 are women and 14 are men, the next age range with the highest number of people is between 50–60 years. These groups are the most representative in terms of the number of members and those in which the analysis will have a greater follow-up. Another representative fact is the low influx of students between 20 and 30 years old studying this course. This is a result that was expected, since in previous sections it has been detailed that this type of degree has the purpose of reaching professionals who do not have a higher degree or people who are heads of families and who are past the average age to enter a university career. In addition, there is a fact that was not expected in this survey, and that is that there are people over 60 years of age who are pursuing this type of study and see it as an opportunity to become professionals.

3.1.2. Tool Evaluation

The evaluation of the survey is carried out using the Statistical Package for the Social Sciences (SPSS). This tool allows the application of analytical reduction through factor analysis. The first step for the evaluation is to generate a process of cleaning and transformation of the data obtained. Table 7 presents a summary of the raw data obtained from the survey, in which the responses are of the textual type. For the analysis, it is necessary to convert the texts to numerical values. For presentation purposes, the table headings have been modified and the first seven columns and the first 25 rows are presented. To present the data properly, the fields that are presented and the modified texts are shown:
  • Q1: Gender.
  • Q2: Age.
  • Q3: You have used information technologies for your education (Computers–Cell phones–Tablet–etc.).
  • Q4: What skills do you have in managing IT?
  • Q5: You have the necessary tools to use technology for education at home.
  • Q6: From your perspective, how important is the use of information technologies in education?
  • Q7: Do you think that technological resources can favor your learning?
  • Q8: Select one disadvantage of technology platforms in education.
  • Q9: Which of the following activities do you enjoy the most with information technologies?
  • Q10: How often do you use information technology in your education?
  • Q11: Which of the following options do you consider to be a problem with the use of information technologies in education?
  • Q12: Do you consider that the excessive use of technology can affect your health?
  • Q13: Would you like to receive training on this topic?
Table 7. Presentation of the first 25 rows and 7 columns, for the representation of the questions included in the survey.
Q1Q2Q3Q4Q5Q6Q7
Woman40 years to 50 yearsYesVery difficultYes, comfortablyVery importantYes
Men40 years to 50 yearsYesVery easyYes, comfortablyVery importantYes
Woman20 years to 30 yearsYesEasyYes, comfortablyImportantYes
Woman20 years to 30 yearsYesEasyYes, comfortablyVery importantYes
Woman50 years to 60 yearsYesVery easyYes, comfortablyNecessaryYes
Woman20 years to 30 yearsYesEasyYes, comfortablyImportantYes
Men40 years to 50 yearsYesVery easyYes, comfortablyVery importantYes
Woman50 years to 60 yearsYesVery easyYes, comfortablyVery importantYes
Men30 years to 40 yearsYesEasyYes, but with limitationsVery importantYes
Men20 years to 30 yearsYesEasyYes, comfortablyVery importantYes
Woman40 years to 50 yearsYesEasyYes, comfortablyVery importantYes
Woman20 years to 30 yearsYesEasyYes, but with limitationsNecessaryYes
Men40 years to 50 yearsYesHardYes, comfortablyVery importantYes
Woman40 years to 50 yearsYesEasyYes, but with limitationsImportantYes
Men30 years to 40 yearsYesVery easyYes, comfortablyVery importantYes
Woman40 years to 50 yearsYesVery easyYes, comfortablyVery importantYes
Men40 years to 50 yearsYesEasyYes, but with limitationsVery importantYes
Men20 years to 30 yearsYesVery easyYes, comfortablyVery importantYes
Woman50 years to 60 yearsYesVery easyYes, comfortablyVery importantYes
Woman40 years to 50 yearsYesHardYes, comfortablyNecessaryYes
Woman40 years to 50 yearsYesEasyYes, but with limitationsNecessaryYes
Men40 years to 50 yearsYesEasyYes, comfortablyNecessaryYes
Men40 years to 50 yearsYesHardYes, but with limitationsImportantYes
Woman50 years to 60 yearsYesHardYes, comfortablyVery importantYes
Table 8 presents the transformed data and the corresponding numerical values that allow the corresponding analysis to be applied. For reasons of formatting, in the previous table it is not possible to add all the columns, however, the dataset will be made available so that the reader can replicate the method without problems. In this table there are columns that have been left in a text type format—these columns are Q1, Q3, Q7, Q12, and Q13, and these questions will not be included in the analysis. The reason why these columns have not been modified is because in the design of the survey, these questions are not multiple choice, they are informational and YES or NO questions. In Q1, we decided to maintain the gender for the presentation of the results in the following stages.
With the transformed data, the analysis of the data begins to establish the validity of the survey and its questions. The analysis process aims to verify, through factor analysis, the components that directly affect the use of ICT in education. Table 9 shows the results obtained in SPSS, through a dimension reduction model. To identify the appropriate factorial model, the KMO measure and Bartlett’s test of sphericity are used. This model tests for partial correlations between variables. In addition, Bartlett’s test checks whether the correlation matrix is an identity matrix. The KMO assumes values between 0 and 1, and according to several reviewed works, for a KMO coefficient to be adequate, it must be greater than 0.6. The table shows that the coefficient is 0.712, so the items are considered adequate, and the analysis continues. In Bartlet’s test, a chi-square value associated with the sampling distribution is obtained, which allows us to know the probability of error in rejecting a null hypothesis. Ideally, the significance value is expected to be less than 0.005, which is met in our analysis with a value of less than 0.000, indicating that there are significant differences between the correlation matrix and the identity matrix.
Table 10 shows the values obtained in the anti-image matrices. This matrix contains the negatives of the partial correlation coefficients, and the anti-image covariance matrix contains the negatives of the partial covariances. To be considered a good factorial model, most off-diagonal elements must be small. In the results obtained in the covariance matrix, it is observed that the values are good and exceed the 0.6 established in the KMO. Except for the values obtained in Q4 and Q5, which are lower at 0.492 and 0.597, respectively; however, in the correlation matrix they have a value of 0.747 and 0.654, respectively. In addition, with the positive values and closest to 1, a diagonal is formed, in which case the values above the diagonal are identical to those below it, which means that it is a mirror matrix.
Table 11 shows the communalities table, which measures the percentage of variance of a variable explained by all the factors together and can be interpreted as the reliability of the indicator. With the results obtained in the table, the variables in Q3 and Q6 have less reliability. This is because the amount of variance of all questions is explained by the eigenvalue, and if a factor has a low eigenvalue, it contributes little to explain the phenomenon studied. Another low value is that of question Q10. These three parameters are the ones to be analyzed in depth to determine the degree of impact they have on the validity of each question.
In Table 12, the total variance explained in its second component or generated dimension reaches a percentage that exceeds 50%, reaching 53.045%. This means that the instrument in the second analysis with all the questions included can explain the phenomenon; therefore, the survey is valid to continue with the analysis.
Table 13 shows the matrix of rotating components, and something unique is obtained in this analysis: the results have been classified into two components. According to the theoretical logic of the analysis, all the questions belong to a single dimension, so it is expected that the results and contributions of these maintain the dimensionality. The reason for the results obtained focuses specifically on the fact that the respondents are misinterpreting several of the questions and that in the design of the questionnaire it has not been considered that certain questions are evaluating two or more categories.
For a dimension to be considered valid, it needs at least three questions that feed into it or are directly related to it. The table shows that there is a relationship and contribution of more than three questions with values greater than 0.6. However, there are questions that have negative values; these can be removed from the analysis to modify the influence value of the remaining questions. For this analysis it is not necessary to eliminate the questions with negative values, however, they are considered to improve the way they are interpreted. Among these questions are Q3 on both components, Q5 on the second component, and Q9 on the first component.

3.1.3. Results Presentation

Once the survey has been validated and the incidence values that it must respond to the study phenomenon have been identified, it is possible to publicize the results found in it. For the presentation of data, it is possible to use different tools such as tableau, pivot tables, Power BI, and even the tools provided by the same application, with which the survey was developed. For this case, dynamic tables have been used to express the feeling of the respondents in relation to the use of ICT in the classroom. As an example, two graphs have been placed that represent the feeling of the students regarding the inclusion of ICT in questions Q6 and Q11.
In Figure 3, two graphs of the data of the mentioned questions have been included, as the first parameter in the graphs is age. As the predominant group is students between 40 and 50 years old, this is the selected group. Both men and women have been included in the gender to determine the tendencies of each group. In Figure 3a, the question analyzed is, “Q6: From your perspective, how important is the use of information technology in education?” In this question it has been established that the two groups consider that ICT’s inclusion in education is very important, and the group is filtered by age, where there are 14 men and 24 women. The results in proportion are very similar; however, in this group, there are no responses chosen as “little” or “none”. This result allows us to establish the importance of applying ICT in a test environment and gives rise to a second analysis where the performance of the students is evaluated.
Figure 3b corresponds to “Q11: Which of the following options do you consider to be a drawback with the use of information technologies in education”. In this question, they are presented in the two components generated in the matrix of rotating components and their incidence value in giving an answer to the study phenomenon is 0.600; therefore, it has important relevance in the study. The filter is similar and is based on age. In general, in this analysis, students are resistant to the use of ICT in the classroom due to the danger of data exposure. Similarly, the factor of access to information that currently exists is considered an inconvenience in the use of ICT, and this factor has a greater presence in the group of women. Exposure to inappropriate content is a factor that has a different degree of importance between groups: women tend to see this factor as more important while men feel that there is a greater risk of losing manual skills due to the creation of a technological dependency. The results can be evaluated for each question by varying the existing filters to determine the existing trends between ages. This has been analyzed in-depth for the application of ICT in the classroom at the higher technological institute that participates in the study. In these results, it was observed that in the groups between 20 and 40 years of age, the concern is that they are simpler and are related to the exposure to the data. These results were expected since the age range greatly influences the management and confidence towards the use of technologies.

3.2. Comparison on the Use of ICT in the Classroom

The comparison of the use of ICT in the classroom depends on the activities proposed to each group of students. Therefore, it is necessary to establish the mapped fields in the database that feeds the analysis. For the case study, the data is extracted from the LMS in XML format This is possible to execute due to the volume of data that is small and does not require the application of an ETL process.

3.2.1. Identification of Activities

The activities of each course are proposed by each teacher, and these are detailed in the syllabus which is the main part of the management of each subject. The number of subjects per academic period depends on the level that the student is studying. Regarding the academic period, this consists of 16 weeks divided into two signs of progress, each of which is made up of 7 weeks and 1 for evaluations. During the 7 weeks, the teacher oversees transferring the knowledge about the different topics to the student. The educational model of the institute that participates in this study is based on practice; therefore, each week, the teacher proposes several activities that evaluate the academic performance of the students. Generally, a subject is made up of 2 hours and is taught in a weekly session. Each session is limited to three components, where resources, classroom activities, and autonomous activities are established. The resources are part of the teacher’s management, in the evaluated environment, there is no guideline that obliges teachers to use ICT; however, to establish its functionality in the classroom, parallel “A” performs academic activities with the use of ICT and group “B” carries out its activities in a traditional way.
The activities in the classroom and the autonomous activities of parallel “A” must promote the achievement of learning competencies, in addition, these must be aligned with active learning. For example, for each session, there should be activities such as forums, questionnaires, mind maps, online debates, webinars, surveys, research activities, etc. With this reference in each progress, 14 evaluated activities must be generated, the qualifications for which are out of 10 and these values are those evaluated in the data analysis.

3.2.2. Analysis of Data

For the first data analysis, the data of 38 students are considered; in Table 14, the grades obtained from parallel “A” are presented, only the first 7 weeks have been included considering the format of the document. In the table, the first column records an ID for each student, and in the Avg. column, the average of each student’s grades is recorded. The reference is that a student, to pass a subject, must meet a minimum average grade of six in each progress. The T > 5 row counts the scores greater than “5”. According to the components detailed per week, each column identifies “S”, which refers to the activity in the week, “Ss” refers to the autonomous weekly activity, and the identification number to the week. The data of parallel “A” are obtained from the activities carried out with the use of ICT. The activities considered in this progress are listed below:
  • S1: Documenting a finance topic in images.
  • Ss1: Discussion forum in the LMS.
  • S2: Multiple Choice Quiz in the LMS.
  • Ss2: Creation of a digital poster with the use of Online tools.
  • S3: Immortalize your favorite read, explain why, and share it on Instagram.
  • Ss3: Interview a special someone, ask questions and record the interview with a mobile device.
  • S4: Discuss a current issue, the arguments must be visible in some digital tool.
  • Ss4: Reflect on a study area blog.
  • S5: Digital self-portrait, add your strengths and weaknesses in the different themes.
  • Ss5: Research in virtual libraries on a specific topic.
  • S6: Online tutorials.
  • Ss6: Group criticism.
  • S7: Group problem-solving with the use of ICT.
  • Ss7: playful games.
Table 14. Table of qualifications of the weekly activities developed with the use of ICT in the classroom.
Id.S1Ss1S2Ss2S3Ss3S4Ss4S5Ss5S6Ss6S7Ss7Prom1
15665873491088796.8
297868878561065107.4
377108578558986107.4
486577861089910777.6
577109878757106777.5
69810861081010856958.0
75851085996758797.2
81052469769848366.2
973272108829102596.0
1019725172810674105.6
11899986106899101078.4
12710671010101071078968.4
13678696101091098988.2
147107810610610767987.9
15887771088106771067.8
166689989810886787.9
176686878871069687.4
181055796193892926.1
191054466699966556.4
209106106961087768108.0
21910710676971077677.7
2210779986996107677.9
238610969669867897.6
24966991010679910888.3
2577666986881071087.6
2655224423161041024.3
2799781087107779898.2
289710979781010109778.5
2910778799108779778.0
30441010851391079326.1
3110461359897373106.1
328107910978761098108.4
33851091056163102916.1
3428596787910761097.4
355452379108243645.1
367679295432510495.9
3792108218105971696.2
381075684717111685.1
T > 5312828313030333030343131313133
According to the results shown in the table, 33 students of the 38 considered have exceeded the average of 6, this being the minimum basis considered to pass the subject. The 33 students represent 87% of the course, this is a value that opens the possibility of greater implementation of ICT in other cohorts, however, it is necessary to make the comparison with the data from parallel “B”. Table 15 presents the data recorded by the students of this parallel, formatted the same as the previous table. In this group, there are data from 37 records, and in the Avg. column, the average of each student is observed, and in the row T > 5 the qualifications that exceed the minimum of “6” in each activity are observed. It is worth emphasizing that the activities are carried out in a traditional way, for example, classroom evaluations, class participation, lessons, development of workbooks, etc. In a quick review, it is possible to observe that the grades are lower than the parallel that uses ICT for their academic development. In addition, there are 25 students who exceed the score of “6” in the general average, which means 68% of the course would pass the subject without accessing additional resources such as supplementary exams.
In Figure 4, the comparison of results is presented based on the averages of each parallel during the first progress given for seven weeks where 14 activities are developed. The orange trend line represents the trend of parallel “A” (ICT use), and the blue color corresponds to parallel “B”. As the main results, it is observed that the trend line in parallel “A” is more harmonious in most weeks, even when, in the activities of weeks 6 and 7, the ratings tend to go down; however, this is something that happens in both groups, and may be because each activity has an increasing value about the difficulty in its development because they are activities that require a cumulative knowledge of the subject. In addition, the two trend lines follow a certain relationship in some weeks, that is, there are topics in which the two groups present an increase in their ratings and a decrease in others. However, we must consider that the grade point average is always better in the use of ICT.

3.2.3. Decision on the Use of ICT in the Classroom

According to the results obtained in the comparison of the average grades of the evaluated groups, it is possible to determine that the use of ICT in the classroom is important to improve learning. In addition, from the comparative data of the qualifications, the data of the survey carried out has been considered, where most students consider that the use of ICT in the classroom is something that must happen in a close instance. However, to do so, higher education institutions must consider all the concerns and needs of students.

4. Discussion

The results obtained in this work allow us to identify clear parameters of the students’ feelings about the use of ICT in the classroom. However, to guarantee an adequate migration towards the use of ICT, it is necessary to create an environment of opportunities both for the use of technological infrastructures and tools, as well as a predisposition woards their use, by students and teachers. Several similar works focus their method on the implementation of ICT in educational environments, without knowing exactly what user acceptance is [41,42,43]. This can cause inconvenience in its use or extremely long processes for the adaptation of the population to technologies, which represents a greater consumption of resources, both economic and technological [33]. In this work, these variables have been considered and a first process has been carried out where the method can obtain relevant information on the student’s feelings about ICT.
In the second stage of the method and the results obtained, we have found results that we expected and others that we did not. This is the case of the grades with the use of ICT; it was expected that the grades of parallel “A” would be higher than those of parallel “B”, since being activities aligned with active learning, these are usually motivating. for the student, and even the time dedicated increases considerably to the development of traditional activities. This has been fulfilled and there is a relatively high percentage in the purchased group, and it has even been identified that the average performance is higher than courses from other cohorts. One of the unexpected results is that there is a certain relationship in the trend lines of the evaluated groups. This is identified in Figure 4, where it is observed that there are weeks where the ratings go down or up in a similar way, which leads us to consider that the use of analysis tools with greater scope, such as data mining, is necessary. By applying these tools and algorithms, it is possible to identify patterns in the data that lead to understanding the reasons why, in certain weeks, the performance exceeded or was not as expected. By generating an analysis with greater granularity, it is possible to improve the methodology, the activities, or how the learning resources of said weeks are presented.
The lack of a granular analysis in this work can be considered a weakness and leads the authors to think about the application of a business intelligence (BI) model in the educational data of the institute that participates in this study [25]. The inclusion of a BI will allow the establishment of a process capable of capturing data from a wide variety of academic sources to include a greater volume of data in the analysis and generate knowledge of these. By obtaining knowledge about each student’s needs, it is possible to create processes that are not focused on a single activity or a period, and the BI will allow decisions to be made based on projections and simulations where the focus is, improve education and even personalize it depending on of the needs identified in the students [11,21].
The results obtained will allow the quality managers and teachers at the technological institute of higher education that participated in this study to identify the factors that affect learning and act so that the change between modalities is optimal and aligned with the needs of the students. Currently, there are several works that make a significant contribution to the curricular part of each educational model. The proposals and research carried out cover new methods in the classroom such as project-based learning, the flipped classroom, cooperative learning, gamification, etc. However, these methodologies, which are excellent at the learning level, have been applied more frequently in online education [28]. Its effectiveness has been proven in these models and all students are aligned under the same methodology. It is in this aspect that our work interprets the most important difference, since we work from a point in which ICT are a fundamental part of learning in the face-to-face modality that has its own characteristics and resources.
In works that studied the use of ICT in education during the time of isolation due to the pandemic, there is an analysis process in which the factors that influence learning when using ICT as educational assistants are identified. However, the execution environment of these works does not fit our approach. Since, in most educational institutions, they based the use of technologies on establishing a model of remote education. In many cases, the face-to-face educational method was maintained, and ICT simply served as a communication channel or platform Our work is based on the teaching acquired in the pandemic and proposes a mechanism for integrating ICTs in education. However, this proposal is based on including technologies considering the acceptance of their use by the student and guaranteeing an assertive inclusion that does not negatively affect learning and even improves it.

5. Conclusions

The proposed work addresses a reality in education in Ecuador, where people see higher technological institutes as an opportunity to continue their studies. However, for these, there must be migration plans for the use of ICT in the classroom in an adequate way, preserving resources and guaranteeing that these become beneficial for students. According to the results obtained, it has been identified that there is a predominant group that likes this educational model, this group of students being between 40–50 and 50–60 years old. The age factor is something that all departments must work on comprehensively and create training plans in the management and use of ICT. In addition, it will be necessary to include in the tasks of the technology and research departments, the analysis of accessibility and usability of platforms and educational web pages that are included as learning resources.
Even though the method has been developed in two stages, where the first is strictly focused on determining the validity of the use of surveys, considering that currently its use is exploited in all areas to determine the feeling of people towards a product or service, it is important to generate granular analysis models that allow the identification of the incidence values of each question, as the proposed method has shown. The second stage comprehensively evaluates the performance of a cohort of students, made up of two groups. The first use ICT for their academic development and the other group does it traditionally. The results obtained determine that the inclusion of ICT in the classroom is necessary since it improves the academic performance of the study group. Moreover, this opens the possibility of the implementation of analysis models with better characteristics that allow generating knowledge about the data and making decisions that guarantee learning. These topics become future works for the authors, where the complete integration of ICT in the classroom is sought with the use of emerging technologies such as big data and artificial intelligence that focus on creating environments where the student is the main axis of knowledge and ICT become ideal assistants in the generation of knowledge.

Author Contributions

Conceptualization, W.V.-C. and J.G.-O.; methodology, S.S.-V.; validation, J.C.-S.; formal analysis, S.J.-V.; investigation, W.V.-C.; writing—original draft preparation, J.C.-S.; writing—review and editing, J.G.-O.; visualization, S.J.-V.; supervision, W.V.-C. All authors have read and agreed to the published version of the manuscript.

Funding

This research received no external funding.

Institutional Review Board Statement

Not applicable.

Informed Consent Statement

Not applicable.

Data Availability Statement

Not applicable.

Conflicts of Interest

The authors declare no conflict of interest.

References

  1. Egbert, A.R.; Cankurtaran, S.; Karpiak, S. Brain abnormalities in COVID-19 acute/subacute phase: A rapid systematic review. Brain Behav. Immun. 2020, 89, 543–554. [Google Scholar] [CrossRef] [PubMed]
  2. Sidpra, J.; Gaier, C.; Reddy, N.; Kumar, N.; Mirsky, D.; Mankad, K. Sustaining education in the age of COVID-19: A survey of synchronous web-based platforms. Quant. Imaging Med. Surg. 2020, 10, 1422–1427. [Google Scholar] [CrossRef] [PubMed]
  3. Engzell, P.; Frey, A.; Verhagen, M. Learning Inequality during the COVID-19 Pandemic. 2020. Available online: https://ideas.repec.org/p/osf/socarx/ve4z7.html (accessed on 21 May 2021).
  4. Ye, M.; Ren, Y.; Lv, T. Encephalitis as a clinical manifestation of COVID-19. Brain Behav. Immun. 2020, 88, 945–946. [Google Scholar] [CrossRef]
  5. Bestiantono, D.S.; Agustina, P.Z.R.; Cheng, T.-H. How Students’ Perspectives about Online Learning Amid the COVID-19 Pandemic? Stud. Learn. Teach. 2020, 1, 133–139. [Google Scholar] [CrossRef]
  6. Vindegaard, N.; Benros, M.E. COVID-19 pandemic and mental health consequences: Systematic review of the current evidence. Brain Behav. Immun. 2020, 89, 531–542. [Google Scholar] [CrossRef] [PubMed]
  7. Zhou, L.; Wu, S.; Zhou, M.; Li, F. ‘School’s out, but class’ on’, the largest online education in the world today: Taking china’s practical exploration during the COVID-19 epidemic prevention and control as an example. Best Evid. China Edu. 2020, 4, 501–519. [Google Scholar] [CrossRef]
  8. Chen, Y.; Zhou, H.; Zhou, Y.; Zhou, F. Prevalence of self-reported depression and anxiety among pediatric medical staff members during the COVID-19 outbreak in Guiyang, China. Psychiatry Res. 2020, 288, 113005. [Google Scholar] [CrossRef]
  9. Tan, H.R.; Chng, W.H.; Chonardo, C.; Ng, M.T.T.; Fung, F.M. How Chemists Achieve Active Learning Online During the COVID-19 Pandemic: Using the Community of Inquiry (CoI) Framework to Support Remote Teaching. J. Chem. Educ. 2020, 97, 2512–2518. [Google Scholar] [CrossRef]
  10. Pramono, C.A.; Manurung, A.H.; Heriyati, P.; Kosasih, W. Analysis of The Influence of Entrepreneurship Capability, Agility, Business Transformation, Opportunity on Start-Up Behavior in E-Commerce Companies in Indonesia during the COVID-19 Pandemic. WSEAS Trans. Bus. Econ. 2021, 18, 1103–1112. [Google Scholar] [CrossRef]
  11. Villegas-Ch, W.; Roman-Cañizares, M.; Sánchez-Viteri, S.; García-Ortiz, J.; Gaibor-Naranjo, W. Analysis of the State of Learning in University Students with the Use of a Hadoop Framework. Future Internet 2021, 13, 140. [Google Scholar] [CrossRef]
  12. Rodriguez-Ascaso, A.; Boticario, J.G.; Finat, C.; Petrie, H. Setting accessibility preferences about learning objects within adaptive elearning systems: User experience and organizational aspects. Expert Syst. 2017, 34, e12187. [Google Scholar] [CrossRef]
  13. Hinostroza, J.E. New Challenges for ICT in Education Policies in Developing Countries: The Need to Account for the Widespread Use of ICT for Teaching and Learning Outside the School. In ICT-Supported Innovations in Small Countries and Developing Regions; Springer: Cham, Switzerland, 2017; pp. 99–119. [Google Scholar] [CrossRef]
  14. Shenfeld, O.Z.; Goldfarb, H.; Zvidat, S.; Gera, S.; Golan, I.; Gdor, Y.; Pode, D. 128: A Prospective Survay of Patients’ Satisfaction with Urethral Reconstructive Surgery. J. Urol. 2005, 173, 35. [Google Scholar] [CrossRef]
  15. Sakshaug, J.W. Impacts of the COVID-19 Pandemic on Labor Market Surveys at the German Institute for Employment Research. Surv. Res. Methods 2020, 14, 229–233. [Google Scholar] [CrossRef]
  16. Ray, P.P. A survey of IoT cloud platforms. Future Comput. Inform. J. 2016, 1, 35–46. [Google Scholar] [CrossRef]
  17. Zhao, K.; Ge, L. A Survey on the Internet of Things Security. In Proceedings of the International Conference on Computational Intelligence and Security, CIS, Washington, DC, USA, 14–15 December 2013; pp. 663–667. [Google Scholar]
  18. Mahmud, M.S.; Huang, J.Z.; Salloum, S.; Emara, T.Z.; Sadatdiynov, K. A survey of data partitioning and sampling methods to support big data analysis. Big Data Min. Anal. 2020, 3, 85–101. [Google Scholar] [CrossRef]
  19. Dziuban, C.; Graham, C.; Moskal, P.D.; Norberg, A.; Sicilia, N. Blended learning: The new normal and emerging technologies. Int. J. Educ. Technol. High. Educ. 2018, 15, 3. [Google Scholar] [CrossRef]
  20. Valdebenito, M.A.; Wei, P.; Song, J.; Beer, M.; Broggi, M. Failure probability estimation of a class of series systems by multidomain Line Sampling. Reliab. Eng. Syst. Saf. 2021, 213, 107673. [Google Scholar] [CrossRef]
  21. Fernández-Gutiérrez, M.; Gimenez, G.; Calero, J. Is the Use of ICT in Education Leading to Higher Student Outcomes? Analysis from the Spanish Autonomous Communities. Comput. Educ. 2020, 157, 103969. [Google Scholar] [CrossRef]
  22. Villegas-Ch, W.; Palacios-Pacheco, X.; Buenaño-Fernandez, D.; Luján-Mora, S. Comprehensive Learning System Based on the Analysis of Data and the Recommendation of Activities in a Distance Education Environment. Int. J. Eng. Educ. 2019, 35, 1316–1325. [Google Scholar]
  23. Shannon, T.; Giles-Corti, B.; Pikora, T.; Bulsara, M.; Shilton, T.; Bull, F. Active commuting in a university setting: Assessing commuting habits and potential for modal change. Transp. Policy 2006, 13, 240–253. [Google Scholar] [CrossRef]
  24. Villar, A.; Zarrabeitia, M.T.; Fdez-arroyabe, P.; Santurtún, A. Integrating and Analyzing Medical and Environmental Data Using ETL and Business Intelligence Tools. Int. J. Biometeorol. 2018, 62, 1085. [Google Scholar] [CrossRef] [PubMed]
  25. Alia, N.; Mohamad, H.; Othman, M.S.; Yusuf, L.M. Significance of Data Integration and ETL in Business Intelligence Framework for Higher Education. In Proceedings of the International Conference on Science in Information Technology: Big Data Spectrum for Future Information Economy, Yogyakarta, Indonesia, 27–28 October 2015; pp. 181–186. [Google Scholar]
  26. Pan, B.; Zhang, G.; Qin, X. Design and Realization of an ETL Method in Business Intelligence Project. In Proceedings of the 2018 IEEE 3rd International Conference on Cloud computing and Big Data Analysis (ICCCBDA), Chengdu, China, 22–24 April 2018; pp. 275–279. [Google Scholar] [CrossRef]
  27. Sarawagi, S.; Agrawal, R.; Megiddo, N. Discovery-Driven Exploration of OLAP Data Cubes. In Proceedings of the International Conference on Extending Database Technology, Valencia, Spain, 23–27 March 1998; pp. 168–182. [Google Scholar] [CrossRef]
  28. Reinoso, G.G.L.; Barzola, K.M.; Caguana, D.M.; Lopez, R.P.; Lopez, J.C.P. M-Learning, a Path to Ubiquitous Learning in Higher Education in Ecuador. RISTI Rev. Iber. Sist. Tecnol. Inf. 2019, 2019, 47–59. [Google Scholar]
  29. Zhou, J.; Liu, L.; Xue, P.; Yang, X.; Tang, X. Mental Health Response to the COVID-19 Outbreak in China. Am. J. Psychiatry 2020, 177, 574–575. [Google Scholar] [CrossRef] [PubMed]
  30. Lai, J.; Ma, S.; Wang, Y.; Cai, Z.; Hu, J.; Wei, N.; Wu, J.; Du, H.; Chen, T.; Li, R.; et al. Factors associated with mental health outcomes among health care workers exposed to coronavirus disease 2019. JAMA Netw. Open 2020, 3, e203976. [Google Scholar] [CrossRef]
  31. Voronkov, A.; Iwaya, L.H.; Martucci, L.A.; Lindskog, S. Systematic Literature Review on Usability of Firewall Configuration. ACM Comput. Surv. 2018, 50, 1–35. [Google Scholar] [CrossRef]
  32. Appolloni, A.; Colasanti, N.; Fantauzzi, C.; Fiorani, G.; Frondizi, R. Distance Learning as a Resilience Strategy during COVID-19: An Analysis of the Italian Context. Sustainability 2021, 13, 1388. [Google Scholar] [CrossRef]
  33. Kerr, P. Adaptive learning. Elt J. 2015, 70, 88–93. [Google Scholar] [CrossRef]
  34. Janssen, M.; van der Voort, H.; Wahyudi, A. Factors influencing big data decision-making quality. J. Bus. Res. 2017, 70, 338–345. [Google Scholar] [CrossRef]
  35. Huda, M.; Maseleno, A.; Shahrill, M.; Jasmi, K.A.; Mustari, I.; Basiron, B. Exploring Adaptive Teaching Competencies in Big Data Era. Int. J. Emerg. Technol. Learn. (iJET) 2017, 12, 68–83. [Google Scholar] [CrossRef]
  36. Hill, J.R.; Hannafin, M.J. Teaching and learning in digital environments: The resurgence of resource-based learning. Educ. Technol. Res. Dev. 2001, 49, 37–52. [Google Scholar] [CrossRef]
  37. Stiftung, B. BTI 2022 Country Report Ecuador. 2022. Available online: https://www.ecoi.net/en/file/local/2069694/country_report_2022_ECU.pdf (accessed on 3 June 2022).
  38. Luna, A.L.; Chávez, G.R.; Reyes GJ, M. Analysis of poverty in Ecuador, period 2017–2018. Univ. Y Soc. 2020, 12, 363–368. [Google Scholar]
  39. Fairlie, R. The impact of COVID-19 on small business owners: Evidence from the first three months after widespread social-distancing restrictions. J. Econ. Manag. Strat. 2020, 29, 727–740. [Google Scholar] [CrossRef] [PubMed]
  40. Luján-Mora, S.; Medina, E. Reducing Inconsistency in Data Warehouses. In Proceedings of the 3rd International Conference on Enterprise Information Systems (ICEIS 2001), Setubal, Portugal, 7–10 July 2001; pp. 199–206. [Google Scholar]
  41. Villegas-Ch, W.; Luján-Mora, S. Analysis of Data Mining Techniques Applied to LMS for Personalized Education. In Proceedings of the IEEE World Engineering Education Conference (EDUNINE), Santos, Brazil, 19–22 March 2017; pp. 85–89. [Google Scholar]
  42. Hodges, C.B. Self-efficacy in the context of online learning environments: A review of the literature and directions for research. Perform. Improv. Q. 2008, 20, 7–25. [Google Scholar] [CrossRef]
  43. Hodges, C.B. Suggestions for the Design of E-Learning Environments to Enhance Learner Self-Efficacy. In Proceedings of the IADIS International Conference on Applied Computing, Fort Worth, TX, USA, 23–25 October 2013; pp. 10–16. [Google Scholar]
Figure 1. Flowchart on the process for survey validity analysis.
Computers 11 00112 g001
Figure 2. Flow chart for data analysis of two groups of students, one with the integration of ICT in the classroom and the other with traditional learning.
Computers 11 00112 g002
Figure 3. Representation of results obtained from a survey on the use of ICT in the classroom; (a) description of the results of the conception that students have about the importance of the use of ICT in education; (b) description of the results obtained from the students’ feeling about the dangers caused using ICT in education.
Computers 11 00112 g003
Figure 4. Comparison of academic performance, with the integration of data from parallel “A” vs. parallel “B”.
Computers 11 00112 g004
Table 1. Example of answers obtained in a traditional survey.
IdQuestion 1Question 2Question 3Question 4Question 5Question 6Question 7
1Between, 40–50Very difficultBassNeverAnyI haveFalse information
2Between, 20–30Very difficultMediumEverLittle bitLimitedExposure
3Between, 40–50EasyBassAlwaysSomethingSomeExposition
4Between, 50–60HardTallNeverSomethingI haveRisk
5Between, 50–60HardMediumEverAnyLimitedFalse information
Table 2. Example of the survey data transformed for the analysis of the validity of the instrument.
IdQuestion 1Question 2Question 3Question 4Question 5Question 6Question 7
12121141
21132222
32425332
43251344
53242121
Table 3. Example of a correlation matrix indicating the connection coefficients between the factors.
Element 1Element 2
CorrelationElement 20.903
Element 30.8670.864
Table 4. Example of the KMO and Bartlett values that contrast the partial correlations between the variables.
Kaiser-Meyer-Olkin Measure of Sampling Adequacy0.724
Barttlet’s Test of SphericityApprox. Chi-Square2075.310
df21
Sig.0.000
Table 5. Percentage of explained variance.
Initial EigenvaluesExtraction Sums of Squared Loading
ComponentTotal% of VarianceCumulative %Total% of VarianceCumulate %
11.06726.67026.6701.06726.67026.670
20.99824.95451.624
30.99024.75776.380
40.94523.620100.000
Extraction Method: Principal Component Analysis.
Table 6. Breakdown of number of people by age range, by gender and presentation of totals.
GenderNumber of People
Men31
20 years to 30 years2
30 years to 40 years3
40 years to 50 years14
50 years to 60 years11
60 years and over1
Woman40
20 years to 30 years4
30 years to 40 years1
40 years to 50 years24
50 years to 60 years9
60 years and over2
Total71
Table 8. Presentation of the first 25 rows and 13 columns with the transformation of data from text to values.
Q1Q2Q3Q4Q5Q6Q7Q8Q9Q10Q11Q12Q13
Woman3Yes255Yes1225YesYes
Men3Yes555Yes4155NoYes
Woman1Yes454Yes3355YesYes
Woman1Yes455Yes2325YesYes
Woman4Yes553Yes1423YesYes
Woman1Yes454Yes5555YesYes
Men3Yes555Yes5555YesYes
Woman4Yes555Yes2434NoYes
Men2Yes425Yes5554NoYes
Men1Yes455Yes2154YesYes
Woman3Yes455Yes5455YesYes
Woman3Yes455Yes3223NoYes
Woman1Yes423Yes2454YesYes
Men3Yes255Yes1311NoYes
Woman3Yes424Yes3324YesYes
Men2Yes555Yes3134YesYes
Woman3Yes555Yes5153YesYes
Men3Yes425Yes3442YesYes
Men1Yes555Yes3355YesYes
Woman4Yes555Yes5353YesNo
Woman3Yes253Yes1154NoYes
Woman3Yes423Yes3125YesYes
Men3Yes453Yes3355NoYes
Men3Yes224Yes5344YesYes
Woman4Yes255Yes1253YesYes
Table 9. KMO values to determine the validity of the survey.
Kaiser–Meyer–Olkin Measure of Sampling Adequacy. 0.712
Bartlett’s Test of SphericityApprox. Chi-Square124.514
df28
Sig.0.000
Table 10. Anti-image matrix that identifies the covariance and correlation values for each question.
Q2Q4Q5Q6Q8Q9Q10Q11
Anti-image CovarianceQ20.6460.152−0.019−0.019−0.080−0.0010.2310.197
Q40.1520.492−0.201−0.053−0.203−0.0990.011−0.064
Q5−0.019−0.2010.597−0.2320.1080.145−0.056−0.131
Q6−0.019−0.053−0.2320.766−0.053−0.044−0.0310.006
Q8−0.080−0.2030.108−0.0530.631−0.068−0.220−0.128
Q9−0.001−0.0990.145−0.044−0.0680.900−0.0650.009
Q100.2310.011−0.056−0.031−0.220−0.0650.6940.088
Q110.197−0.064−0.1310.006−0.1280.0090.0880.697
Anti-image Co-relationQ20.708 a0.269−0.030−0.027−0.125−0.0010.3460.294
Q40.2690.747 a−0.370−0.086−0.365−0.1490.019−0.109
Q6−0.030−0.3700.654 a−0.3430.1760.198−0.086−0.202
Q8−0.027−0.086−0.3430.775 a−0.076−0.053−0.0430.008
Q9−0.125−0.3650.176−0.0760.669 a−0.090−0.332−0.193
Q10−0.001−0.1490.198−0.053−0.0900.623 a−0.0820.011
Q110.3460.019−0.086−0.043−0.332−0.0820.692 a0.126
a Measures of Sampling Adequacy (MSA).
Table 11. Calculation of communalities, a sum of the squared factorial weights in each of the rows.
InitialExtraction
Q21.0000.445
Q41.0000.663
Q51.0000.719
Q61.0000.424
Q81.0000.557
Q91.0000.503
Q101.0000.497
Q111.0000.437
Table 12. Calculation of the total explained variance with two components in an accumulated percentage of 53.045%.
Initial EigenvaluesExtraction Sums of Squared LoadingsRotation Sums of Squared Loadings
ComponentTotal% of VarianceCumulative %Total% of VarianceCumulate %Total% of VarianceCumulate %
12.98137.26737.2672.98137.26737.2672.29228.65228.652
21.26215.77853.0451.26215.77853.0451.95124.39453.045
30.93111.64064.685
40.80110.01674.701
50.7098.86183.562
60.5386.72390.285
70.4755.93296.217
80.3033.783100.000
Extraction Method: Principal Component Analysis.
Table 13. Matrix of rotated components to obtain values for each question and its incidence per component.
Component
12
Q2−0.448−0.494
Q40.6500.490
Q50.846−0.057
Q60.6500.044
Q80.2480.704
Q9−0.2480.664
Q100.2190.670
Q110.6000.277
Extraction Method: Principal Component Analysis. Rotation Method: Varimax with Kaiser Normalization.
Table 15. Table of qualifications of the weekly activities developed in a model of traditional education.
Id.S1Ss1S2Ss2S3Ss3S4Ss4S5Ss5S6Ss6S7Ss7Prom1
110104310105766451097.1
27714584872496105.9
342510862426101124.5
4588796101069810787.9
559367991023108987.0
61259109431917875.4
78410746372776515.5
881069878910107109108.6
9599813933399295.9
104861059748789687.1
118104101049561054787.1
125710468598999867.4
139894810659868847.3
14976879655699757.0
1556858996410564106.8
167648664456109866.4
177558871089459556.8
1894107581054745476.4
19101086451051066101087.7
2029522410644762105.2
21686641497571124.8
226278594631059535.9
23910798647710981088.0
248388105829651325.6
25691095106108666967.6
269610106510678107657.5
27105107710101097757108.1
281096651091075710967.8
29510567567510651086.8
3089986810588108757.8
3197695106971079998.0
327710101097599681058.0
338657758510659776.8
346101335265645334.4
356763834865181065.8
365978748988810897.7
37224102936107158105.6
T > 5252824292325242324292427262525
Publisher’s Note: MDPI stays neutral with regard to jurisdictional claims in published maps and institutional affiliations.

