
Melanoma Detection in Dermoscopic Images Using a Cellular Automata Classifier

 ,
, 
 and
and
Abstract
:1. Introduction
1.1. Motivation
1.2. Related Jobs
2. Basic Concepts
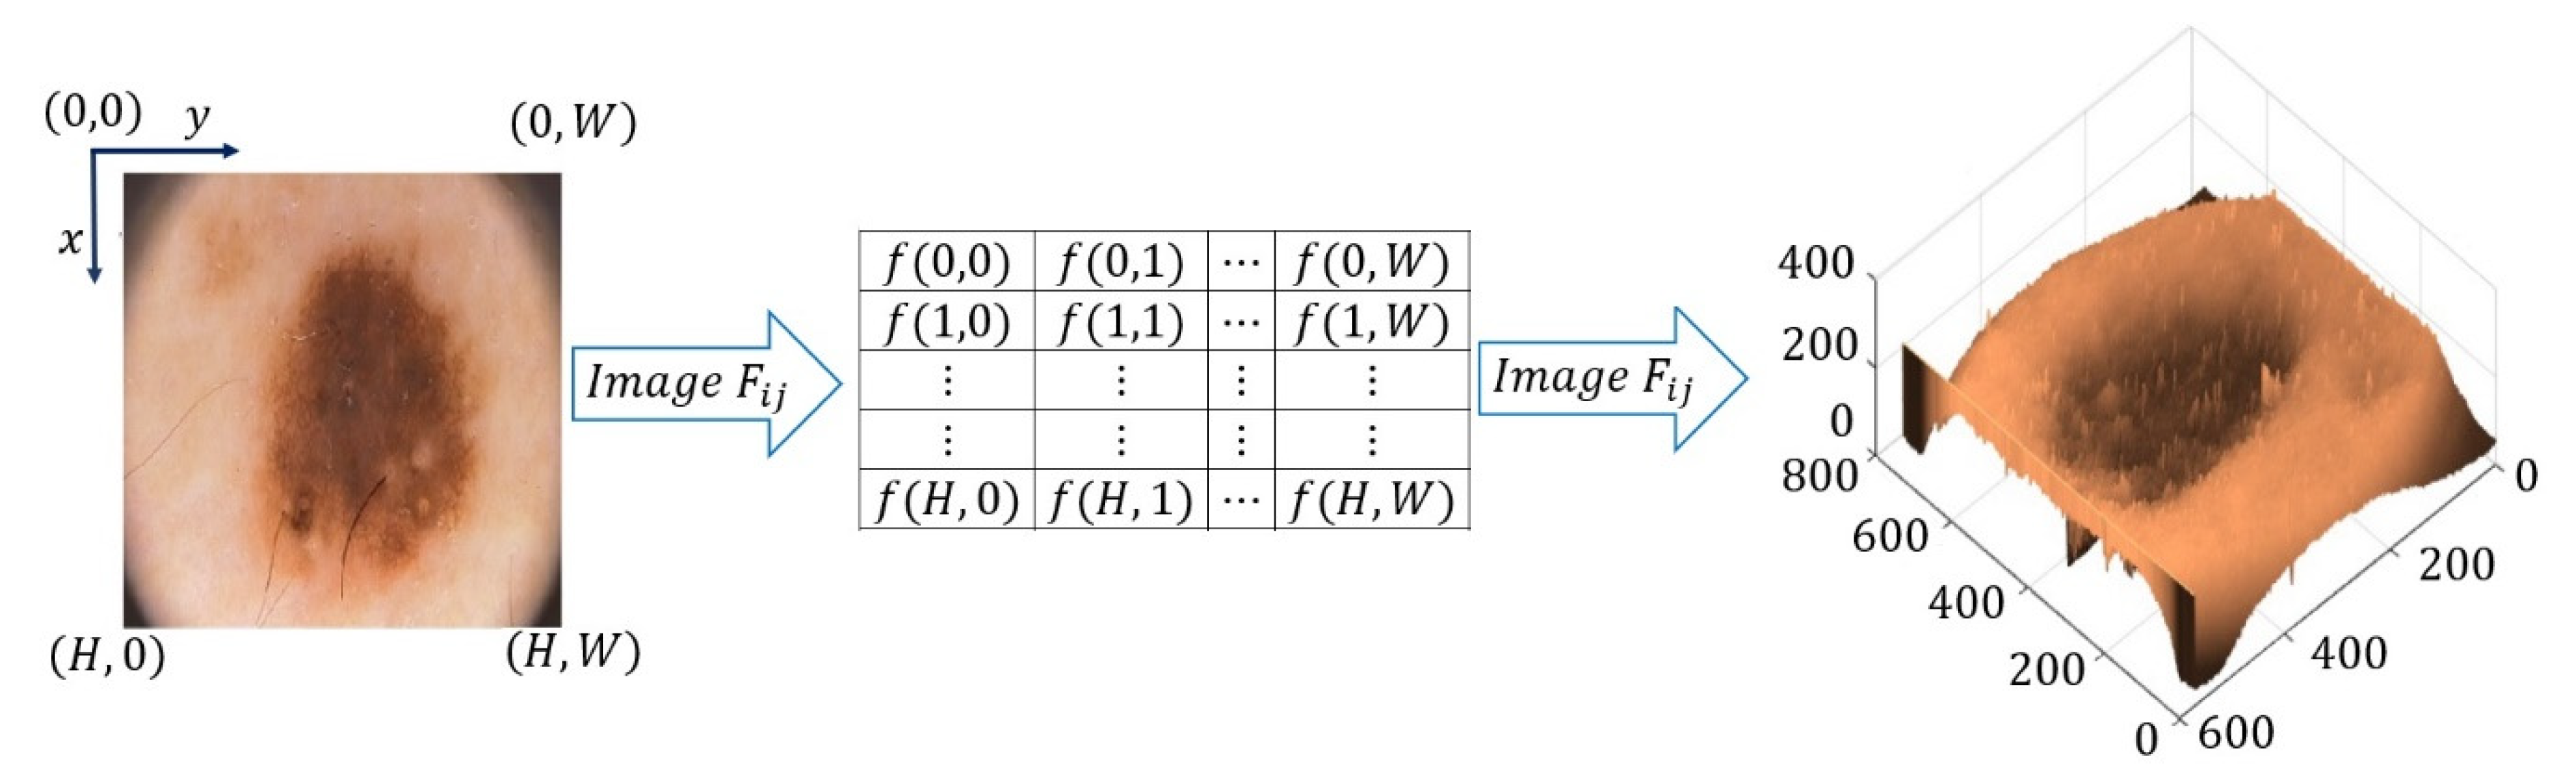
2.1. Digital Image
2.2. Mathematical Morphology
2.3. Cellular Automata
- for some or .
- If , then
- If and are in with , then or .
- 1.
- is a regular lattice.
- 2.
- is a finite set of states.
- 3.
- is a set of neighborhoods that nest as follows:
- 4.
- is a function called the transition function.
3. Materials and Methods
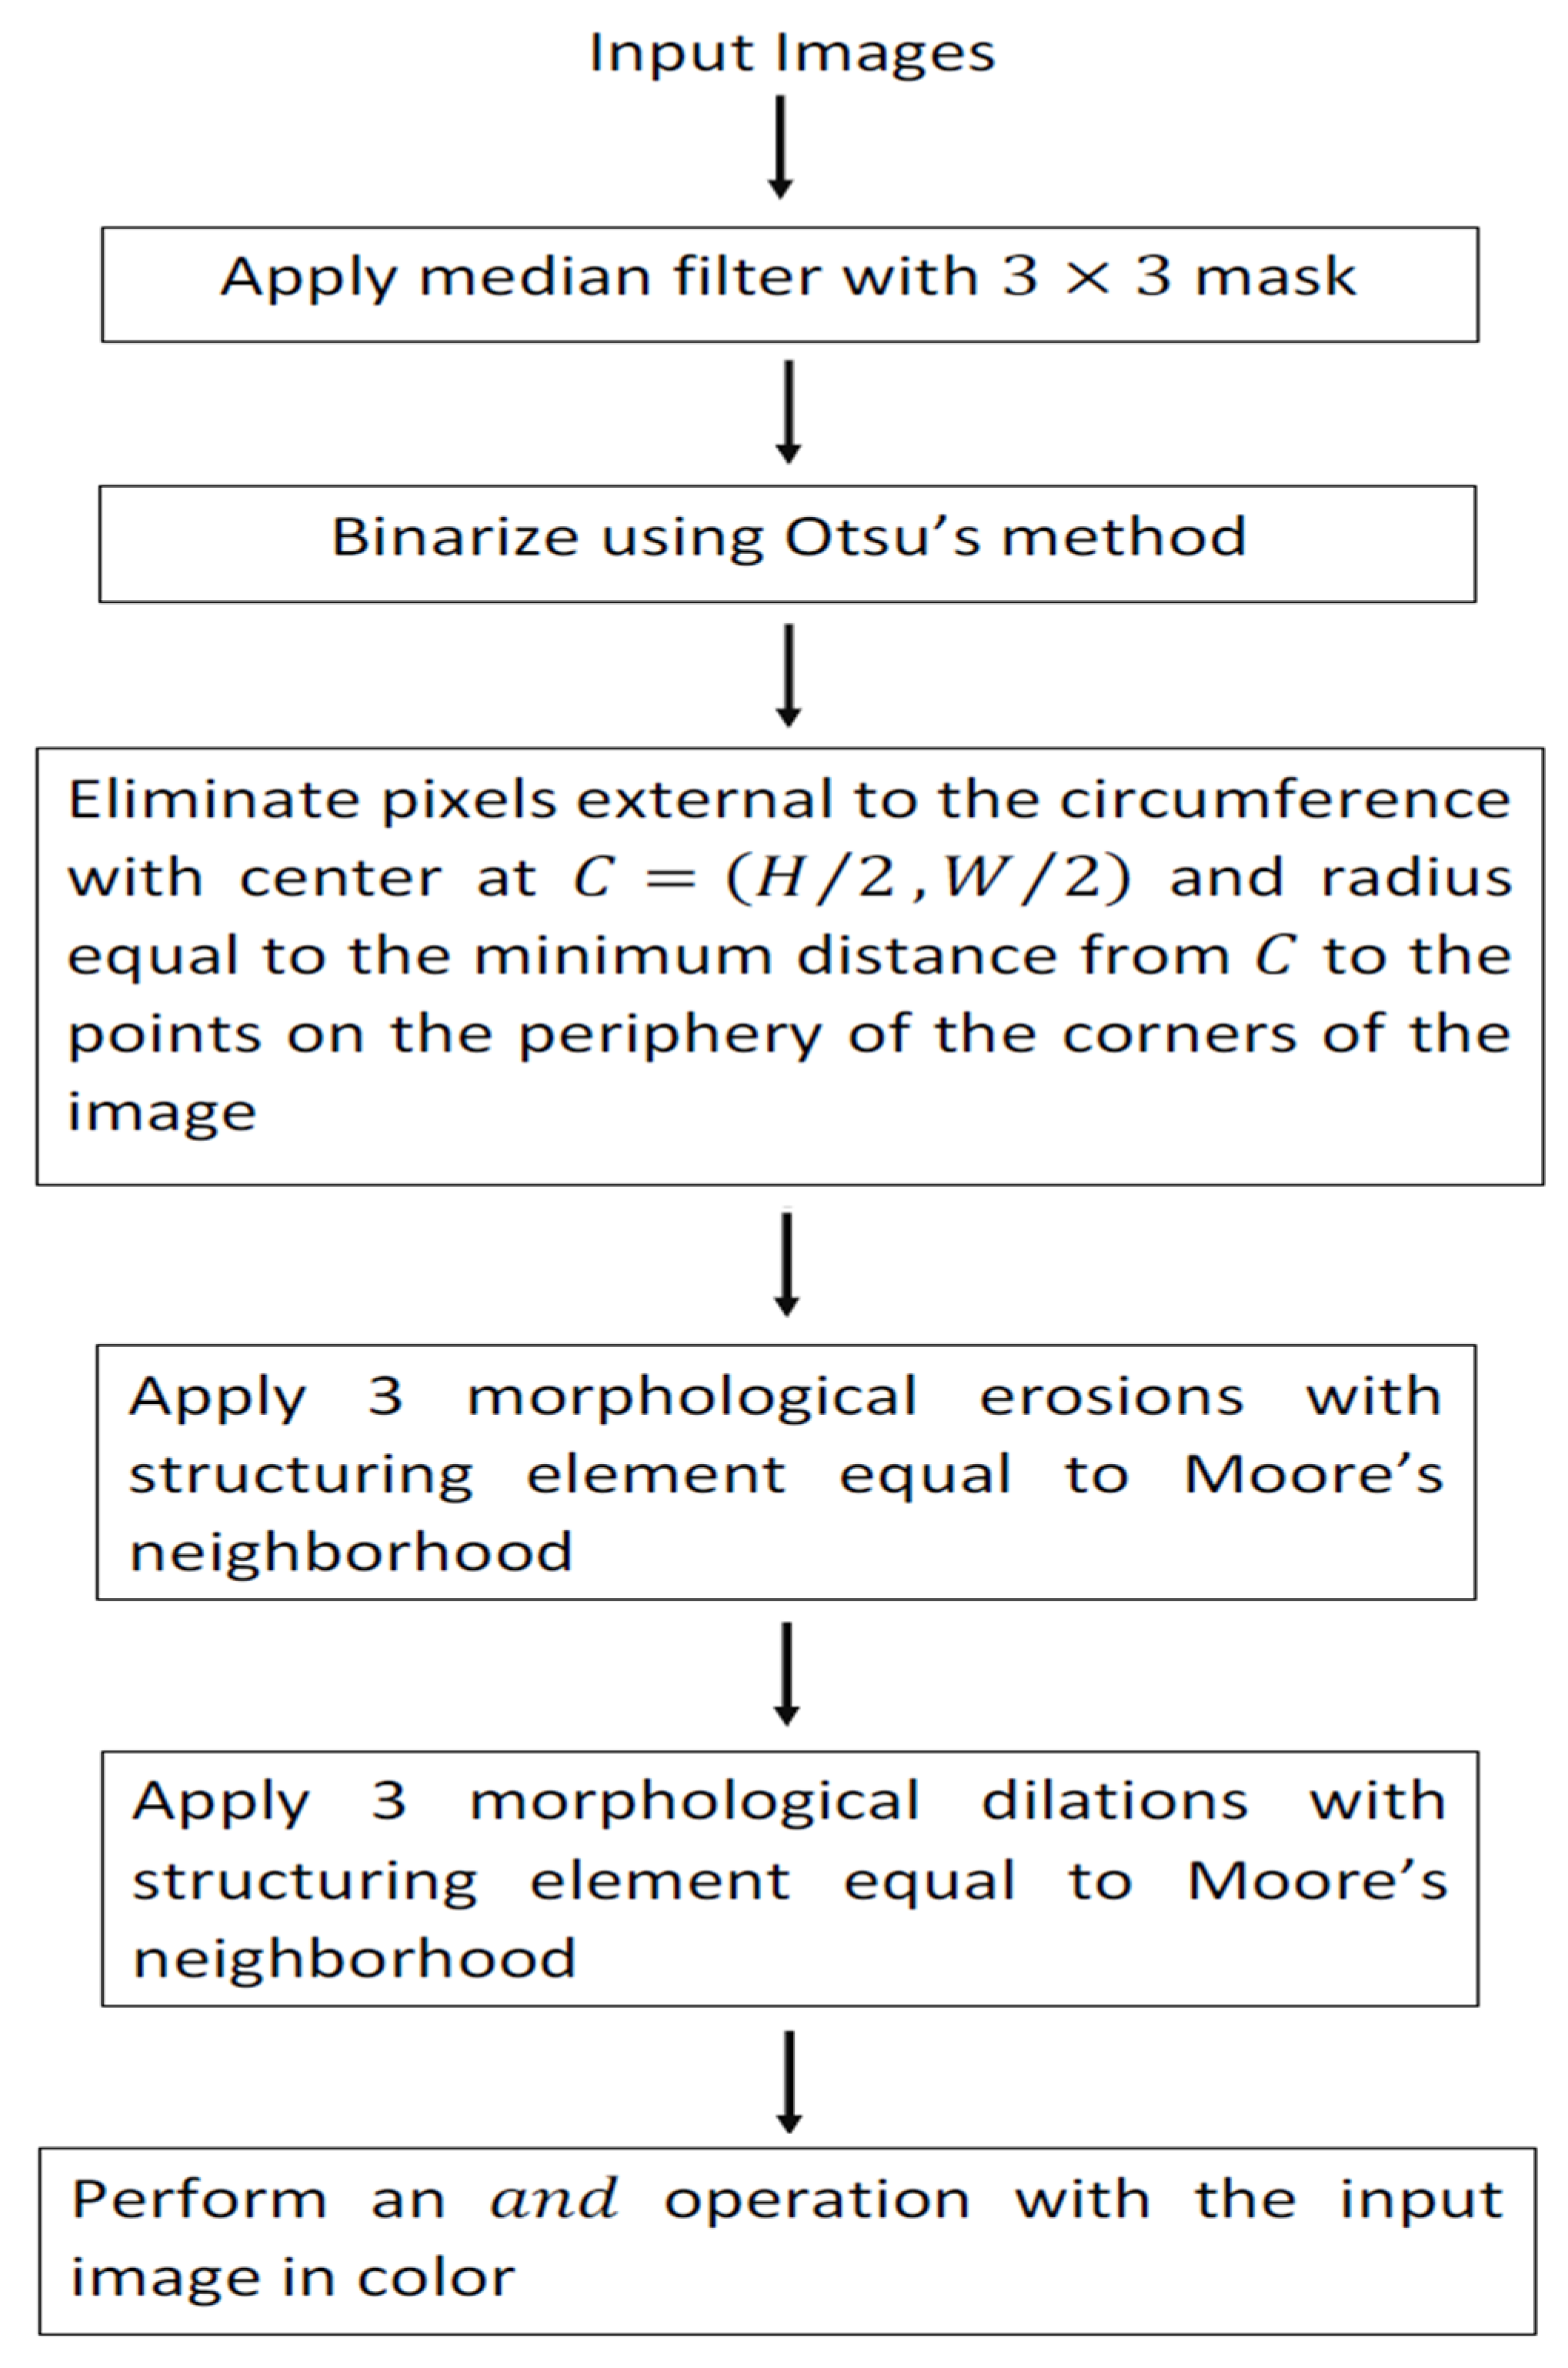
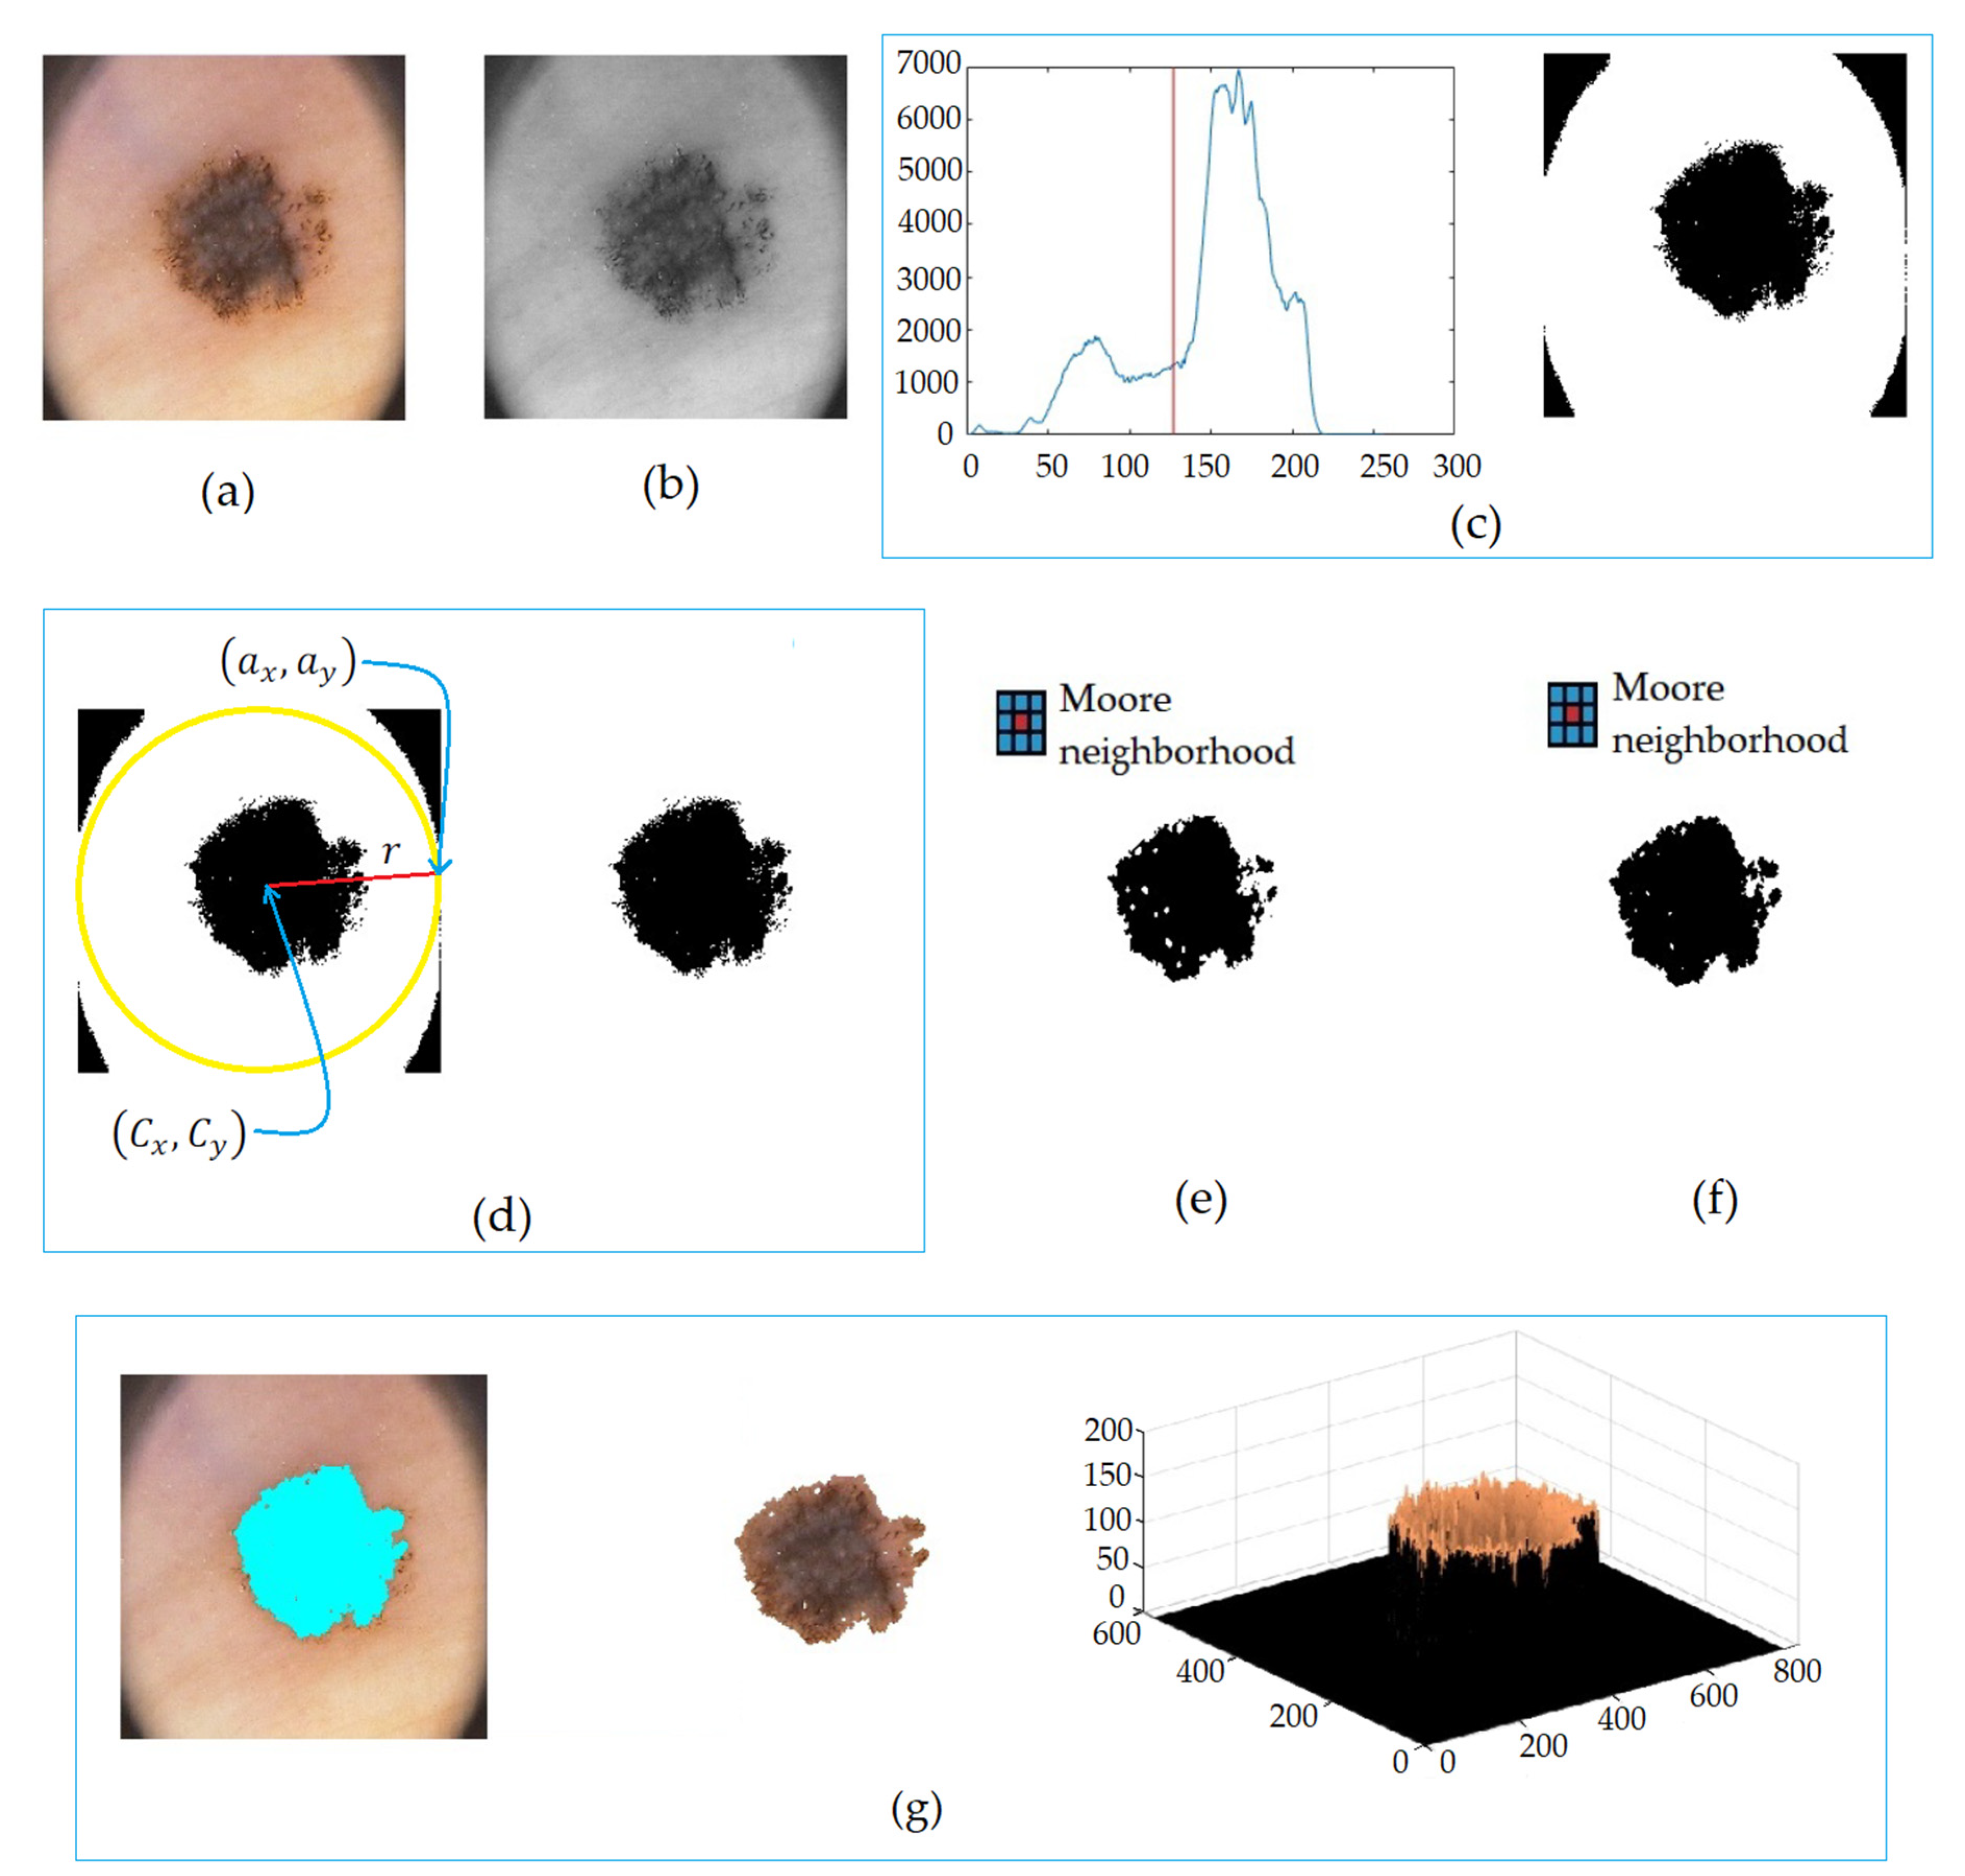
3.1. Image Segmentation
3.2. Feature Extraction
3.3. Classification
- .
- .
- .
- The transition function is given as follows:
- .
- .
- .
- The transition function is given as follows:
| Algorithm 1. ACA in recovery phase |
| Input: Fundamental set ; structuring element ; integer value (number of erosions); integer value (number of dilations); pattern to recovery . Output: Recovery pattern .
for do if then if then break end if end if end for end for |
4. Experiments and Results
5. Discussion
6. Conclusions
Author Contributions
Funding
Informed Consent Statement
Data Availability Statement
Acknowledgments
Conflicts of Interest
References
- Zhen, M.; Tavares, J.M. Effective features to classify skin lesions in dermoscopic images. Expert Syst. Appl. 2017, 84, 92–101. [Google Scholar]
- Chatterjee, S.; Dey, D.; Munshi, S. Optimal selection of features using wavelet fractal descriptors and automatic correlation bias reduction for classifying skin lesión. Biomed. Signal Proccess. Control 2018, 40, 252–262. [Google Scholar] [CrossRef]
- Craythorme, E.; Al-Niami, F. Skin cancer. Medicine 2017, 45, 431–434. [Google Scholar] [CrossRef]
- Caini, S.; Boniol, M.; Tosti, G.; Magi, S.; Medri, M.; Stanganelli, I.; Palli, D.; Assedi, M.; Del Marmol, V.; Gandini, S. Vitamin D and melanoma and non-melanoma skin cancer and prognosis: A comprehensive review and meta-analysis. Eur. J. Cancer 2014, 50, 2649–2658. [Google Scholar] [CrossRef] [PubMed]
- Xu, H.; Berendt, R.; Jha, N.; Mandal, M. Automatic measurenment of melanoma Depth of invasión in skin hitopathological images. Micron 2017, 97, 56–67. [Google Scholar] [CrossRef]
- El Abbad, N.; Faisal, Z. Detection and analysis of skin cancer from skin lesion. Int. J. Appl. Eng. Res. 2017, 12, 9046–9052. [Google Scholar]
- Boespflug, A.; Perier-Muzet, M.; Phan, A.; Dhaille, F.; Assouly, P.; Thomas, L.; Petit, A. Dermatoscopia de las lesiones cutáneas no neoplásicas. EMC-Dermatología 2018, 52, 1–9. [Google Scholar] [CrossRef]
- Rao, B.K.; Ahn, C.S. Dermatoscopy for melanoma and pigmented lesion. Dermatol. Clin. 2012, 30, 413–434. [Google Scholar] [CrossRef]
- Gallegos-Hernández, J.F.; Ortiz-Maldondado, A.L.; Minauro-Muñoz, G.G.; Arias-Ceballos, H.; Hernández-Sanjuan, M. Dermoscopy in cutaneous melanoma. Cirugía Y Cir. 2015, 83, 107–111. [Google Scholar] [CrossRef] [Green Version]
- Pastar, Z.; Lipozencic, J. Significance of dermoscopic in genital dermatoses. Clin. Dermatol. 2014, 32, 315–318. [Google Scholar] [CrossRef]
- Barata, C.; Celebi, M.E.; Marques, J.S. Development of a clinically oriented system for melanoma diagnosis. Pattern Recognit. 2017, 69, 270–285. [Google Scholar] [CrossRef]
- Torkashvand, F.; Fartash, M. Automatic segmentation of skin lesion using markov random field. Can. J. Basic Appl. Sci. 2015, 3, 93–107. [Google Scholar]
- Dalila, F.; Zohra, A.; Reda, K.; Hocine, C. Segmentation and classification of melanoma and benign skin lesions. Optik 2017, 140, 749–761. [Google Scholar] [CrossRef]
- Shan, P.; Wang, Y.; Fu, C.; Song, W.; Chen, J. Automatic skin lesion segmentation based on FC-DPN. Comput. Biol. Med. 2020, 123, 103762. [Google Scholar] [CrossRef] [PubMed]
- Mahbod, A.; Tschandl, P.; Langs, G.; Ecker, R.; Ellinger, I. The effects of skin lesion segmentation on the performance of dermoscopic image classification. Comput. Methods Programs Biomed. 2020, 197, 105725. [Google Scholar] [CrossRef]
- Pereira, P.M.M.; Fonseca-Pinto, R.; Paiva, R.P.; Assuncao, P.A.A.; Tavora, L.M.N.; Thomaz, L.A.; Faria, S.M.M. Dermoscopic skin lesión image segmentation based on Local Binary Pattern Clustering: Comparative study. Biomed. Signal Process. Control 2020, 59, 101924. [Google Scholar] [CrossRef]
- Rigel, D.S.; Russak, J.; Friedman, R. The evolution of melanoma diagnosis: 25 years beyond the ABCDs. CA Cancer J. Clin. 2010, 60, 301–316. [Google Scholar] [CrossRef]
- Mohammed, E.; Jadhav, M. Analysis of dermoscopic images by using ABCD rule for early detection of skin cancer. Glob. Transit. Proc. 2021, 2, 1–7. [Google Scholar]
- Singh, L.; Ram, R.; Prakash, S. Designing a Retrieval-Based Diagnostic Aid using Effective Features to Classify Skin Lesión in Dermoscopic Images. Procedia Comput. Sci. 2020, 167, 2172–2180. [Google Scholar] [CrossRef]
- Zakeri, A.; Hokmabadi, A. Improvement in the diagnosis of melanoma and dysplastic lesions by introducing ABCD-PDT features and a hybrid classifier. Biocybern. Biomed. Eng. 2018, 38, 456–466. [Google Scholar] [CrossRef]
- Monisha, M.; Suresh, A.; Bapu, B.R.; Rashmi, M. Classification of malignant melanoma and benign skin lesión by using back propagation neural network and ABCD rule. Clust. Comput. 2019, 22, 12897–12907. [Google Scholar] [CrossRef]
- Alfed, N.; Khelifi, F. Bagged textural and color features for melanoma skin cancer detection in dermoscopic and standar images. Expert Syst. Appl. 2017, 90, 101–110. [Google Scholar] [CrossRef] [Green Version]
- Stoecker, W.; Wronkiewiecz, M.; Chowdhury, R.; Stanley, R.; Xu, J.; Bangert, A.; Shrestha, B.; Calcara, D.; Rabinovitz, H.; Oliviero, M.; et al. Detection of granularity in dermoscopy images of malignant melanoma using color and texture features. Comput. Med. Imaging Graph. 2011, 35, 144–147. [Google Scholar] [CrossRef] [Green Version]
- Pathan, S.; Gopalakrishna, K.; Siddalingaswamy, P. Automated detection of melanocytes related pigmented skin lesión: A clinical framework. Biomed. Singal Process. Control 2019, 51, 59–72. [Google Scholar] [CrossRef]
- Amin, J.; Sharif, A.; Gul, N.; Almas, M.; Wasif, M.; Azam, F.; Ahmad, S. Integrated design of deep features fusion for localization and classification of skin cancer. Pattern Recognit. Lett. 2020, 131, 63–70. [Google Scholar] [CrossRef]
- Hosseinzadeh, S.; Hosseinzadeh, P. A comparative study of deep learning architectures on melanoma detection. Tissue Cell 2019, 58, 76–83. [Google Scholar] [CrossRef]
- Ganster, H.; Pinz, P.; Rohrer, R.; Wildling, E.; Binder, M.; Kittler, H. Automated melanoma recognition. IEEE Trans. Med. Imaging 2001, 20, 233–239. [Google Scholar] [CrossRef] [PubMed]
- Luna-Benoso, B.; Flores-Carapia, R.; Yáñez-Márquez, C. Associative Memories Based on Cellular Automata: An Application to Pattern Recognition. Appl. Math. Sci. 2013, 7, 857–866. [Google Scholar] [CrossRef]
- Gonzalez, R.C.; Woods, R.E. Digital Image Processing, 2nd ed.; Prentice-Hall: Hoboken, NJ, USA, 2002. [Google Scholar]
- Shih, F.; Cheng, S. Adaptative mathematical morphology for Edge linking. Inf. Sci. 2004, 167, 9–21. [Google Scholar] [CrossRef]
- Bloch, I. On links between mathematical morphology and rough sets. Pattern Recognit. 2000, 33, 1487–1496. [Google Scholar] [CrossRef]
- Luna-Benoso, B.; Yáñez-Márquez, C.; Figueroa-Nazuno, J.; López-Yañéz, I. Cellular Mathematical Morphology. In Proceedings of the IEEE Sixth Mexican International Conference on Artificial Intelligence, Aguascalientes, Mexico, 4–10 November 2008; pp. 105–112. [Google Scholar]
- Zhang, P.; Verma, B.; Kumar, K. Neural vs statistical classifier in conjunction with genetic algorithm based feature selection. Pattern Recognit. Lett. 2005, 26, 909–919. [Google Scholar] [CrossRef]
- Subashini, T.S.; Ramalingam, V.; Palanivel, S. Automated assement of breast tissue density in digital mammograms. Comput. Vis. Image Underst. 2010, 114, 33–43. [Google Scholar] [CrossRef]
- Santiago-Moreno, R.; Sossa, H.; Gutierrez-Hernández, D.A.; Zamudio, V.; Hernández-Bautista, I.; Valadez-Godínez, S. Novel mathematical modelo f breast cancer diagnostics using an associative pattern classification. Diagnostics 2020, 10, 136. [Google Scholar] [CrossRef] [Green Version]
- Mendonca, T.; Ferreira, P.M.; Marques, J.; Marcal, A.R.S.; Rozeira, J. PH2-A dermoscopic image database for research and benchmarking. In Proceedings of the 35th Internacional Conference of the IEEE Engineering in Medicine and Biology Society, Osaka, Japan, 3–7 July 2013. [Google Scholar]
- Goyal, M.; Oakley, A.; Bansal, P.; Dancey, D.; Yap, M.H. Skin lesion segmentation in dermoscopic images with ensemble deep learning methods. IEEE Access 2019, 8, 4171–4181. [Google Scholar] [CrossRef]
- Bi, L.; Kim, J.; Ahn, E.; Kumar, A.; Feng, D.; Fulham, M. Step-wise integration of deep class-specific learning for dermoscopic image segmentation. Pattern Recognit. 2019, 85, 78–89. [Google Scholar] [CrossRef] [Green Version]
- Eltayef, K.; Li, Y.; Liu, X. Detection of melanoma skin cancer in dermoscopic images. J. Phys. Conf. Ser. 2017, 787, 012034. [Google Scholar] [CrossRef] [Green Version]
- Nida, N.; Irtaza, A.; Javed, A.; Yousaf, M. Melanoma lesion detection and segmentation using deep región based convolutional neural network and fuzzy C-means clustering. Int. J. Med. Inform. 2019, 124, 37–48. [Google Scholar] [CrossRef] [PubMed]
- Tajeddin, N.Z.; Asl, B.M. Melanoma recognition in dermoscopic images using lesion’s peripheral región information. Comput. Methods Programs Biomed. 2018, 163, 143–153. [Google Scholar] [CrossRef]
- Al-Masni, M.A.; Al-Antari, M.A.; Choi, M.T.; Han, S.M.; Kim, T.S. Skin lesion segmentation in dermoscopic image via deep full resolution convolutional networks. Comput. Methods Programs Biomed. 2018, 162, 221–231. [Google Scholar] [CrossRef]


| Statistical Features | Expression |
|---|---|
| Mean | |
| Standard Deviation | |
| Smoothness | |
| Skewness | |
| Kurtosis | |
| Uniformity | |
| Average Histogram | |
| Modified Skew | |
| Modified Standar Deviation | |
| Entropy | |
| Modified Entropy |
| True Condition Status | |||
|---|---|---|---|
| Positive | Negative | ||
| Test Result | Positive | TP = 34 | FP = 2 |
| Negative | FN = 2 | TN = 152 | |
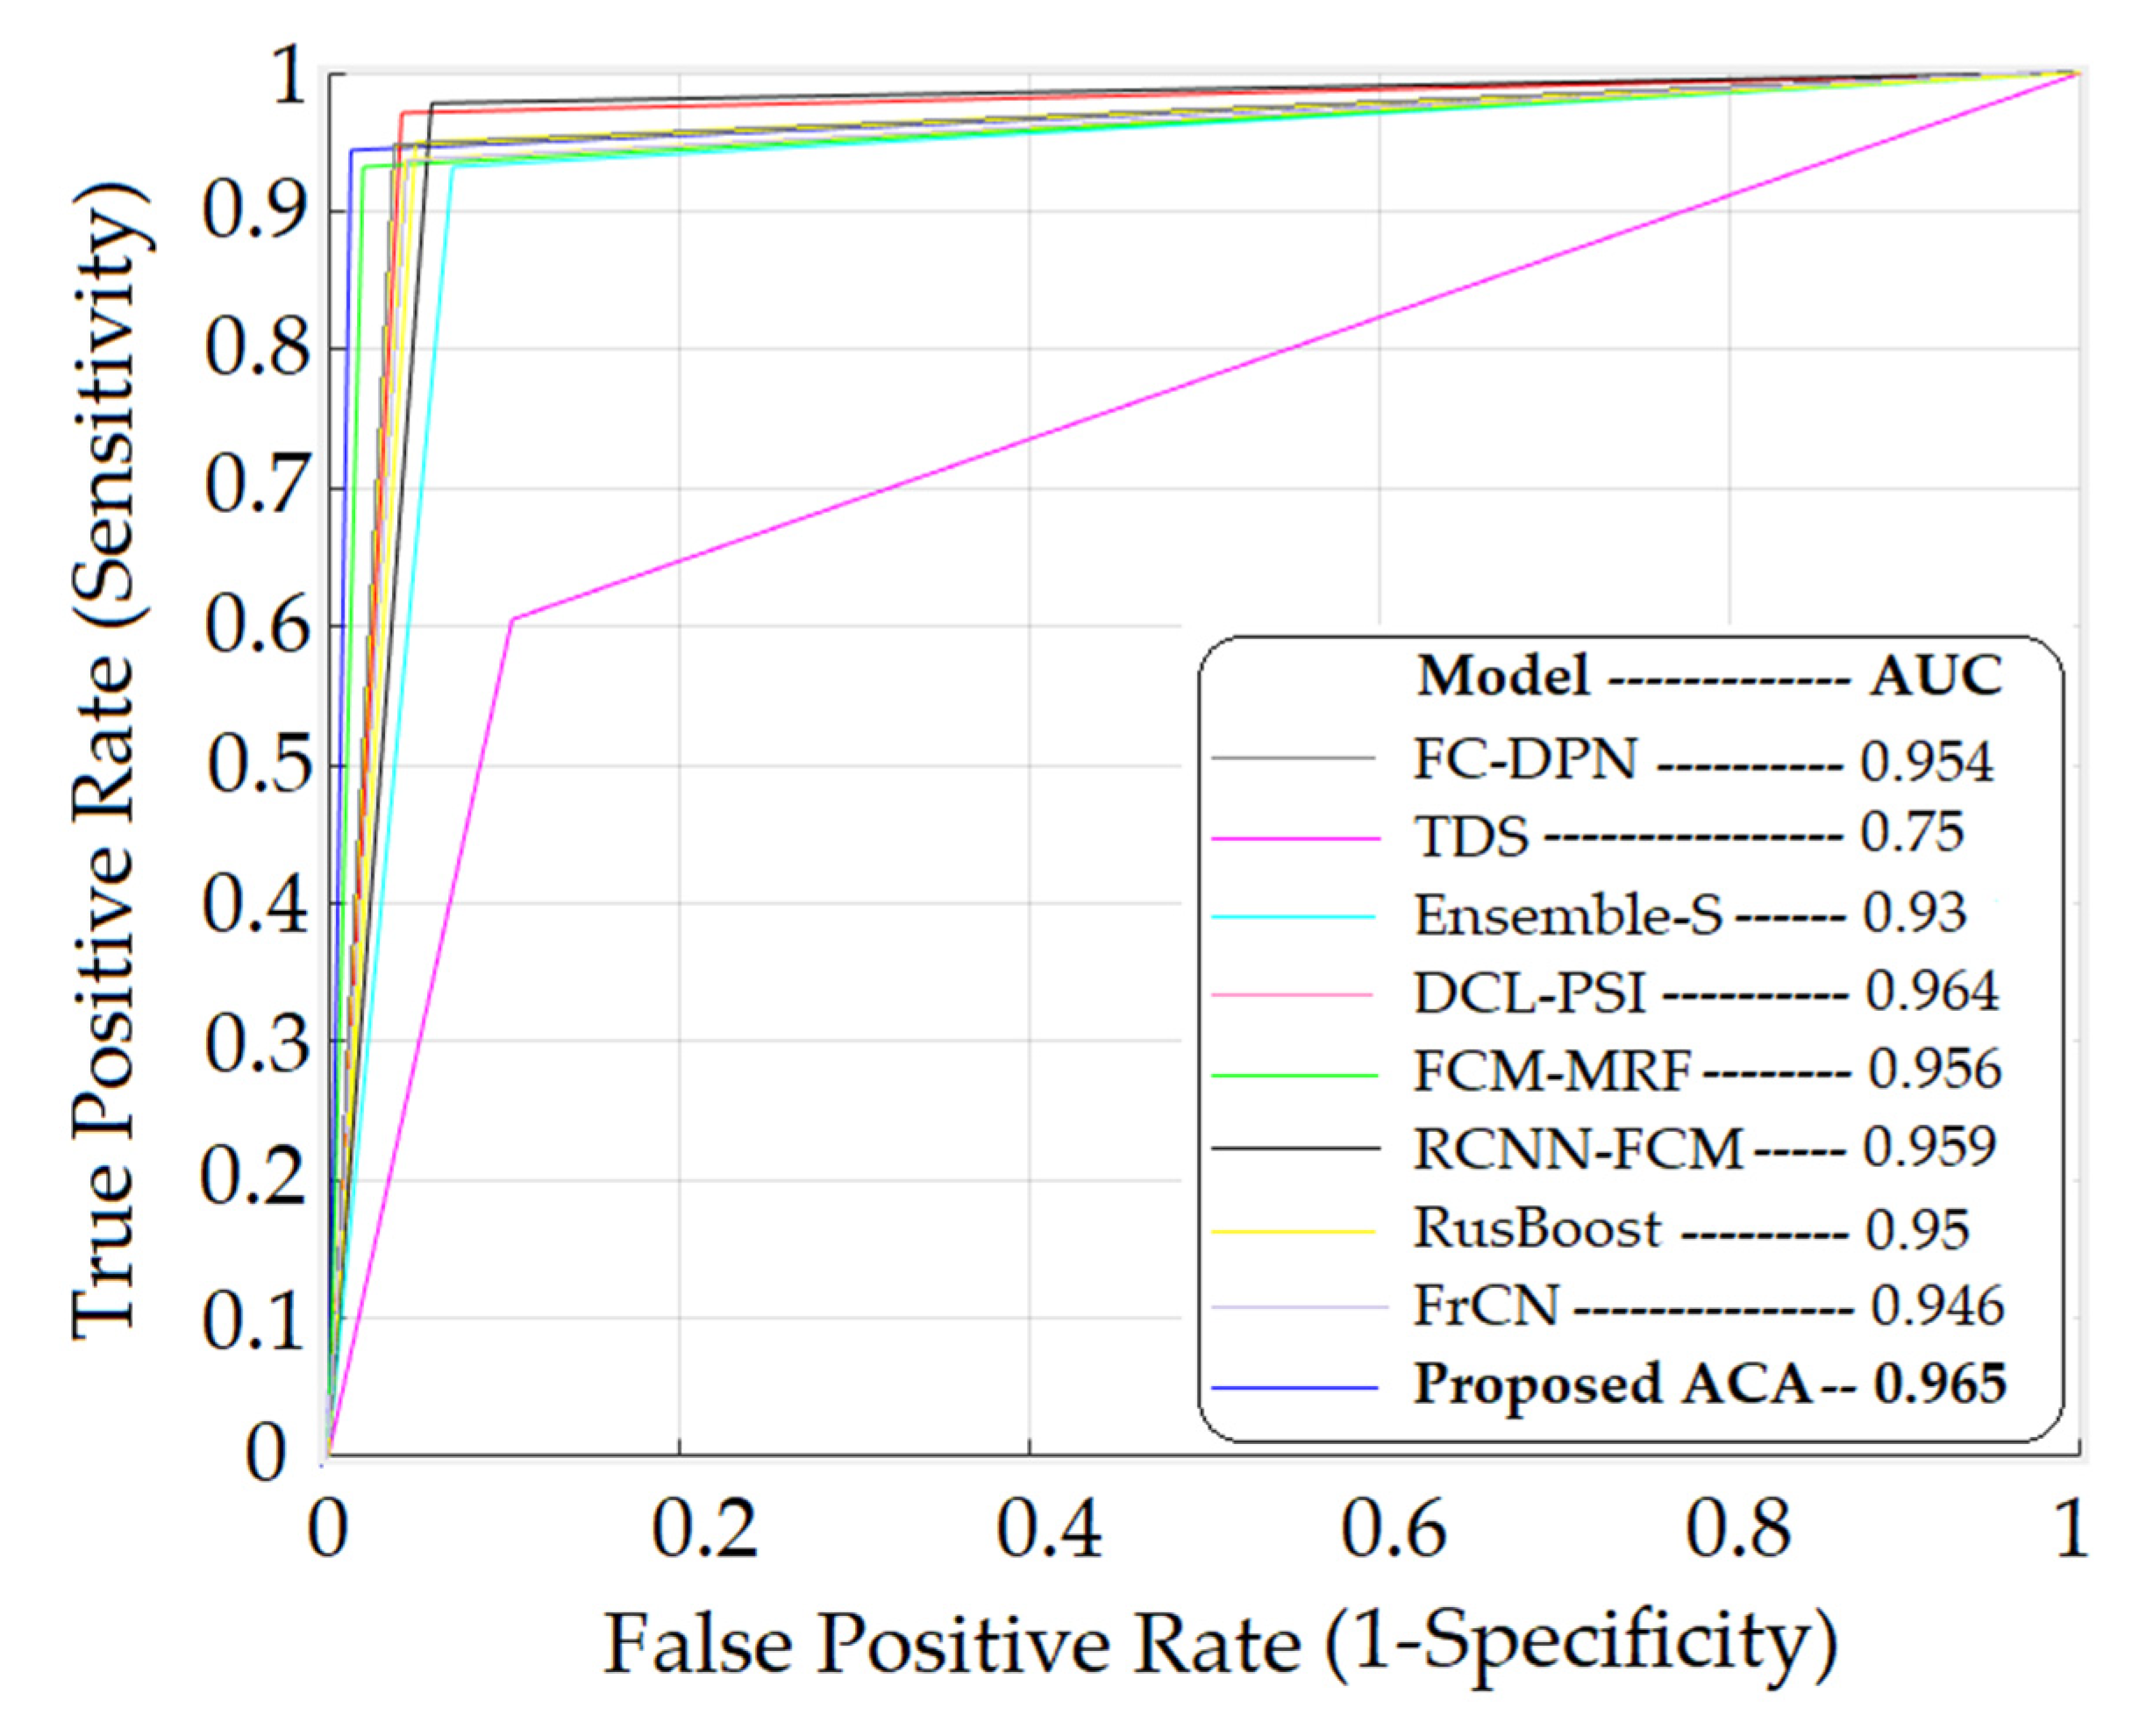
| Method | Classifier | ACC | SE | SP |
|---|---|---|---|---|
| Shan et al. [14] | FC-DPN | 0.936 | 0.947 | 0.962 |
| Mohammed et al. [18] | TDS | 0.84 | 0.605 | 0.895 |
| Goyal et al. [37] | Ensemble-S | 0.938 | 0.932 | 0.929 |
| Bi et al. [38] | DCL-PSI | 0.966 | 0.971 | 0.958 |
| Eltayef et al. [39] | FCM-MRF | 0.94 | 0.932 | 0.980 |
| Nida et al. [40] | RCNN-FCM | 0.948 | 0.978 | 0.941 |
| Tajeddin et al. [41] | RUSBoost | 0.950 | 0.950 | 0.950 |
| Al-Masni et al. [42] | FrCN | 0.950 | 0.937 | 0.956 |
| Proposed | ACA | 0.978 | 0.944 | 0.987 |
Publisher’s Note: MDPI stays neutral with regard to jurisdictional claims in published maps and institutional affiliations. |
© 2022 by the authors. Licensee MDPI, Basel, Switzerland. This article is an open access article distributed under the terms and conditions of the Creative Commons Attribution (CC BY) license (https://creativecommons.org/licenses/by/4.0/).
Share and Cite
Luna-Benoso, B.; Martínez-Perales, J.C.; Cortés-Galicia, J.; Flores-Carapia, R.; Silva-García, V.M. Melanoma Detection in Dermoscopic Images Using a Cellular Automata Classifier. Computers 2022, 11, 8. https://doi.org/10.3390/computers11010008
Luna-Benoso B, Martínez-Perales JC, Cortés-Galicia J, Flores-Carapia R, Silva-García VM. Melanoma Detection in Dermoscopic Images Using a Cellular Automata Classifier. Computers. 2022; 11(1):8. https://doi.org/10.3390/computers11010008
Chicago/Turabian StyleLuna-Benoso, Benjamín, José Cruz Martínez-Perales, Jorge Cortés-Galicia, Rolando Flores-Carapia, and Víctor Manuel Silva-García. 2022. "Melanoma Detection in Dermoscopic Images Using a Cellular Automata Classifier" Computers 11, no. 1: 8. https://doi.org/10.3390/computers11010008
APA StyleLuna-Benoso, B., Martínez-Perales, J. C., Cortés-Galicia, J., Flores-Carapia, R., & Silva-García, V. M. (2022). Melanoma Detection in Dermoscopic Images Using a Cellular Automata Classifier. Computers, 11(1), 8. https://doi.org/10.3390/computers11010008