Author Contributions
Conceptualization, P.M., B.S. and A.K.; methodology, P.M., B.S. and A.K.; software, P.M. and B.S.; validation, P.M., B.S. and A.K.; investigation, P.M., B.S. and A.K.; writing—original draft preparation, P.M., B.S. and A.K.; writing—review and editing, P.M., B.S. and A.K.; supervision, A.K.; project administration, A.K. All authors have read and agreed to the published version of the manuscript.
Figure 1.
Example of a Markov matrix.
Figure 1.
Example of a Markov matrix.
Figure 2.
A property graph: nodes, relationships, and properties.
Figure 2.
A property graph: nodes, relationships, and properties.
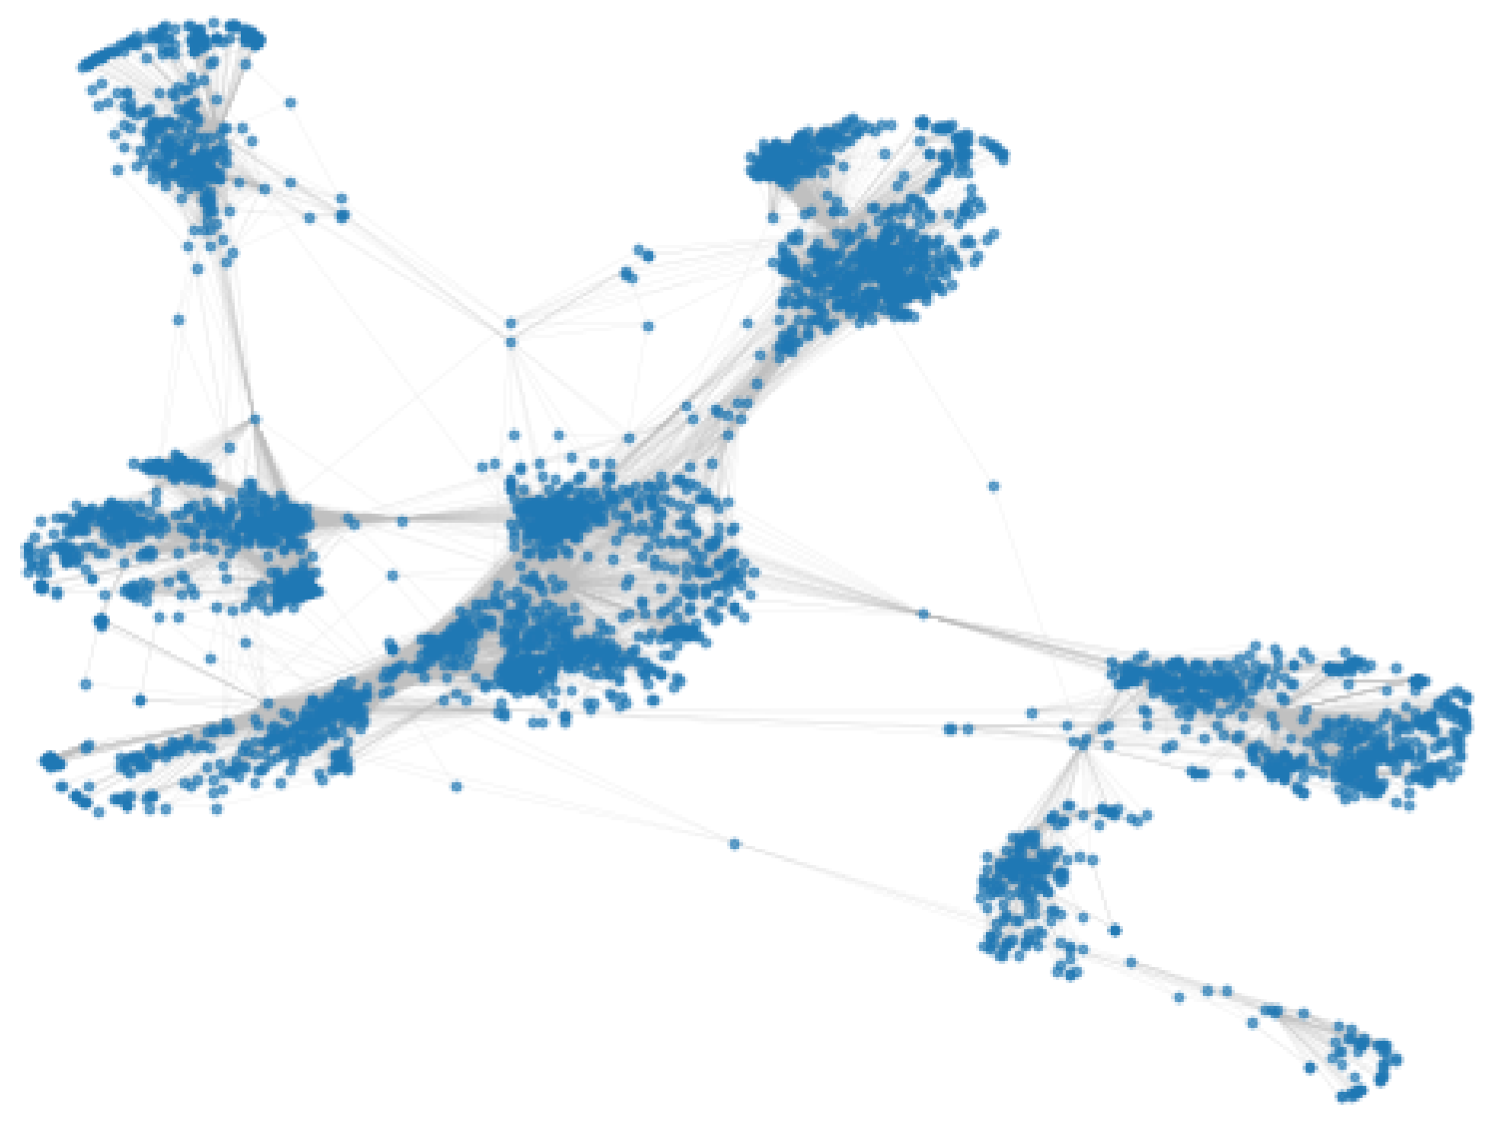
Figure 3.
Social network: fb-combined.
Figure 3.
Social network: fb-combined.
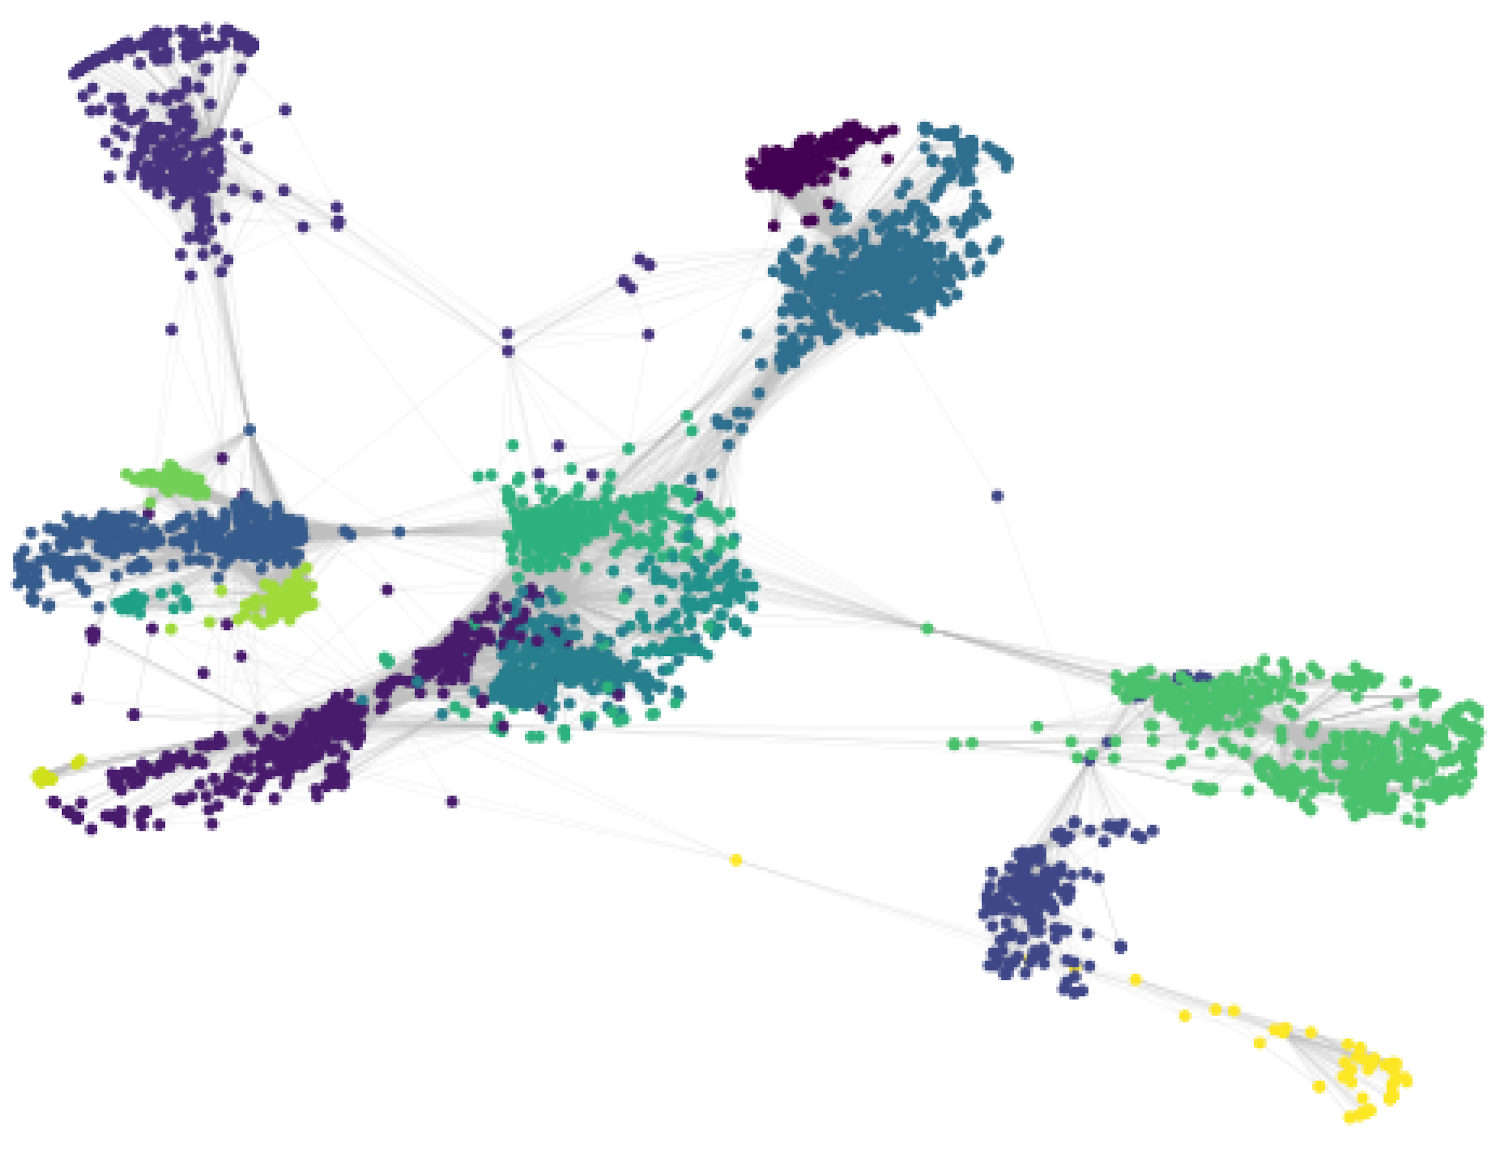
Figure 4.
Markov clusters on fb network.
Figure 4.
Markov clusters on fb network.
Figure 5.
Louvain clusters on fb network.
Figure 5.
Louvain clusters on fb network.
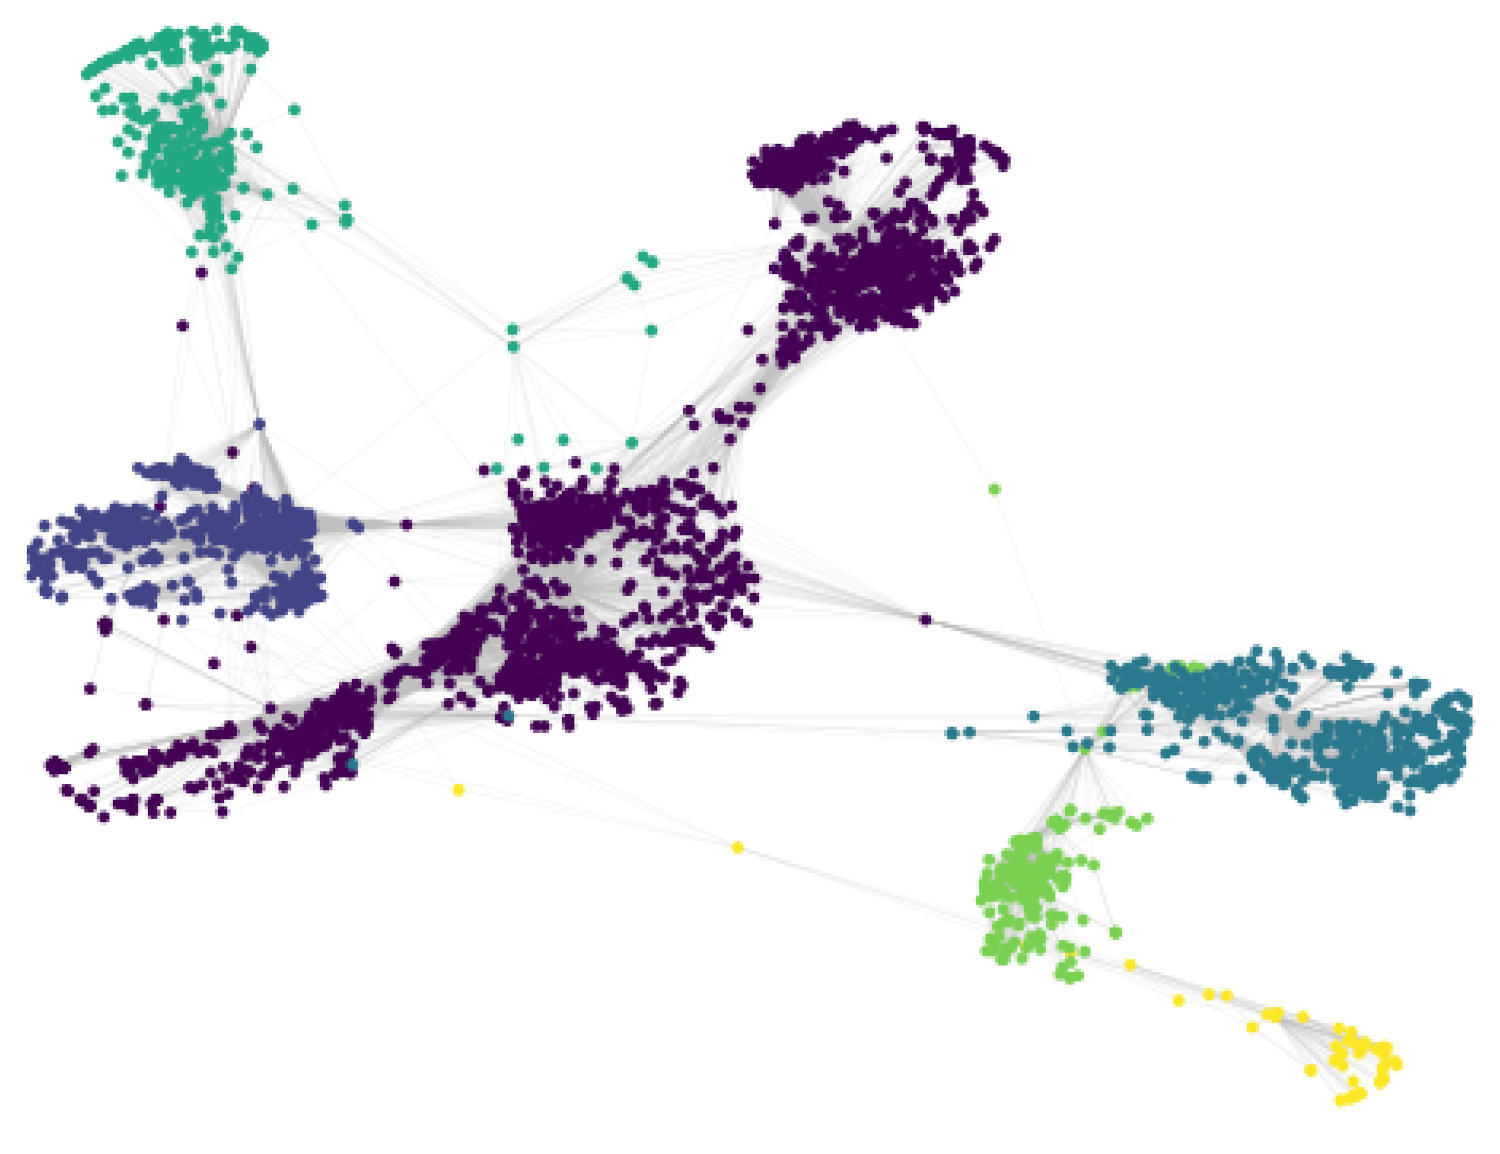
Figure 6.
Paris clusters on fb network.
Figure 6.
Paris clusters on fb network.
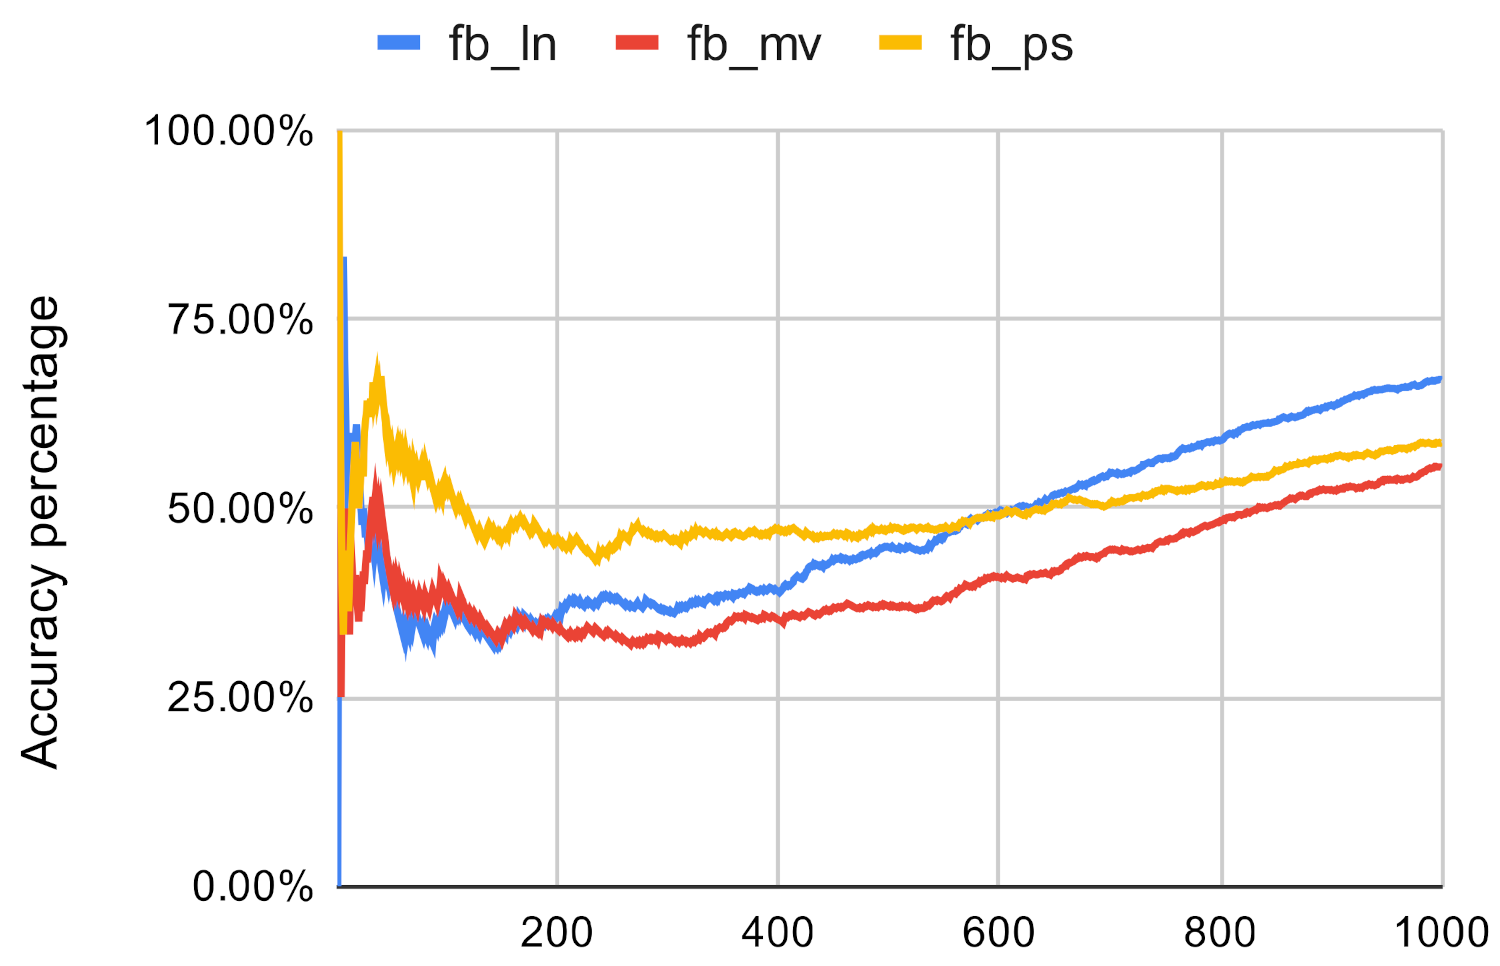
Figure 7.
Investigated methods’ accuracy in the case of closeness centrality on fb.
Figure 7.
Investigated methods’ accuracy in the case of closeness centrality on fb.
Figure 8.
Investigated methods’ accuracy in the case of betweenness centrality on fb.
Figure 8.
Investigated methods’ accuracy in the case of betweenness centrality on fb.
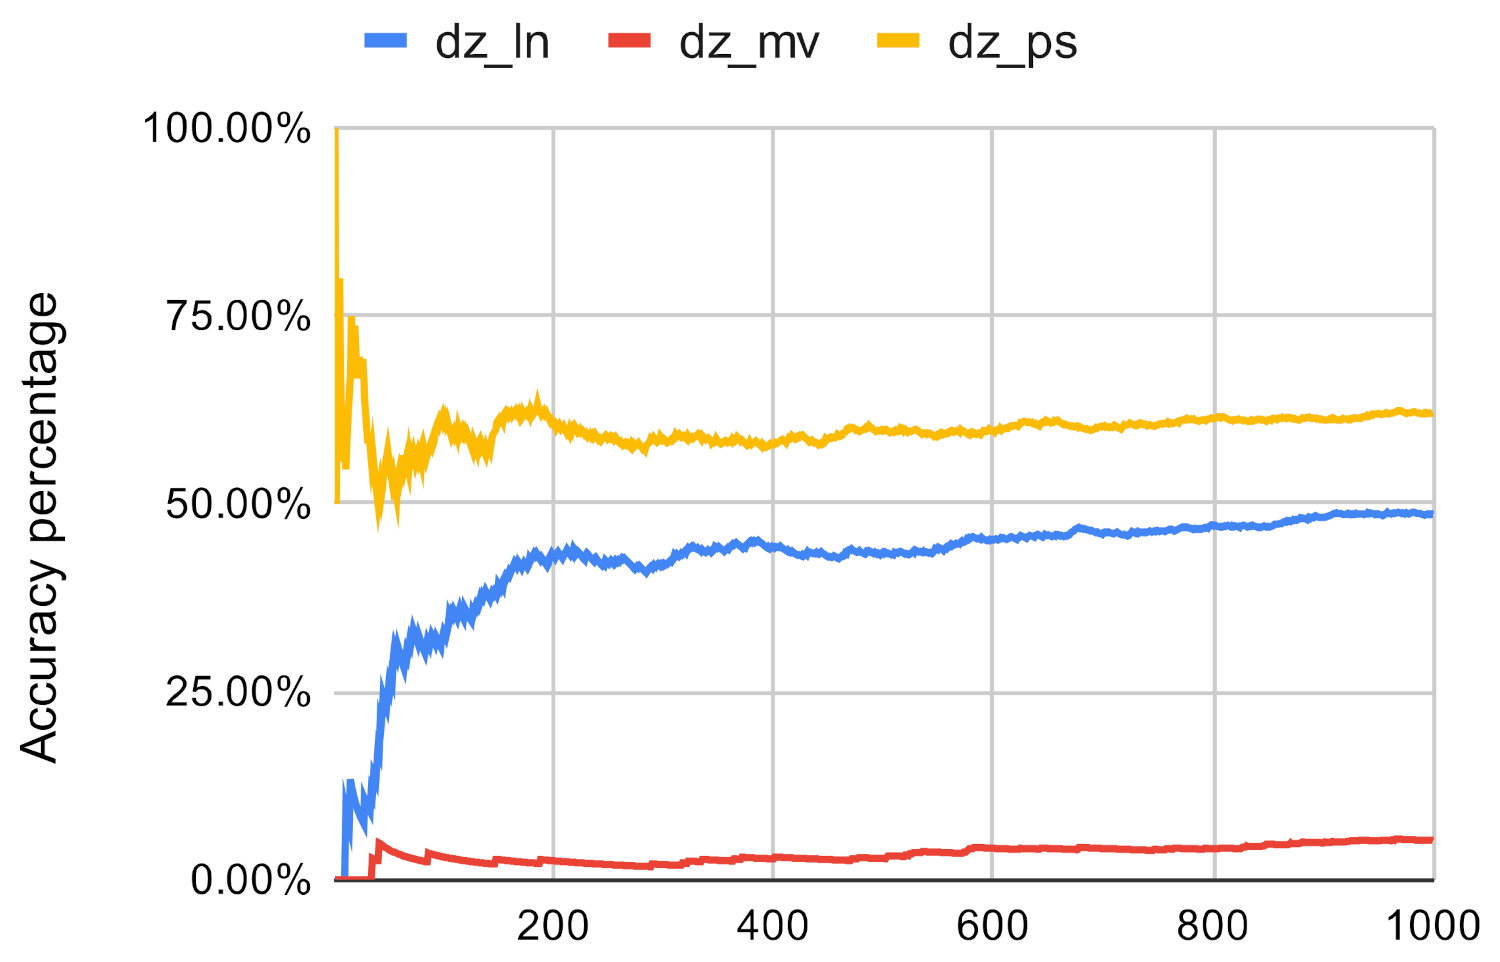
Figure 9.
Investigated methods’ accuracy in the case of closeness centrality on dz.
Figure 9.
Investigated methods’ accuracy in the case of closeness centrality on dz.
Figure 10.
Investigated methods’ accuracy in the case of betweenness centrality on dz.
Figure 10.
Investigated methods’ accuracy in the case of betweenness centrality on dz.
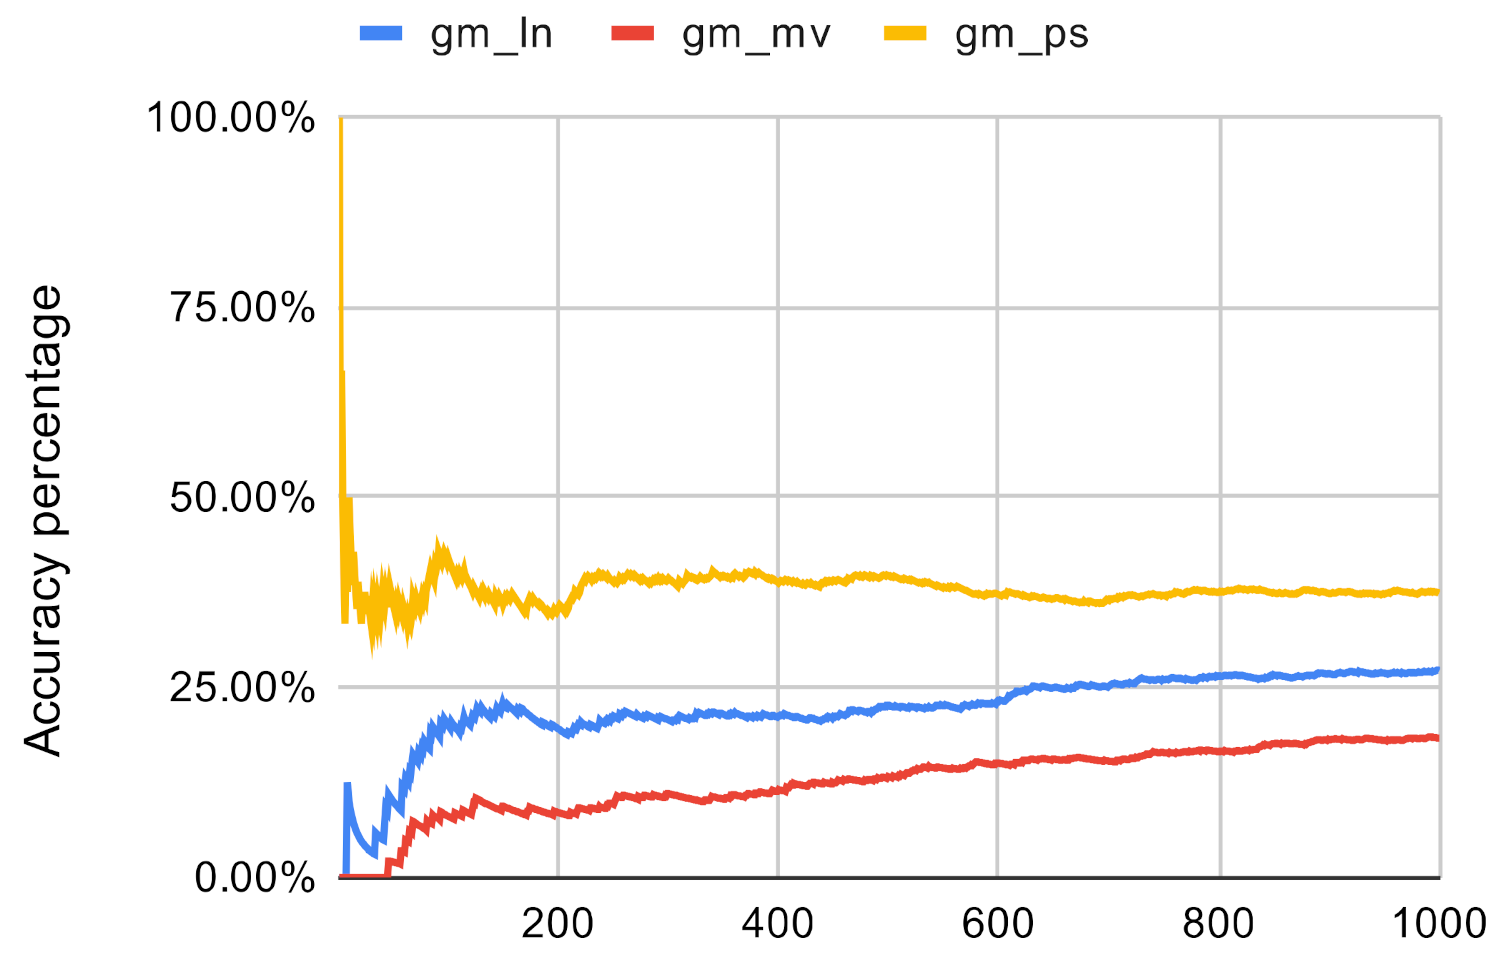
Figure 11.
Investigated methods’ accuracy in the case of closeness centrality on gm.
Figure 11.
Investigated methods’ accuracy in the case of closeness centrality on gm.
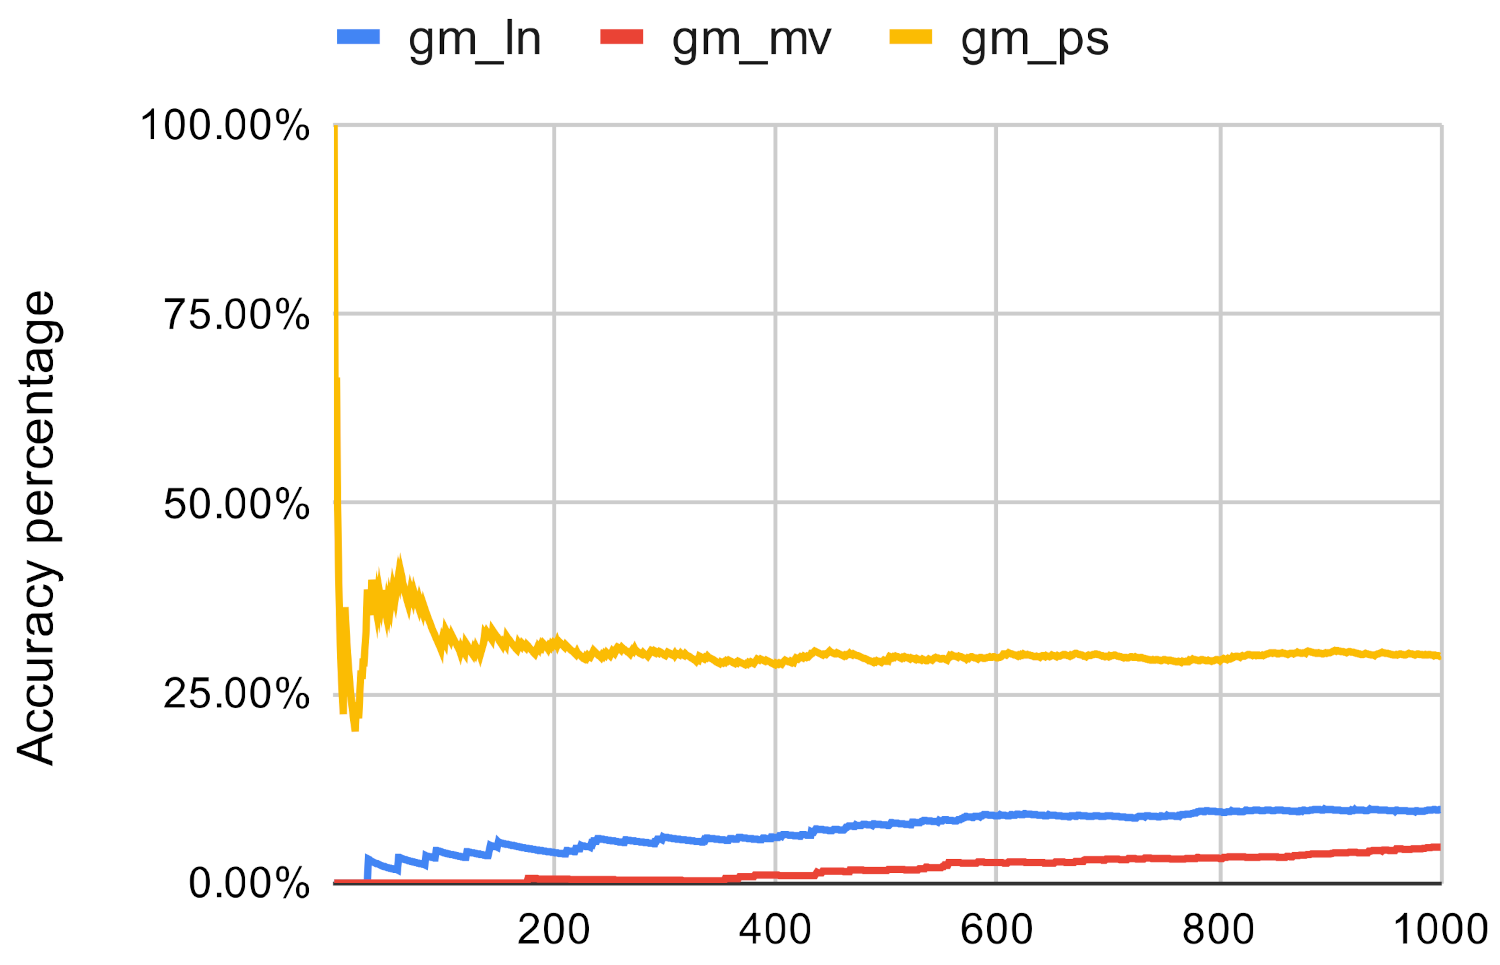
Figure 12.
Investigated methods’ accuracy in the case of betwenness centrality on gm.
Figure 12.
Investigated methods’ accuracy in the case of betwenness centrality on gm.
Figure 13.
Investigated methods’ sum accuracy in the case of betweenness centrality on fb.
Figure 13.
Investigated methods’ sum accuracy in the case of betweenness centrality on fb.
Figure 14.
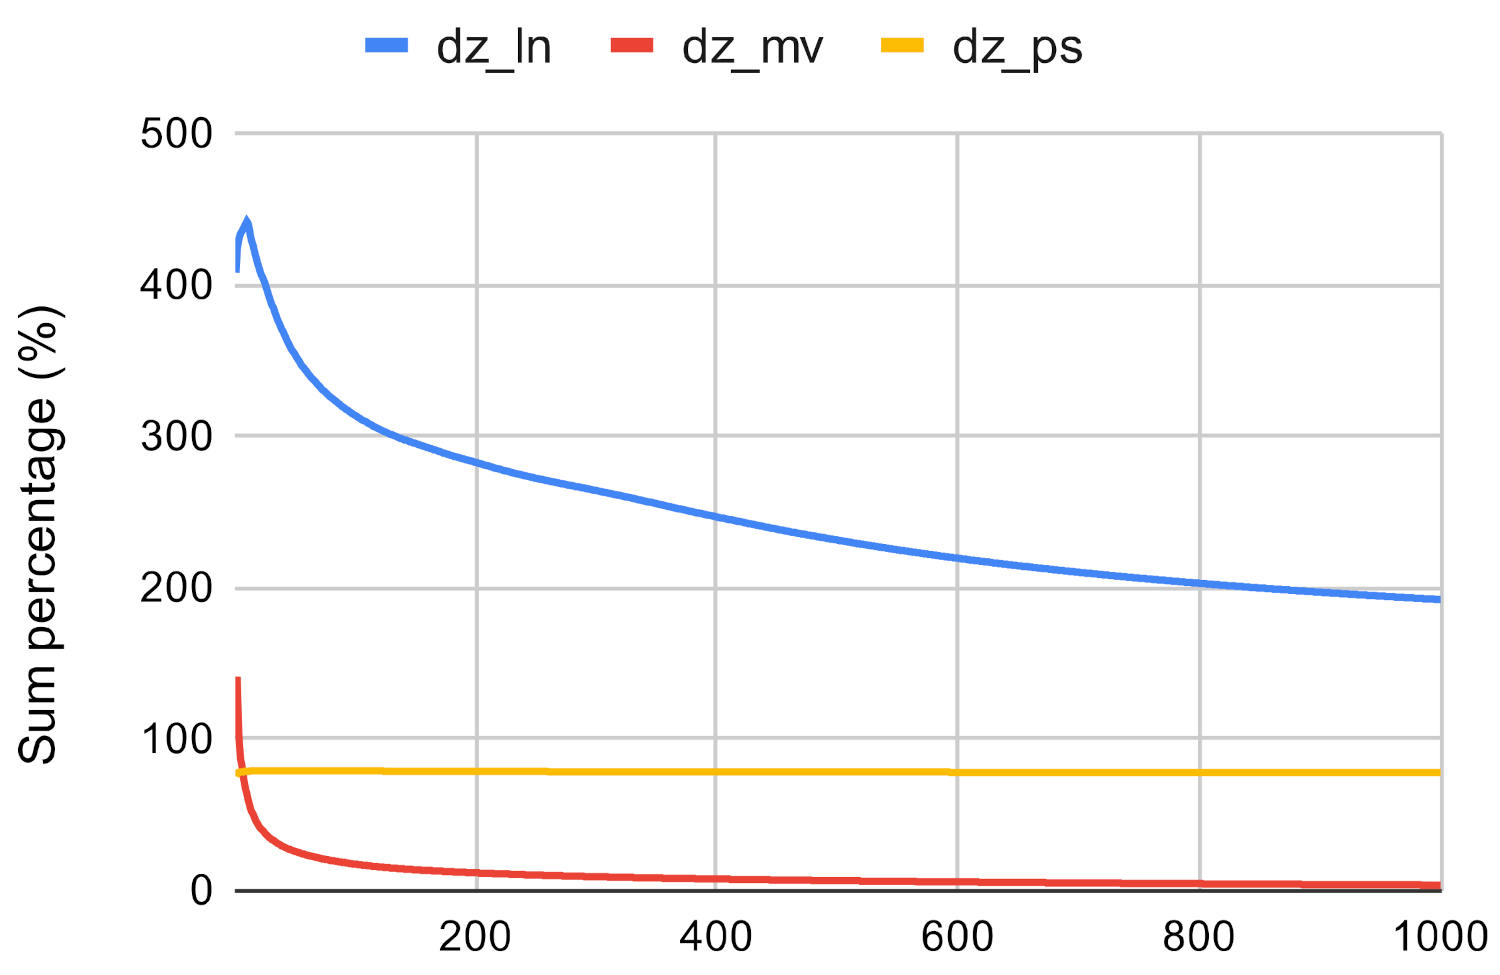
Investigated methods’ sum accuracy in the case of betweenness centrality on dz.
Figure 14.
Investigated methods’ sum accuracy in the case of betweenness centrality on dz.
Figure 15.
Investigated methods’ sum accuracy in the case of betwenness centrality on gm.
Figure 15.
Investigated methods’ sum accuracy in the case of betwenness centrality on gm.
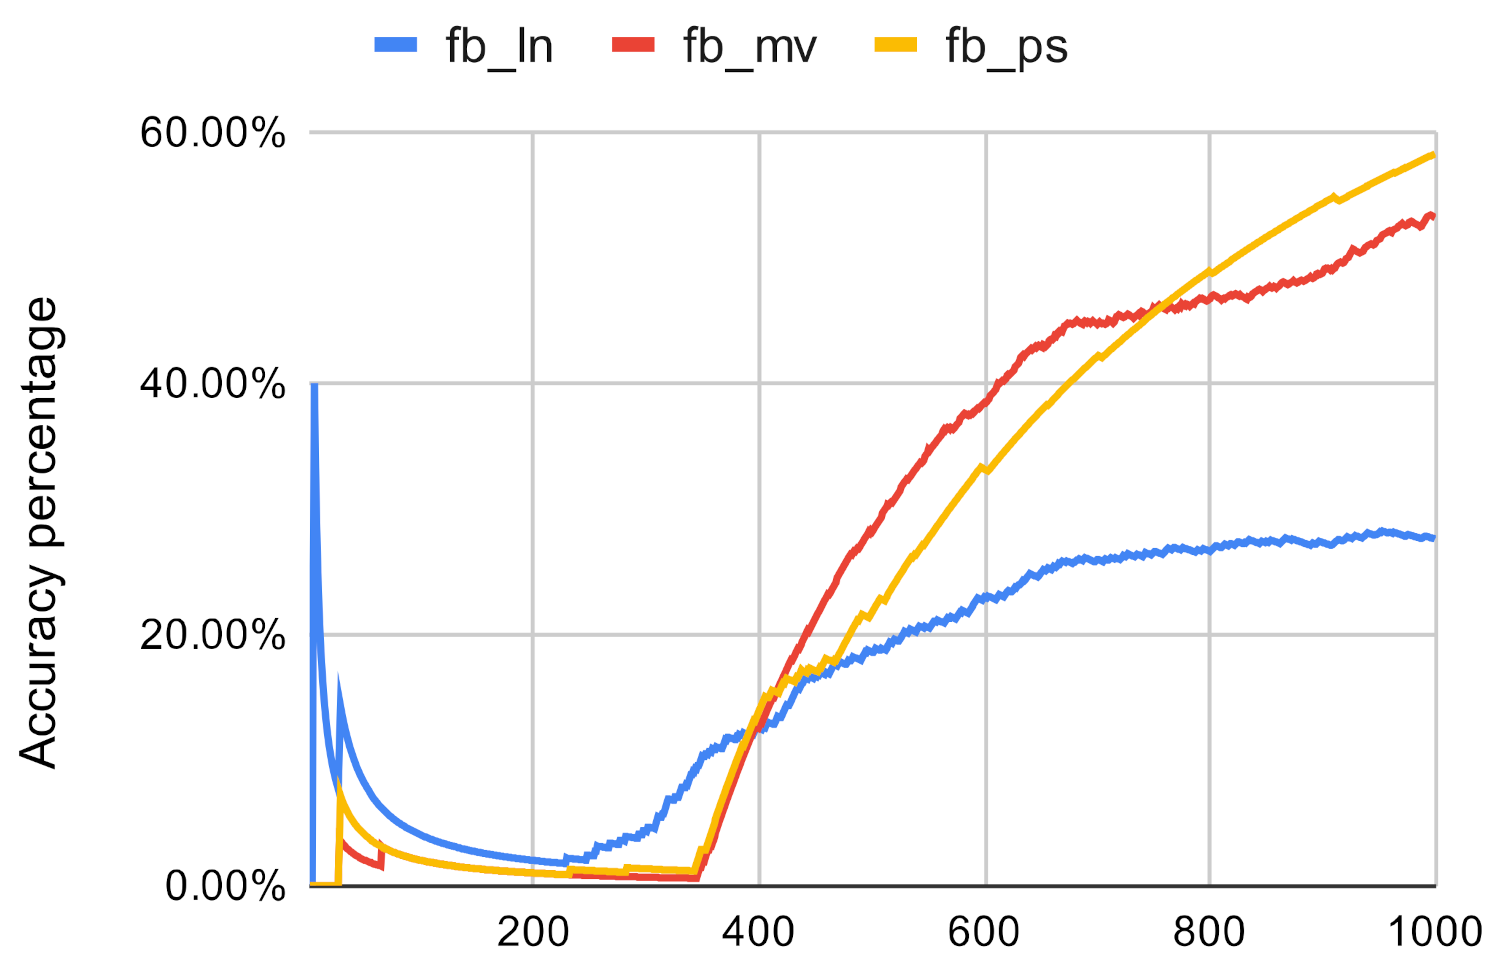
Figure 16.
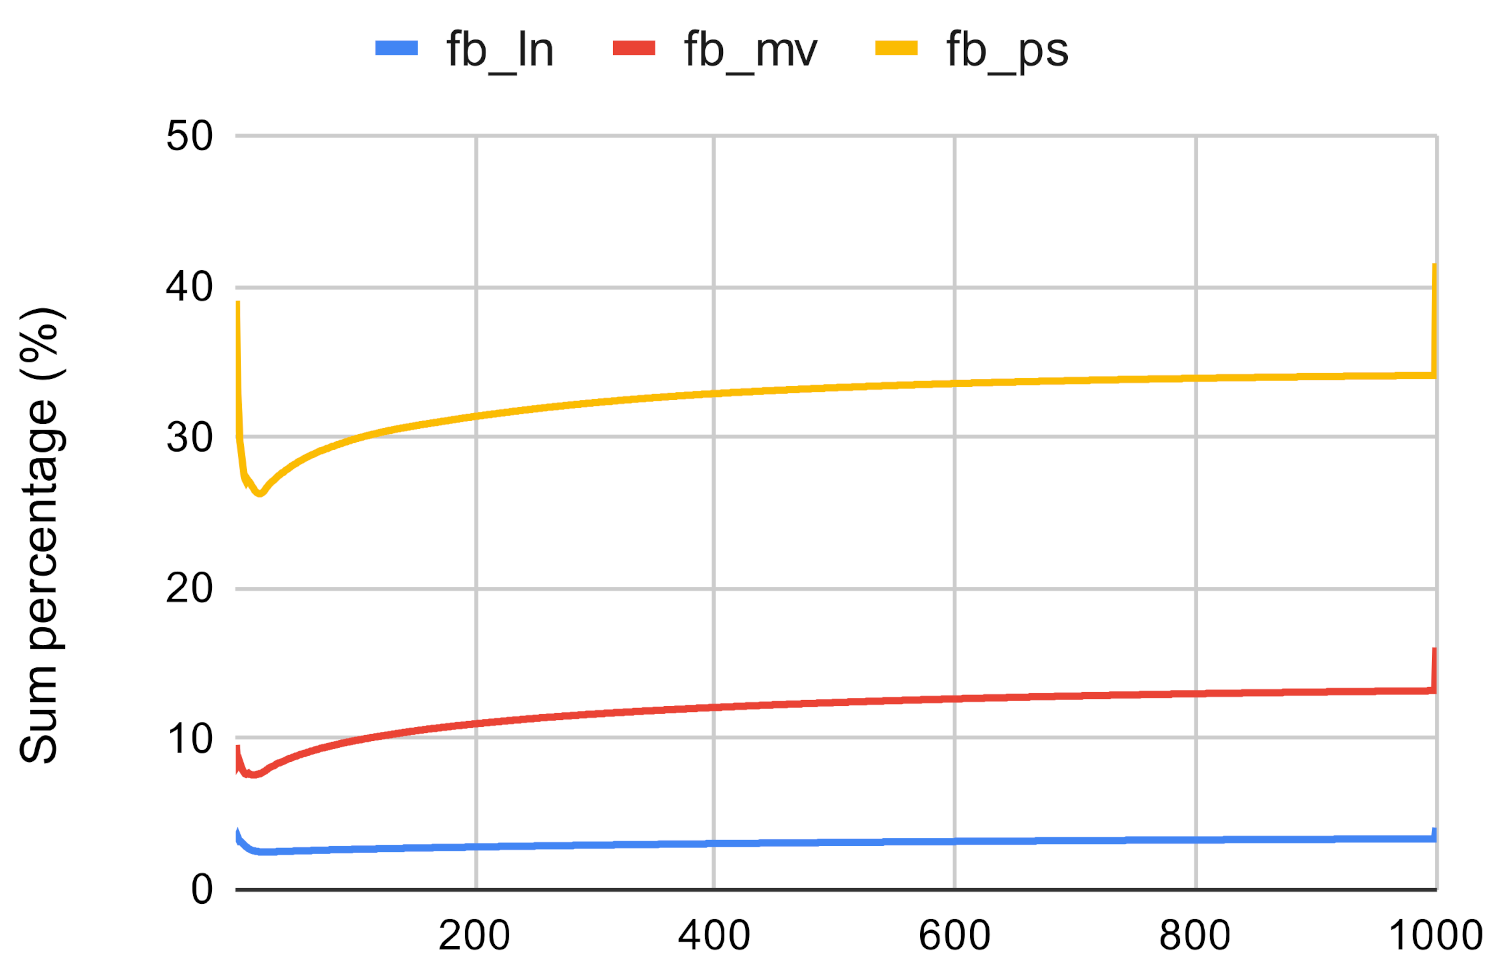
Investigated methods’ sum accuracy in the case of closeness centrality on fb.
Figure 16.
Investigated methods’ sum accuracy in the case of closeness centrality on fb.
Figure 17.
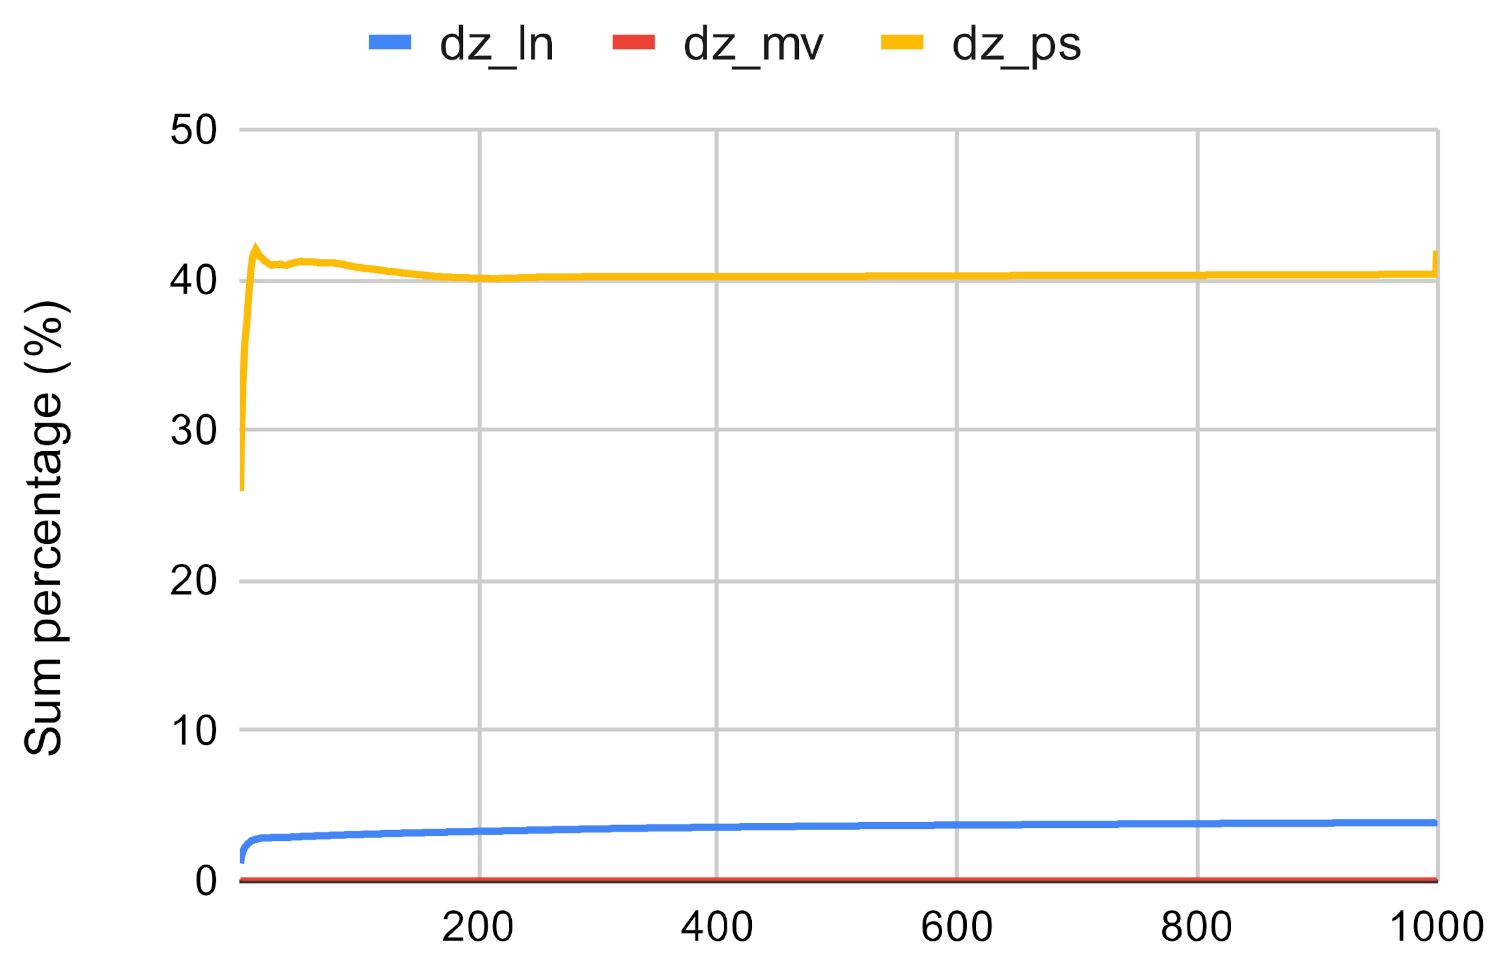
Investigated methods’ sum accuracy in the case of closeness centrality on dz.
Figure 17.
Investigated methods’ sum accuracy in the case of closeness centrality on dz.
Figure 18.
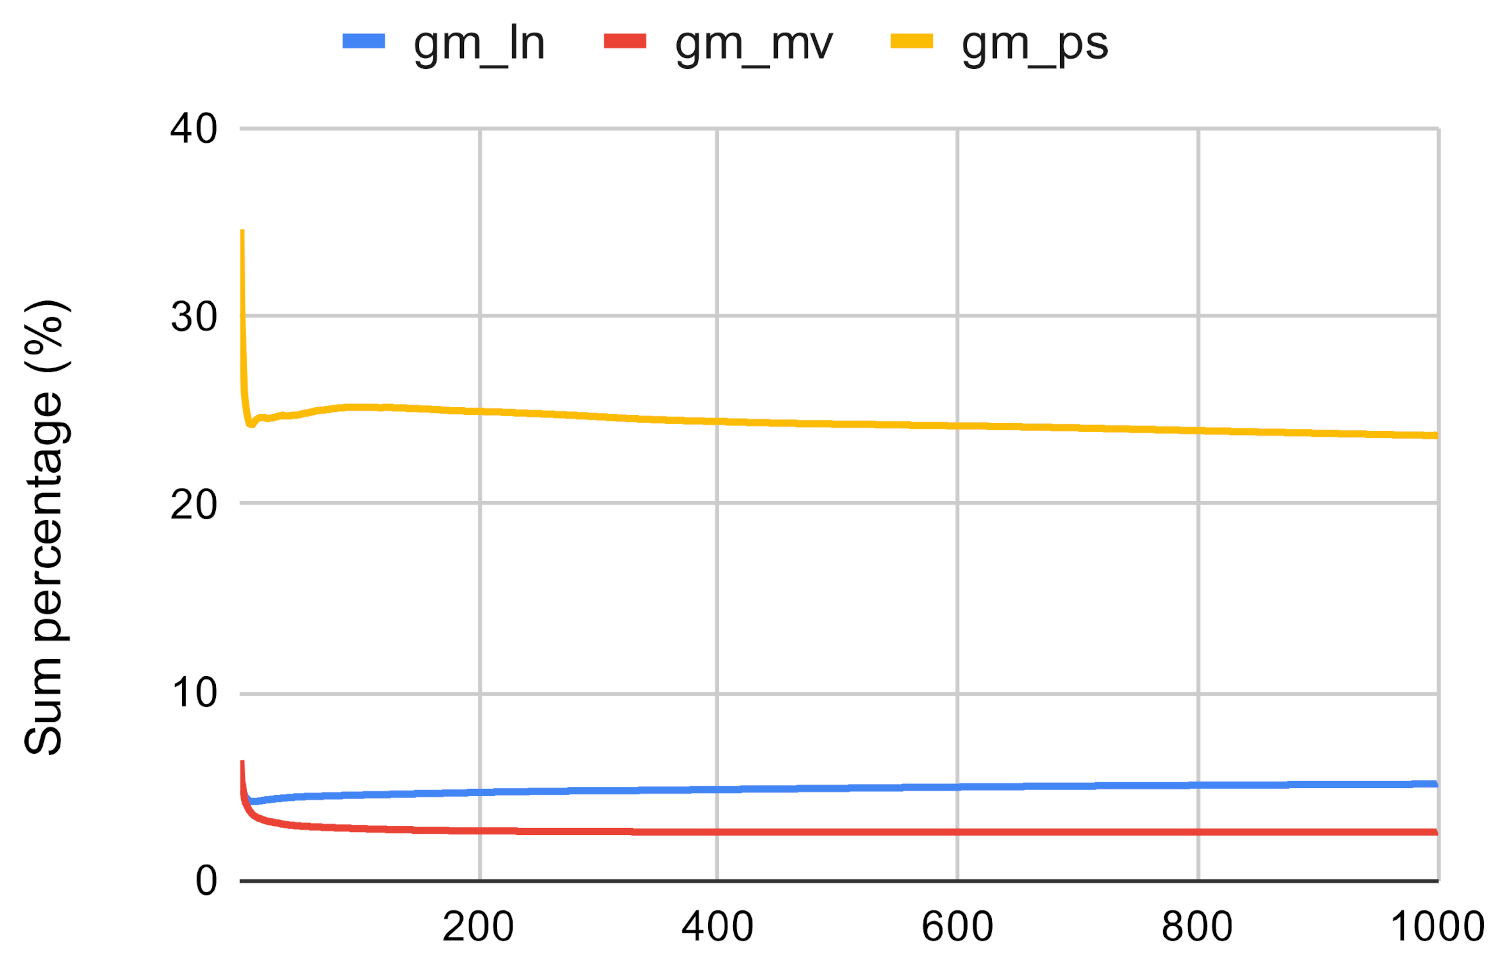
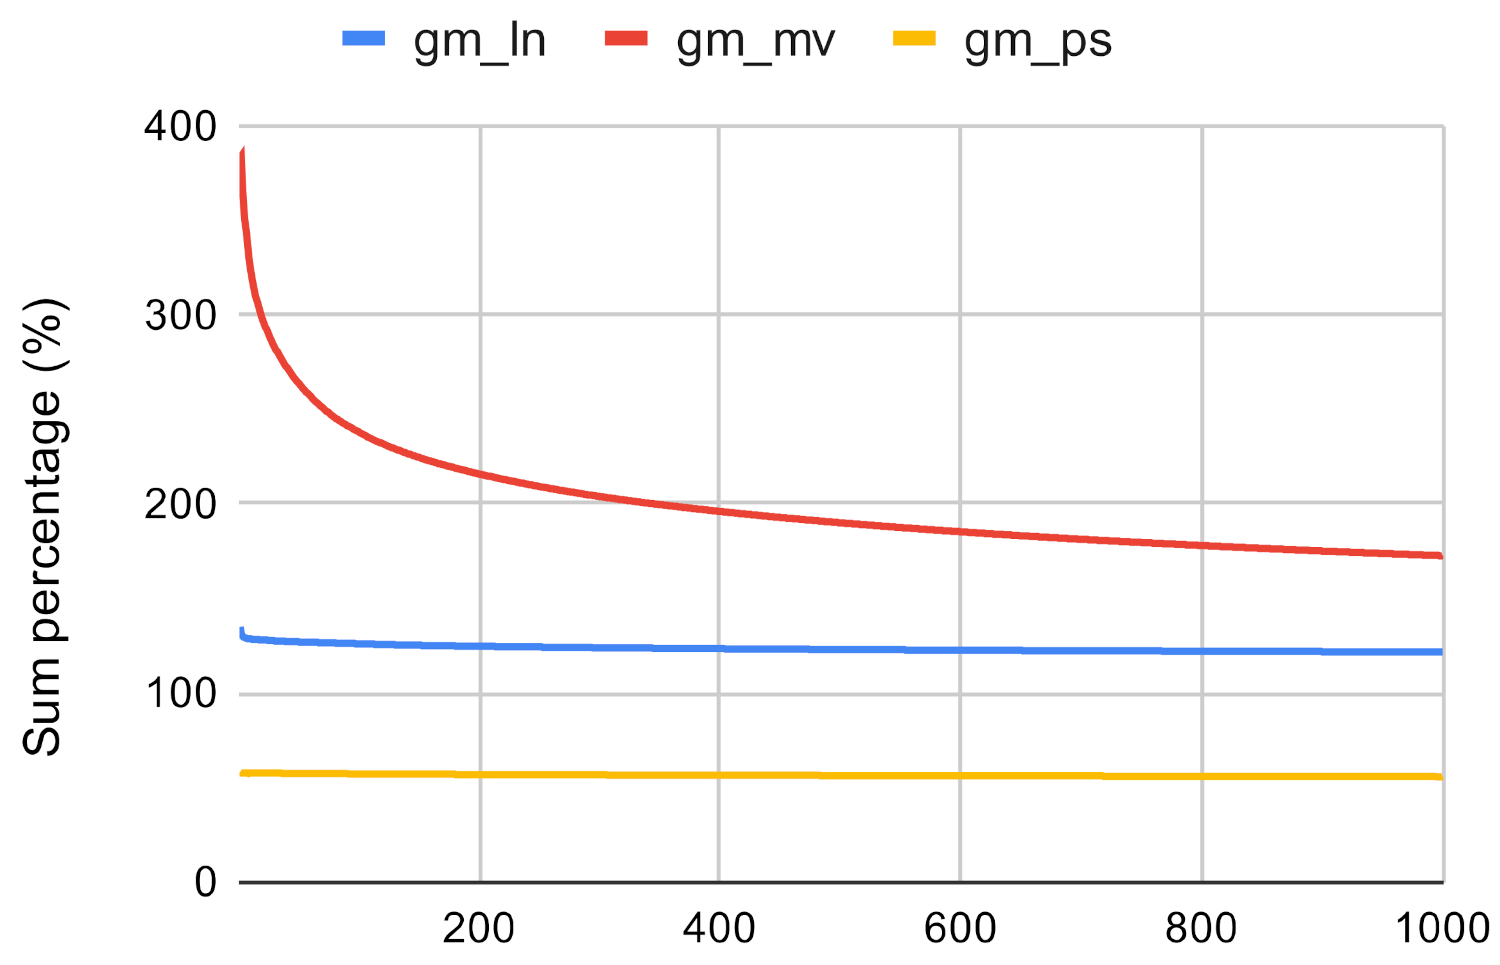
Investigated methods’ sum accuracy in the case of closeness centrality on gm.
Figure 18.
Investigated methods’ sum accuracy in the case of closeness centrality on gm.
Figure 19.
Centrality algorithms’ execution time on fb and dz.
Figure 19.
Centrality algorithms’ execution time on fb and dz.
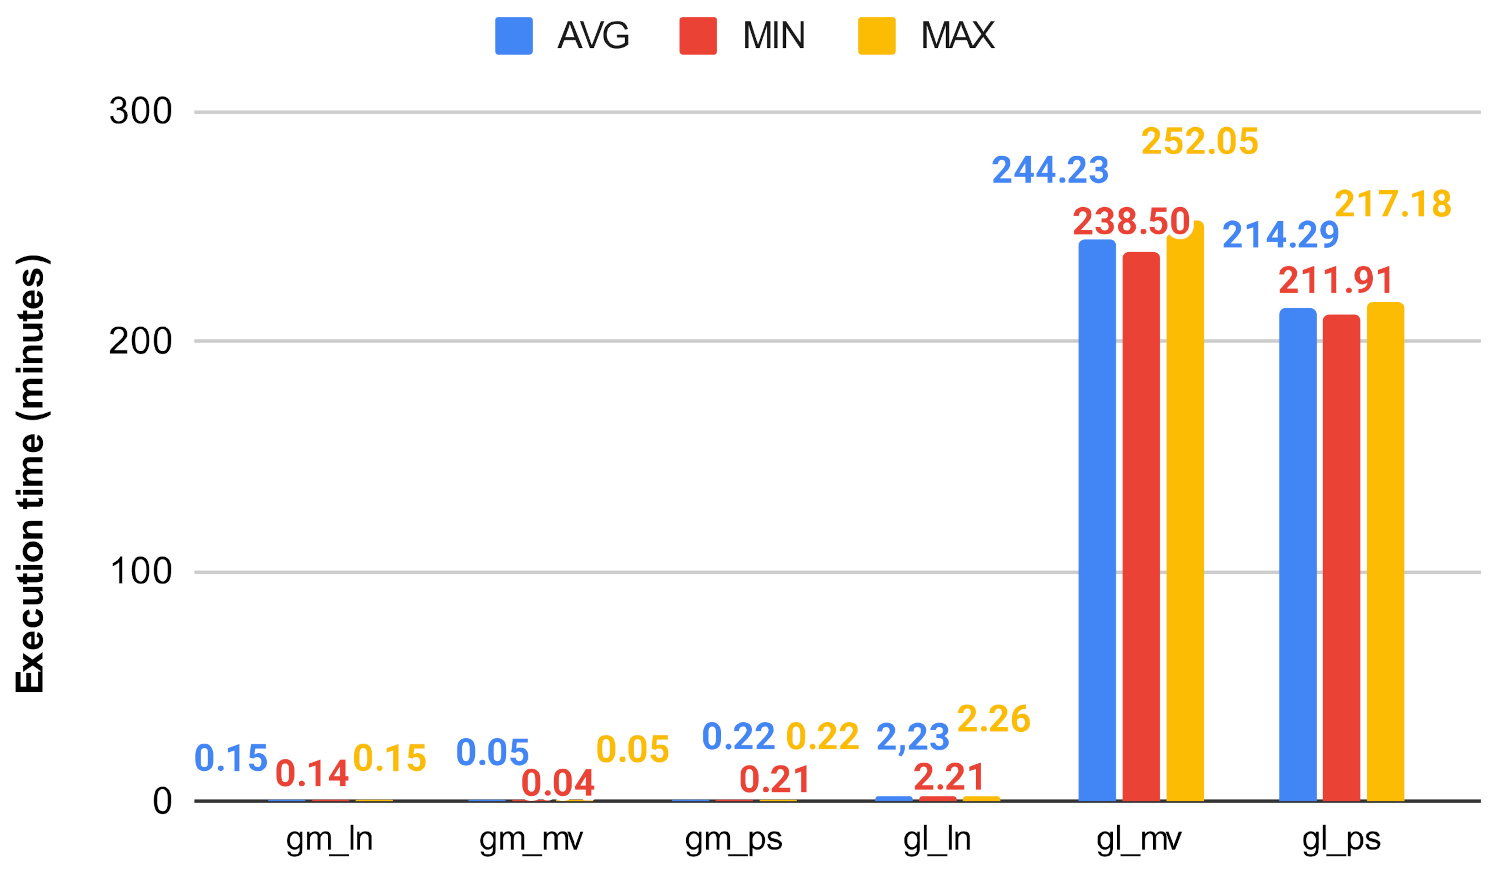
Figure 20.
Centrality algorithms’ execution time on gm and gl.
Figure 20.
Centrality algorithms’ execution time on gm and gl.
Figure 21.
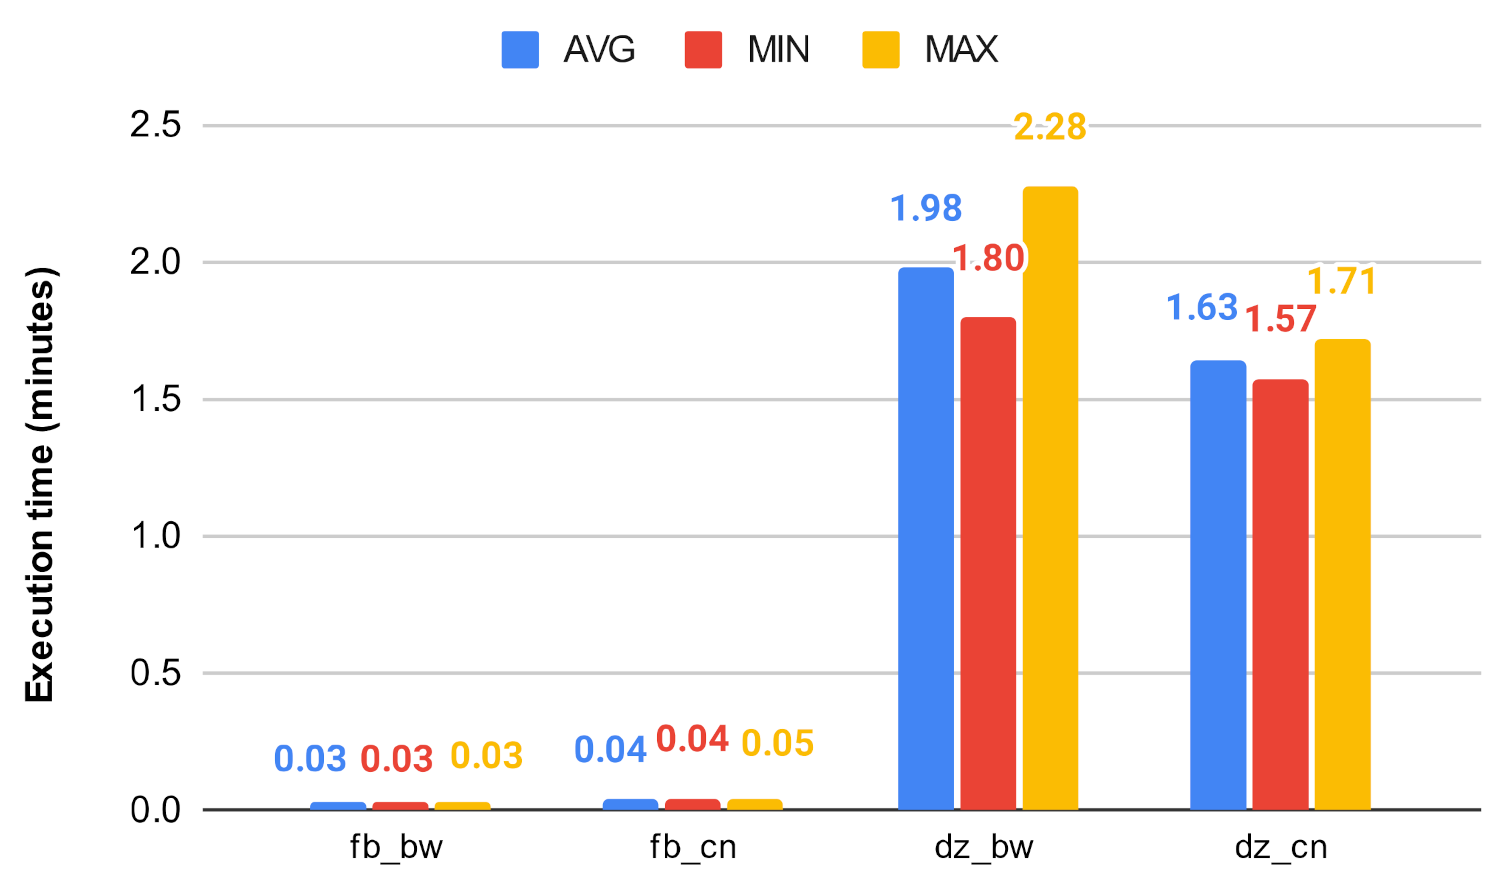
Betweenness algorithms’ execution time on fb and dz.
Figure 21.
Betweenness algorithms’ execution time on fb and dz.
Figure 22.
Betweenness algorithms’ execution time on gm and gl.
Figure 22.
Betweenness algorithms’ execution time on gm and gl.
Figure 23.
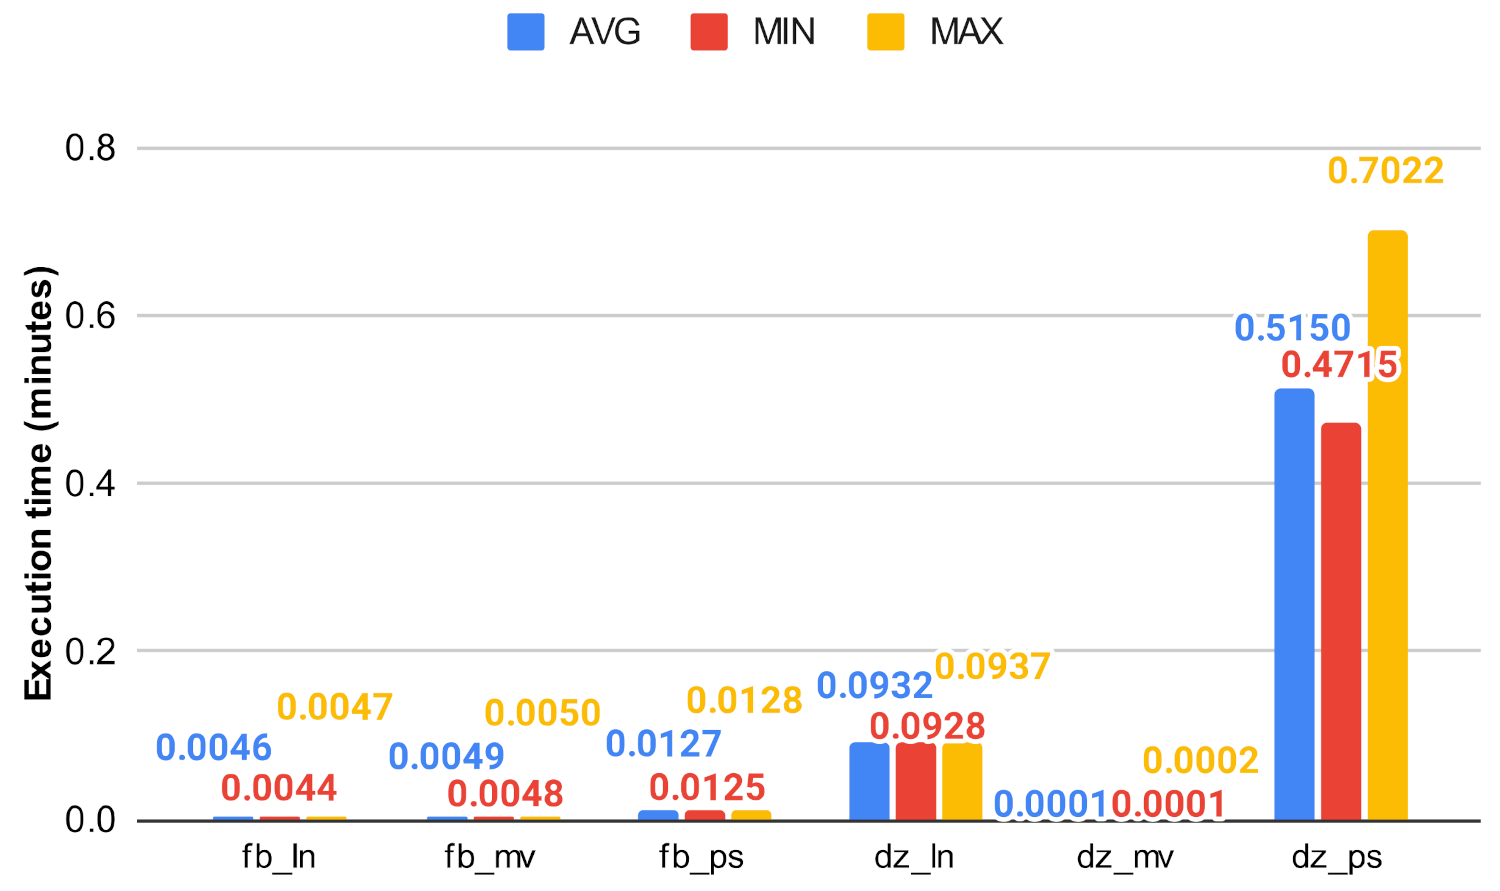
Closeness algorithm’s execution time on fb and dz using ln, mv, and ps.
Figure 23.
Closeness algorithm’s execution time on fb and dz using ln, mv, and ps.
Figure 24.
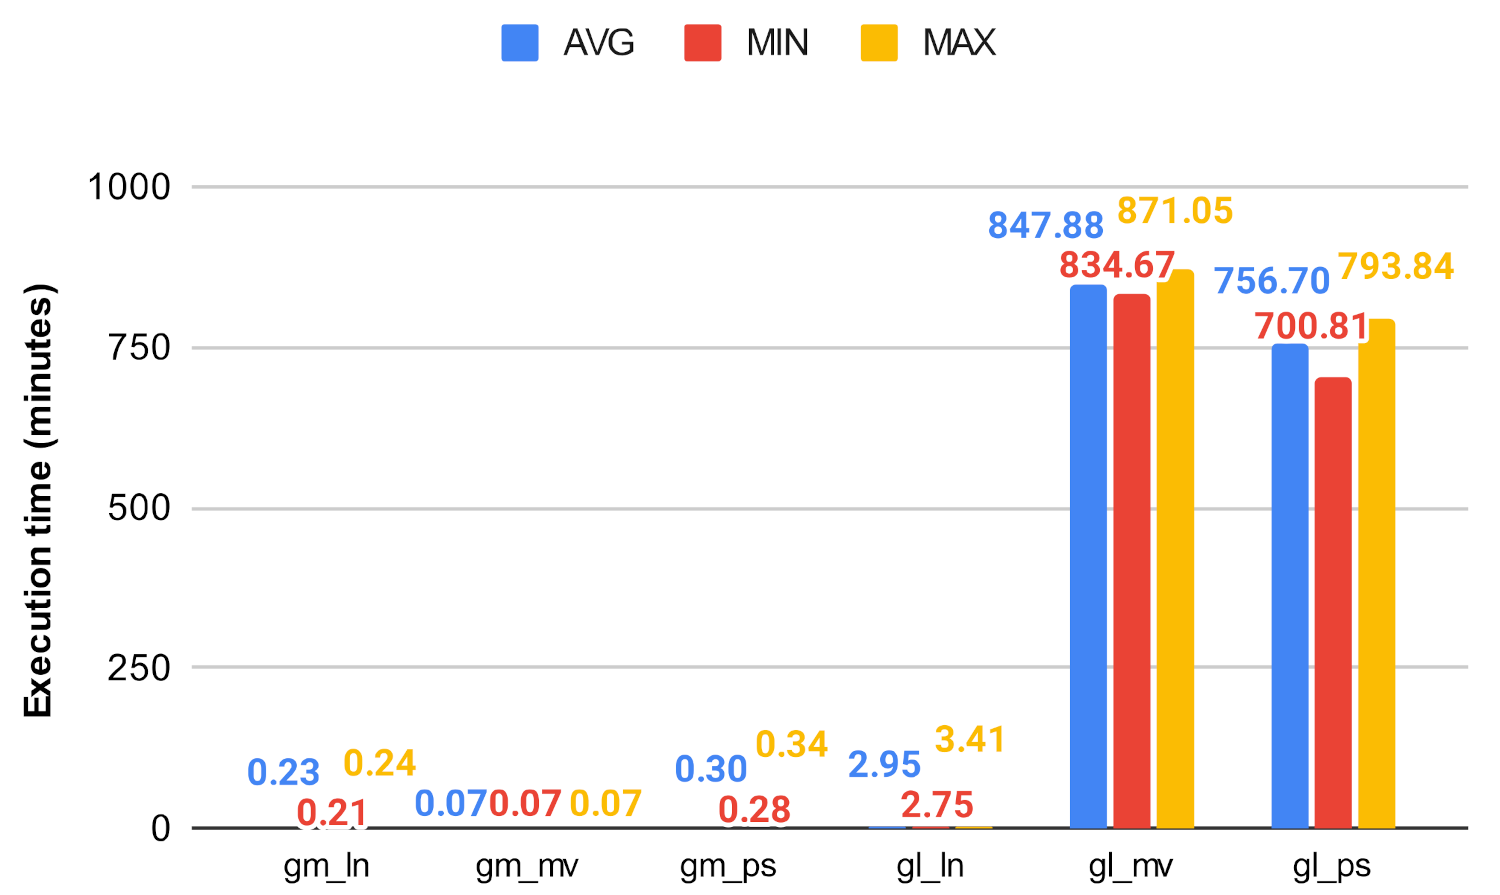
Closeness algorithm’s execution time on gm and gl using ln, mv, and ps.
Figure 24.
Closeness algorithm’s execution time on gm and gl using ln, mv, and ps.
Figure 25.
Centrality algorithms’ execution time on fb and dz.
Figure 25.
Centrality algorithms’ execution time on fb and dz.
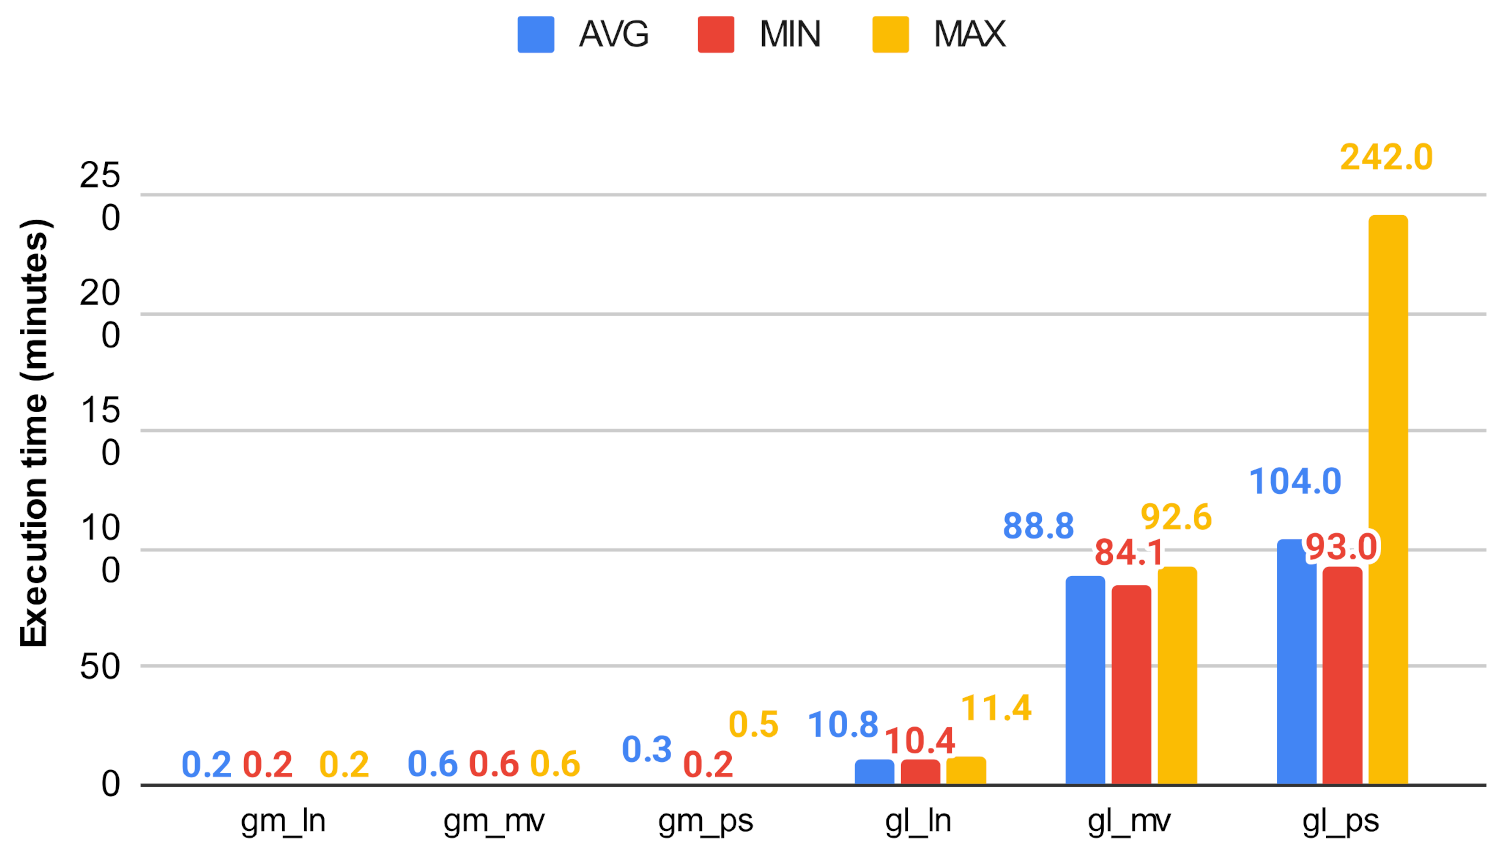
Figure 26.
Centrality algorithms’ execution time on gm and gl.
Figure 26.
Centrality algorithms’ execution time on gm and gl.
Figure 27.
Betweenness algorithms’ execution time on fb and dz.
Figure 27.
Betweenness algorithms’ execution time on fb and dz.
Figure 28.
Betweenness algorithms’ execution time on gm and gl.
Figure 28.
Betweenness algorithms’ execution time on gm and gl.
Figure 29.
Closeness algorithm’s execution time on fb and dz using ln, mv, and ps.
Figure 29.
Closeness algorithm’s execution time on fb and dz using ln, mv, and ps.
Figure 30.
Closeness algorithm’s execution time on gm and gl using ln, mv, and ps.
Figure 30.
Closeness algorithm’s execution time on gm and gl using ln, mv, and ps.
Table 1.
Modularity for different inflation values.
Table 1.
Modularity for different inflation values.
| Inflation | Modularity |
|---|
| 1.5 | 0.8298429 |
| 1.6 | 0.8301530 |
| 1.7 | 0.8302311 |
| 1.8 | 0.8302620 |
| 1.9 | 0.8301715 |
| 2 | 0.8300583 |
| 2.1 | 0.8300583 |
| 2.2 | 0.8300735 |
| 2.3 | 0.8301639 |
| 2.4 | 0.8301789 |
| 2.5 | 0.8301936 |
Table 2.
Modularity for different expansion values.
Table 2.
Modularity for different expansion values.
| Expansion | Modularity |
|---|
| 2 | 0.8302620 |
| 3 | 0.8294250 |
| 4 | 0.7876173 |
| 5 | 0.7880002 |
Table 3.
The inflation and expansion parameter choice under the networks.
Table 3.
The inflation and expansion parameter choice under the networks.
| Graph | Inflation | Expansion |
|---|
| facebook_combined | 1.8 | 2 |
| deezer_europe | 1.5 | 3 |
| soc-gemsec-HU | 1.2 | 2 |
| soc-google-plus | 1.1 | 3 |
Table 4.
The number of the clusters created by different clustering algorithms.
Table 4.
The number of the clusters created by different clustering algorithms.
| Graph | Louvain | Markov | Paris |
|---|
| facebook_combined | 15 | 10 | 6 |
| deezer_europe | 79 | 773 | 2 |
| soc-gemsec-HU | 24 | 239 | 8 |
| soc-google-plus | 2220 | 1714 | 1706 |
Table 5.
Most influental nodes in facebook_combined network based on betweenness.
Table 5.
Most influental nodes in facebook_combined network based on betweenness.
| Rank | fb_bw | fb_bw_ln | fb_bw_mv | fb_bw_ps |
|---|
| 1 | 107 | 3437 | 107 | 107 |
| 2 | 1684 | 1684 | 698 | 1684 |
| 3 | 3437 | 0 | 1085 | 1577 |
| 4 | 1912 | 1912 | 862 | 698 |
| 5 | 1085 | 107 | 414 | 1718 |
| 6 | 0 | 348 | 686 | 860 |
| 7 | 698 | 414 | 1405 | 348 |
| 8 | 567 | 686 | 0 | 414 |
| 9 | 58 | 483 | 1483 | 1085 |
| 10 | 428 | 1783 | 1465 | 862 |
Table 6.
Most influental nodes in deezer_europe network based on betweenness.
Table 6.
Most influental nodes in deezer_europe network based on betweenness.
| Rank | dz_bw | dz_bw_ln | dz_bw_mv | dz_bw_ps |
|---|
| 1 | 14,771 | 2644 | 1864 | 14,771 |
| 2 | 11,987 | 20,304 | 8413 | 21,925 |
| 3 | 21,925 | 2703 | 5336 | 28,044 |
| 4 | 28,044 | 6536 | 9144 | 11,599 |
| 5 | 4361 | 2961 | 569 | 4361 |
| 6 | 10,971 | 26,754 | 8190 | 3296 |
| 7 | 867 | 14,195 | 2709 | 20,841 |
| 8 | 3296 | 1037 | 23,269 | 23,914 |
| 9 | 23,143 | 15,558 | 6342 | 17,527 |
| 10 | 24,904 | 6371 | 4205 | 867 |
Table 7.
Most influental nodes in soc-gemsec-HU network based on betweenness.
Table 7.
Most influental nodes in soc-gemsec-HU network based on betweenness.
| Rank | gm_bw | gm_bw_ln | gm_bw_mv | gm_bw_ps |
|---|
| 1 | 14,900 | 38,301 | 1463 | 14,900 |
| 2 | 40,491 | 46,733 | 42,854 | 24,218 |
| 3 | 24,218 | 36,350 | 45,996 | 35,737 |
| 4 | 14,597 | 5285 | 32,324 | 14,082 |
| 5 | 15,724 | 19,306 | 1912 | 32,622 |
| 6 | 19,081 | 44,985 | 9560 | 14,570 |
| 7 | 7471 | 35,737 | 16,517 | 15,724 |
| 8 | 38,301 | 32,114 | 23,900 | 1397 |
| 9 | 1397 | 6758 | 12,987 | 5772 |
| 10 | 42,899 | 32,582 | 16,952 | 19,081 |
Table 8.
Most influental nodes in facebook_combined network based on closeness.
Table 8.
Most influental nodes in facebook_combined network based on closeness.
| Rank | fb_cn | fb_cn_ln | fb_cn_mv | fb_cn_ps |
|---|
| 1 | 107 | 584 | 0 | 0 |
| 2 | 58 | 3980 | 56 | 1912 |
| 3 | 428 | 1912 | 67 | 56 |
| 4 | 563 | 107 | 271 | 67 |
| 5 | 1684 | 1684 | 322 | 271 |
| 6 | 171 | 3437 | 25 | 322 |
| 7 | 348 | 0 | 26 | 25 |
| 8 | 483 | 662 | 277 | 26 |
| 9 | 414 | 661 | 252 | 277 |
| 10 | 376 | 659 | 21 | 252 |
Table 9.
Most influental nodes in deezer_europe network based on closeness.
Table 9.
Most influental nodes in deezer_europe network based on closeness.
| Rank | dz_cn | dz_cn_ln | dz_cn_mv | dz_cn_ps |
|---|
| 1 | 14,771 | 7109 | 9547 | 17,605 |
| 2 | 2518 | 25,373 | 28,219 | 19,721 |
| 3 | 23,143 | 25,105 | 27,457 | 3454 |
| 4 | 24,904 | 25,051 | 25,748 | 17,468 |
| 5 | 867 | 23,819 | 25,360 | 16,782 |
| 6 | 5989 | 20,512 | 24,108 | 13,530 |
| 7 | 20,162 | 17,690 | 20,398 | 20,230 |
| 8 | 10,971 | 15,774 | 20,397 | 11,643 |
| 9 | 21,079 | 10,703 | 19,770 | 418 |
| 10 | 6832 | 10,657 | 14,222 | 5310 |
Table 10.
Most influental nodes in soc-gemsec-HU network based on closeness.
Table 10.
Most influental nodes in soc-gemsec-HU network based on closeness.
| Rank | gm_cn | gm_cn_ln | gm_cn_mv | gm_cn_ps |
|---|
| 1 | 14,900 | 36,365 | 44,157 | 14,900 |
| 2 | 40,491 | 18,432 | 43,794 | 24,218 |
| 3 | 24,218 | 6346 | 40,596 | 35,737 |
| 4 | 38,301 | 10,085 | 20,939 | 14,570 |
| 5 | 15,724 | 17,688 | 21,401 | 23,076 |
| 6 | 14,597 | 46,926 | 24,031 | 32,622 |
| 7 | 19,081 | 6252 | 27,277 | 609 |
| 8 | 42,899 | 21,488 | 25,776 | 15,851 |
| 9 | 7471 | 17,615 | 19,884 | 35,950 |
| 10 | 18,877 | 14,082 | 16,302 | 19,081 |


