Abstract
Decision-making plays an essential role in the management and may represent the most important component in the planning process. Employee attrition is considered a well-known problem that needs the right decisions from the administration to preserve high qualified employees. Interestingly, artificial intelligence is utilized extensively as an efficient tool for predicting such a problem. The proposed work utilizes the deep learning technique along with some preprocessing steps to improve the prediction of employee attrition. Several factors lead to employee attrition. Such factors are analyzed to reveal their intercorrelation and to demonstrate the dominant ones. Our work was tested using the imbalanced dataset of IBM analytics, which contains 35 features for 1470 employees. To get realistic results, we derived a balanced version from the original one. Finally, cross-validation is implemented to evaluate our work precisely. Extensive experiments have been conducted to show the practical value of our work. The prediction accuracy using the original dataset is about 91%, whereas it is about 94% using a synthetic dataset.
1. Introduction
The competition among organizations and firms highly depends on the productivity of the workforce. Building and maintaining a suitable environment is the key that contributes to stable and collaborative employees. The human resource (HR) department should participate in building such an environment by analyzing employees’ database records. Analyzing these data enables the administration to improve the decision-making to avoid employee attrition [1,2]. Employee attrition means that productive employees decide to leave the organization due to different reasons such as work pressure, unsuitable environment, or not satisfying salary. Employee attrition affects the organization’s productivity because it loses a productive employee as well as other resources such as HR staff effort in recruiting new employees [3]. Recruiting new employees requires training, development, and integrating them into the new environment.
Predicting employee attrition before it occurs can help the administration to prevent it or at least reduce its effect. Some literature suggested that happy and motivated employees tend to be more creative, productive, and perform better [4]. Organizations can utilize their HR data to make such predictions depending on predictive models that can be built for this purpose. In recent years, artificial intelligence (AI) is used in many different fields such as health, education, economy, and administration [5,6]. Recently, the prediction of employee attrition using AI has received a lot of research attention. Also, the increased amount of data regarding this topic leads to more studies in this field [7,8].
This paper focuses on the prediction of employee attrition using deep neural networks, where the IBM Watson dataset has been used to train and test the network. This dataset includes 35 features for 1470 samples of two classes (current and former employees). These samples are not balanced; there are 237 positive samples (former employee) and 1233 negative samples (current employee). This unbalanced dataset makes the prediction process a challenging task.
Our main contributions can be summarized as follows. First, we utilized the deep learning technique with some preprocessing steps to improve the prediction of employee attrition. Second, dataset features are analyzed to reveal their correlation with each other and to identify the most important features. Third, to get realistic results, we tested our model overbalanced and imbalanced datasets. Fourth, unlike several previous methods, cross-validation is used to evaluate our work precisely.
2. Literature Review
Researchers have studied employee attrition topic from different perspectives. Some studies have analyzed employees’ behaviors to reveal the reasons behind their decisions to stay in or leave the organization [9,10]. Other studies used machine learning algorithms to predict employees attrition according to their records. Alduayj and Rajpoot [7] used several machine learning models: random forests, k-nearest neighbors, and support vector machines with different kernel functions. They used three different forms of IBM HR dataset (the original class-imbalanced dataset, synthetic over-sampled, and under-sampled datasets). Although their system with the synthetic dataset showed high accuracy, its accuracy with the original dataset was not sufficient.
Usha and Balaji [8] used the same dataset to compare several machine learning algorithms, namely, decision tree, naïve Bayes, and k-means for prediction. They validated the algorithms using 10-fold cross-validation and 70%:30% split for train-test sets. The accuracy of their work is poor in comparison with other works. This is because their work didn’t utilize the data preprocessing stage. Fallucchi et al. [3] have studied the reasons that motivate an employee to leave the organization, where various machine learning techniques were adopted to select the best classifier in this problem. These techniques include naïve Bayes, logistic regression, k-nearest neighbor, decision tree, random forests, and support vector machine. They validated their work using cross-validation and train-test split, but their results include only the 70%:30% split train-test set without discussing cross-validation. However, the test accuracy is better than the training accuracy, which is a good indicator, but still could be improved.
Zangeneh et al. [11] presented a three stages framework for attrition prediction. In the first stage, they used the “max-out” feature selection method for data reduction. In the second stage, they trained a logistic regression model for prediction. Then to ensure the prediction model, confidence analysis is achieved in the third stage. In addition to the poor accuracy, the system suffers from high complexity because of the preprocessing and postprocessing. Pratt et al. [12] used classification trees and random forest for attrition prediction. Before classification, they preprocess data by deleting non-desirable features using Pearson correlation. However, their work shows a slight improvement in terms of accuracy when compared with other machine learning algorithms.
Taylor et al. [13] used tree-based models to predict employee attrition. These models include random forests and light gradient boosted trees, which gained the strongest performance. They used their own dataset, which contains 5550 samples. Other works, such as [14,15], used also different datasets, which make them incomparable with the work at hand.
The prediction accuracy of all the previous solutions still needs to be improved to get more prediction confidence. The proposed work employs deep learning and data preprocessing techniques to increase prediction accuracy. Table 1 compares the state-of-the-art methodologies that use IBM HR dataset.

Table 1.
Comparison with state-of-the-art using the original imbalanced dataset.
3. Methodology
The proposed work analyses the respective dataset to detect the most influential features that affect the prediction and builds a predictive model according to the following phases.
- 1.
- Gathering employees’ data: IBM dataset [16] has been used.
- 2.
- Preprocessing the collected data: Data are prepared to be utilized by the predictive model.
- 3.
- Analyzing the dataset: The most important features that push an employee to leave the organization are detected.
- 4.
- Balancing the dataset: Since the dataset is not already balanced, it is necessary to be equalized.
- 5.
- Building the predictive model: The suitable configuration for the model is selected to increase the prediction accuracy.
- 6.
- Validating the model: K-fold validation and 70%:30% train-test set are used for system evaluation.
3.1. Dataset Description
The dataset used in this work is created by IBM Analytics [16]. It contains 35 features for 1470 employees. The dataset features along with their corresponding types are illustrated in Table 2. The “Attrition” feature represents the employee decision: Yes (leave the company) or No (stay at the company).

Table 2.
IBM dataset features.
3.2. Preprocessing
Preprocessing operation is a crucial step in machine learning, which significantly improves the model performance. It includes data cleaning, categorical data encoding, and rescaling, which will be briefly described in the following sections.
3.2.1. Data Cleaning
Trivial investigation on the dataset reveals that some features are identical for all employees such as EmployeeCount, Over18, and StandardHours, so they have been omitted in this stage. Furthermore, the EmployeeNumber feature is omitted too since its values are unrelated to our classification problem.
3.2.2. Categorical Data Encoding
Some of the dataset features are categorical (nominal) values rather than numbers. In most machine learning algorithms, categorical features cannot be used directly. The original dataset contains several categorical features such as BusinessTravel, Department, EducationField, Gender, JobRole, MaritalStatus, and Overtime. These features must be converted into numerical ones.
To solve this problem, one-hot encoding is used, where the unique values and their number are identified first. Then a one-hot binary vector is assigned for each value. For example, Gender feature, which includes two values (male, female) is translated into (1, 0) and (0, 1), respectively.
3.2.3. Rescaling
Features differ greatly according to their ranges, which incurs bad classification results since features with large ranges may get greater weight than other features. In order to overcome this issue, we need to rescale feature values to be in the same range. One of the common methods of feature values rescaling is normalization, in which values are rescaled to a specific period. In this work, feature values are rescaled to the range [0, 1]. The normalization formula is shown in Equation (1).
where and are the minimum and maximum values of the given feature, respectively.
3.3. Dataset Analysis
The correlation matrix is usually used to understand the relationship among the dataset features. Figure 1 depicts the correlation matrix of our dataset. The cell colors vary from blue to red color. Grey cells represent no correlation, while red variations represent the high correlation. Blue variations represent a negative correlation among dataset features.
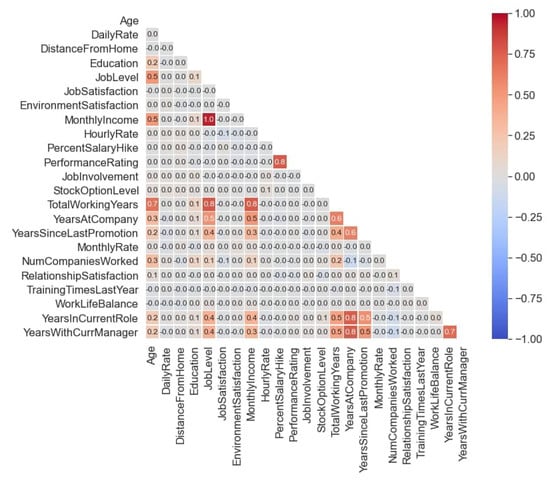
Figure 1.
Correlation Heat-map.
By analysing the correlation matrix, we observe the following findings:
- “MonthlyIncome” is highly correlated with the “JobLevel”, Figure 2a.

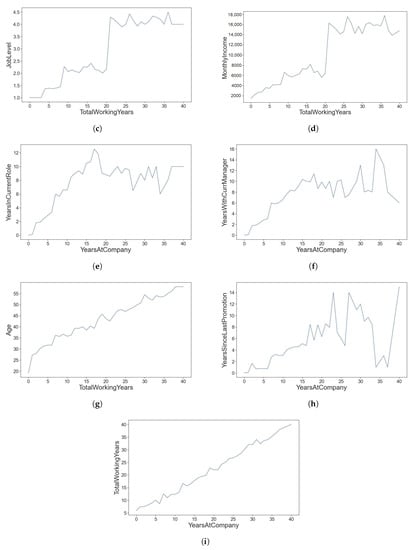 Figure 2. Relation among several features. (a) correlation between JobLevel and MonthlyIncome. (b) correlation between PerformanceRating and SalaryHike. (c) correlation between TotalWorkingYears and JobLevel. (d) correlation between TotalWorkingYears and MonthlyIncome. (e) correlation between YearsAtCompany and YearsInCurrentRole. (f) correlation between YearsAtCompany and YearsWithCurrentManager. (g) correlation between TotalWorkingYears and Age. (h) correlation between YearsAtCompany and YearsSinceLastPromotion. (i) correlation between YearsAtCompany and TotalWorkingYears.
 - “PerformanceRating” is correlated with “PercentSalaryHike”, Figure 2b.
- “TotalWorkingYears” is correlated with “JobLevel” and “MonthlyIncome”, Figure 2c,d.
- “YearsAtCompany” is correlated with “YearsInCurrentRole" and “YearsWithCurrentManager”, Figure 2e,f.
- “TotlaWorkingYears” is correlated with “Age”, Figure 2g.
- “YeasAtCompany” is moderately correlated with “YearsSinceLastPromotion” and “TotalWorkingYears”, Figure 2h,i.
Features vary in their importance for the prediction process. To show that, we utilized Chi-square ranking. The results show that OverTime, JobLevel, and MonthlyIncome are the most dominant features as depicted in Figure 3.
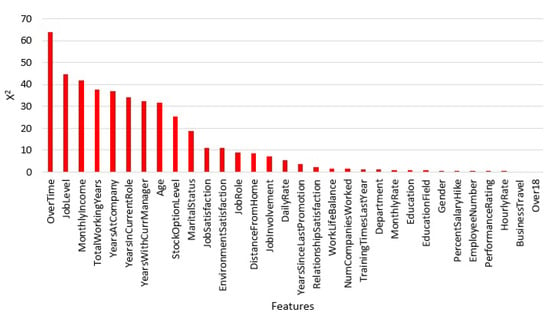
Figure 3.
Features importance.
3.4. Dataset Balancing
The dataset adopted in this work is target biased. This means that the number of employees that left the organization (attrition = “yes”) is not equivalent to the number of still working employees (attrition = “no”) as shown in Figure 4a. The original dataset contains 1470 employee records. Only 237 employees have left the organization, whereas 1233 employees still working, which bias the dataset towards the working employees. This imbalance influences the prediction model resulting in relatively poor performance. Therefore, some researchers overcome this problem using oversampling the minority class. To overcome this problem, Alduayj and Rajpoot [7] exploited the Adaptive synthetic (ADASYN) sampling approach [17] to transform the dataset into its balanced version, (see Figure 4b). In the proposed technique, the experiments are conducted on both balanced and imbalanced datasets.
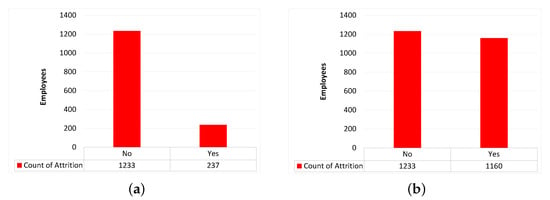
Figure 4.
Imbalanced and balanced dataset. (a) Original imbalanced dataset. (b) Synthetic balanced dataset.
3.5. Prediction Model
The prediction model is the essence of any prediction process. Various machine learning models have been used in employee attrition such as decision trees, random forests, naïve Bayes, logistic regression, and SVM. In this work, a deep learning prediction model is used to classify employee attrition. In order to avoid overfitting or underfitting, hyperparameters of the model such as number of hidden layers, number of neurons, activation functions, and so on, should be selected carefully. In this work, a grid search approach is used to tune hyperparameters of the prediction model by exploiting multi-core machines and multithreading programming. The resulted model consists of an input layer, 7 hidden layers, and an output layer. The input layer contains 53 neurons, which is the number of features after expanding them using categorical data encoding. Each hidden layer has 100 neurons. The output layer has only one neuron that represents the prediction value as shown in Figure 5. The activation functions of hidden layers are softplus, which is a curvy version of Rectified Linear Unit ReLU (see Figure 6a), while the activation functions of input and output layers are sigmoid (see Figure 6b). The loss function used in this work is binary cross entropy, whereas the optimizer is Adam with initial learning rate of 0.01.
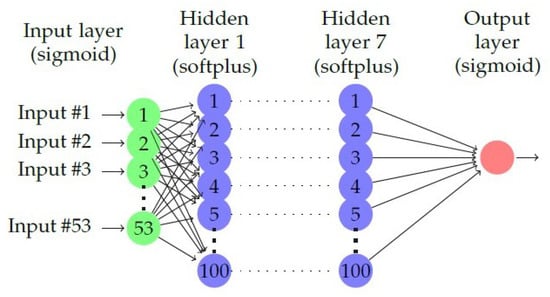
Figure 5.
The proposed network architecture.
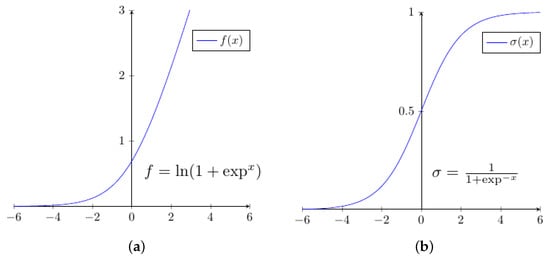
Figure 6.
Activation functions. (a) softplus function. (b) sigmoid function.
3.6. Validation
To evaluate the performance of the prediction model, the dataset is divided into two parts: trainset and test set. Two validation techniques are used in the proposed work, train-test sets, and k-fold cross-validation.
- Train-test validation setsIn this technique, 70% of the dataset is used to train the model, while the remaining 30% is used to validate the model.
- K-Fold cross-validationThe train-test sets are not always fair in testing the model. This is because when the test samples are included in the trainset, high misleading performance is gained. Therefore, cross-validation is required to give realistic performance and to avoid the overfitting problem. In this technique, the dataset is divided into k parts, each part is used in one iteration for testing the model, while the other parts are used for training the model. This process is executed k-times. The final accuracy is the average of accuracy values of these k-times executions.
4. Experimental Results
In order to evaluate our model, three experiments have been conducted. Two versions of the dataset are used: the original imbalanced data and the synthetic balanced data using the ADASYN method.
4.1. Experiment 1
In this experiment, the original dataset is used, which represents a challenge due to the big difference between the number of samples of target 0 and target 1. Table 1 shows a comparison between the proposed method and other state-of-the-art methods. Results demonstrated that the accuracy and f1-score of our model outperform significantly all competitor methods, mainly due to the classification power of deep learning and our preprocessing steps.
4.2. Experiment 2
In this experiment, the original dataset is converted into a synthetic one using ADASYN [17] to fairly compare with researchers who used this technique. Table 3 shows the comparison results between our proposed technique and all methods of [7]. Our accuracy and f1-score are better than almost all these methods.

Table 3.
Comparison with state-of-the-art using the synthetic balanced dataset.
4.3. Experiment 3
In this experiment, 10-fold cross-validation is used to get realistic performance using the original dataset. The results of our model are compared with the methods of Usha [8], as shown in Table 4. The accuracy of the proposed work is better than these methods using the same dataset.

Table 4.
10-fold cross-validation.
5. Discussion
Deep learning algorithm has shown superiority over other machine learning algorithms in the prediction problem. Despite the imbalanced dataset, as reported in experiment 1, the system has shown high prediction accuracy over all other state-of-the-art methodologies. This is not only caused by using deep learning, but also due to proper adoption of preprocessing and selecting only the effective features. In experiment 2, a synthetic balanced version of the dataset has been used and compared the same settings of [7]. Notice that the accuracy of KNN (K = 1) method of [7], (as shown in Table 3), still better than our work due to the overfitting, as they admitted.
Recall that measuring the prediction model using only train-test sets is not always fair. Therefore, cross-validation is used in experiment 3 to obtain a more realistic measurement. Since only the work of [8] has conducted cross-validation, we compared our work against it. The result shows that the accuracy of our model is much better than Linear SVM and KNN models of [8] as shown in Table 4.
6. Conclusions
The proposed work can assist the human resources department in providing the necessary information about the potential decision of an employee to leave the organization. Depending on employee signals, our method predicts whether there is a potential risk of employee attrition. We have analyzed the employee’s dataset to obtain the most features that encourage the employee to leave the organization. Additionally, the correlations among various features are also presented. Our findings, in this regards, shows that overtime hourse, job level, and monthly income are the most effective features that influence the employee decision. Using the dataset offered by IBM analytics is still a challenging task due to its imbalanced nature. This leads us to create a synthetic version of this dataset to build a stable classifier that can support realistic prediction.
Thorough experiments have been conducted to measure the effectiveness of our method in terms of accuracy, percision, recall, and f1-score. The proposed method has shown a high performance compared to state-of-the-art techniques that used the same dataset. The accuracy, using the imbalanced and synthetic balanced datasets was 91.16% and 94.16%, respectively. Further comparison is also implemented using 10-fold cross-validation, where the obtained accuracy was 89.11%, which is outperforms all the previously presented methods.
Author Contributions
Conceptualization, S.A.-D., F.F. and R.G.; methodology, S.A.-D., D.G.H. and A.I.A.; software, S.A.-D., D.G.H.; validation, S.A.-D., D.G.H. and H.A.A.; writing—original draft preparation, S.A.-D., D.G.H. and A.I.A.; writing—review and editing, S.A.-D. and A.I.A.; supervision, S.A.-D. and F.F. All authors have read and agreed to the published version of the manuscript.
Funding
This research received no external funding.
Institutional Review Board Statement
Not applicable.
Informed Consent Statement
Not applicable.
Data Availability Statement
Authors can confirm that all relevant data are included in the article.
Conflicts of Interest
The authors declare no conflict of interest.
References
- Jarrahi, M.H. Artificial intelligence and the future of work: Human-AI symbiosis in organizational decision making. Bus. Horiz. 2018, 61, 577–586. [Google Scholar] [CrossRef]
- Duan, Y.; Edwards, J.S.; Dwivedi, Y.K. Artificial intelligence for decision making in the era of Big Data—Evolution, challenges and research agenda. Int. J. Inf. Manag. 2019, 48, 63–71. [Google Scholar] [CrossRef]
- Fallucchi, F.; Coladangelo, M.; Giuliano, R.; William De Luca, E. Predicting Employee Attrition Using Machine Learning Techniques. Computers 2020, 9, 86. [Google Scholar] [CrossRef]
- Zelenski, J.M.; Murphy, S.A.; Jenkins, D.A. The Happy-Productive Worker Thesis Revisited. J. Happiness Stud. 2008, 9, 521–537. [Google Scholar] [CrossRef]
- Varian, H. 16. Artificial Intelligence, Economics, and Industrial Organization. In The Economics of Artificial Intelligence: An Agenda; University of Chicago Press: Chicago, IL, USA, 2019; pp. 399–422. [Google Scholar]
- Vardarlier, P.; Zafer, C. Use of artificial intelligence as business strategy in recruitment process and social perspective. In Digital Business Strategies in Blockchain Ecosystems; Springer: Cham, Switzerland, 2020; pp. 355–373. [Google Scholar]
- Alduayj, S.S.; Rajpoot, K. Predicting Employee Attrition using Machine Learning. In Proceedings of the 2018 International Conference on Innovations in Information Technology (IIT), Al Ain, United Arab Emirates, 18–19 November 2018; pp. 93–98. [Google Scholar] [CrossRef]
- Usha, P.M.; Balaji, N. Analysing employee attrition using machine learning. Karpagam J. Comput. Sci. 2019, 13, 277–282. [Google Scholar]
- Setiawan, I.; Suprihanto, S.; Nugraha, A.; Hutahaean, J. HR analytics: Employee attrition analysis using logistic regression. In IOP Conference Series: Materials Science and Engineering; IOP Publishing: Bandung, Indonesia, 2020; Volume 830, p. 032001. [Google Scholar]
- Rupa Chatterjee Das, A.D.S. Conceptualizing the Importance of HR Analytics in Attrition Reduction. Int. Res. J. Adv. Sci. Hub 2020, 2, 40–48. [Google Scholar] [CrossRef]
- Najafi-Zangeneh, S.; Shams-Gharneh, N.; Arjomandi-Nezhad, A.; Hashemkhani Zolfani, S. An Improved Machine Learning-Based Employees Attrition Prediction Framework with Emphasis on Feature Selection. Mathematics 2021, 9, 1226. [Google Scholar] [CrossRef]
- Pratt, M.; Boudhane, M.; Cakula, S. Employee Attrition Estimation Using Random Forest Algorithm. Balt. J. Mod. Comput. 2021, 9, 49–66. [Google Scholar]
- Taylor, S.; El-Rayes, N.; Smith, M. An Explicative and Predictive Study of Employee Attrition Using Tree-based Models. In Proceedings of the 53rd Hawaii International Conference on System Sciences, Hawaii, HI, USA, 7–10 January 2020. [Google Scholar]
- Gabrani, G.; Kwatra, A. Machine Learning Based Predictive Model for Risk Assessment of Employee Attrition. In International Conference on Computational Science and Its Applications; Springer: Melbourne, Australia, 2018; pp. 189–201. [Google Scholar]
- Yedida, R.; Reddy, R.; Vahi, R.; Jana, R.; GV, A.; Kulkarni, D. Employee Attrition Prediction. arXiv 2018, arXiv:1806.10480. [Google Scholar]
- IBM HR Analytics Employee. Available online: https://www.ibm.com/communities/analytics/watson-analytics-blog/hr-employee-attrition/ (accessed on 23 November 2012).
- He, H.; Bai, Y.; Garcia, E.A.; Li, S. ADASYN: Adaptive synthetic sampling approach for imbalanced learning. In Proceedings of the 2008 IEEE International Joint Conference on Neural Networks (IEEE World Congress on Computational Intelligence), Hong Kong, China, 1–8 June 2008; pp. 1322–1328. [Google Scholar]
Publisher’s Note: MDPI stays neutral with regard to jurisdictional claims in published maps and institutional affiliations. |
© 2021 by the authors. Licensee MDPI, Basel, Switzerland. This article is an open access article distributed under the terms and conditions of the Creative Commons Attribution (CC BY) license (https://creativecommons.org/licenses/by/4.0/).