Article

Bioactive Compounds in Malanto (Kalimeris indica) Leaves and Their Antioxidant Characteristics

1
School of Food, Jiangsu Food and Pharmaceutical Science College, No. 4, Meicheng Road, Higher Education Park, Huai’an 223003, China
2
Shenhua Testing Technology (Nantong) Co., Ltd., Nantong 226000, China
3
Department of Food and Beverage Management, Chung-Jen Junior College of Nursing, Health Sciences and Management, 217, Hung-Mao-Pi, Chiayi City 60077, Taiwan
4
Department of Medicinal Botanicals and Foods on Health Applications, Da-Yeh University, 168, Xuefu Road, Dacun Township, Changhua County 515006, Taiwan
5
Department of Food and Nutrition, Providence University, 200, Sec. 7, Taiwan Boulevard, Shalu Dist., Taichung City 43301, Taiwan
*
Authors to whom correspondence should be addressed.
Agriculture 2023, 13(1), 211; https://doi.org/10.3390/agriculture13010211
Submission received: 19 December 2022 / Revised: 10 January 2023 / Accepted: 13 January 2023 / Published: 14 January 2023
(This article belongs to the Section Agricultural Product Quality and Safety)

Abstract

:
Currently, there is an increasing trend to replace artificial antioxidants with natural antioxidants. However, certain naturally occurring antioxidants have lower antioxidant activities than artificial antioxidants. Therefore, they will not be as effective in preventing cellular damage. Nevertheless, if they are controlled, natural antioxidants represent a valuable alternative to synthetic antioxidants. With regard to current knowledge, new applications of natural antioxidants in the food industry include food additives, feedstuffs, food packaging materials, and nutraceuticals. The younger leaves of Malan (Kalimeris indica (L.) Sch. Bip.), often referred to as “malanto”, are usually eaten as a vegetable. The findings of this study demonstrated that malanto flavonoids form the active ingredient of the naturally occurring malanto. The malanto extract contains six flavonoids with antioxidant capacity. Malanto flavonoids (0.02% addition) were evaluated for their antioxidant effects and were found to be similar to BHT in inhibiting the peroxidation of sesame, soybean, and sunflower oils. This study aims to provide unique insights into the comprehensive utilization of the flavonoids extracted from malanto.

1. Introduction

More than 200,000 plant metabolites are known for their applications as natural sources of flavors, antioxidants, and antimicrobial agents for food preservation [1]; such compounds include chlorophylls, betaines, carotenoids, and flavonoids (including anthocyanins, proanthocyanidins, cinnamon, hesperidin, and limonene) [1,2,3,4]. The most prevalent and widely researched flavonoids are anthocyanins [5,6]. The beneficial effects of these metabolites in the human diet are due to their potential antioxidant capacity and possible inhibitory effects on tumor development [7]. Additionally, there are wide-ranging applications in the food, pharmaceutical, and healthcare industries [8,9]. The relatively high content of flavonoids, flavones, catechins, and flavonols in green leafy vegetables has proved to be highly beneficial [9]. In addition, Martínez et al. [4] and Moura et al. [10] have also reported on vitamin C (ascorbic acid), carotenoids, and bioflavonoids, which have multiplicative effects on antioxidant capacity.
It is well-known that 80% of the population in developing countries relies on traditional medicines of plant origin. Accordingly, the antibacterial, anti-inflammatory, and antioxidant effects of flavonoids and anthocyanins of plant origin have been well-established [11,12]. It can be deduced from a lot of studies that they have potential anti-inflammatory effects in vitro and in vivo, mainly by modulating the expression of several inflammatory cytokines [11,13,14]. From previously conducted epidemiological studies, there has been confirmation of significant evidence of the ability of long-term consumption of phenolic-rich foods to abate the incidence of inflammation-related diseases (e.g., cancer, cardiovascular disease, and metabolic disordes) [15,16,17,18,19]. However, these natural substances have a high risk of being affected by environmental factors, which may impact the absorption of these antioxidants and other food nutrients after ingestion [14,16,20]. The oxidation of lipids is the primary mechanism for the deterioration of edible oils, which results in nutritional and organoleptic losses caused by the formation of the products of lipid oxidation [21]. This oxidation produces short-chain aromatic active compounds with unpleasant taste aromas. This leads to a variation in color, viscosity, density, and solubility, and increased toxicity of the products [21,22,23].
The young leaves of Kalimeris indica (also known as malan, ma lan, or malanto) have been used as a healthy leafy vegetable or herb for the homology of medicine and food in China [1,24,25,26]. Several studies have confirmed that its extracts are rich in polyphenols, terpenoids, anthraquinones, coumarins, and aliphatic acids, providing anti-inflammatory, antibacterial, antioxidant, anti-tumor, and anti-influenza benefits [24,25,26,27,28,29,30]. However, to our knowledge, there has been no investigation of the ability of malanto flavonoid antioxidant compounds to retard the oxidation of edible oils; such a study is needed to provide a scientific basis for their utilization in food processing. Hence, this study aimed to investigate the optimization of the extraction process of malanto total flavonoids, the major bioactive components of malanto, and its practical application for retarding the oxidation of edible oils.

2. Materials and Methods

2.1. Materials

Freshly obtained malanto (Kalimeris indica (L.) Sch. Bip.) was purchased from local farms (Shanghai, China). Commercialized sesame oil, soybean oil, and sunflower oil were purchased from a local supermarket (Huai’an City, Jiangsu, China). 2,2-diphenyl-1-picrylhydrazyl (DPPH), Trolox, pyrogallol, rutin, chlorogenic acid, catechin, epicatechin, gallic acid, and vitamin C were purchased from Sigma-Aldrich® (Merck KGaA, Darmstadt, Germany). High-purity dihydromyricetin, taxifolin, dihydrokaempferol, myricetin, eriodictyol, quercetin, naringenin, luteolin, kaempferol, and apigenin were purchased from Shanghai Yuanye Biology Co., Ltd. (Shanghai, China). Other reagents were of analytical grade and purchased from Sinopharm Chemical Reagent Co., Ltd. (Shanghai, China).

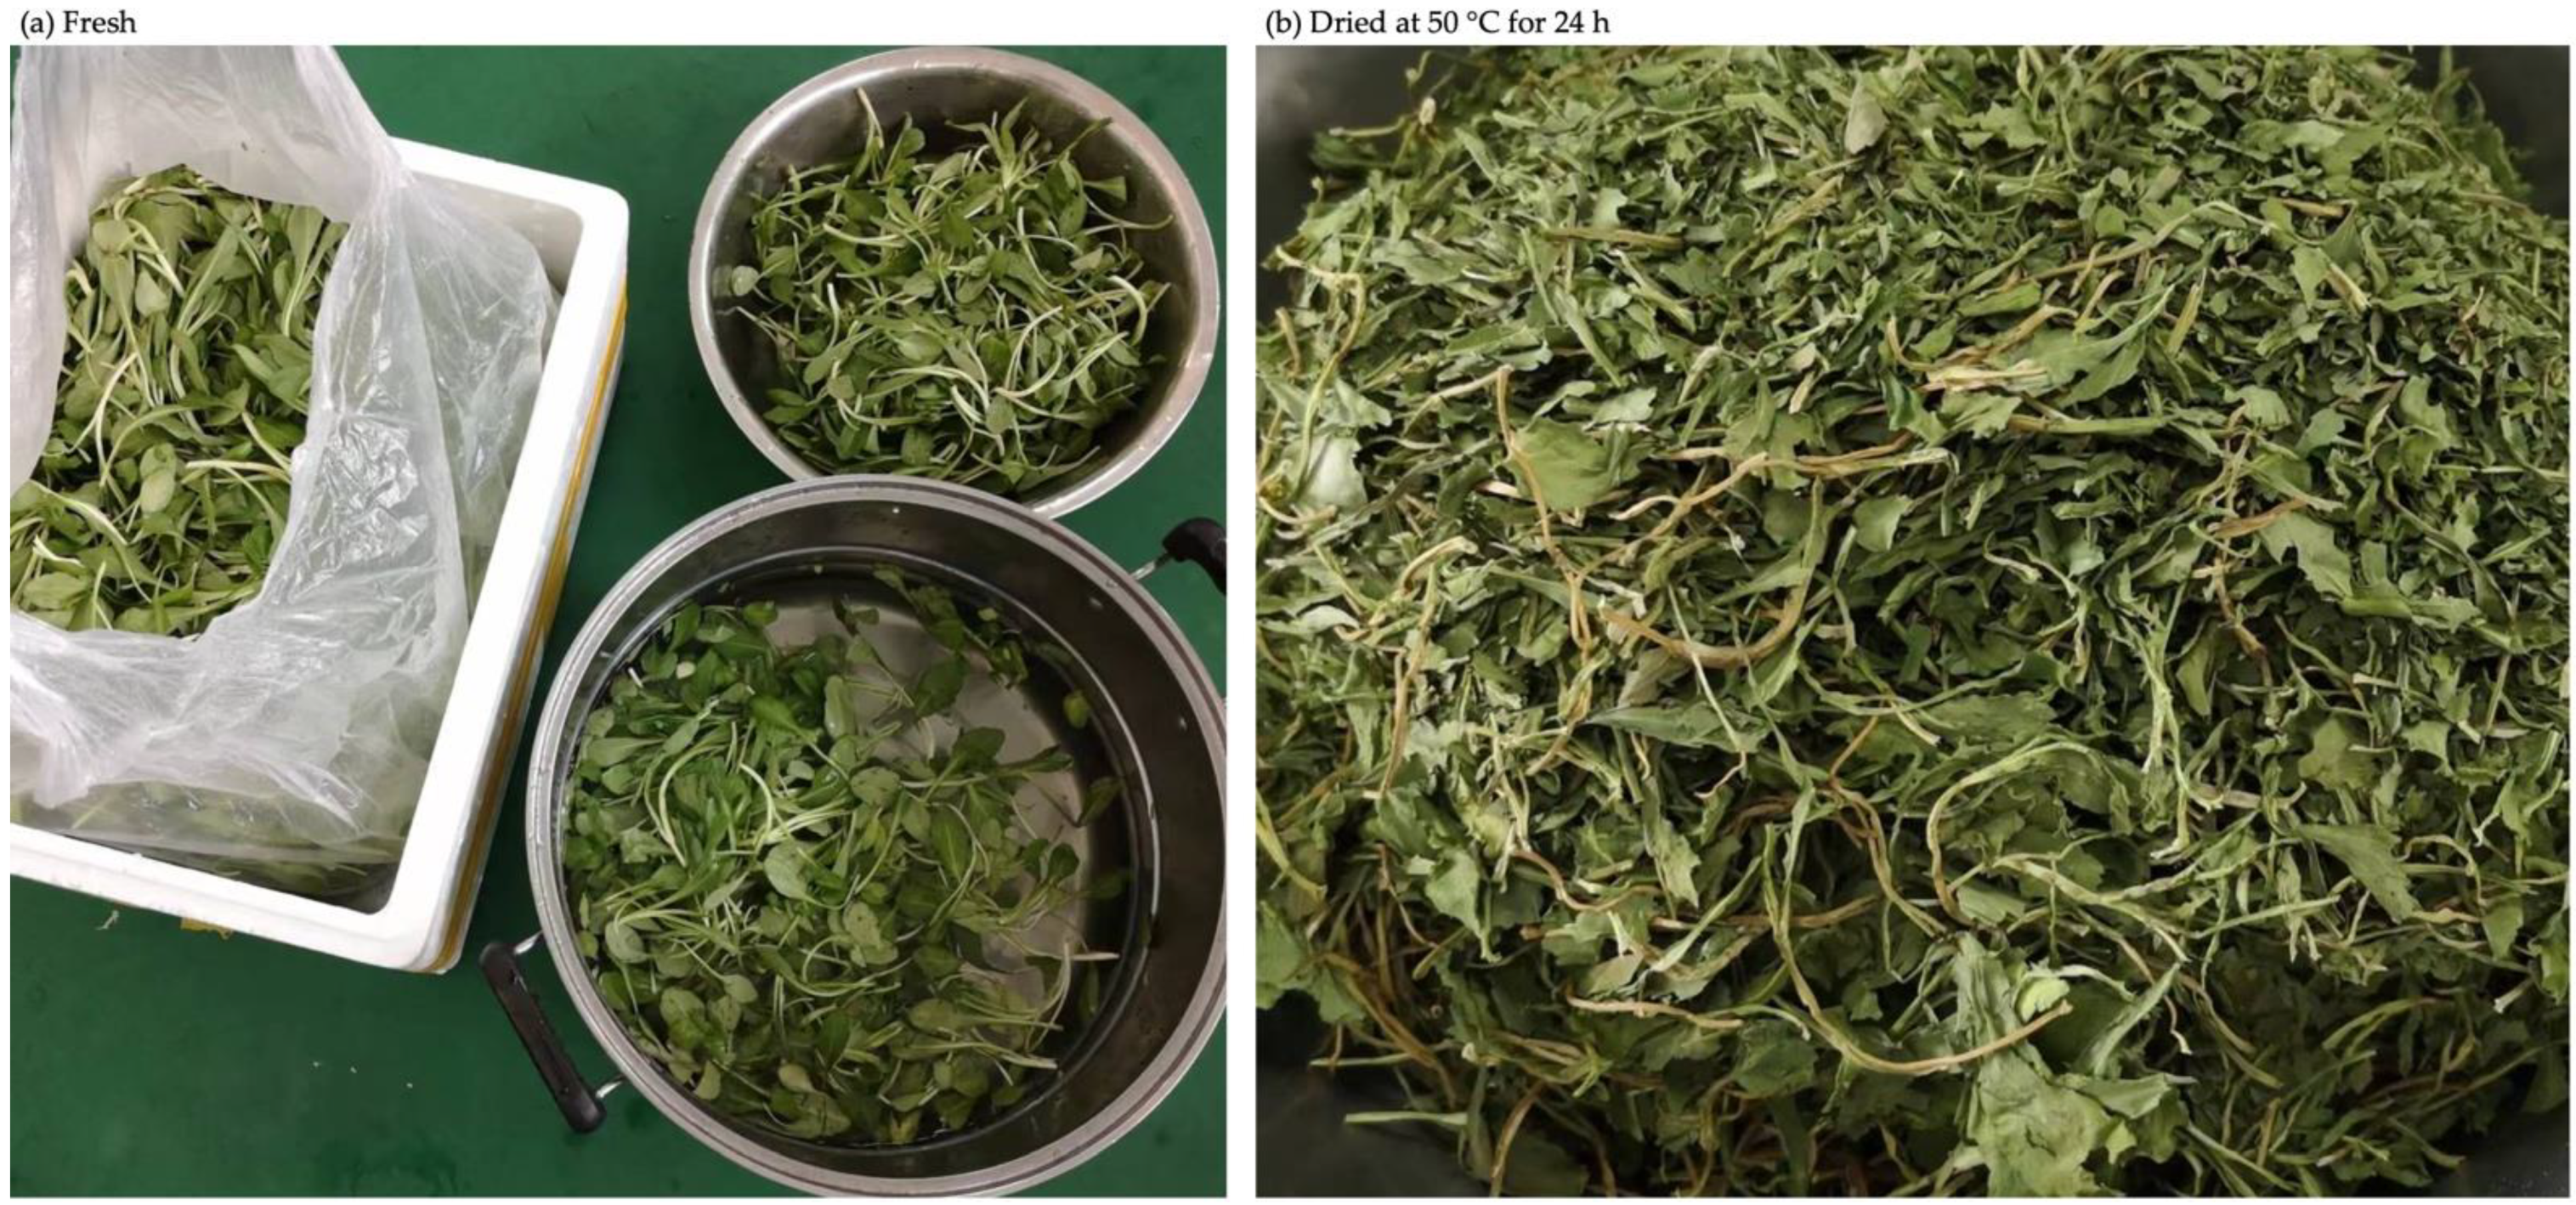
2.2. Preparation of Samples

The fresh malanto (Figure A1, Appendix A) was washed with clean water, dried in a multifunctional oven (JSS48A-2Z, Zhejiang Xide Food Machinery Co., Ltd., Jinhua City, China) at 50 °C for 24 h, crushed with a high-speed crusher (800Y, Wuyi Haina Electric Appliance Co., Ltd., Jinhua, China), and sieved using a 60 mesh sieve; then, kept in a waterproof sealed bag at room temperature until further use.
Next, 1g of the resulting malanto powder was accurately weighed (ATY224 Shimadzu Scientific Ins., Co., Ltd., Kyoto, Japan), dissolved in 30 mL of 70% ethanol, sealed with paraffin film, and incubated in a 70 °C water bath for 80 min. Finally, the supernatant was obtained by centrifugation (TD5G, Hunan Kaida Scientific Ins., Co., Ltd., Changsha, Hunan, China) (at 4 °C, 2000× g) for 10 min.

2.3. Extraction of Total Flavonoids from Malanto

The extraction process parameters for the maximum total flavonoid content of malanto were obtained according to the ethanol concentration (%), ratio of liquid to substance (mL/g), extraction temperature (°C), and extraction time (min). The ethanol concentrations used were 40, 50, 60, 70, and 80%. The ratio of liquid to substance was 10:1, 20:1, 30:1, 40:1, and 50:1 (mL/g). The extraction temperatures were 50, 60, 70, and 80 °C. The extraction times were 40, 60, 80, and 100 min. All these were used to determine the extraction process parameters for the highest total flavonoid yield from malanto. The crude extract samples were concentrated by vacuum rotary evaporation and freeze-dried with optimum conditions to obtain freeze-dried malanto powder, which was stored in airtight desiccation dishes (with desiccant) until further use.

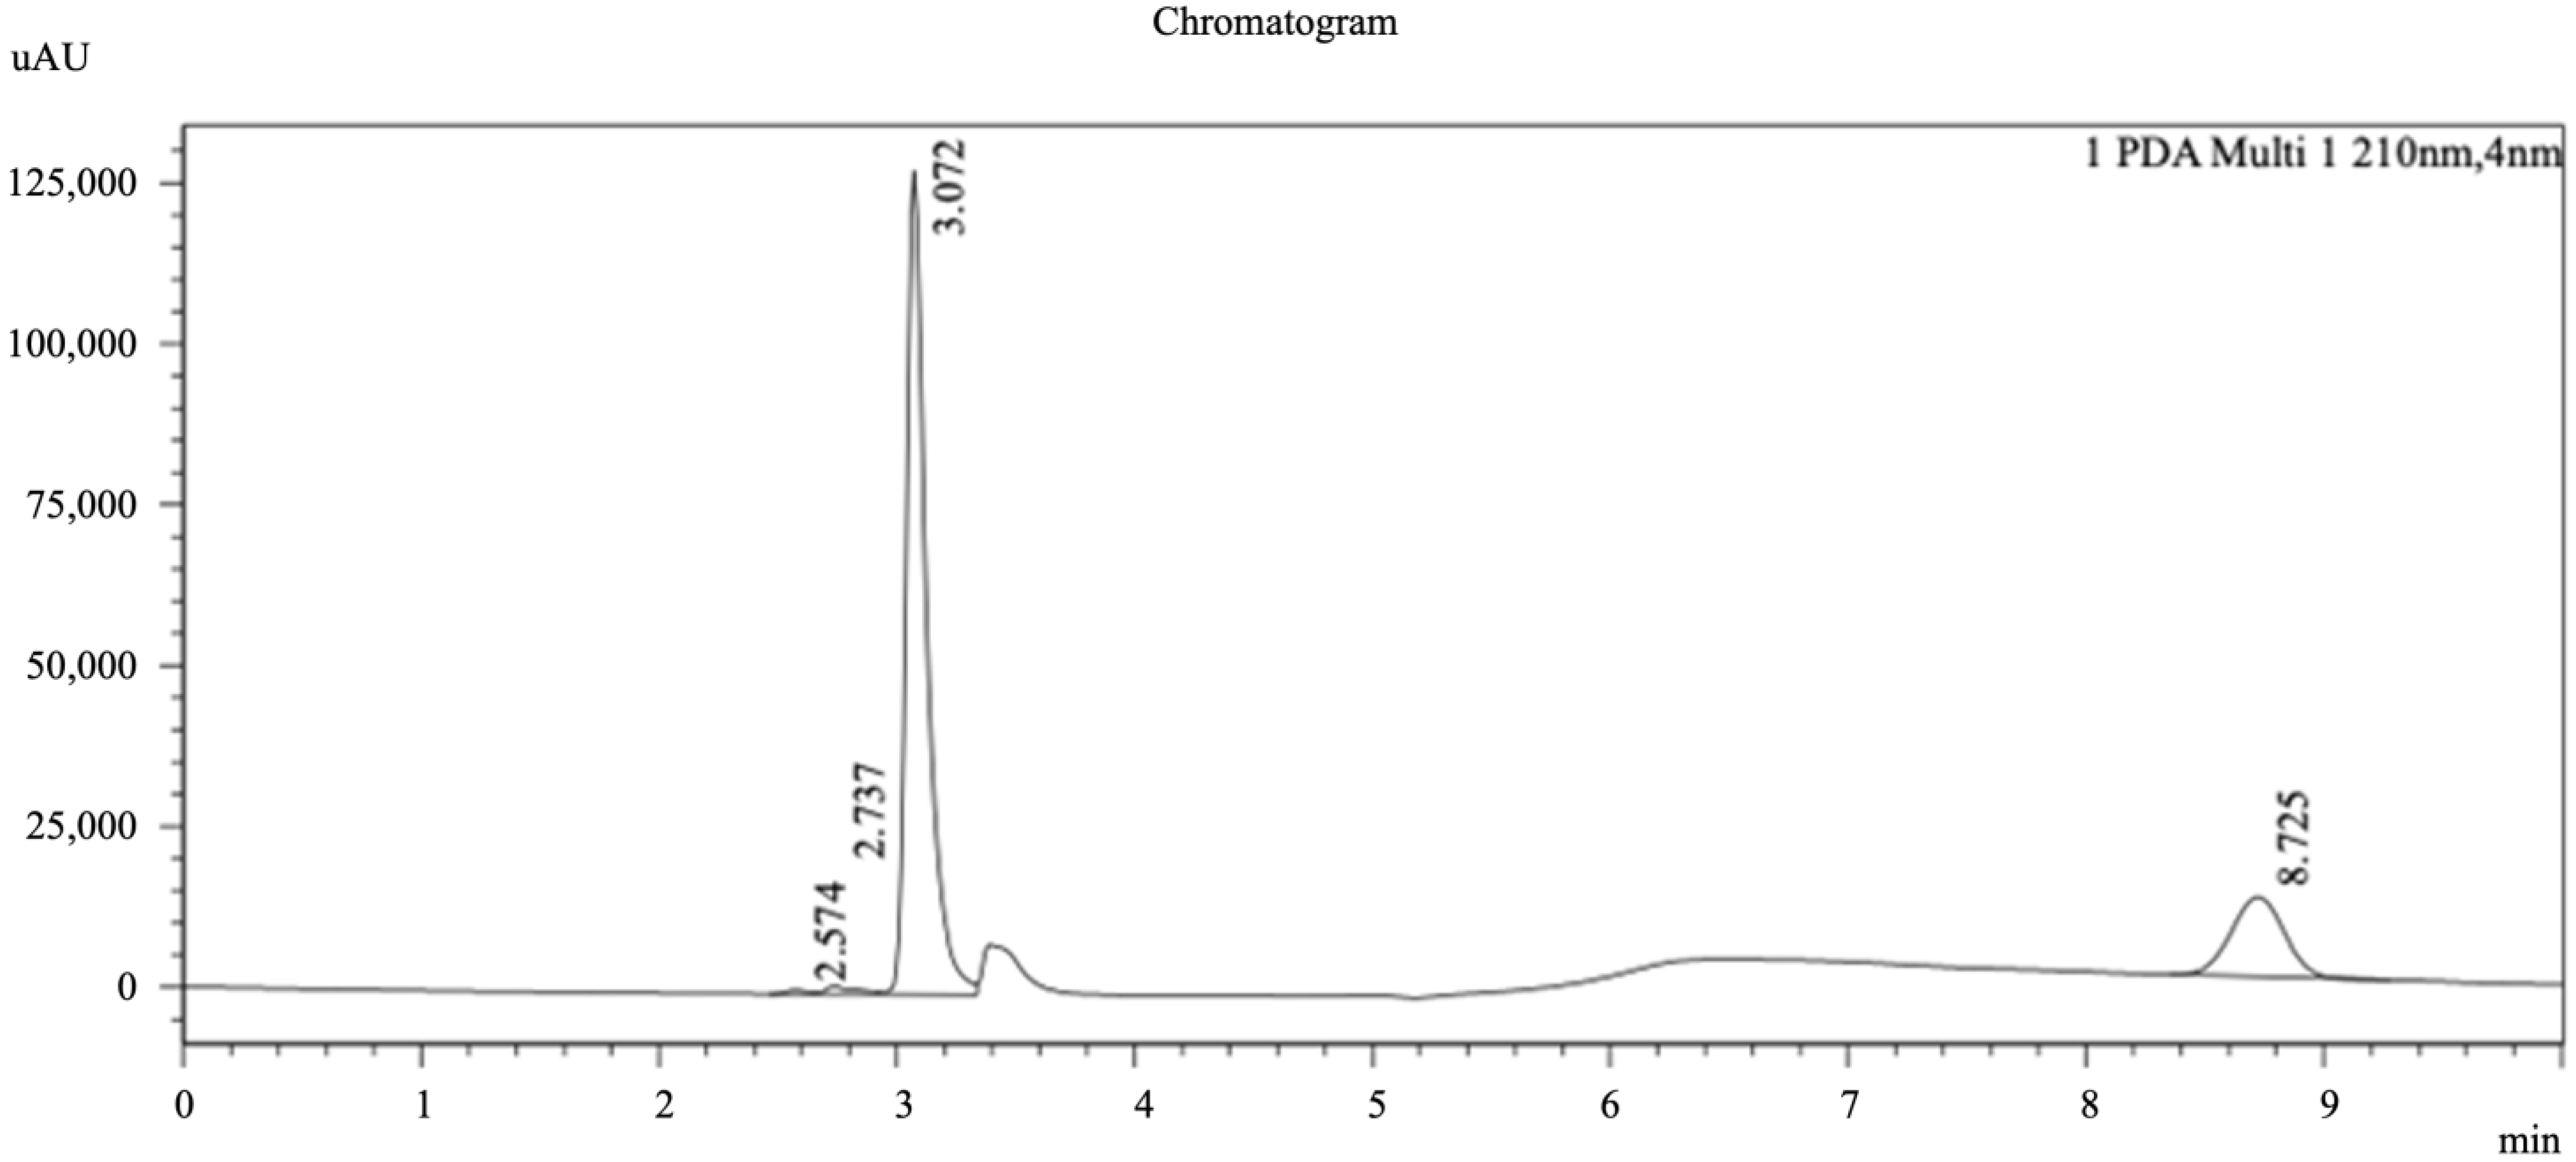
2.4. HPLC Photo-Diode Array (PDA) Chromatogram

The methods described in Figueirinha et al. [31] and Ibrahime Sinan et al. [32] were again used to confirm the major flavonoid profiles in the samples, with appropriate modifications. Flavonoids from the crude extract of malanto were identified using a Nexera-I UHPLC chromatograph (LC2030C3D, Shimadzu Co., Kyoto, Japan) with a C18 column (Agilent 4.6 mm × 150 mm × 5 μm). Chromatographic analysis was performed under the isocratic mode with a mobile phase consisting of methanol and 0.1% formic acid in a ratio of 65:35 (v/v), a flow rate of 1.0 mL/min, column temperature set at 30 °C, a sample injection volume of 10 µL, and the PDA detector (Shimadzu Co.) set at wavelength range 210–280 nm.

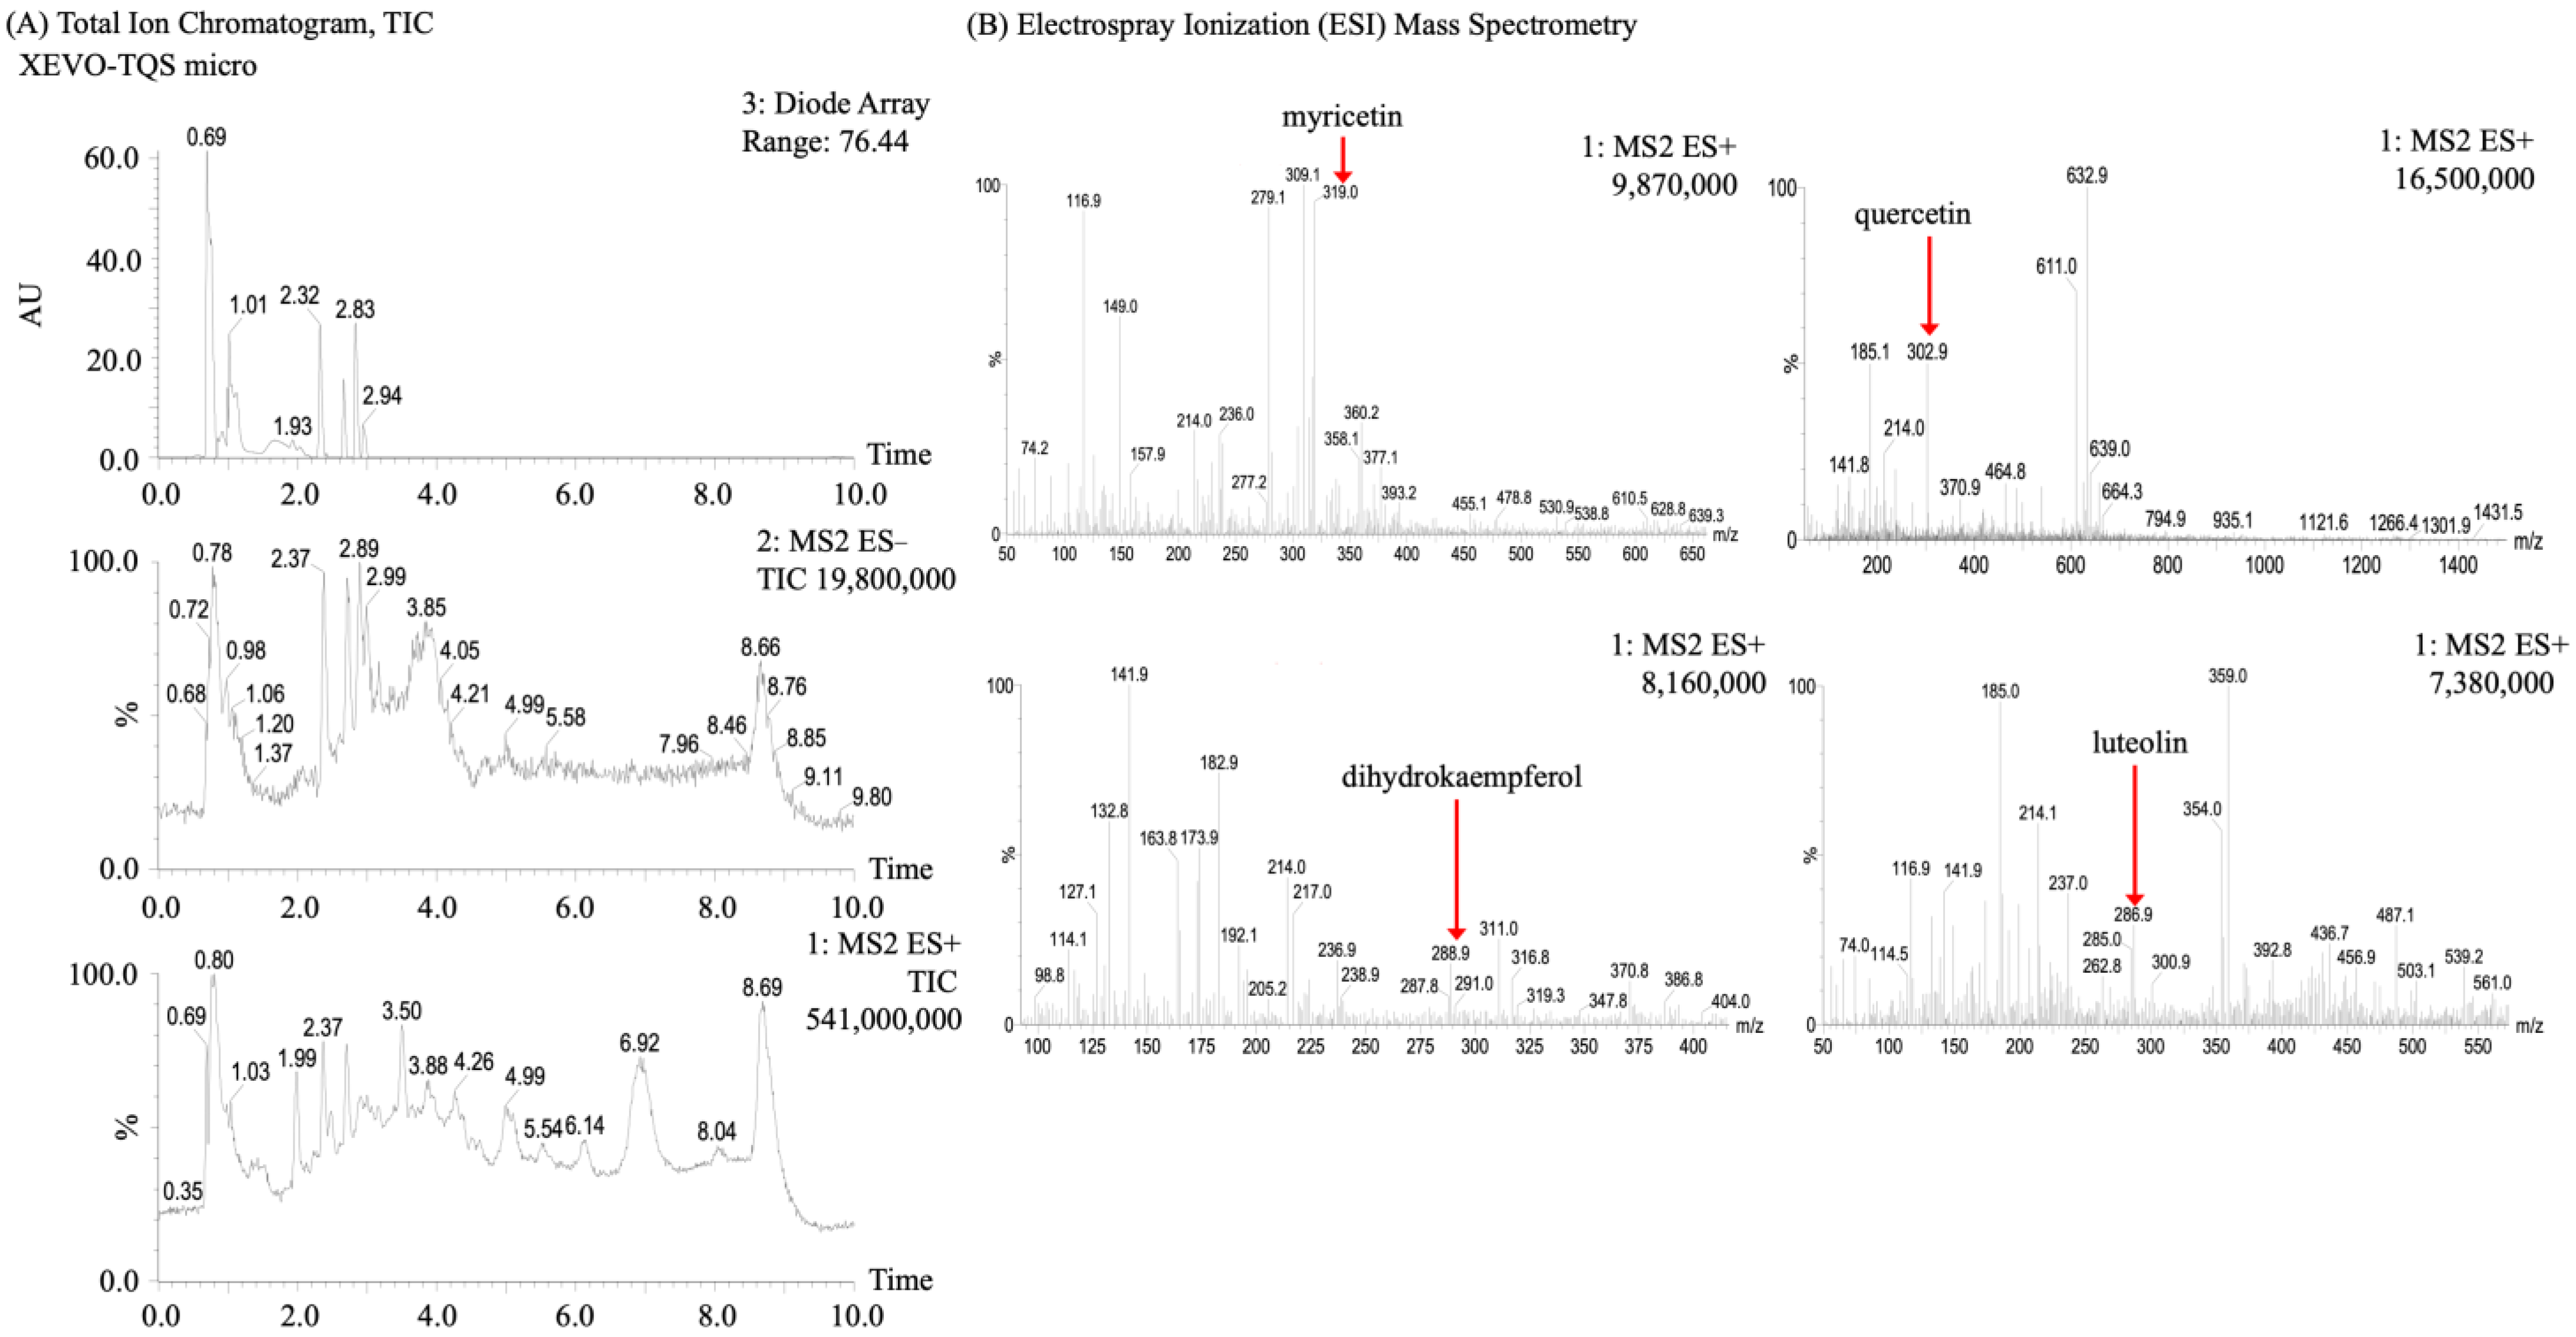
2.5. LC-MS Electron Spray Ionization (ESI+)

The primary assay of the composition of the flavonoids in malanto was performed using a PDA detector, and the second detection was in a mass spectrometer using the method described by Figueirinha et al. [31]. Flavonoids were analyzed using the UPLC system (I-Class plus, Waters Co., Milford, MA, USA) equipped with an interfaced triple quadrupole LC-MS (Waters Co.). The separation was performed on an Agilent C18 reverse-phase column (4.6 mm × 150 mm × 5 μm) at 25 °C. The mobile phases were 2.5% acetic acid as an aqueous solution (A), 2.5% acetic acid water–acetonitrile 90:10 (V/V) (B), and acetonitrile (C). The gradient curves used were 0–100% B in A (0–5 min), 0–15% C in B (5–30 min), 15–50% C in C (30–35 min), and 50% C in C (35–40 min), with a flow rate of 0.5 mL/min. The mass spectrometer was used to obtain a mass analysis in positive ion mode and was programmed to perform three consecutive scans: full mass (50–1500 m/z). The source voltage was 2.5 kV, and the capillary voltage and temperature were 10 V and 175 °C, respectively. Nitrogen was used as the sheath and auxiliary gas at 1.2 and 6 L/min flow rates, respectively. Helium was used as the collision gas with a collision-normalized energy of 45%. All the retention times and MS chromatograms of the flavonoids were confirmed by authentic standards. HPLC chromatograms and total ion chromatograms (TIC) were also obtained using the above method.

2.6. Quantification of Total Flavonoids from Malanto by HPLC

The flavonoid composition of the samples was determined using the methods described by Li et al. [33] and Choi et al. [34], with some modifications. The above crude extract was concentrated to dryness with a vacuum rotary concentrator, re-dissolved in 1 mL of methanol, followed by filtration through a 0.45 μm microporous membrane, and then stored in the sample bottle. The components of the crude extract were identified by Agilent 1260 chromatography (Agilent Technologies, Santa Clara, CA, USA). Each 10 μL sample was injected and then separated using an Agilent C18 (4.6 mm × 150 mm × 5 μm) column at 25 °C, and a UV detector detected the optical density at a wavelength of 320 nm. The mobile phase consisted of methanol (A) and 0.1% formic acid (B) at a flow rate of 1.0 mL/min. The gradient elution was performed as follows: 0 to 3 min, 10–30% A/90–70% B; 3 to 20 min from 30–55% A/70–45% B; 20 to 28 min 55% A/45% B; 28 to 32 min 80% A/20% B; and 32 to 35 min 10% A/90% B. The temperature of the analytical column was maintained at 25 °C. Identification of the flavonoids from malanto was initially performed using UV-visible spectra, retention times, and spiking with authentic standards.

2.7. Molecular Weight Determination of Malanto Extract

The method was a slightly modified version described by Astrid et al. [35]. In brief, the samples were accurately weighed and prepared with 0.1 mol/L sodium nitrate (with 0.01% sodium azide) to a concentration of about 1–3 mg/mL, then filtered with a 0.22 μm microporous filter membrane followed by analysis. The specific parameters were analyzed by HPLC using a PL aqua gel-OH Mixed-H column (8 μm, 7.5 × 300 mm; molecular weight range 200–10,000,000 Da) with a differential detector and a dual-angle laser scattering detector. The flow rate was 1.0 mL/min, the oven temperature was 45 °C, injection volume was 50 μL, and the mobile phase was 0.1 mol/L sodium nitrate (0.01% sodium azide) in isocratic elution. The molecular weight of the sample was calculated from the peak time of the sample and fitted with GPC software.

2.8. Determination of Total Flavonoid Content (TFC)

The TFC method in accordance with Huang et al. [36] was applied, with some modifications. The standard sample of rutin was in the 0.008–0.048 mg/mL range of concentrations. The sample was mixed with 1 mL of 5% NaNO2 and 10% Al (NO3)3 by vibration, and both were incubated for 12 min at room temperature. Afterward, we added 10 mL of 5 % NaOH solution, made up the volume to 25 mL with a 50% ethanol solution, shook the mixture uniformly, and incubated it for 12 min. An absorbance value of 510 nm was measured via spectrophotometer (UV-1200, Shanghai Mapuda Ins., Co., Ltd., Shanghai, China). Rutin was utilized to make the standard curve (y = 12.404 × −0.0098, R2 = 0.9999), and the TFC was expressed as the mg of rutin per one gram of malanto powder dry weight (mg RE/g DW).

2.9. Measured DPPH Free Radical Scavenging Ability

The method described by Huang et al. [37], with appropriate modifications, was applied to determine the DPPH radical scavenging ability in the samples. Various concentrations (5 mg/g, dilution 0–50-fold) of malanto crude extract and vitamin C solution (5 mg/mL, as positive control), 2.0 mL of each, were transferred to a tube. Then, these were mixed with 1.0 mL of 20 μM DPPH solution and 0.8 mL PBS. The reaction was performed for 20 min at room temperature, sheltered from light, and was followed by measuring the absorbance at 517 nm. The DPPH radical scavenging activity was calculated as follows:
DPPH radical scavenging activity (%) = (1 − Abs517nm sample/Abs517nm blank) × 100

2.10. Analysis of Hydrogen Peroxide Scavenging Capacity

The hydrogen peroxide scavenging ability of the sample was determined according to James et al. [38]. The samples and vitamin C (both with an initial concentration of 5 mg/mL) were diluted to 0–50-fold. Afterward, 5 mL of each was added to 5.0 mL of 1% hydrogen peroxide solution (prepared with a phosphate buffer with a pH of 7.4), mixed well, and the absorbance was measured at 230 nm. Then, the 1% hydrogen peroxide solution was replaced with a phosphate buffer with a pH of 7.4 and its absorbance was measured as above. The absorbance of the hydrogen peroxide solution without the sample solution was used as a blank control. The following equation was used to calculate the hydrogen peroxide scavenging ability:
Hydrogen   peroxide   scavenging   rate   ( % ) = ( 1 A 1 A 2 A 0 ) × 100
where A0 is the absorbance value of the hydrogen peroxide solution at 230 nm as a blank control, A1 is the absorbance value at 230 nm, and A2 is the absorbance value at 230 nm after replacing the 1% hydrogen peroxide solution with a pH 7.4 phosphate buffer solution.

2.11. Determination of ·OH Radical Scavenging Ability

This was determined according to the method proposed by Boulebd et al. [39], with due modification. The absorbance of the samples (malanto crude extract, and vitamin C as a positive control group, both 5 mg/g), after being diluted 0–50-fold, was measured at 510 nm using 70% ethanol solution as a blank. ·OH radical scavenging ability was calculated according to the following equation:
Malanto · OH   radical   scavenging   rate   ( % ) = ( 1 A sample A 1 A 0 ) × 100
where A1 is the absorbance of all the operations that were performed as in the sample group, replacing the 1% hydrogen peroxide solution with a phosphate buffer (pH 7.4). A0 is the absorbance of the hydrogen peroxide solution without a sample.

2.12. Measurement of Reducing Power

This was performed as described by Li et al. [40], with minor modifications. In brief, 1.0 mL of various concentrations (5 mg/mL, diluted 0–50-fold) of malanto crude extract and vitamin C (5 mg/mL, as a control group) were each mixed with 2.50 mL of 0.2 M pH 6.6 PBS and 0.1% potassium ferricyanide, and then incubated in a water bath at 50 °C for 20 min, followed by rapid cooling to room temperature. Subsequently, 10% trichloroacetic acid was added to the 2.5 mL and centrifuged at 500× g for 10 min, then 5.0 mL of supernatant, 5.0 mL of distilled water, and 1.0 mL of 0.1 % ferric chloride were added, in turn, mixed, and left to stand for 10 min. The absorbance value was measured at 700 nm, and the samples’ reducing power (%) was calculated according to the following formula:
Reducing   power   ( % ) = ( Abs   sample   Abs   blank )   ×   100

2.13. Oxidative Stability

The determination of secondary oxidation products evaluated the oxidative stability. These products were derived from lipid oxidation and monitored with the peroxide value (POV) using the procedure described, and by adapting the American Oil Chemists’ Society Official Method Cd 8-53 as described by Crowe and White [41] and Lu et al. [42]. Sesame, soybean, and sunflower oil, 100 g of each, were placed in 250 mL flasks and held at 60 °C in an oven for 14 consecutive days. During the experimental procedure, the samples were mixed well; each sample was inspected to ensure that the samples had mixed with sufficient air. A sample from each flask was taken every 24 h and triplicated. From the above samples, 1.0 g was weighed in a dry 250 mL conical bottle, then, 30 mL chloroform-glacial acetic acid mixture was added, followed by 1 mL of saturated potassium iodide solution, added evenly, and the mixture was allowed to react for 5 min in the dark. Then, 50 mL of distilled water was added and mixed thoroughly; this was followed by titration using 0.01 mol/L Na2S2O3 standard solution until the water layer was light yellow. Then, 1 mL of the starch indicator was added and the titration was continued until the blue color disappeared. The volume of Na2S2O3 solution consumed (V1) was recorded; the above steps were followed without adding samples as a blank (V2). Finally, the POV of the sample was calculated according to the following equation:
POV ( g / 100 g ) = ( V 1 V 2 ) × 0.01 W × 1000
where V1 is the volume of Na2S2O3 solution consumed for the oil sample (mL); V2 is the volume of Na2S2O3 solution consumed for the blank (mL); 0.01 is the molar concentration of Na2S2O3 (mol/L); W is the oil sample’s weight (g); and 1000 is the dilution ratio.

2.14. Statistical Analysis

Statistical analysis was performed using IBM® SPSS® statistical software version 18.0 (Armonk, NY, USA). All experiments were triplicated. All data were presented as the mean ± standard deviation (SD). A one-way ANOVA test was employed to compare all the data obtained from the experiments, and Duncan’s multiple range tests were used as post hoc multiple comparison tests to evaluate specific significant differences between pairs of means, with the significance of the difference being p < 0.05.

3. Results

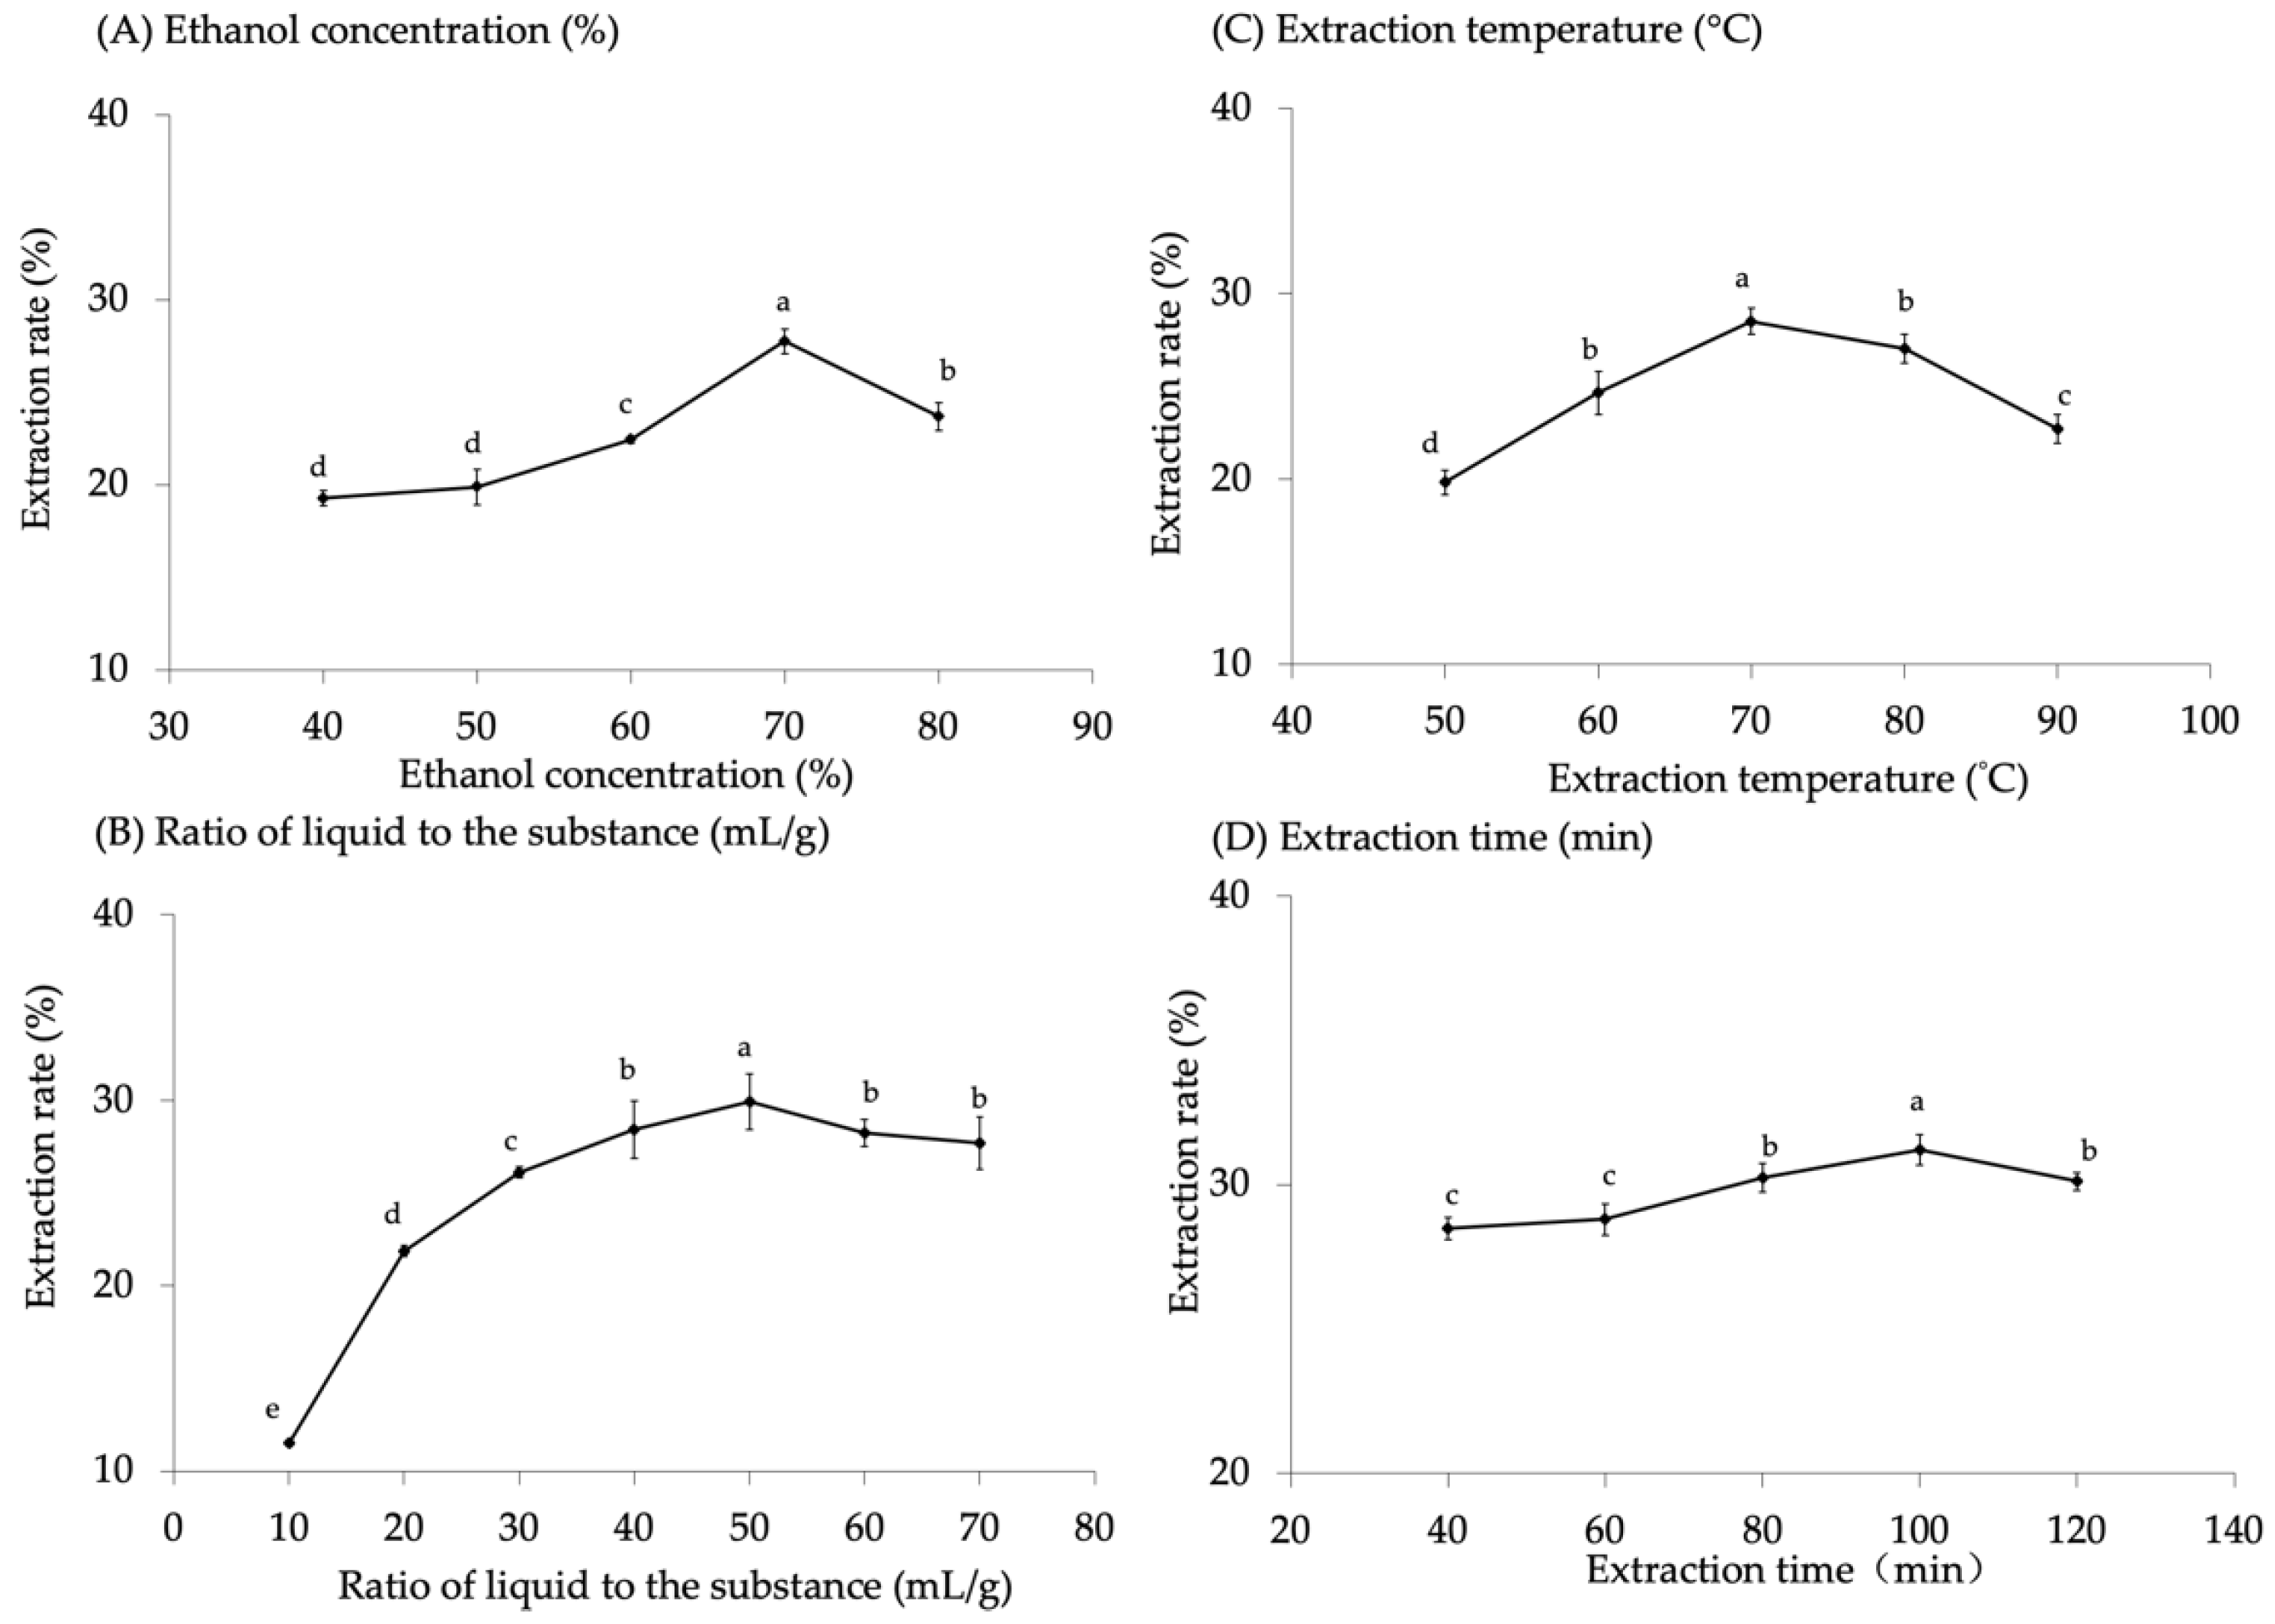
3.1. Extraction Factor Results of Total Flavonoids from Malanto

The influence of ethanol concentration on the extraction rate is depicted in Figure 1A. The extraction results revealed a positive correlation between the flavonoid extraction rate of malanto and the ethanol concentration. The maximum extraction rate of malanto flavonoids was achieved at 70% ethanol concentration and there was a significant difference between the concentrations (p < 0.05). The effect of the liquid–substance ratio on the extraction rate of malanto flavonoids showed that the liquid–substance ratio (ranging from 10 mL/g to 50 mL/g) exhibited a positive correlation with the extraction rate (Figure 1B). Unfortunately, the extraction rate decreased for liquid–substance ratios over 50 mL/g and there was a significant difference for each group (p < 0.05). Notably, the extraction temperature showed the same trends as the liquid–substance ratio; the extraction rate increased with the temperature range of 50–70 °C and decreased over 70 °C (Figure 1C) with significant differences (p < 0.05). This was attributed to the thermal treatment during processing affecting the phenolic and flavonoid content, and it has been reported by Chen et al. [20] that the concentrations extracted below 100 °C are significantly higher than those at other high temperatures. Regarding the extraction time, the malanto flavonoid extraction rate increased sequentially with the time, from 40 min to 100 min, reaching a maximum at 100 min (Figure 1D). However, the extraction rate decreased at 120 min and the difference was significant between all groups (p < 0.05). From the above results, the optimum extraction parameters: 70% ethanol concentration, 50:1 ratio of liquid to substance (mL/g), 70 °C, and 100 min, for flavonoids from malanto were generalized. The maximum possible extraction of flavonoids from malanto was 30.94 mg/g.

3.2. Analysis of Flavonoids in Malanto

Well-known flavonoids are widely distributed in natural products, exhibiting maximum UV absorption wavelengths at 200–280 and 300–400 nm [43,44]. Therefore, identifying a specific analyte is based on its retention time in chromatography. However, this study showed that the flavonoids were primarily present in the ethanol extract, in agreement with the results of Liu, Cai and Xu [45]. Therefore, further qualitative analysis of the flavonoids was performed with HPLC-PDA and HPLC-ESI-MS. In the end, 10 known flavonoid standards were used to determine the flavonoid content in malanto.

3.2.1. Qualitative Analysis of Flavonoids in Malanto

In this study, the HPLC-PDA showed four peaks at 210 nm with different retention times (Figure 2). In terms of peak area and retention time, these four flavonoids were probably dihydromyricetin, dihydrokaempferol, myricetin, and taxifolin. Consequently, to confirm these inferences, a re-confirmation was performed by HPLC-ESI+-MS (Figure 3). However, the four flavonoids were found to be myricetin (ESI+ 319.0), quercetin (ESI+ 302.9), dihydrokaempferol (ESI+ 288.9), and luteolin (ESI+ 286.9), respectively, based on LC-MS results at 50–1500 m/z. The possible reasons for the discrepancy between the above two analytical results are hypothesized to be either their limited content in malanto or the difference in sampling while preparing the malanto samples. Additionally, this has been described in other studies [1,46].

3.2.2. Flavonoid Content and Molecular Weight Distribution in Malanto

In this study, 10 known flavonoids were used to identify the composition and content of the samples (Table 1), which revealed that dihydrokaempferol was present in the greatest concentration in the malanto extract at 9.33 μg/mL, followed by taxifolin, which was present at 1.98 μg/mL. The other flavonoids were quercetin, myricetin, dihydromyricetin, and luteolin in the order of 1.06, 0.73, 0.59, and 0.28 μg/mL, respectively. It has been reported that green tea’s bioactive flavonols and flavonoids include myricetin, quercetin, apigenin, and kaempferol [7,47,48]. It is worth noting that Huang et al. [49] have identified 56 compounds (phenols and flavonoids) in Kalimeris indica, 3,5-dicaffeoylquinic acid and 4,5-dicaffeoylquinic acid being the primary ones, with differences in the accumulation of secondary metabolites due to the different collection locations used. Differences from this study may be attributed to the methodology of extraction and detection, in addition to the location factor. Glycosides of myricetin and quercetin have been found in malanto extract, which implies that malanto may possess antioxidant properties [50]. It has been reported that malanto extracts contain 46 phenolic compounds, including 5 cinnamic acids, 28 chlorogenic acids, and 13 flavonoids [1]. However, only six flavonoids were discovered in this study. It is hypothesized that this was due to decomposition, dilution effects, or irreversible adsorption effects, resulting in the possible loss of some components during the preparation process [51]. Another possibility might be that these compounds were not detected because they were present in minimal amounts that were below the equipment’s detection limits (<0.20 μg/mL). Nevertheless, the flavonoids determined in this study are known and abundant; a total flavonoid content of 29.35 ± 1.60 (mg RE/g DW) was obtained using the above optimal extraction conditions. Subsequently, a size exclusion chromatography (SEC) analysis of the malanto extract was performed with the HPLC system, which obtained a distribution range of flavonoids from 262 (Peak 2) to 1436 (Peak 1) Da (Figure A2).

3.3. In Vitro Antioxidant Capacity of Bioactive Properties

It is well-known that phenolic compounds show highly accessible radical scavenging activity; notably, phenolic acids and flavonoids are able to modulate inflammatory processes [1,52]. It was discovered that a double dose of the malanto extract was required to achieve the benefits of vitamin C (Table 2). This result generated significant differences in the IC50 assay of DPPH free radical scavenging ability. However, as in the case of the hydrogen peroxide scavenging capacity, the malanto extract required a 1.99-fold dosage for the same effect as vitamin C. ·OH radical scavenging ability requires a 1.85-fold dose before achieving effects equivalent to vitamin C. Notably, malanto extract is similar to vitamin C in reducing power, with similar results. Interestingly, it has been reported that myricetin, epigallocatechin, and delphinidin, three flavonoids with a galloyl moiety, have an antioxidant effect 2.6-fold higher than that of vitamin C [53]. Zhong et al. [27] have also indicated the beneficial antioxidant capacity of Kalimeris indica (L.) Sch-Bip extracts obtained with water and ethanol, including superoxide anion free radical, H2O2, hydroxyl free radical, DPPH, and ferrous iron chelating capacity. However, the identification of 56 compounds, including phenols and flavonoids, in Kalimeris indica extracts has been reported by Huang et al. [54]. Moreover, it has been noted that the higher the concentration of polyphenols and flavonoids in plants, the higher their antioxidant capacity is [11]. However, the malanto flavonoids extracted in this study had 50% of the antioxidant capacity of vitamin C, which might be due to the difference in the total flavonoid content.

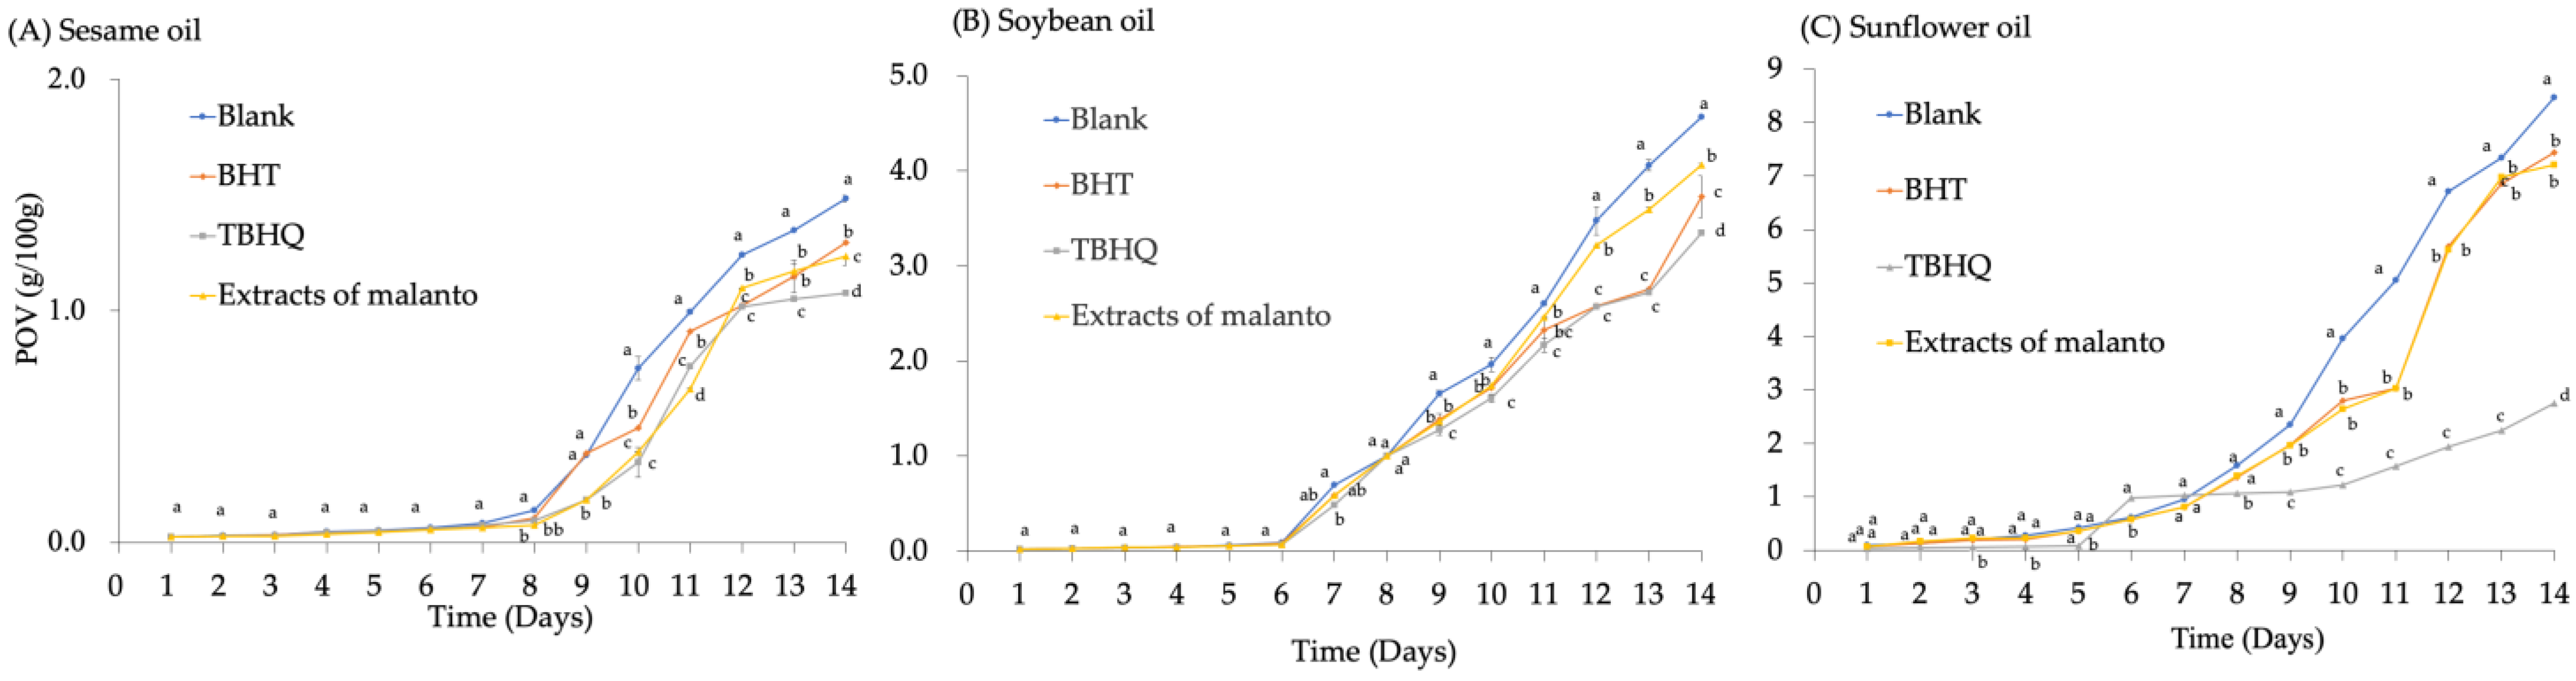
3.4. Effect of Malanto Crude Extracts on Oxidative Stability

The four oxidation pathways for vegetable edible oils are autoxidation (the main mechanism) and light, enzymatic, and thermal oxidation [21]. The extract was subsequently applied to decelerate oil oxidation in recognition of the excellent antioxidant activity attributed to flavonoids. The capacity of malanto crude extract to inhibit lipid oxidation has been further evaluated by monitoring peroxide values to assess the efficacy of malanto crude extract on antioxidant and lipid oxidative stability. It was discovered that the addition of malanto crude extract proved to be beneficial in inhibiting the increased peroxide values. In addition, under accelerated storage conditions, the addition of malanto extract was more effective in inhibiting the lipid oxidation of oils than the control group, which did not have any addition (Figure 4). The results were due to the good antioxidant activity of malanto extract flavonoids. In addition, there was no significant change in sesame oil with malanto extract, BHT, and TBHQ, from day 0 to day 7 (Figure 4A), and the POV started increasing from day 8. At the end of the experiment, on day 14, the descending group order of peroxide values was control, BHT, malanto extract, and TBHQ. However, the POV of soybean oil showed an increasing trend at day 7, where the added BHT, TBHQ, and malanto extracts were significantly lower than the control group (Figure 4B). At the end of day 14, the POVs ranked from high to low in the order of control, malanto extract, BHT, and TBHQ, with significant differences for each group (p < 0.05), which agreed with the results of Subotin et al. [55]. In terms of sunflower oil, the POV of the control group was also the highest, and the oxidative deterioration of the oil was shorter, with a rising trend from day 5, while the POV of TBHQ increased more slowly. Significantly, the POVs of the other three groups were notably higher than those of sesame oil and soybean oil. However, it has been suggested that the optimal concentration for the addition of L-ascorbic acid 6-palmitate, n-octyl gallate, α-tocopherol, and matcha extract, at 0.1–1% [55], is higher than the 0.02% addition in the present study.
According to the above, malanto extract showed different abilities to inhibit the peroxide value of edible oils. The peroxide value of sesame oil with the malanto extract group was less than that of soybean and sunflower oil under the same conditions after day seven. It has been reported that, in the initiation phase of lipid oxidation, due to exposure to initial conditions, such as the application of heat, UV light, visible light, or in the presence of metal ions, the lipid loses its allyl hydrogen, which simultaneously yields an alkyl radical and starts a free radical chain reaction [21,55]. In addition, this study found various degrees of oxidation in different vegetable oils, which might be related to the presence of photosensitizers in vegetable oils, such as riboflavin and chlorophyll; these photosensitizers may trigger a photooxidation pathway that transfers energy to fatty acids, generating free radicals that can react with triplet oxygen and leading to the formation of hydroperoxides. Another mechanism involves the reaction of the photosensitizer itself (activated by light) with triplet oxygen. Thus, reactive singlet oxygen forms, reacting with fatty acid molecules to produce hydroperoxides [22]. In vegetable oils, the first reaction occurs in the presence of riboflavin. In contrast, the second mechanism for producing hydroperoxides happens in the presence of chlorophyll [21,56].
In this study, malanto flavonoids showed a relatively high antioxidant capacity for sesame, soybean, and sunflower oils, with similar antioxidant effects to BHT. In this way, the natural antioxidants extracted from plants might extend the shelf life of edible oils. The safety and efficiency of plant antioxidants have long attracted significant interest from the public and scientists [13,14,51]. They have the dual benefits of retarding the edible oil’s oxidation characteristics and being naturally healthy ingredients. In summary, the study revealed that the autoxidation of the oils remained slow or even unchanged during the initial 5–7 days of the trial, and the presence of antioxidants caused the autoxidation of the oils to be insignificant. However, with increasing temperature, light, oxygen, and time [23], the autoxidation of edible oils gradually became more serious, especially in the control group.

4. Conclusions

In this study, the factors involved in the maximum extraction rate, content, and molecular weight of malanto flavonoids were identified and simultaneously applied to retard the oxidation of edible oils. The results revealed that the maximum flavonoid extraction from malanto was 29.35 ± 1.60 (mg RE/g DW). The flavonoids of malanto were dihydrokaempferol, taxifolin, quercetin, myricetin, dihydromyricetin, and luteolin. Despite the antioxidant capacity being approximately 50% compared with vitamin C, it showed an effect similar to BHT in maintaining the peroxide value of edible oils. Inhibiting the lipid autoxidation process is of practical application to the food industry. Nowadays, the trend is towards the increasing popularity of natural antioxidants as an alternative to synthetic ones, which are available cheaply and without potential harm to human health. This study is beneficial to the comprehensive development and utilization of malanto, providing a theoretical basis for the investigation of natural antioxidants and valuable insights into future research directions; at the same time, it promotes the development of healthier products containing malanto flavonoid ingredients in the market.

Highlights

  • Natural antioxidants are popular due to their apparent effects and high safety.
  • The antioxidant effect of malanto on edible oils was similar to that of BHT.
  • The addition of malanto at 0.02% provided an antioxidant effect to edible oils.
  • The simple extraction process obtained flavonoids from malanto.
  • Malanto flavonoids retard the autoxidation of edible oils for 6–8 days.

Author Contributions

Conceptualization, J.L., P.-H.H. and P.-H.L.; Data curation, J.L., W.-C.L.; P.-H.H. and T.-Y.S.; Formal analysis, J.L., Y.-T.Z., P.-H.H. and P.-H.L.; Funding acquisition, J.L.; Investigation, J.L., Y.-T.Z., W.-C.L., P.-H.H. and P.-H.L.; Methodology, J.L., Y.-T.Z., W.-C.L., P.-H.H. and P.-H.L.; Project administration, J.L.; Resources, J.L., P.-H.H., T.-Y.S. and P.-H.L.; Software, J.L., Y.-T.Z., P.-H.H. and P.-H.L.; Supervision, J.L., Validation, J.L., Y.-T.Z., P.-H.H. and P.-H.L.; Visualization, J.L. and T.-Y.S.; Writing—original draft, W.-C.L., P.-H.H. and P.-H.L.; Writing—review and editing, P.-H.H. and P.-H.L. All authors have read and agreed to the published version of the manuscript.

Funding

This research was funded by the JSFPC30120212594 funding.

Institutional Review Board Statement

Not applicable.

Informed Consent Statement

Not applicable.

Data Availability Statement

Not applicable.

Acknowledgments

Thanks to all authors for contributing to the experiment and writing this article.

Conflicts of Interest

The authors declare no conflict of interest.

Appendix A

Figure A1. The younger leaves of malan (Kalimeris indica (L.) Sch. Bip.) are usually eaten as a vegetable, commonly known as “malanto”. (a) Fresh; (b) Dried at 50 °C for 24 h.
Agriculture 13 00211 g0a1
Figure A2. The molecular weight of malanto flavonoid extract; measurement results. Calculated molecular weight (blue line). Detector: LS 90° (red line).
Agriculture 13 00211 g0a2

References

  1. Xie, L.; Lin, Q.; Guo, K.; Tong, C.; Shi, S.; Shi, F. HPLC-DAD-QTOF-MS/MS based comprehensive metabolomic profiling of phenolic compounds in Kalimeris indica anti-inflammatory fractions. Ind. Crop. Prod. 2019, 140, 111636. [Google Scholar] [CrossRef]
  2. Chen, Y.-W.; Huang, P.-H.; Tsai, Y.-H.; Jiang, C.-M.; Hou, C.-Y. Effects of limonene on the PAHS mutagenicity risk in roasted fish skin. J. Food Process. Technol. 2018, 9, 1–6. [Google Scholar] [CrossRef]
  3. Franco-Vega, A.; Reyes-Jurado, F.; Cardoso-Ugarte, G.A.; Sosa-Morales, M.E.; Palou, E.; López-Malo, A. Chapter 89—Sweet orange (Citrus sinensis) oils. In Essential Oils in Food Preservation, Flavor and Safety; Preedy, V.R., Ed.; Academic Press: San Diego, CA, USA, 2016; pp. 783–790. [Google Scholar]
  4. Martínez, L.; Bastida, P.; Castillo, J.; Ros, G.; Nieto, G. Green alternatives to synthetic antioxidants, antimicrobials, nitrates, and nitrites in clean label spanish chorizo. Antioxidants 2019, 8, 184. [Google Scholar] [CrossRef] [PubMed] [Green Version]
  5. Qiao, Q.; Si, F.; Wu, C.; Wang, J.; Zhang, A.; Tao, J.; Zhang, L.; Liu, Y.; Feng, Z. Transcriptome sequencing and flavonoid metabolism analysis in the leaves of three different cultivars of Acer truncatum. Plant Physiol. Biochem. 2021, 17, 1–13. [Google Scholar] [CrossRef] [PubMed]
  6. Wu, Y.; Zhang, C.; Huang, Z.; Lyu, L.; Li, W.; Wu, W. Integrative analysis of the metabolome and transcriptome provides insights into the mechanisms of flavonoid biosynthesis in blackberry. Food Res. Int. 2022, 153, 110948. [Google Scholar] [CrossRef]
  7. Rha, C.-S.; Jeong, H.W.; Park, S.; Lee, S.; Jung, Y.S.; Kim, D.-O. Antioxidative, anti-inflammatory, and anticancer effects of purified flavonol glycosides and aglycones in green tea. Antioxidants 2019, 8, 278. [Google Scholar] [CrossRef] [Green Version]
  8. Zhang, X.-K.; Lan, Y.-B.; Huang, Y.; Zhao, X.; Duan, C.-Q. Targeted metabolomics of anthocyanin derivatives during prolonged wine aging: Evolution, color contribution and aging prediction. Food Chem. 2020, 339, 127795. [Google Scholar] [CrossRef]
  9. Khan, W.A.; Hu, H.; Cuin, T.A.; Hao, Y.; Ji, X.; Wang, J.; Hu, C. Untargeted metabolomics and comparative flavonoid analysis reveal the nutritional aspects of pak choi. Food Chem. 2022, 383, 132375. [Google Scholar] [CrossRef]
  10. Moura, C.F.H.; Oliveira, L.S.; de Souza, K.O.; da Franca, L.G.; Ribeiro, L.B.; de Souza, P.A.; de Miranda, M.R.A. Acerola—Malpighia emarginata. In Exotic Fruits; Rodrigues, S., de Oliveira Silva, E., de Brito, E.S., Eds.; Academic Press: San Diego, CA, USA, 2018; pp. 7–14. [Google Scholar]
  11. Zou, Q.; Feng, J.; Li, T.; Cheng, G.; Wang, W.; Rao, G.; He, H.; Li, Y. Antioxidation and anti-inflammatory actions of the extract of Nitraria Tangutorum Bobr. fruits reduce the severity of ulcerative colitis in a dextran sulphate sodium-induced mice model. J. Funct. Foods 2022, 91, 105005. [Google Scholar] [CrossRef]
  12. Zhang, C.; Ma, Y.; Zhao, Y.; Hong, Y.; Cai, S.; Pang, M. Phenolic composition, antioxidant and pancreatic lipase inhibitory activities of Chinese sumac (Rhus chinensis Mill.) fruits extracted by different solvents and interaction between myricetin-3-O-rhamnoside and quercetin-3-O -rhamnoside. Int. J. Food Sci. Technol. 2017, 53, 1045–1053. [Google Scholar] [CrossRef]
  13. Yahfoufi, N.; Alsadi, N.; Jambi, M.; Matar, C. The Immunomodulatory and anti-inflammatory role of polyphenols. Nutrients 2018, 10, 1618. [Google Scholar] [CrossRef] [PubMed] [Green Version]
  14. Andrade, J.K.S.; Barros, R.G.C.; Pereira, U.C.; Nogueira, J.P.; Gualberto, N.C.; de Oliveira, C.S.; Shanmugam, S.; Narain, N. Bioaccessibility of bioactive compounds after in vitro gastrointestinal digestion and probiotics fermentation of Brazilian fruits residues with antioxidant and antidiabetic potential. LWT 2022, 153, 112469. [Google Scholar] [CrossRef]
  15. García-Lafuente, A.; Guillamón, E.; Villares, A.; Rostagno, M.A.; Martínez, J.A. Flavonoids as anti-inflammatory agents: Implications in cancer and cardiovascular disease. Inflamm. Res. 2009, 58, 537–552. [Google Scholar] [CrossRef]
  16. Victoria-Campos, C.I.; Ornelas-Paz, J.D.J.; Rocha-Guzmán, N.E.; Gallegos-Infante, J.A.; Failla, M.L.; Pérez-Martínez, J.D.; Rios-Velasco, C.; Ibarra-Junquera, V. Gastrointestinal metabolism and bioaccessibility of selected anthocyanins isolated from commonly consumed fruits. Food Chem. 2022, 383, 132451. [Google Scholar] [CrossRef] [PubMed]
  17. Gonçalves, A.C.; Nunes, A.R.; Flores-Félix, J.D.; Alves, G.; Silva, L.R. Cherries and blueberries-based beverages: Functional foods with antidiabetic and immune booster properties. Molecules 2022, 27, 3294. [Google Scholar] [CrossRef]
  18. Manasa, V.; Tumaney, A.W. Evaluation of the anti-dyslipidemic effect of spice fixed oils in the in vitro assays and the high fat diet-induced dyslipidemic mice. Food Biosci. 2022, 46, 101574. [Google Scholar] [CrossRef]
  19. Liu, Z.; Chen, Q.; Zhang, C.; Ni, L. Comparative study of the anti-obesity and gut microbiota modulation effects of green tea phenolics and their oxidation products in high-fat-induced obese mice. Food Chem. 2021, 367, 130735. [Google Scholar] [CrossRef]
  20. Chen, M.-L.; Yang, D.-J.; Liu, S.-C. Effects of drying temperature on the flavonoid, phenolic acid and antioxidative capacities of the methanol extract of citrus fruit (Citrus sinensis (L.) Osbeck) peels. Int. J. Food Sci. Technol. 2011, 46, 1179–1185. [Google Scholar] [CrossRef]
  21. Echegaray, N.; Pateiro, M.; Nieto, G.; Rosmini, M.R.; Munekata, P.E.S.; Sosa-Morales, M.E.; Lorenzo, J.M. Chapter 7—Lipid oxidation of vegetable oils. In Food Lipids; Lorenzo, J.M., Munekata, P.E.S., Pateiro, M., Barba, F.J., Domínguez, R., Eds.; Academic Press: San Diego, CA, USA, 2022; pp. 127–152. [Google Scholar]
  22. Galano, J.-M.; Lee, Y.Y.; Durand, T.; Lee, J.C.-Y. ecial issue on “analytical methods for oxidized biomolecules and antioxidants” the use of isoprostanoids as biomarkers of oxidative damage, and their role in human dietary intervention studies. Free. Radic. Res. 2015, 49, 583–598. [Google Scholar] [CrossRef]
  23. Choe, E.; Min, D.B. Mechanisms and factors for edible oil oxidation. Compr. Rev. Food Sci. Food Saf. 2006, 5, 169–186. [Google Scholar] [CrossRef]
  24. Wang, G.-K.; Jin, W.-F.; Zhang, N.; Wang, G.; Cheng, Y.-Y.; Morris-Natschke, S.L.; Goto, M.; Zhou, Z.-Y.; Liu, J.-S.; Lee, K.-H. Kalshiolin A, new lignan from Kalimeris shimadai. J. Asian Nat. Prod. Res. 2019, 22, 489–495. [Google Scholar] [CrossRef] [PubMed]
  25. Wang, G.-K.; Zhang, N.; Yao, J.-N.; Yu, Y.; Wang, G.; Hung, C.-C.; Cheng, Y.-Y.; Morris-Natschke, S.L.; Zhou, Z.-Y.; Liu, J.-S.; et al. Kalshinoids A–F, Anti-inflammatory Sesquiterpenes from Kalimeris shimadae. J. Nat. Prod. 2019, 82, 3372–3378. [Google Scholar] [CrossRef] [PubMed]
  26. Wang, G.; Zhang, N.; Wang, Y.; Liu, J.; Wang, G.; Zhou, Z.; Lu, C.; Yang, J. The hepatoprotective activities of Kalimeris indica ethanol extract against liver injury in vivo. Food Sci. Nutr. 2019, 7, 3797–3807. [Google Scholar] [CrossRef] [PubMed] [Green Version]
  27. Zhong, R.-F.; Xu, G.-B.; Wang, Z.; Wang, A.-M.; Guan, H.-Y.; Li, J.; He, X.; Liu, J.-H.; Zhou, M.; Li, Y.-J.; et al. Identification of anti-inflammatory constituents from Kalimeris indica with UHPLC-ESI-Q-TOF-MS/MS and GC–MS. J. Ethnopharmacol. 2015, 165, 39–45. [Google Scholar] [CrossRef] [PubMed]
  28. Wang, G.-K.; Yu, Y.; Wang, Z.; Cai, B.-X.; Zhou, Z.-Y.; Wang, G.; Liu, J.-S. Two new terpenoids from Kalimeris indica. Nat. Prod. Res. 2017, 31, 2348–2353. [Google Scholar] [CrossRef] [PubMed]
  29. Zhang, N.; Jin, W.-F.; Sun, Y.-P.; Wang, G.; Yu, Y.; Zhou, Z.-Y.; Wang, G.-K.; Liu, J.-S. Indole and flavonoid from the herbs of Kalimeris shimadai. Phytochem. Lett. 2018, 28, 135–138. [Google Scholar] [CrossRef]
  30. Wang, G.-K.; Wang, Z.; Yu, Y.; Zhang, N.; Zhou, Z.-Y.; Wang, G.; Liu, J.-S. A new sesquiterpene from Kalimeris integrifolia. Nat. Prod. Res. 2017, 32, 1004–1009. [Google Scholar] [CrossRef]
  31. Figueirinha, A.; Paranhos, A.; Pérez-Alonso, J.J.; Santos-Buelga, C.; Batista, M.T. Cymbopogon citratus leaves: Characterization of flavonoids by HPLC–PDA–ESI/MS/MS and an approach to their potential as a source of bioactive polyphenols. Food Chem. 2008, 110, 718–728. [Google Scholar] [CrossRef]
  32. Ibrahime Sinan, K.; Aktumsek, A.; de la Luz Cádiz-Gurrea, M.; Leyva-Jiménez, F.J.; Fernández-Ochoa, Á.; Segura-Carretero, A.; Glamocilja, J.; Sokovic, M.; Nenadić, M.; Zengin, G. A prospective of multiple biopharmaceutical activities of procyanidins-rich uapaca togoensis pax extracts: HPLC-ESI-TOF-MS coupled with bioinformatics analysis. Chem. Biodivers. 2021, 18, e2100299. [Google Scholar] [CrossRef] [PubMed]
  33. Li, S.; Li, Y.; Jiang, Z.; Hu, C.; Gao, Y.; Zhou, Q. Efficacy of total flavonoids of Rhizoma drynariae on the blood vessels and the bone graft in the induced membrane. Phytomedicine 2022, 99, 153995. [Google Scholar] [CrossRef]
  34. Choi, K.-C.; Son, Y.-O.; Hwang, J.-M.; Kim, B.-T.; Chae, M.; Lee, J.-C. Antioxidant, anti-inflammatory and anti-septic potential of phenolic acids and flavonoid fractions isolated from Lolium multiflorum. Pharm. Biol. 2016, 55, 611–619. [Google Scholar] [CrossRef] [PubMed] [Green Version]
  35. Obmann, A.; Zehl, M.; Purevsuren, S.; Narantuya, S.; Reznicek, G.; Kletter, C.; Glasl, S. Quantification of flavonoid glycosides in an aqueous extract from the traditional mongolian medicinal plant dianthus versicolorfisch. J. Sep. Sci. 2011, 34, 292–298. [Google Scholar] [CrossRef] [PubMed]
  36. Huang, P.-H.; Cheng, Y.-T.; Chan, Y.-J.; Lu, W.-C.; Li, P.-H. Effect of heat treatment on nutritional and chromatic properties of mung bean (Vigna radiata L.). Agronomy 2022, 12, 1365. [Google Scholar] [CrossRef]
  37. Huang, P.-H.; Lu, H.-T.; Wang, Y.-T.; Wu, M.-C. Antioxidant activity and emulsion-stabilizing effect of pectic enzyme treated pectin in soy protein isolate-stabilized Oil/Water emulsion. J. Agric. Food Chem. 2011, 59, 9623–9628. [Google Scholar] [CrossRef] [PubMed]
  38. James, A.; Yao, T.; Ma, G.; Gu, Z.; Cai, Q.; Wang, Y. Effect of hypobaric storage on Northland blueberry bioactive compounds and antioxidant capacity. Sci. Hortic. 2021, 291, 110609. [Google Scholar] [CrossRef]
  39. Boulebd, H. Radical scavenging behavior of butylated hydroxytoluene against oxygenated free radicals in physiological environments: Insights from DFT calculations. Int. J. Chem. Kinet. 2021, 54, 50–57. [Google Scholar] [CrossRef]
  40. Li, Q.; Li, H.-T.; Bai, Y.-P.; Zhu, K.-R.; Huang, P.-H. Effect of thermal treatment on the physicochemical, ultrastructural, and antioxidant characteristics of Euryale ferox seeds and flour. Foods 2022, 11, 2404. [Google Scholar] [CrossRef]
  41. Crowe, T.D.; White, P.J. Adaptation of the AOCS official method for measuring hydroperoxides from small-scale oil samples. J. Am. Oil Chem. Soc. 2001, 78, 1267–1269. [Google Scholar] [CrossRef]
  42. Lu, W.-C.; Chiu, C.-S.; Hsieh, C.-W.; Chan, Y.-J.; Liang, Z.-C.; Wang, C.-C.R.; Mulio, A.T.; Le, D.H.T.; Li, P.-H. Calcined Oyster Shell powder as a natural preservative for maintaining quality of white shrimp (Litopenaeus vannamei). Biology 2022, 11, 334. [Google Scholar] [CrossRef]
  43. Anouar, E.H.; Gierschner, J.; Duroux, J.-L.; Trouillas, P. UV/Visible spectra of natural polyphenols: A time-dependent density functional theory study. Food Chem. 2012, 131, 79–89. [Google Scholar] [CrossRef]
  44. Mabry, T.J.; Markham, K.R.; Thomas, M.B. The ultraviolet spectra of flavones and flavonols. In The Systematic Identification of Flavonoids; Mabry, T.J., Markham, K.R., Thomas, M.B., Eds.; Springer: Berlin/Heidelberg, Germany, 1970; pp. 41–164. [Google Scholar]
  45. Liu, R.; Cai, Z.; Xu, B. Characterization and quantification of flavonoids and saponins in adzuki bean (Vigna angularis L.) by HPLC–DAD–ESI–MSn analysis. Chem. Central J. 2017, 11, 93. [Google Scholar] [CrossRef] [Green Version]
  46. Cai, J.; Sweeney, A.M. The Proof Is in the Pidan: Generalizing Proteins as Patchy Particles. ACS Central Sci. 2018, 4, 840–853. [Google Scholar] [CrossRef] [PubMed]
  47. Monobe, M.; Nomura, S.; Ema, K.; Matsunaga, A.; Nesumi, A.; Yoshida, K.; Maeda-Yamamoto, M.; Horie, H. Quercetin Glycosides-rich Tea Cultivars (Camellia sinensis L.) in Japan. Food Sci. Technol. Res. 2015, 21, 333–340. [Google Scholar] [CrossRef] [Green Version]
  48. Semwal, D.K.; Semwal, R.B.; Combrinck, S.; Viljoen, A. Myricetin: A dietary molecule with diverse biological activities. Nutrients 2016, 8, 90. [Google Scholar] [CrossRef] [PubMed] [Green Version]
  49. Huang, W.; Wen, Z.; Wang, Q.; Chen, R.; Li, Z.; Feng, Y.; Yang, S. The chemical profile of active fraction of Kalimeris indica and its quantitative analysis. Biomed. Chromatogr. 2020, 34, e4828. [Google Scholar] [CrossRef] [PubMed]
  50. Bai, H.-W.; Zhu, B.T. Myricetin and quercetin are naturally occurring co-substrates of cyclooxygenases in vivo. Prostaglandins Leukot. Essent. Fat. Acids 2010, 82, 45–50. [Google Scholar] [CrossRef] [PubMed] [Green Version]
  51. Gao, Q.; Ma, R.; Chen, L.; Shi, S.; Cai, P.; Zhang, S.; Xiang, H. Antioxidant profiling of vine tea (Ampelopsis grossedentata): Off-line coupling heart-cutting HSCCC with HPLC–DAD–QTOF-MS/MS. Food Chem. 2017, 225, 55–61. [Google Scholar] [CrossRef]
  52. Park, K.-S.; Chong, Y.; Kim, M.K. Myricetin: Biological activity related to human health. Appl. Biol. Chem. 2016, 59, 259–269. [Google Scholar] [CrossRef]
  53. Kim, D.-O.; Lee, C.Y. Comprehensive study on vitamin c equivalent antioxidant capacity (VCEAC) of various polyphenolics in scavenging a free radical and its structural relationship. Crit. Rev. Food Sci. Nutr. 2004, 44, 253–273. [Google Scholar] [CrossRef]
  54. Subotin, I.; Druta, R.; Popovici, V.; Covaci, E.; Sturza, R. Kinetic of forced oxidation of grape seeds, walnuts and corn germs oils in the presence of antioxidants. Food Nutr. Sci. 2021, 12, 1326–1339. [Google Scholar] [CrossRef]
  55. Matthäus, B. 6—Oxidation of edible oils. In Oxidation in Foods and Beverages and Antioxidant Applications; Decker, E.A., Elias, R.J., McClements, D.J., Eds.; Woodhead Publishing: Philadelphia, PA, USA, 2010; pp. 183–238. [Google Scholar]
  56. Shi, S.; Guo, K.; Tong, R.; Liu, Y.; Tong, C.; Peng, M. Online extraction–HPLC–FRAP system for direct identification of antioxidants from solid Du-zhong brick tea. Food Chem. 2019, 288, 215–220. [Google Scholar] [CrossRef] [PubMed]
Figure 1. Influence of extraction conditions on total flavonoid extraction rate (%). (A) Ethanol concentration (%); (B) Ratio of liquid to the substance (mL/g); (C) Extraction temperature (°C); and (D) Extraction time (min). Different lowercase letters in the figure represent significant differences (p < 0.05).
Agriculture 13 00211 g001
Figure 2. Representative HPLC photo-diode array (PDA) chromatogram of malanto extracts. Conditions: mobile phase acetonitrile: water (65:35, v/v); flow rate 0.9 mL/min; PDA detection wavelength 220 nm; column temperature 30 °C; sample temperature 25 °C; injection volume 20 µL.
Agriculture 13 00211 g002
Figure 3. HPLC–ESI–MS total ion chromatograms of malanto extracts. (A) HPLC–ESI–MS total ion chromatogram of malanto total extract; (B) HPLC–ESI–MS total ion chromatogram of malanto extract flavonoids.
Agriculture 13 00211 g003
Figure 4. The oxidative stability of the crude extracts of malanto was measured by the peroxide value of (A) Sesame oil, (B) Soybean oil, and (C) Sunflower oil. Different lowercase letters in the figure represent significant differences (p < 0.05).
Agriculture 13 00211 g004
Table 1. Measured flavonoid contents and results of the malanto extract.
StandardAmount (μg/mL)
Dihydromyricetin0.59
Taxifolin1.98
Dihydrokaempferol9.33
Myricetin0.73
EriodictyolN.D. (<0.20)
Quercetin1.06
NaringeninN.D. (<0.20)
Luteolin0.28
KaempferolN.D. (<0.20)
ApigeninN.D. (<0.20)
N.D. means no detection.
Table 2. In vitro antioxidant capacity (half maximal inhibitory concentration, IC50) of bioactive substances from extracts of malanto.
Antioxidant Capacity, IC50Extracts of MalantoVitamin C
DPPH free radical scavenging ability0.31 ± 0.05 a0.15 ± 0.02 b
Hydrogen peroxide scavenging capacity4.27 ± 0.03 a2.15 ± 0.01 b
·OH radical scavenging ability0.50 ± 0.01 a0.27 ± 0.02 b
Reducing power0.04 ± 0.01 a0.06 ± 0.01 a
Lowercase letters in the same column indicate significant differences according to Duncan’s multiple range tests (p < 0.05).
Disclaimer/Publisher’s Note: The statements, opinions and data contained in all publications are solely those of the individual author(s) and contributor(s) and not of MDPI and/or the editor(s). MDPI and/or the editor(s) disclaim responsibility for any injury to people or property resulting from any ideas, methods, instructions or products referred to in the content.

