The Relationship Between the Ganglion Cell–Inner Plexiform Layer, Retinal Nerve Fiber Layer, and Photopic Negative Response in Newly Diagnosed Pituitary Macroadenoma: 12-Month Prospective Follow-Up Study

 ,
,  , , , and
Simple Summary
Abstract
1. Introduction
2. Materials and Methods
2.1. Study Groups and Treatment Allocation
2.2. Inclusion and Exclusion Criteria
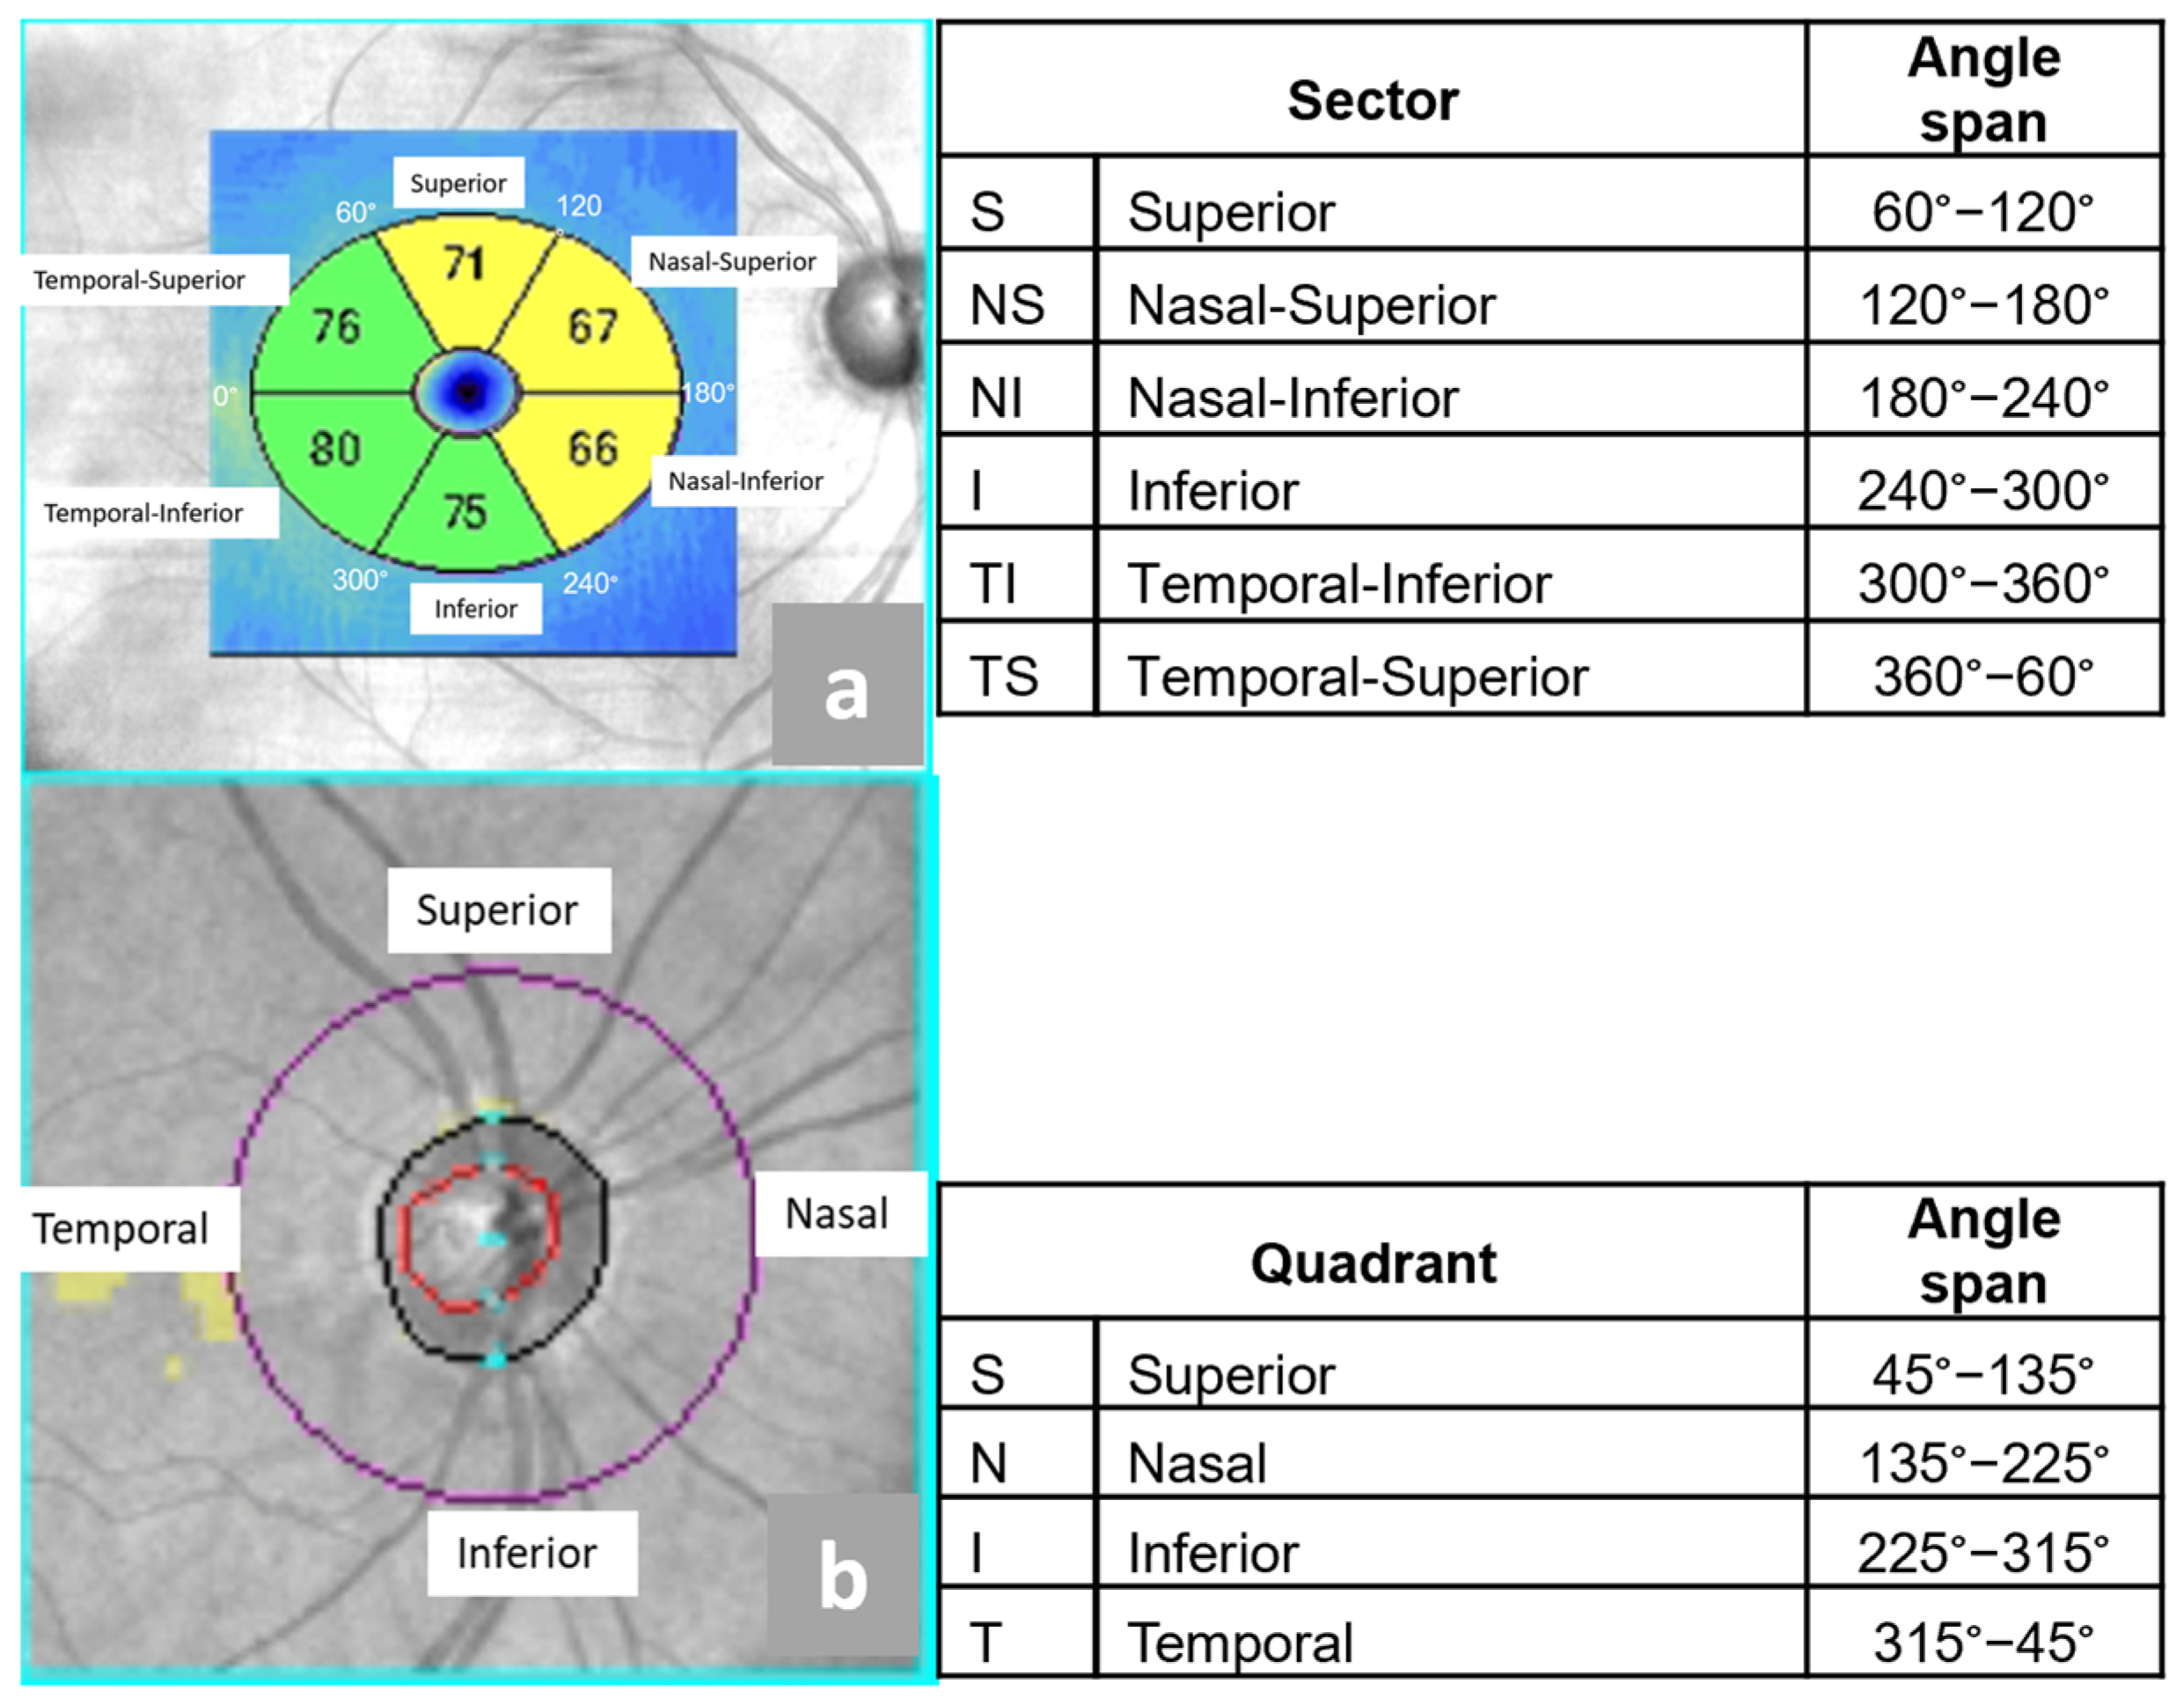
2.3. Optical Coherence Tomography
- Superior (S),
- Nasal Superior (NS),
- Nasal Inferior (NI)
- Inferior (I),
- Temporal Inferior (ST),
- Temporal Superior (TS).
- Superior (S),
- Nasal (N),
- Inferior (I),
- Temporal (T).
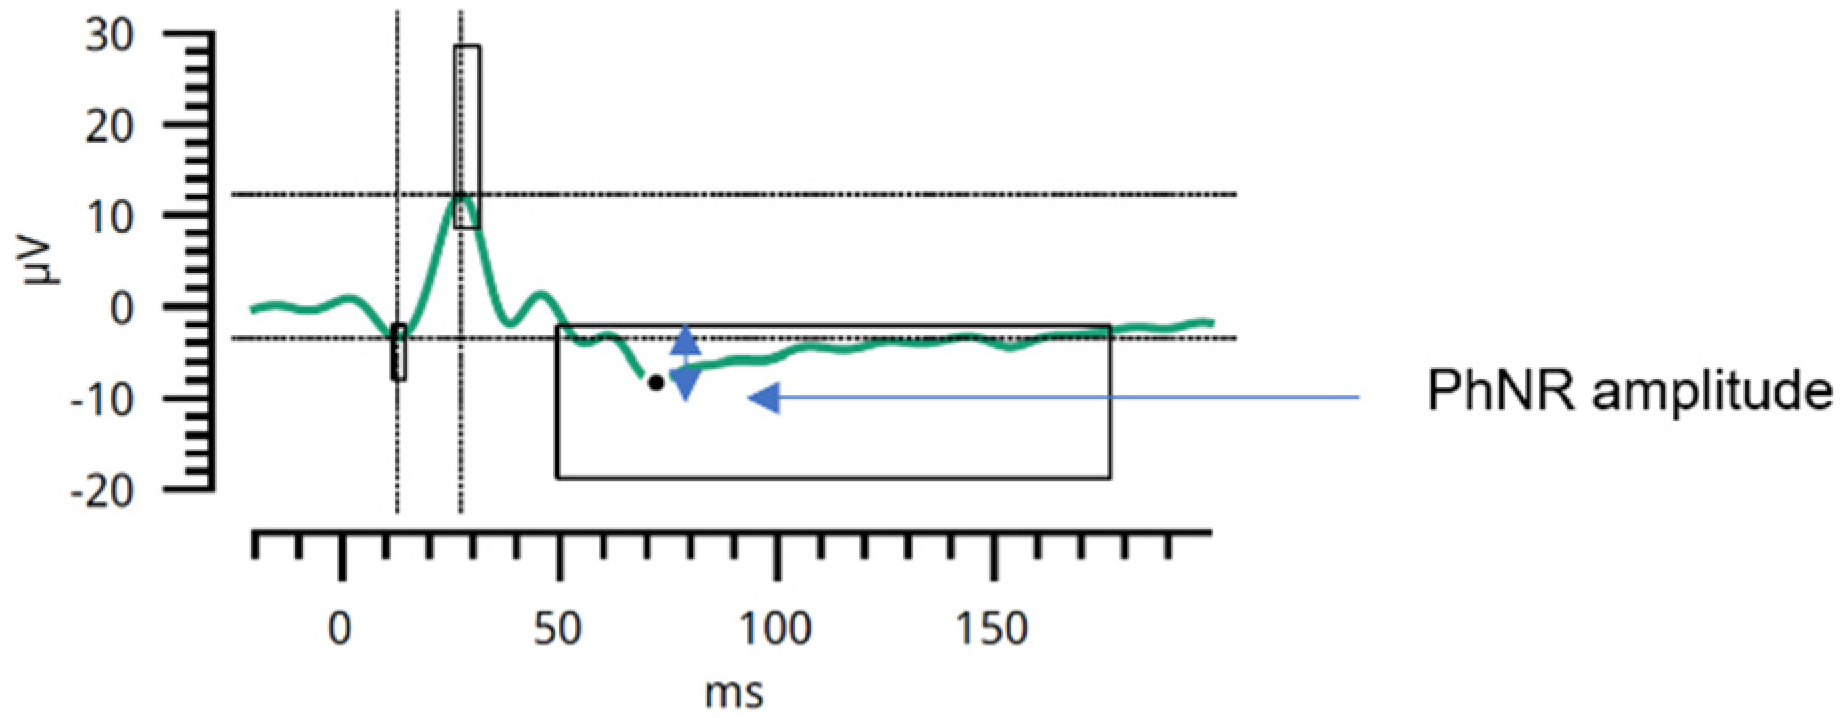
2.4. Photopic Negative Response in Electroretinography
2.5. Statistical Analysis
3. Results
3.1. Descriptive Statistics
3.2. Analytical Statistics
3.2.1. Visual Acuity
3.2.2. Intraocular Pressure
3.2.3. OCT Parameters Versus Parameters in ERG
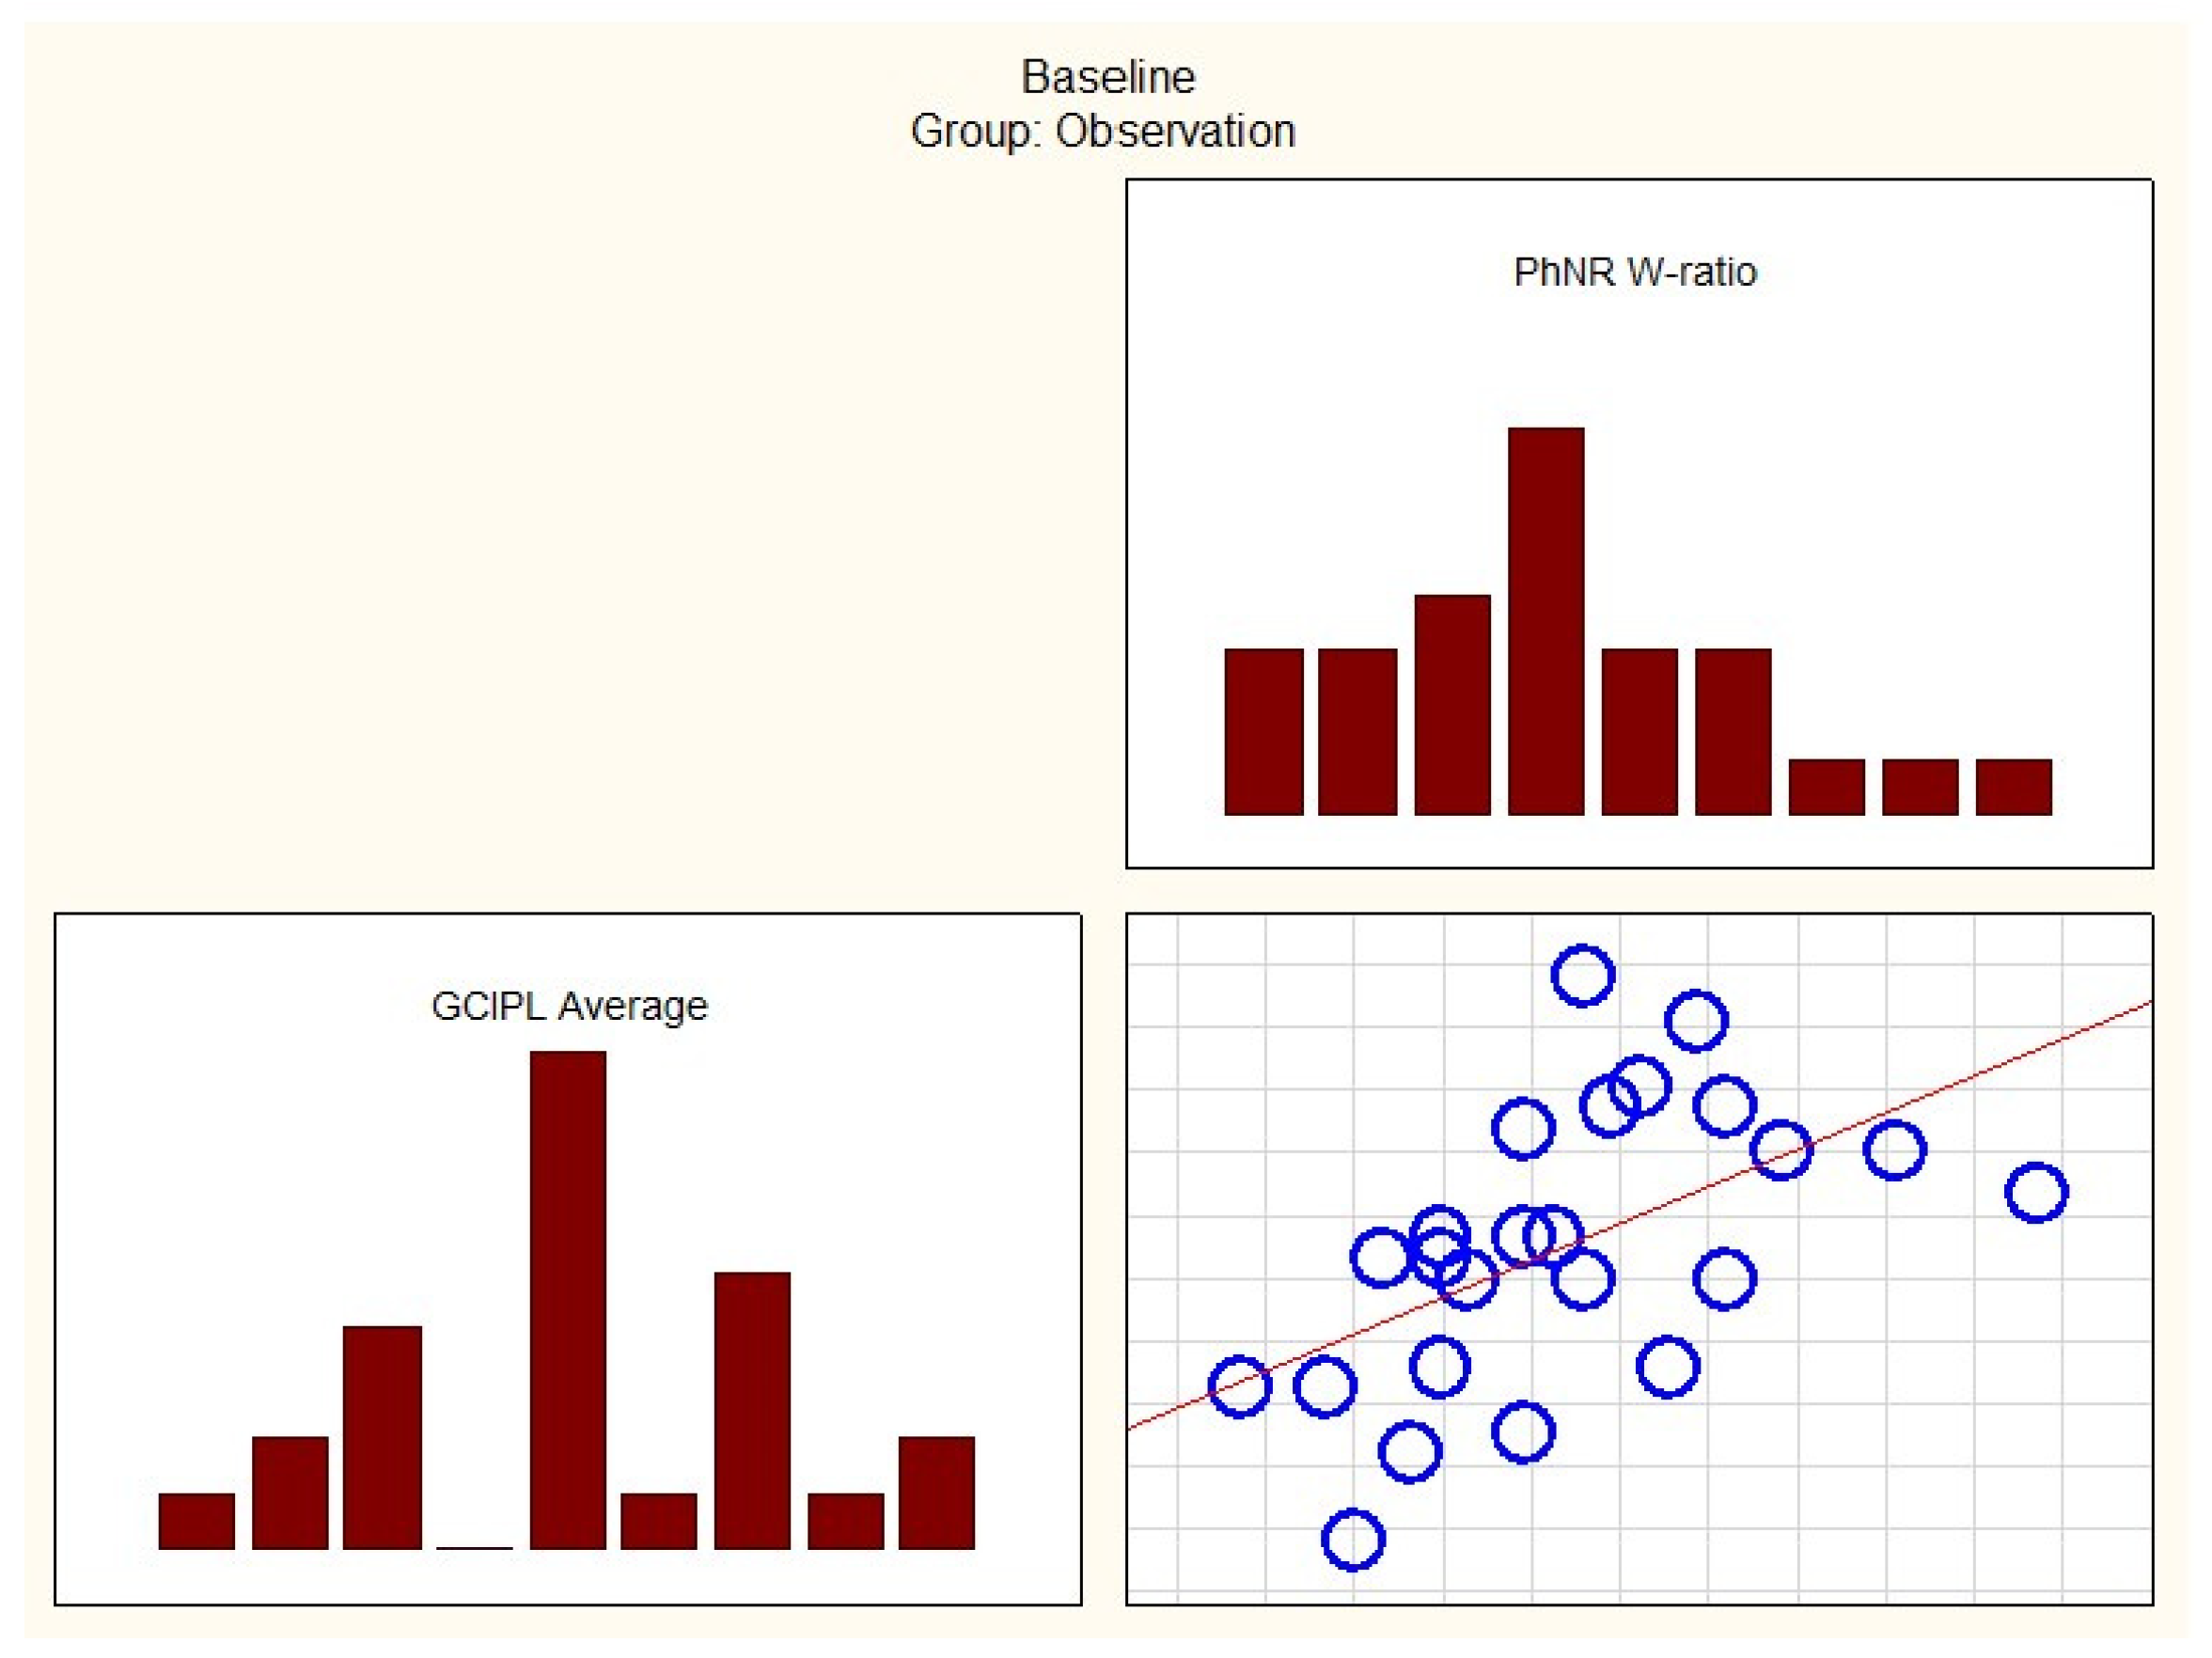
3.2.4. Correlations
4. Discussion
4.1. Treatment Group Versus Observation Group
4.2. Discussion Summary
4.3. Limitations and Strengths of the Study
4.4. Clinical Implications
- Treatment group:
- Observation group:
5. Conclusions
Author Contributions
Funding
Institutional Review Board Statement
Informed Consent Statement
Data Availability Statement
Conflicts of Interest
Abbreviations
| GCIPL | Ganglion Cell–Inner Plexiform Layer |
| RNFL | Retinal Nerve Fiber Layer |
| PhNR | Photopic Negative Response |
| PhNR W-ratio | Photopic Negative Response W-Ratio |
| OCT | Optical Coherence Tomography |
| GH | Growth Hormone |
| ACTH | Adrenocorticotropic Hormone |
| NFPAs | Non-Functioning Pituitary Tumors |
| ERG | Electroretinography |
| RGC | Retinal Ganglion Cell |
| BCVA | Best Corrected Visual Acuity |
| S | Superior |
| TS | Temporal Superior |
| TI | Temporal Inferior |
| NS | Nasal Superior |
| NI | Nasal Inferior |
| I | Inferior |
| T | Temporal |
| N | Nasal |
| MRI | Magnetic Resonance Imaging |
| ms | Milliseconds |
| μV | Microvolts |
| Min–Max | Minium–Maximum |
References
- Colao, A.; Savastano, S. Medical Treatment of Prolactinomas. Nat. Rev. Endocrinol. 2011, 7, 267–278. [Google Scholar] [CrossRef]
- Colao, A.; Pivonello, R.; Auriemma, R.S.; Briganti, F.; Galdiero, M.; Tortora, F.; Caranci, F.; Cirillo, S.; Lombardi, G. Predictors of Tumor Shrinkage after Primary Therapy with Somatostatin Analogs in Acromegaly: A Prospective Study in 99 Patients. J. Clin. Endocrinol. Metab. 2006, 91, 2112–2118. [Google Scholar] [CrossRef]
- Hassan, R.M.A.; Almalki, Y.E.; Basha, M.A.A.; Alduraibi, S.K.; Hassan, A.H.; Aboualkheir, M.; Almushayti, Z.A.; Alduraibi, A.K.; Amer, M.M.; Basha, A.M.A.; et al. Predicting the Consistency of Pituitary Macroadenomas: The Utility of Diffusion-Weighted Imaging and Apparent Diffusion Coefficient Measurements for Surgical Planning. Diagnostics 2024, 14, 493. [Google Scholar] [CrossRef] [PubMed]
- Solari, D.; Cavallo, L.M.; Graziadio, C.; Corvino, S.; Bove, I.; Esposito, F.; Cappabianca, P. Giant Non-Functioning Pituitary Adenomas: Treatment Considerations. Brain Sci. 2022, 12, 1256. [Google Scholar] [CrossRef]
- Banskota, S.; Adamson, D.C. Pituitary Adenomas: From Diagnosis to Therapeutics. Biomedicines 2021, 9, 494. [Google Scholar] [CrossRef] [PubMed]
- Giardina, G.; Micko, A.; Bovenkamp, D.; Krause, A.; Placzek, F.; Papp, L.; Krajnc, D.; Spielvogel, C.P.; Winklehner, M.; Höftberger, R.; et al. Morpho-Molecular Metabolic Analysis and Classification of Human Pituitary Gland and Adenoma Biopsies Based on Multimodal Optical Imaging. Cancers 2021, 13, 3234. [Google Scholar] [CrossRef]
- Cappabianca, P.; Alfieri, A.; Colao, A.; Ferone, D.; Lombardi, G.; de Divitiis, E. Endoscopic Endonasal Transsphenoidal Approach: An Additional Reason in Support of Surgery in the Management of Pituitary Lesions. Skull Base Surg. 1999, 9, 109–117. [Google Scholar] [CrossRef] [PubMed]
- Toumi, E.; Almairac, F.; Mondot, L.; Themelin, A.; Decoux-Poullot, A.-G.; Paquis, P.; Chevalier, N.; Baillif, S.; Nahon-Esteve, S.; Martel, A. Benefit of Optical Coherence Tomography–Angiography in Patients Undergoing Transsphenoidal Pituitary Adenoma Surgery: A Prospective Controlled Study. Diagnostics 2024, 14, 1747. [Google Scholar] [CrossRef]
- Monteiro, M.L.R.; Leal, B.C.; Rosa, A.a.M.; Bronstein, M.D. Optical Coherence Tomography Analysis of Axonal Loss in Band Atrophy of the Optic Nerve. Br. J. Ophthalmol. 2004, 88, 896–899. [Google Scholar] [CrossRef]
- Jacob, M.; Raverot, G.; Jouanneau, E.; Borson-Chazot, F.; Perrin, G.; Rabilloud, M.; Tilikete, C.; Bernard, M.; Vighetto, A. Predicting Visual Outcome after Treatment of Pituitary Adenomas with Optical Coherence Tomography. Am. J. Ophthalmol. 2009, 147, 64–70.e2. [Google Scholar] [CrossRef]
- Menon, S.; Nair, S.; Kodnani, A.; Hegde, A.; Nayak, R.; Menon, G. Retinal Nerve Fiber Layer Thickness and Its Correlation with Visual Symptoms and Radiological Features in Pituitary Macroadenoma. J. Neurosci. Rural Pract. 2023, 14, 41–47. [Google Scholar] [CrossRef] [PubMed]
- Frishman, L.; Sustar, M.; Kremers, J.; McAnany, J.J.; Sarossy, M.; Tzekov, R.; Viswanathan, S. ISCEV Extended Protocol for the Photopic Negative Response (PhNR) of the Full-Field Electroretinogram. Doc. Ophthalmol. 2018, 136, 207–211. [Google Scholar] [CrossRef]
- Johansson, C.; Lindblom, B. The Role of Optical Coherence Tomography in the Detection of Pituitary Adenoma. Acta. Ophthalmol. 2009, 87, 776–779. [Google Scholar] [CrossRef] [PubMed]
- Moon, C.H.; Hwang, S.C.; Ohn, Y.-H.; Park, T.K. The Time Course of Visual Field Recovery and Changes of Retinal Ganglion Cells after Optic Chiasmal Decompression. Investig. Ophthalmol. Vis. Sci. 2011, 52, 7966–7973. [Google Scholar] [CrossRef]
- Ventura, L.M.; Venzara, F.X.; Porciatti, V. Reversible dysfunction of retinal ganglion cells in non-secreting pituitary tumors. Doc. Ophthalmol. 2009, 118, 155–162. [Google Scholar] [CrossRef]
- Kurian, D.E.; V, R.; Horo, S.; Chacko, A.G.; Prabhu, K.; Mahasampath, G.; Korah, S. Predictive Value of Retinal Nerve Fibre Layer Thickness for Postoperative Visual Improvement in Patients with Pituitary Macroadenoma. BMJ Open Ophthalmol. 2022, 7, e000964. [Google Scholar] [CrossRef] [PubMed]
- Danesh-Meyer, H.V.; Yoon, J.J.; Lawlor, M.; Savino, P.J. Visual Loss and Recovery in Chiasmal Compression. Prog. Retin. Eye Res. 2019, 73, 100765. [Google Scholar] [CrossRef]
- Park, Y.G.; Park, C.K.; Jung, K.I. Impact of Myopia on the Utility of the Photopic Negative Response Ratio for Glaucoma Assessment. J. Clin. Med. 2025, 14, 682. [Google Scholar] [CrossRef]
- Raharja, A.; Leo, S.M.; Chow, I.; Indusegaran, M.; Hammond, C.J.; Mahroo, O.A.; Wong, S.H. Exploratory Study of the Association between the Severity of Idiopathic Intracranial Hypertension and Electroretinogram Photopic Negative Response Amplitude Obtained Using a Handheld Device. Life 2021, 11, 437. [Google Scholar] [CrossRef]
- Barbano, L.; Ziccardi, L.; Antonelli, G.; Nicoletti, C.G.; Landi, D.; Mataluni, G.; Falsini, B.; Marfia, G.A.; Centonze, D.; Parisi, V. Multifocal Electroretinogram Photopic Negative Response: A Reliable Paradigm to Detect Localized Retinal Ganglion Cells’ Impairment in Retrobulbar Optic Neuritis Due to Multiple Sclerosis as a Model of Retinal Neurodegeneration. Diagnostics 2022, 12, 1156. [Google Scholar] [CrossRef]
- Lee, G.-I.; Park, K.-A.; Lee, D.; Oh, S.Y.; Kong, D.-S.; Hong, S.D. Predicting Visual Outcomes after Decompression of Pituitary Tumours Based on Stratified Inner-Retinal Layer Thickness and Age. Acta. Ophthalmol. 2023, 101, 301–309. [Google Scholar] [CrossRef] [PubMed]
- Yum, H.R.; Park, S.H.; Park, H.-Y.L.; Shin, S.Y. Macular Ganglion Cell Analysis Determined by Cirrus HD Optical Coherence Tomography for Early Detecting Chiasmal Compression. PLoS ONE 2016, 11, e0153064. [Google Scholar] [CrossRef] [PubMed]
- Guo, X.; Chen, J.; Zhang, Z.; Wan, X.; Shu, K.; Lei, T. Surgical Treatment of Cystic Pituitary Prolactin-Secreting Macroadenomas: A Single Center Study of 42 Patients. Brain Sci. 2022, 12, 699. [Google Scholar] [CrossRef] [PubMed]
- Tritos, N.A.; Miller, K.K. Diagnosis and Management of Pituitary Adenomas: A Review. JAMA 2023, 329, 1386–1398. [Google Scholar] [CrossRef]
- Ntali, G.; Wass, J.A. Epidemiology, Clinical Presentation and Diagnosis of Non-Functioning Pituitary Adenomas. Pituitary 2018, 21, 111–118. [Google Scholar] [CrossRef]
- Spina, A.; Losa, M.; Mortini, P. Pituitary Adenomas in Elderly Patients: Clinical and Surgical Outcome Analysis in a Large Series. Endocrine 2019, 65, 637–645. [Google Scholar] [CrossRef]
- Agustsson, T.T.; Baldvinsdottir, T.; Jonasson, J.G.; Olafsdottir, E.; Steinthorsdottir, V.; Sigurdsson, G.; Thorsson, A.V.; Carroll, P.V.; Korbonits, M.; Benediktsson, R. The Epidemiology of Pituitary Adenomas in Iceland, 1955-2012: A Nationwide Population-Based Study. Eur. J. Endocrinol. 2015, 173, 655–664. [Google Scholar] [CrossRef]
- Chanson, P.; Wolf, P. Clinically Non-Functioning Pituitary Adenomas. Presse Med. 2021, 50, 104086. [Google Scholar] [CrossRef]
- Sarnat-Kucharczyk, M.; Pojda-Wilczek, D.; Mrukwa-Kominek, E.; Kos-Kudła, B. Significant Improvement of Ganglion Cell Complex in Optical Coherence Tomography and Photopic Negative Response in Electroretinography after Transsphenoidal Resection of Pituitary Macroadenoma. Endokrynol. Pol. 2024, 75, 558–559. [Google Scholar] [CrossRef]
- Lachowicz, E.; Lubiński, W. The Importance of the Electrophysiological Tests in the Early Diagnosis of Ganglion Cells and/or Optic Nerve Dysfunction Coexisting with Pituitary Adenoma: An Overview. Doc. Ophthalmol. 2018, 137, 193–202. [Google Scholar] [CrossRef]
- Sun, M.; Zhang, H.; Chen, X.; Zhang, Q. Quantitative Analysis of Macular Retina Using Light Reflection Indices Derived from SD-OCT for Pituitary Adenoma. J. Ophthalmol. 2020, 2020, 8896114. [Google Scholar] [CrossRef]
- Han, K.E.; Choi, H.; Kim, S.-J.; Lee, S.M.; Lee, J.-E. Clinical Efficacy of Optical Coherence Tomography Parameters to Predict the Visual Field Outcome Following Pituitary Adenoma Surgery. PLoS ONE 2024, 19, e0313521. [Google Scholar] [CrossRef]
- Jørstad, Ø.K.; Wigers, A.R.; Marthinsen, P.B.; Moe, M.C.; Evang, J.A. Loss of Horizontal Macular Ganglion Cell Complex Asymmetry: An Optical Coherence Tomography Indicator of Chiasmal Compression. BMJ Open Ophthalmol. 2018, 3, e000195. [Google Scholar] [CrossRef]
- Batur, M.; Özer, M.D.; Üçler, R.; Seven, E.; Tekin, S.; Ünal, F. Corneal Parameters, Ocular Biometers, and Retinal and Choroidal Thickness in Acromegaly Patients. Photodiagn. Photodyn. Ther. 2023, 44, 103773. [Google Scholar] [CrossRef]
- Soh, Z.-D.; Yu, M.; Chen, Y.; Thakur, S.; Lavanya, R.; Tham, Y.C.; Koh, V.; Aung, T.; Cheng, C.-Y. Physiological Change in Ganglion Cell Inner Plexiform Layer and Nerve Fibre Layer Thickness over Six Years. Clin. Exp. Ophthalmol. 2025. ahead of print. [Google Scholar] [CrossRef]
- Cennamo, G.; Auriemma, R.S.; Cardone, D.; Grasso, L.F.S.; Velotti, N.; Simeoli, C.; Di Somma, C.; Pivonello, R.; Colao, A.; de Crecchio, G. Evaluation of the Retinal Nerve Fibre Layer and Ganglion Cell Complex Thickness in Pituitary Macroadenomas without Optic Chiasmal Compression. Eye 2015, 29, 797–802. [Google Scholar] [CrossRef]
- Sun, M.; Zhang, Z.; Ma, C.; Chen, S.; Chen, X. Quantitative Analysis of Retinal Layers on Three-Dimensional Spectral-Domain Optical Coherence Tomography for Pituitary Adenoma. PLoS ONE 2017, 12, e0179532. [Google Scholar] [CrossRef]
- Bekollari, M.; Dettoraki, M.; Stavrou, V.; Glotsos, D.; Liaparinos, P. Computer-Aided Discrimination of Glaucoma Patients from Healthy Subjects Using the RETeval Portable Device. Diagnostics 2024, 14, 349. [Google Scholar] [CrossRef]
- Constable, P.A.; Pinzon-Arenas, J.O.; Mercado Diaz, L.R.; Lee, I.O.; Marmolejo-Ramos, F.; Loh, L.; Zhdanov, A.; Kulyabin, M.; Brabec, M.; Skuse, D.H.; et al. Spectral Analysis of Light-Adapted Electroretinograms in Neurodevelopmental Disorders: Classification with Machine Learning. Bioengineering 2024, 12, 15. [Google Scholar] [CrossRef]
- Moon, C.H.; Hwang, S.C.; Kim, B.-T.; Ohn, Y.-H.; Park, T.K. Visual Prognostic Value of Optical Coherence Tomography and Photopic Negative Response in Chiasmal Compression. Investig. Ophthalmol. Vis. Sci. 2011, 52, 8527–8533. [Google Scholar] [CrossRef]
- Iqbal, M.; Irfan, S.; Goyal, J.L.; Singh, D.; Singh, H.; Dutta, G. An Analysis of Retinal Nerve Fiber Layer Thickness before and after Pituitary Adenoma Surgery and Its Correlation with Visual Acuity. Neurol. India 2020, 68, 346–351. [Google Scholar] [CrossRef]

| Group | NFPAs | Prolactinoma (PRL) | ACTH-Secreting Tumor | GH-Secreting Tumor | Row Total |
|---|---|---|---|---|---|
| Treatment | 14 | 9 | 2 | 2 | 27 |
| % Row | 51.85% | 33.33% | 7.41% | 7.41% | - |
| % of Total | 35.00% | 22.50% | 5.00% | 5.00% | 67.50% |
| Observation | 13 | 0 | 0 | 0 | 13 |
| % Row | 100.00% | 0.00% | 0.00% | 0.00% | - |
| % of Total | 32.50% | 0.00% | 0.00% | 0.00% | 32.50% |
| Total | 27 | 9 | 2 | 2 | 40 |
| % of Total | 67.50% | 22.50% | 5.00% | 5.00% | 100.00% |
| Group | Male | Female |
|---|---|---|
| Treatment | 15 | 12 |
| % | 55.56% | 44.44% |
| Observation | 2 | 11 |
| % of Row | 15.38% | 84.62% |
| Total | 17 | 23 |
| % of Total | 42.50% | 57.50% |
| Group | Surgery Yes | Surgery No | Row Total |
|---|---|---|---|
| Treatment | 20 Within:
| PRL-7 (dopamine agonists: cabergoline bromocriptine) | 27 |
| % of Row | 74.07% | 25.93% | |
| Observation | 0 | 13 | 13 |
| % of Row | 0.00% | 100.00% |
| Distant Snellen BCVA | At Baseline Mean (SD) | After 12 Months Mean (SD) | p-Value |
|---|---|---|---|
| Treatment group | 0.868 (0.270) | 0.966 (0.137) | 0.0233 |
| Observation group | 0.904 (0.216) | 0.915 (0.201) | 0.524 |
| Variable | Group (Treatment/ Observation) | Baseline (0 Months) Median | Baseline (0 Months) IQR (Q1–Q3) | After 12 Months Median | After 12 Months IQR (Q1–Q3) | p-Value (Between 0 & 12 Months)—Important Values |
|---|---|---|---|---|---|---|
| GCIPL Average | Treatment | 76 | (70–78) | 74.5 | (69–79) | p ** = 0.0646 |
| Observation | 77 | (71–81) | 76 | (72–82) | ||
| GCIPL Superior | Treatment | 75 | (70–81) | 73 | (67–81) | |
| Observation | 76.5 | (74.5–83) | 76 | (74–83) | ||
| GCIPL Nasal Superior | Treatment | 75 | (66–80) | 73.5 | (65–79) | |
| Observation | 78 | (68–83) | 77 | (67–83) | ||
| GCIPL Nasal Inferior | Treatment | 75 | (65–79) | 72 | (65–80) | |
| Observation | 77 | () | 77 | () | ||
| GCIPL Inferior | Treatment | 75 | (68–77) | 73 | (68–76) | |
| Observation | 76.5 | (72–80) | 75.5 | (71–79.5) | p * = 0.0470 | |
| GCIPL Temporal Inferior | Treatment | 78 | (74–81) | 78 | (72–80) | p ** = 0.0891 |
| Observation | 79 | (72–84) | 79 | (72–84) | ||
| GCIPL Temporal Superior | Treatment | 77 | (72–81) | 76 | (72–80) | p ** = 0.0542 |
| Observation | 79 | (75–81) | 78 | (74–82) | ||
| RNFL Average | Treatment | 87 | (81–95) | 84 | (81–91) | p * = 0.0024 |
| Observation | 83 | (79–93) | 84 | (78–91) | ||
| RNFL Superior | Treatment | 110 | (100–119) | 106.5 | (96–118) | p * = 0.0073 |
| Observation | 105 | (97–112) | 104.5 | (99.5–112.5) | ||
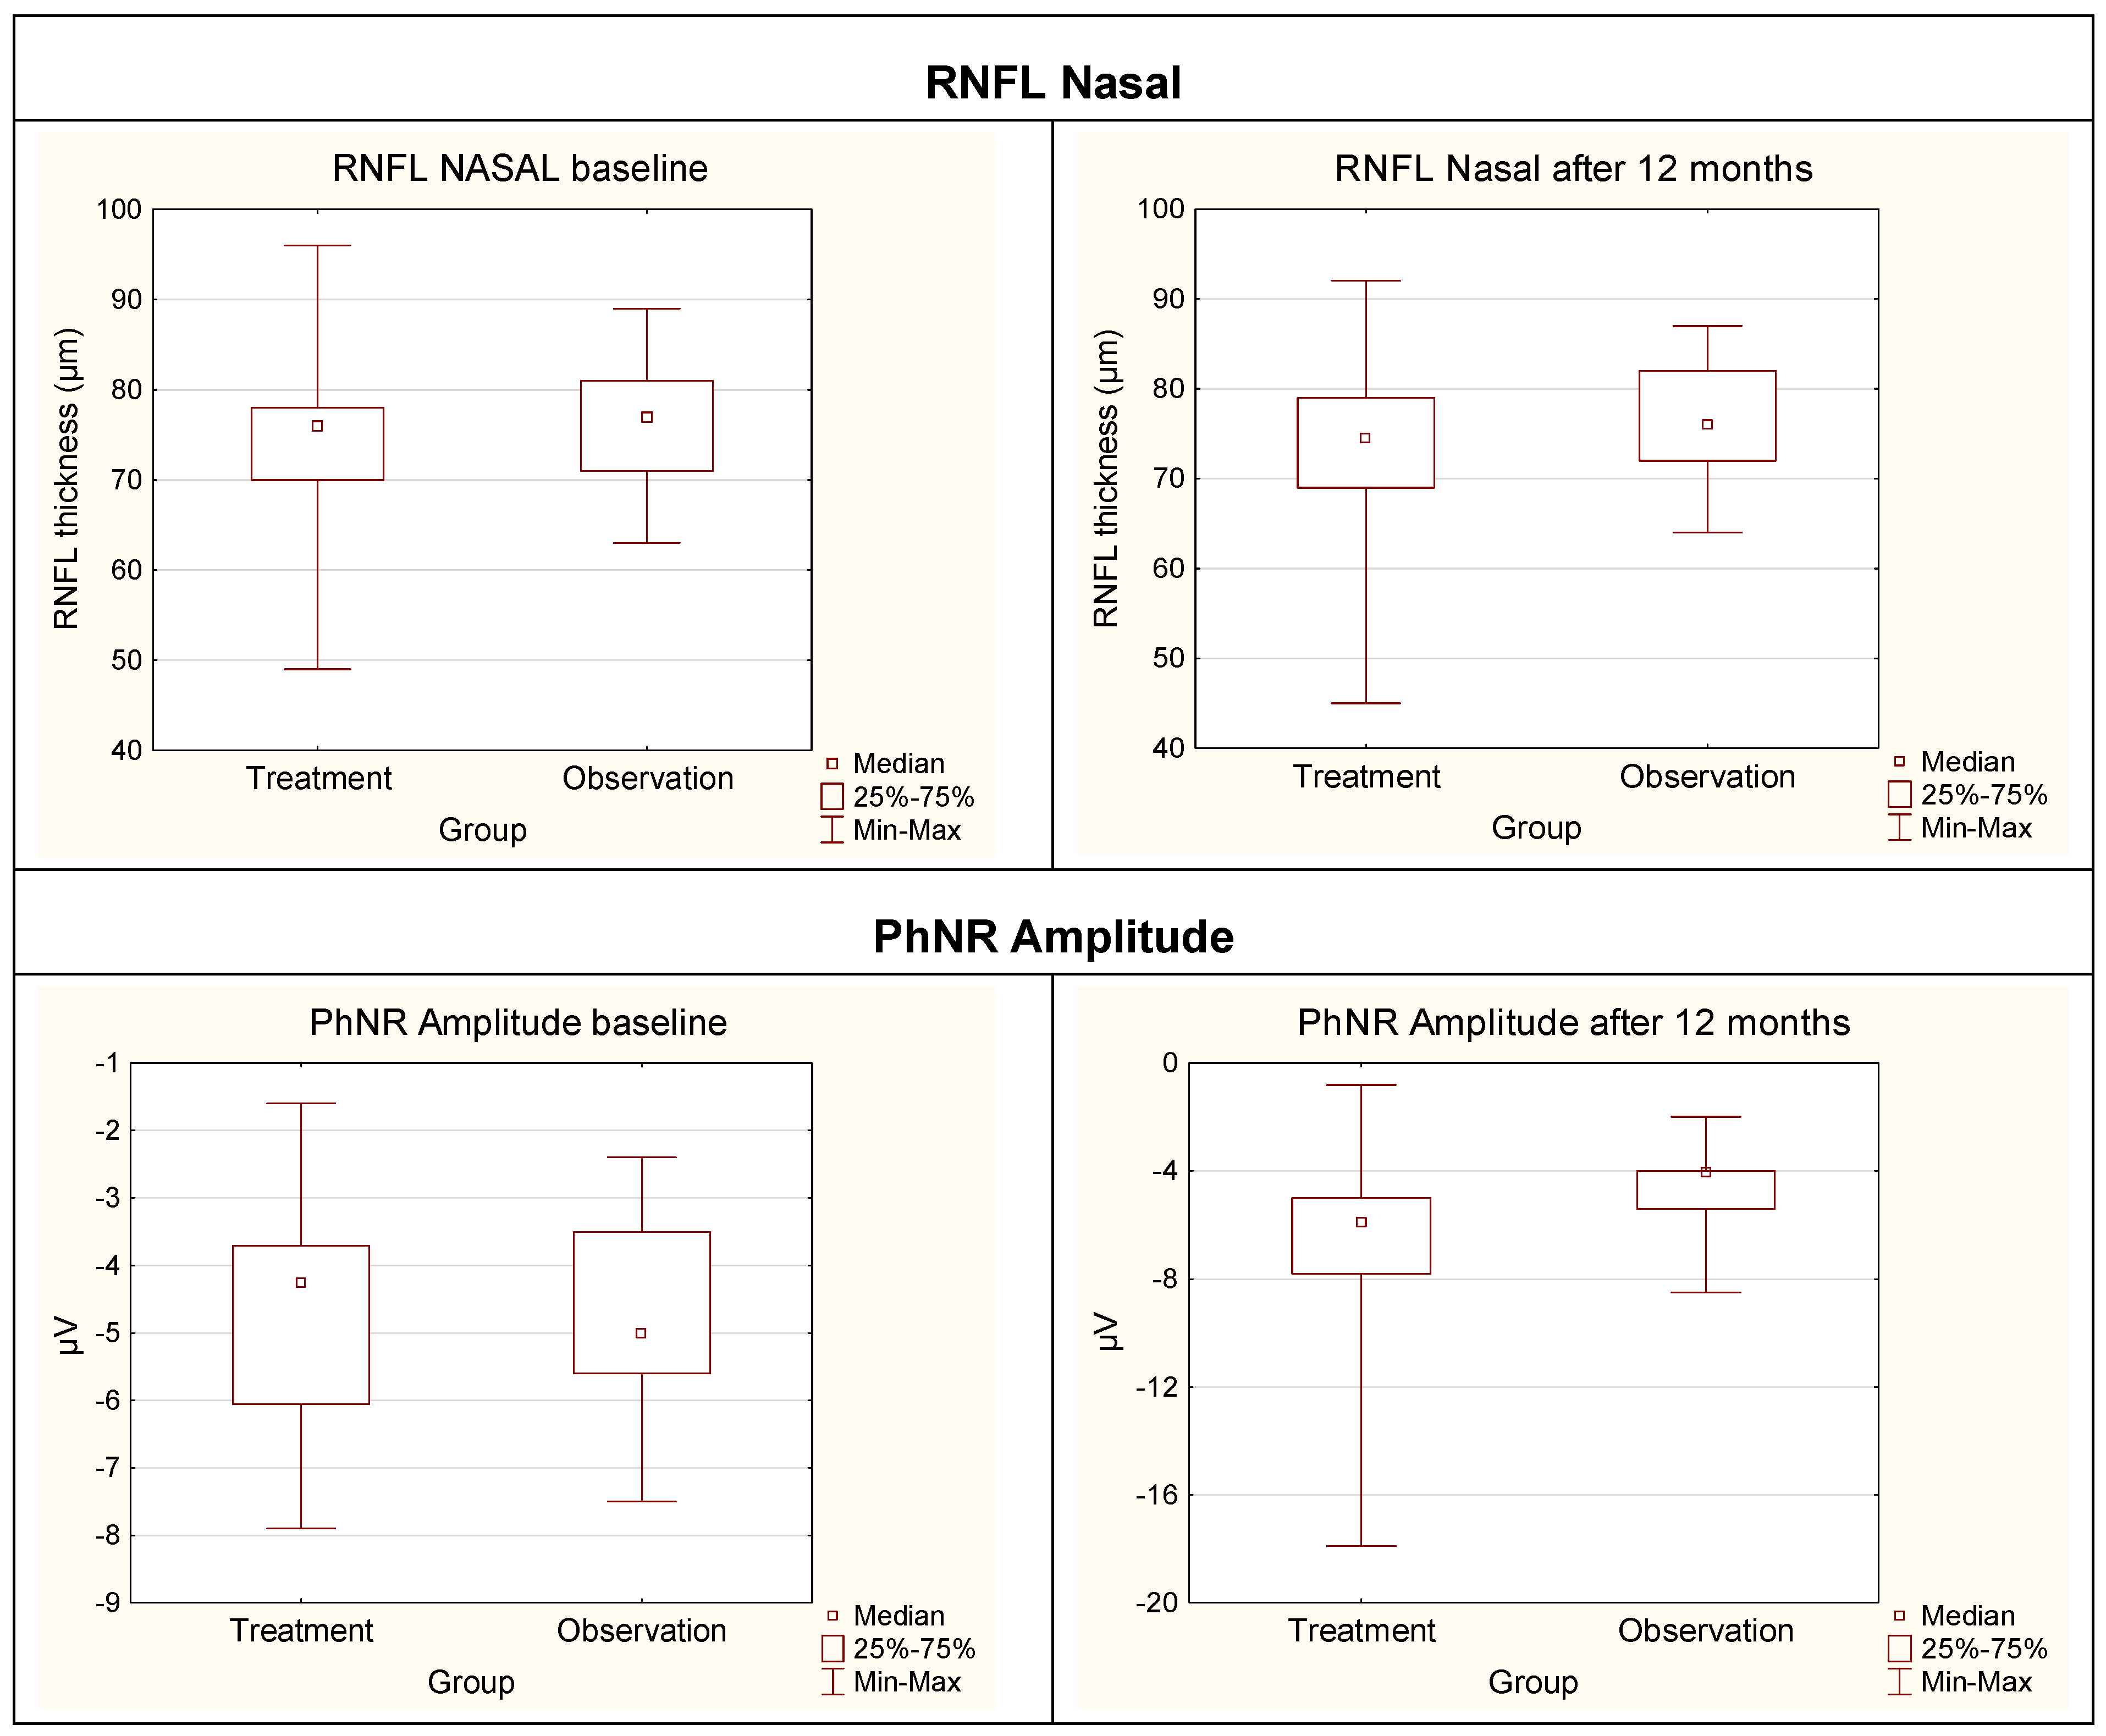
| RNFL Nasal | Treatment | 72 | (66–79) | 68 | (62–78) | p * = 0.0023 |
| Observation | 64 | (58–71) | 64 | (58.5–70) | ||
| RNFL Inferior | Treatment | 114.5 | (99–126) | 109.5 | (100–121) | p * = 0.0004 |
| Observation | 114 | (100–126) | 115 | (104–125) | ||
| RNFL Temporal | Treatment | 58 | (50–64) | 57 | (47–62) | |
| Observation | 55 | (50–69) | 58 | (51–72) | ||
| PhNR Amplitude | Treatment | −4.3 | (−6.1 to −3.7) | −5.9 | (−7.8 to −5) | p * < 0.0001 |
| Observation | −5/.0 | (−5.6 to −3.5) | −4.1 | (−5.4 to 4) | ||
| W-ratio | Treatment | 0.91 | (0.86–0.98) | 1.10 | (1.03–0.15) | p * < 0.0001 |
| Observation | 0.90 | (0.87–0.95) | 1.00 | (0.95–1.04) | p = 0.0015 |
| Variable Pair | R Spearman | p-Value |
|---|---|---|
| Treatment Group | ||
| GCIPL Inferior Temporal and PhNR W-ratio | 0.3095 | 0.0287 |
| GCIPL Superior Temporal and PhNR Amplitude | −0.2865 | 0.0415 |
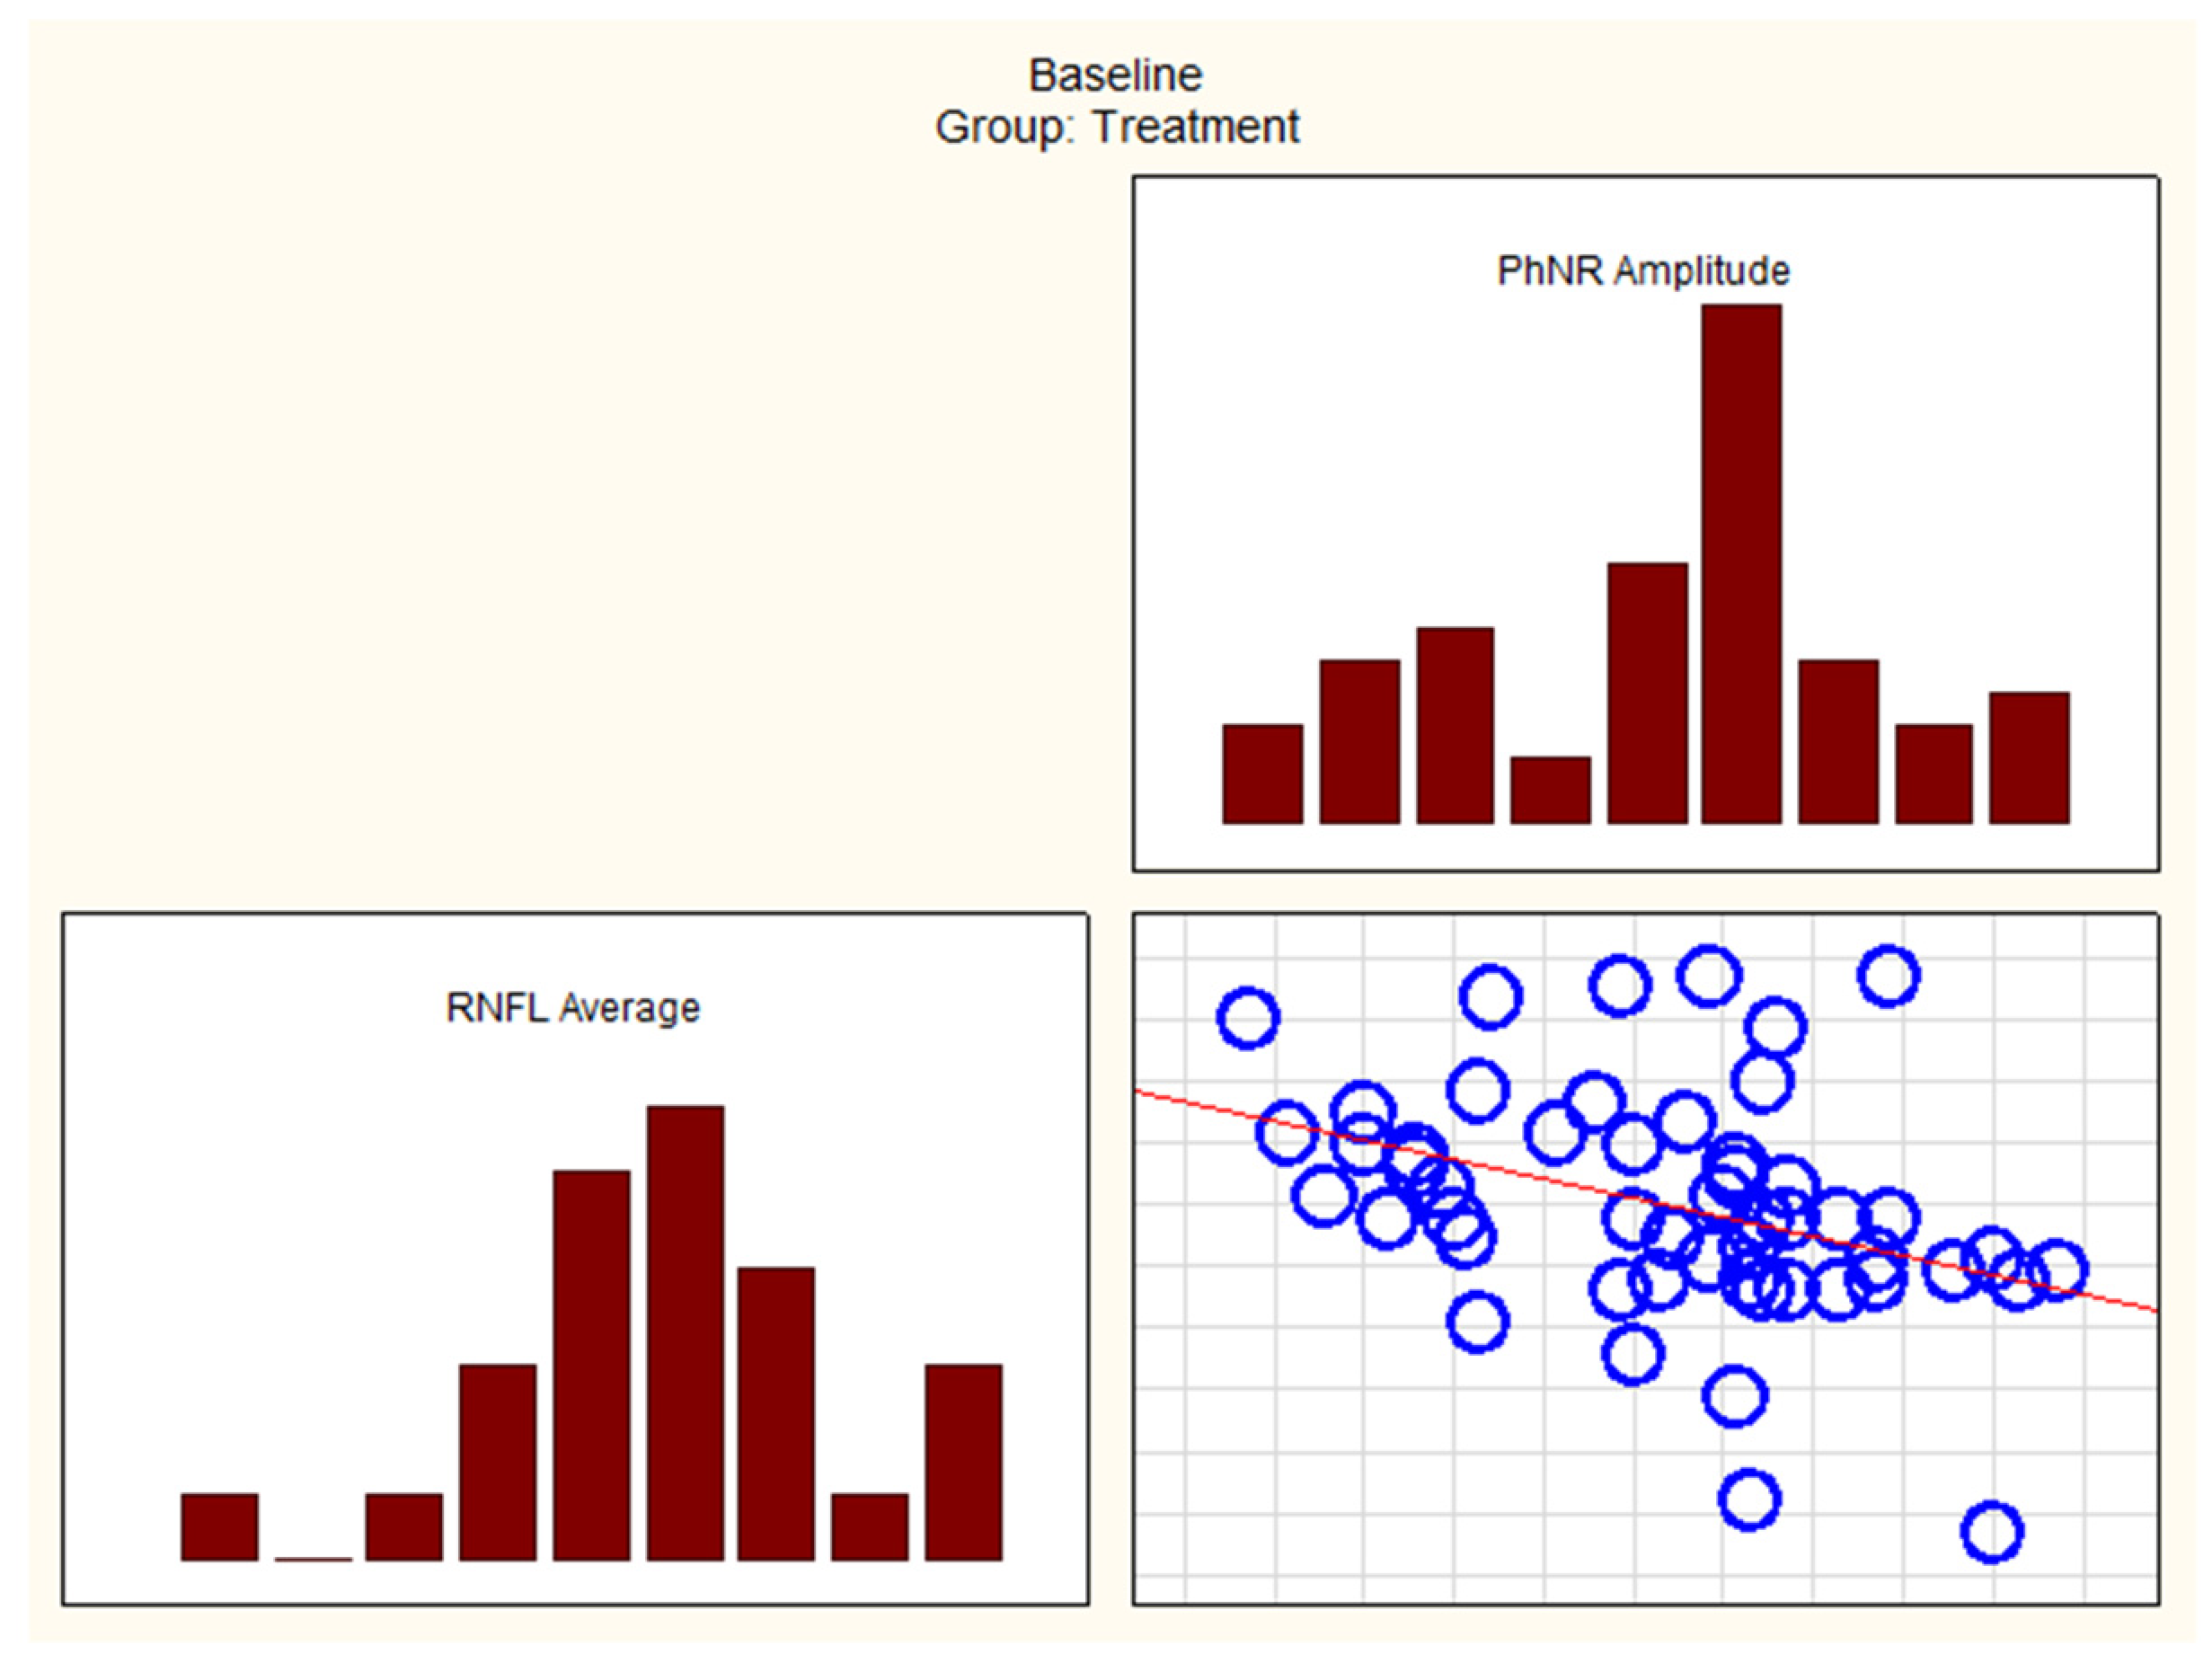
| RNFL Average and PhNR Amplitude | −0.4054 | 0.0032 |
| RNFL Superior and PhNR Amplitude | −0.3133 | 0.0237 |
| RNFL Nasal and PhNR Amplitude | −0.3655 | 0.0077 |
| RNFL Inferior and PhNR Amplitude | −0.3682 | 0.0072 |
| Observational Group | ||
| GCIPL Average and PhNR Amplitude | −0.39690 | 0.04947 |
| GCIPL Average and PhNR W-ratio | 0.63291 | 0.00068 |
| GCIPL Superior Nasal and PhNR Amplitude | −0.45932 | 0.02089 |
| GCIPL Superior Nasal and PhNR W-ratio | 0.71630 | 0.00005 |
| GCIPL Inferior Nasal and PhNR Amplitude | −0.54568 | 0.00478 |
| GCIPL Inferior Nasal and PhNR W-ratio | 0.72132 | 0.00047 |
| GCIPL Inferior and PhNR W-ratio | 0.63787 | 0.00079 |
| RNFL Inferior and PhNR W-ratio | 0.59098 | 0.00186 |
| RNFL Temporal and PhNR Amplitude | −0.45144 | 0.02349 |
| RNFL Temporal and PhNR W-ratio | 0.54597 | 0.00475 |
Disclaimer/Publisher’s Note: The statements, opinions and data contained in all publications are solely those of the individual author(s) and contributor(s) and not of MDPI and/or the editor(s). MDPI and/or the editor(s) disclaim responsibility for any injury to people or property resulting from any ideas, methods, instructions or products referred to in the content. |
© 2025 by the authors. Licensee MDPI, Basel, Switzerland. This article is an open access article distributed under the terms and conditions of the Creative Commons Attribution (CC BY) license (https://creativecommons.org/licenses/by/4.0/).
Share and Cite
Sarnat-Kucharczyk, M.; Pojda-Wilczek, D.; Mrukwa-Kominek, E.; Kos-Kudła, B.; Janik, M.A.; Janik, P. The Relationship Between the Ganglion Cell–Inner Plexiform Layer, Retinal Nerve Fiber Layer, and Photopic Negative Response in Newly Diagnosed Pituitary Macroadenoma: 12-Month Prospective Follow-Up Study. Cancers 2025, 17, 1542. https://doi.org/10.3390/cancers17091542
Sarnat-Kucharczyk M, Pojda-Wilczek D, Mrukwa-Kominek E, Kos-Kudła B, Janik MA, Janik P. The Relationship Between the Ganglion Cell–Inner Plexiform Layer, Retinal Nerve Fiber Layer, and Photopic Negative Response in Newly Diagnosed Pituitary Macroadenoma: 12-Month Prospective Follow-Up Study. Cancers. 2025; 17(9):1542. https://doi.org/10.3390/cancers17091542
Chicago/Turabian StyleSarnat-Kucharczyk, Monika, Dorota Pojda-Wilczek, Ewa Mrukwa-Kominek, Beata Kos-Kudła, Małgorzata A. Janik, and Paweł Janik. 2025. "The Relationship Between the Ganglion Cell–Inner Plexiform Layer, Retinal Nerve Fiber Layer, and Photopic Negative Response in Newly Diagnosed Pituitary Macroadenoma: 12-Month Prospective Follow-Up Study" Cancers 17, no. 9: 1542. https://doi.org/10.3390/cancers17091542
APA StyleSarnat-Kucharczyk, M., Pojda-Wilczek, D., Mrukwa-Kominek, E., Kos-Kudła, B., Janik, M. A., & Janik, P. (2025). The Relationship Between the Ganglion Cell–Inner Plexiform Layer, Retinal Nerve Fiber Layer, and Photopic Negative Response in Newly Diagnosed Pituitary Macroadenoma: 12-Month Prospective Follow-Up Study. Cancers, 17(9), 1542. https://doi.org/10.3390/cancers17091542