3.2. Descriptive Analysis in miRNA Expression
The analysis of the data presented in
Table 6 suggests location-specific differences in miRNA expression within colon cancer, with left-sided tumors exhibiting higher levels of miR-101-3p, miR-106a-5p, and miR-326 compared to right-sided tumors. Among these, miR-106a-5p shows the most pronounced difference, hinting at a potentially greater role in the pathogenesis or progression of left-sided colon cancer. These findings align with the growing recognition of molecular differences between left- and right-sided colon cancers, suggesting that these miRNAs could provide insights into tumor biology and serve as potential biomarkers or therapeutic targets.
However, statistical analysis using a two-sample t-test found no significant differences in the expression of miR-101-3p, miR-106a-5p, and miR-326 between tumor locations. The p-values for miR-101-3p (0.157), miR-106a-5p (0.293), and miR-326 (0.442) all exceed the 0.05 significance threshold, and the 95% confidence intervals include zero, indicating that the observed expression differences may result from random variation rather than a true biological distinction. Consequently, these miRNAs may not be reliable biomarkers for distinguishing left- and right-sided colon cancers. Future research with larger sample sizes or alternative analytical approaches may provide further clarity on their potential role in tumor biology and clinical applications.
The analysis of miRNA expression across different cancer grades, presented in
Table 7, suggests that miR-101-3p, miR-106a-5p, and miR-326 exhibit their highest expression levels in Grade 2 tumors. Specifically, miR-101-3p and miR-326 show a decline in expression in Grade 3, while miR-106a-5p peaks in Grade 2, indicating potential regulatory roles in intermediate-grade tumors. These patterns suggest that the involvement of these miRNAs in tumor biology may be more pronounced in earlier stages but diminishes as cancer progresses to higher grades.
However, statistical validation using one-way ANOVA for each miRNA indicates no significant differences in mean expression across cancer grades. The p-values for miR-101-3p (0.700), miR-106a-5p (0.728), and miR-326 (0.460) all exceed the 0.05 threshold, meaning the observed variations in expression levels may be due to random variation rather than a true biological distinction. The means comparison chart further confirms that the confidence intervals overlap, reinforcing the lack of statistically significant differences among the grades.
These findings suggest that, while the descriptive data indicate trends in miRNA expression across tumor grades, there is insufficient statistical evidence to conclude that these miRNAs play a grade-specific role in colon cancer progression. Future studies with larger sample sizes or alternative analytical approaches may be necessary to further investigate their potential significance in cancer grading and therapeutic applications.
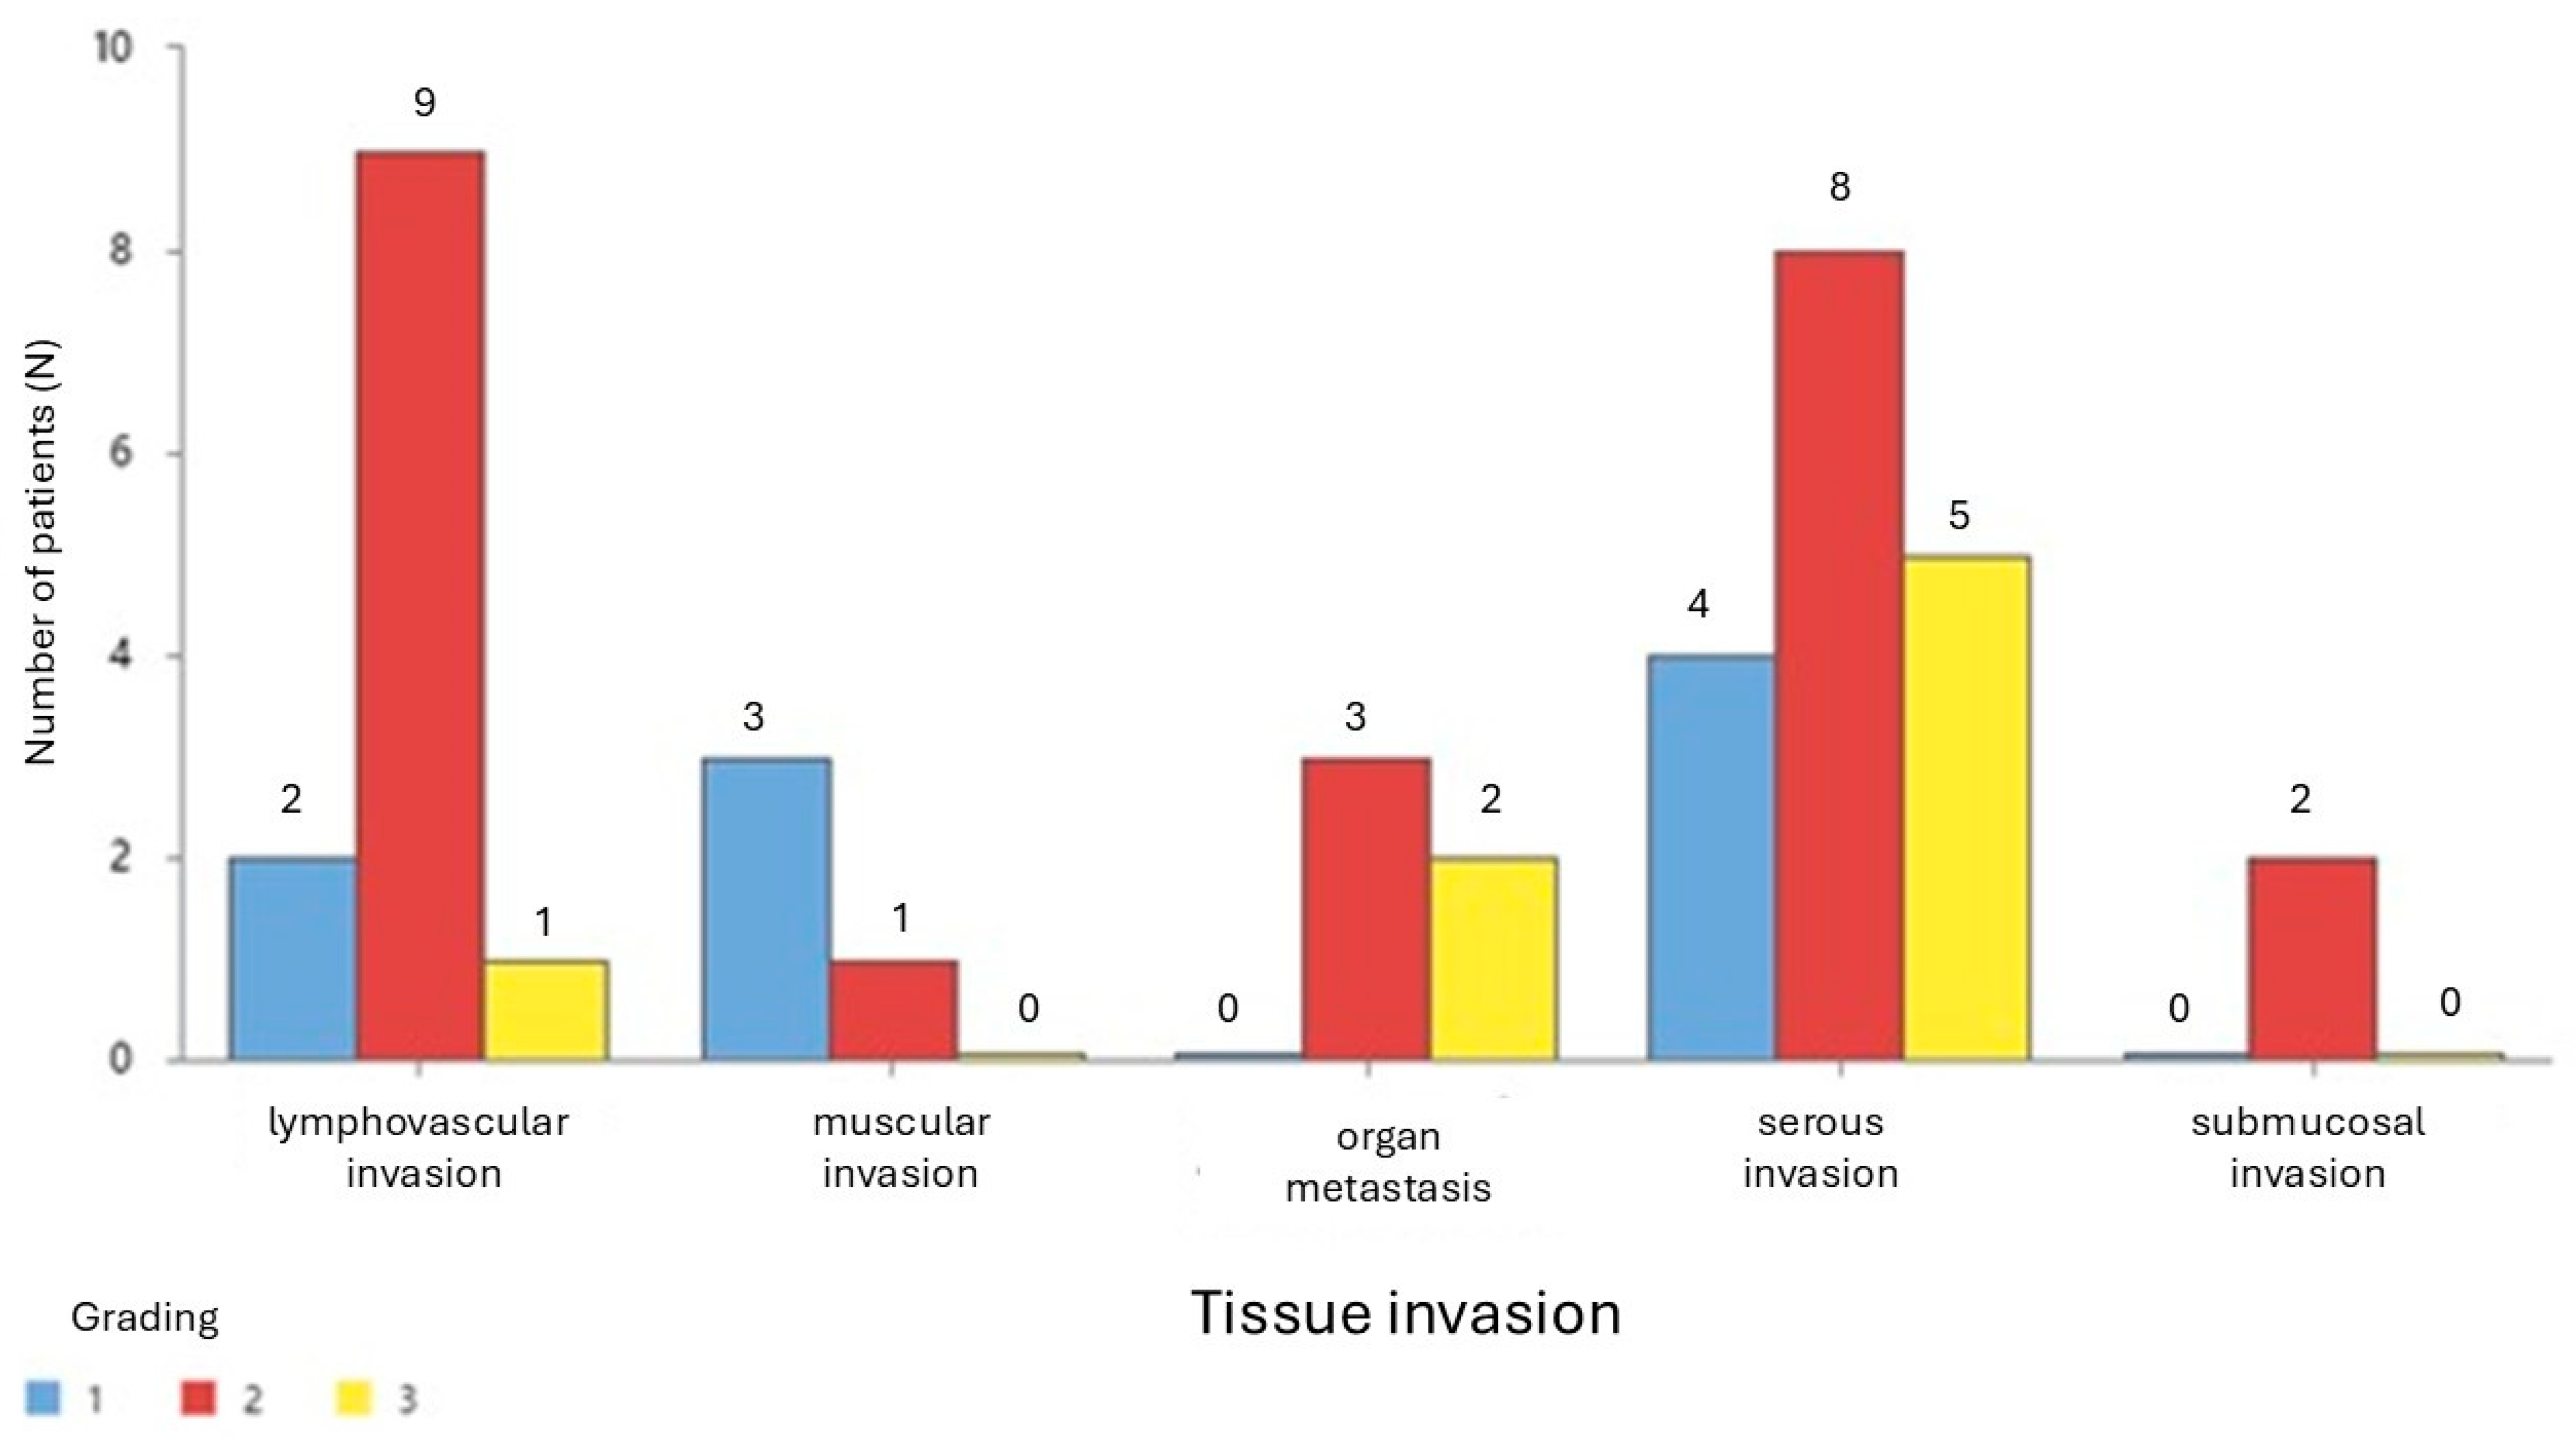
Table 8 presents the mean expression levels of miR-101-3p, miR-106a-5p, and miR-326 across different types of tissue invasion in colon cancer. miR-101-3p exhibits the highest expression in muscular invasion (mean = 1.113) and the lowest in submucosal invasion (mean = 0.1282), with a right-skewed distribution. miR-106a-5p is most expressed in lymphovascular invasion (mean = 1.547) but shows lower expression in other invasion types, with notable variability and skewness. miR-326 reaches its peak expression in organ metastasis (mean = 0.637) and shows lower levels in serous and submucosal invasion.
Notably, lymphovascular invasion demonstrates high variability and skewness for all three miRNAs, indicating a potential role in tumor progression. These findings highlight differences in miRNA expression across invasion types, suggesting their involvement in colon cancer progression and their possible relevance as biomarkers or therapeutic targets.
3.3. MiRNA Correlations in Cancer Grading and Invasion
Figure 2 presents the summary results of a multiple regression analysis performed to evaluate the relationship between miR-106a-5p expression (dependent variable) and miR-101-3p expression, while accounting for tumor grade as a factor representing tissue infiltration in colon cancer patients. The analysis indicates a statistically significant relationship between the dependent variable and the predictors included in the model (
p < 0.001). The model explains 81.42% of the variation in miR-106a-5p expression (R-squared = 81.42%), highlighting a strong predictive power of the selected variables. The fitted regression equation incorporates miR-101-3p (X1), grade (X2), and their interaction (X1*X2), which provides a more nuanced understanding of the interplay between these factors in influencing miR-106a-5p expression. The scatter plots below the summary table illustrate the distribution of miR-106a-5p against miR-101-3p and grade, respectively, showing the patterns of association. These findings underscore the potential regulatory link between miR-101-3p and miR-106a-5p, mediated by tumor infiltration stages, offering valuable insights into miRNA dynamics in colon cancer progression.
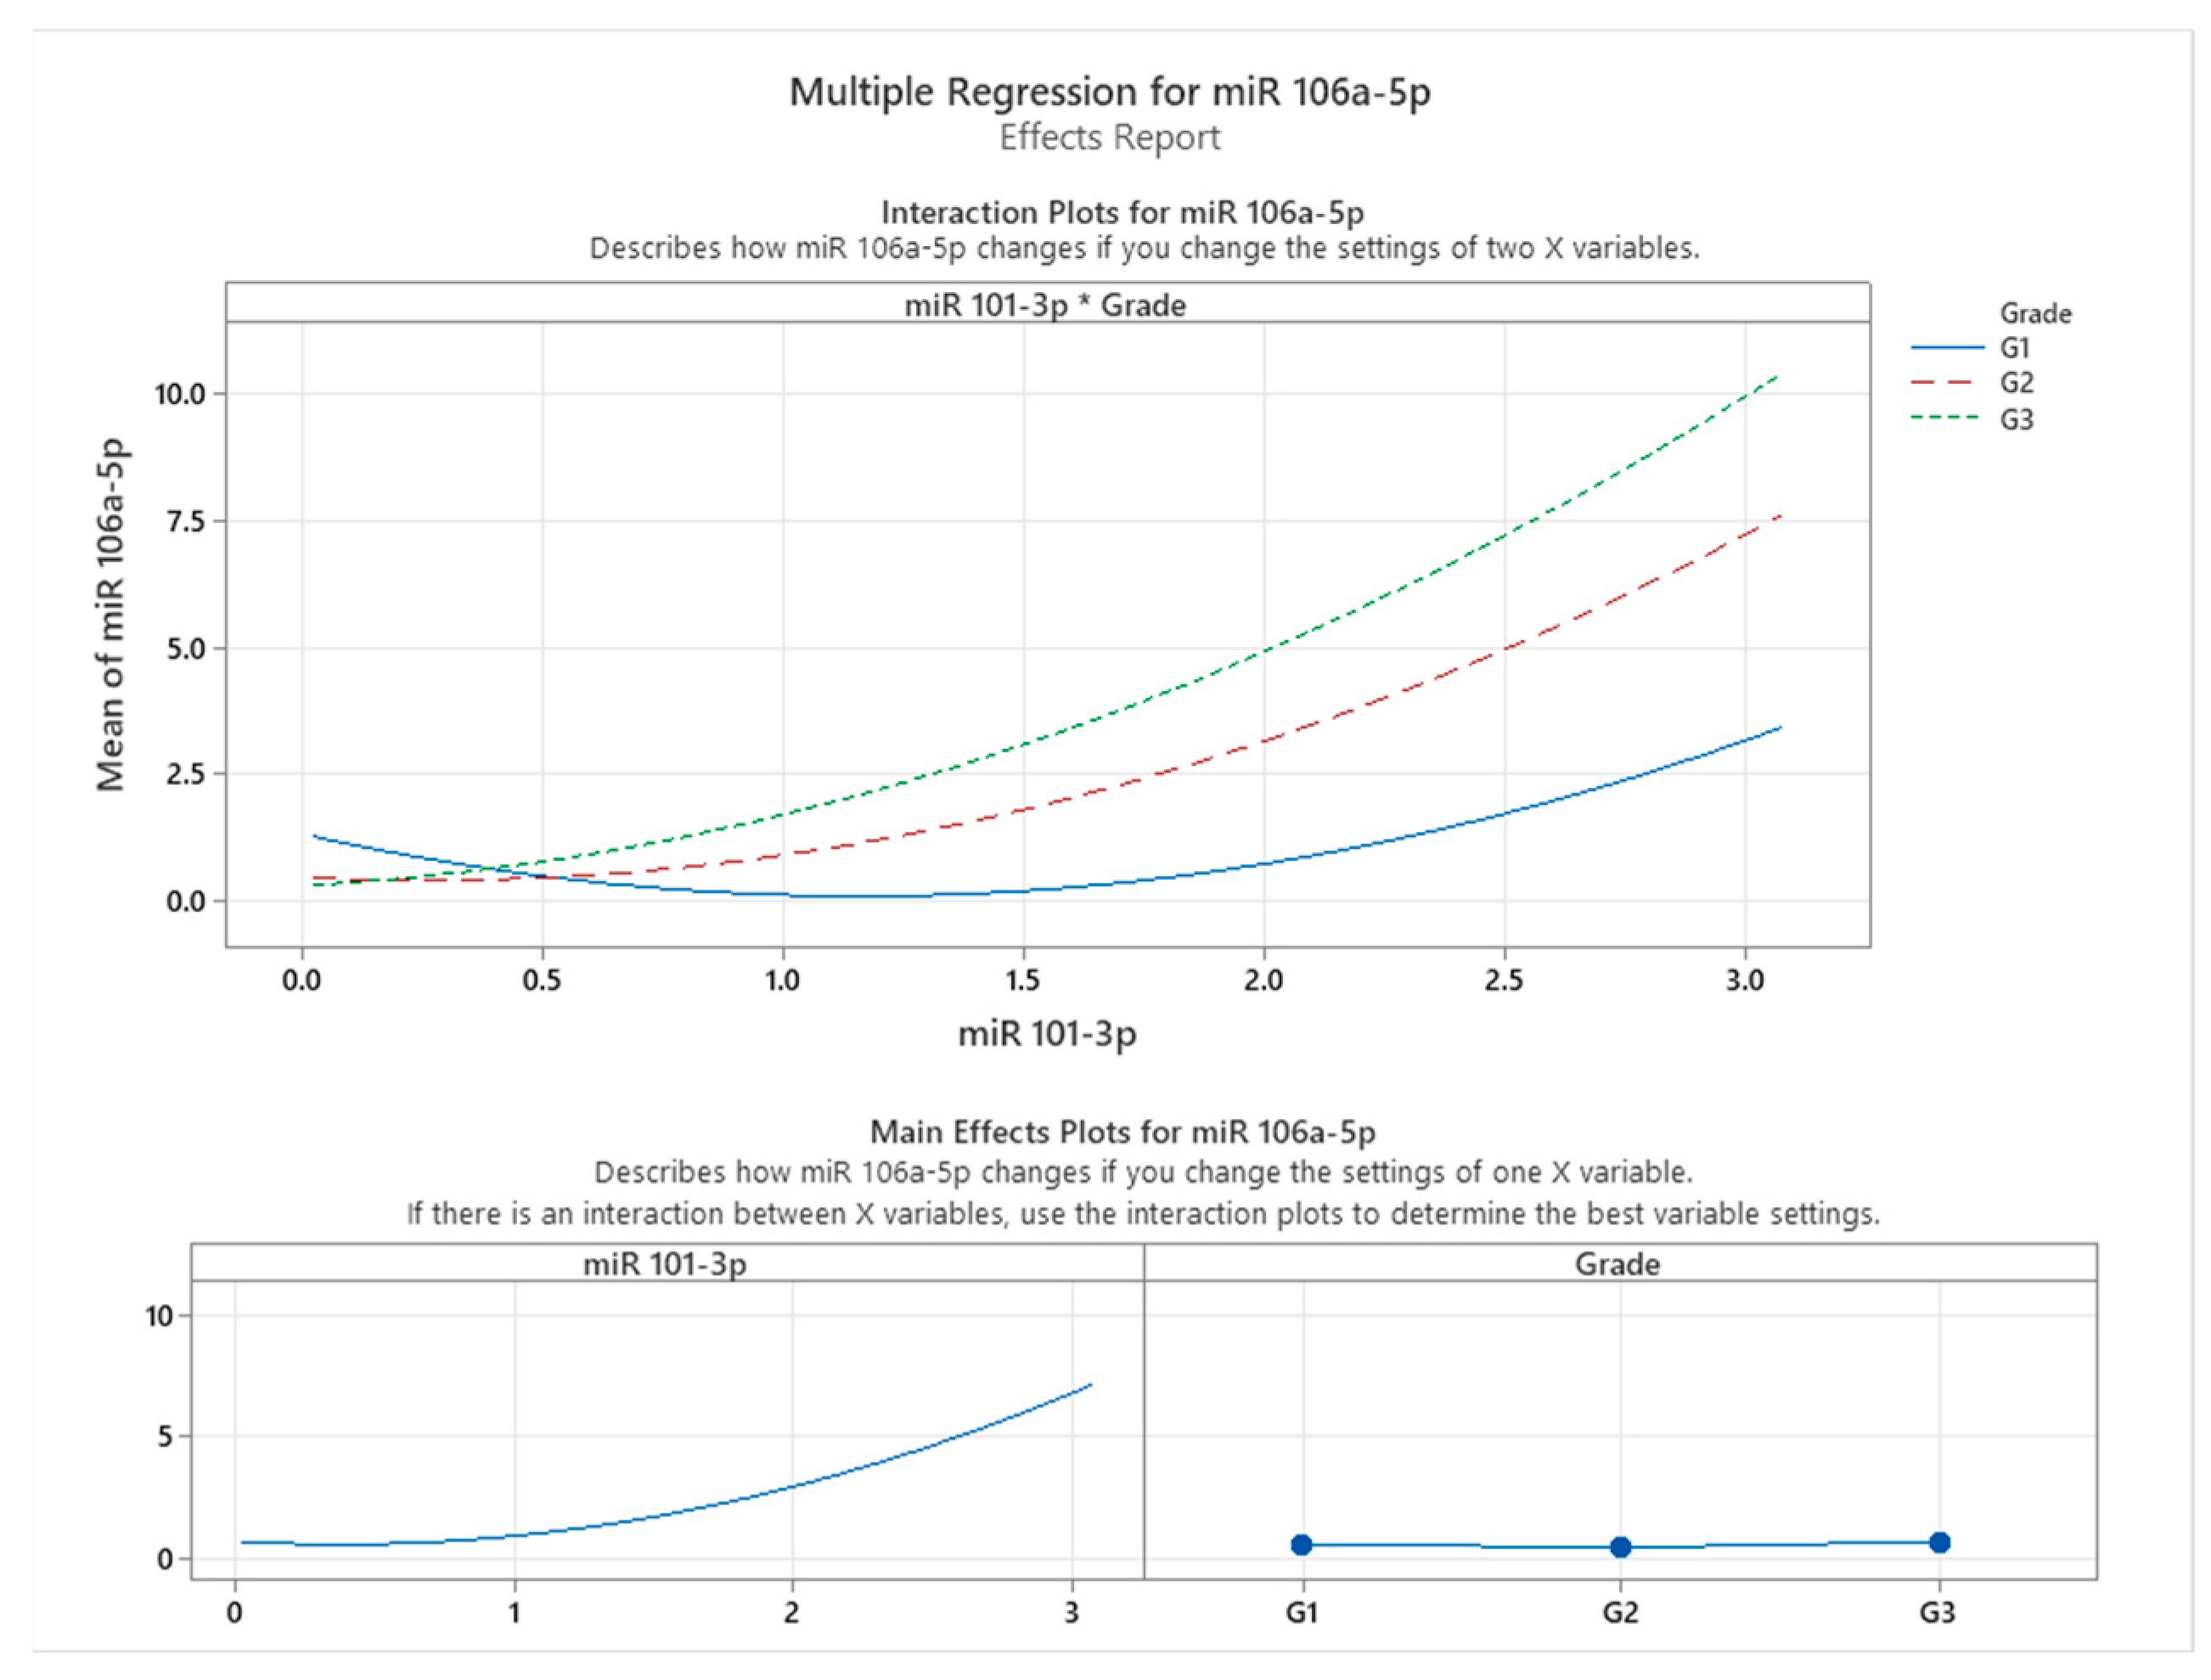
Figure 3 illustrates the effects and interaction plots for the multiple regression model assessing the influence of miR-101-3p expression and tumor grade on miR-106a-5p expression in colon cancer patients. The interaction plot at the top highlights how the relationship between miR-101-3p and miR-106a-5p varies across different tumor grades (G1, G2, and G3). A clear interaction effect is observed, as the slope of the relationship between miR-101-3p and miR-106a-5p becomes steeper with increasing tumor grade. Specifically, in patients with Grade G3 tumors, miR-106a-5p expression exhibits the highest sensitivity to changes in miR-101-3p levels, as indicated by the steepest curve, followed by G2 and G1 grades. This finding suggests that the regulatory effect of miR-101-3p on miR-106a-5p intensifies with more advanced tumor infiltration.
The main effects plots shown at the bottom further delineate the individual contributions of miR-101-3p and grade to miR-106a-5p expression. The plot for miR-101-3p demonstrates a non-linear relationship, where miR-106a-5p expression increases exponentially as miR-101-3p levels rise. Meanwhile, the grade plot indicates that higher tumor grades (G2 and G3) are associated with a marked increase in miR-106a-5p expression, reinforcing the hypothesis of tumor grade as a significant modulating factor in this relationship.
These findings indicate a significant correlation between miR-101-3p and miR-106a-5p expression, suggesting a potential association in colon cancer tissues. This relationship appears to vary with tumor grade, highlighting the complex interplay between miRNA expression patterns and cancer progression. While our results do not establish a direct regulatory mechanism, they suggest that miR-106a-5p expression is influenced by tumor characteristics and its association with miR-101-3p. These insights contribute to understanding the molecular dynamics of miRNA interactions in colon cancer and underscore the potential of miR-106a-5p as a biomarker for disease progression. Future studies are needed to determine whether this association has implications for targeted therapeutic strategies addressing miRNA networks at different cancer stages.
Figure 4 presents the results of a multiple regression analysis evaluating the influence of miR-326 expression and tissue invasion stage on miR-106a-5p expression. The model demonstrates a statistically significant relationship between the dependent variable (miR-106a-5p) and the predictors (miR-326 and tissue invasion), as evidenced by a
p-value of less than 0.001. The regression model explains 94.66% of the variation in miR-106a-5p expression (R-squared = 94.66%), indicating a robust predictive capability of the included variables.
The fitted regression equation incorporates miR-326 (X1), tissue invasion (X2), and their interaction term (X1*X2), signifying that the relationship between miR-326 and miR-106a-5p is modulated by the level of tissue invasion. The scatter plots at the bottom provide insights into the relationships among these variables. The plot on the left shows a non-linear trend, suggesting that higher levels of miR-326 expression are associated with increased miR-106a-5p levels. The plot on the right indicates distinct patterns in miR-106a-5p expression across different tissue invasion stages, with the highest expression observed in cases of serosa invasion.
These findings highlight a significant association between miR-326 and miR-106a-5p expression, particularly in relation to tissue invasion. However, this study does not establish a causal relationship between these miRNAs. The observed association varies across different stages of tissue invasion, with a stronger correlation in more advanced stages. This suggests that miR-326 and miR-106a-5p may be influenced by similar biological factors during invasive cancer progression. The high explanatory power of the model (94.66%) underscores the importance of these miRNAs in colon cancer dynamics, offering potential insights for stage-specific therapeutic research.
Figure 5 illustrates the interaction and main effects of miR-326 and tissue infiltration on the expression levels of miR-106a-5p, as assessed through multiple regression analysis. The interaction plot (top panel) highlights how the relationship between miR-326 and miR-106a-5p expression is modulated by different tissue invasion types. The varying slopes of the regression lines across tissue categories suggest that miR-106a-5p expression responds differently to miR-326 levels depending on the invasive environment. Notably, lymphovascular invasion and muscular invasion exhibit the steepest slopes, indicating a stronger positive correlation between miR-326 and miR-106a-5p expression. In contrast, organ metastasis, serous invasion, and submucosal invasion display flatter slopes, suggesting a weaker association between these two miRNAs in these contexts.
This differential expression pattern suggests that miR-326 levels are associated with miR-106a-5p expression, particularly in more aggressive invasion patterns, such as lymphovascular and muscular invasion. The variations in expression across different tissue invasion types indicate that additional biological factors may influence the relationship between these miRNAs. In submucosal and serous invasion, distinct expression dynamics suggest that alternative mechanisms may be at play, potentially affecting the observed association between miR-326 and miR-106a-5p.
The main effects plot (bottom panel) further corroborates these observations. A positive association between miR-326 and miR-106a-5p expression is consistently observed across the dataset. However, the variation in tissue invasion effects suggests that miR-106a-5p expression is influenced by multiple factors, including the invasion context. Among the tissue types analyzed, lymphovascular invasion exhibits the highest mean expression levels of miR-106a-5p, highlighting its potential involvement in vascular dissemination and metastatic progression.
These findings underscore the complex interplay between miRNA expression and the tumor microenvironment, emphasizing the necessity of context-specific analyses when investigating miRNA regulatory networks in colon cancer. The observed interaction between miR-326 and tissue-specific characteristics in association with miR-106a-5p expression suggests that these miRNAs may serve as potential biomarkers or therapeutic targets, particularly in invasion pathways associated with high metastatic risk.
Figure 6 summarizes the results of a multiple regression analysis aimed at understanding the relationship between miR-326 expression (Y) and two independent variables, miR-101-3p (X1) and tissue invasion (X2), including their interaction terms (X1
2 and X1*X2). The analysis reveals a statistically significant relationship between miR-326 and the predictors included in the model, as indicated by a
p-value < 0.001. This finding suggests that the model reliably explains variation in miR-326 expression based on the given predictors.
The regression model accounts for 87.30% of the variation in miR-326 expression, as demonstrated by the R-squared value, which is notably high. This indicates that the majority of the variance in miR-326 expression can be attributed to the combined effects of miR-101-3p, tissue invasion, and their interactions. The high explanatory power of the model underscores the strong relationship between these variables and miR-326 expression in the studied context of colon cancer.
The scatterplots in the bottom panel provide a visual representation of the relationship between miR-326 and its predictors. The scatterplot for miR-101-3p suggests a positive association, as higher levels of miR-101-3p correspond to increased expression of miR-326. However, the distribution of points appears to widen at higher values of miR-101-3p, which may indicate some degree of variability in this relationship that could be influenced by additional factors, such as tissue-specific characteristics. The scatterplot for tissue invasion reveals distinct clustering of data points based on the invasion type, suggesting that miR-326 expression varies according to the type of tissue infiltration. This further supports the hypothesis that tissue-specific factors play a crucial role in modulating miRNA expression in colon cancer.
Figure 7 presents the interaction and main effects of miR-101-3p and tissue invasion on the expression levels of miR-326, as derived from multiple regression analysis. The interaction plot reveals that the relationship between miR-101-3p and miR-326 expression is influenced by the type of tissue invasion. Specifically, the slope of miR-101-3p varies across different invasion types, with organ metastasis showing the steepest increase in miR-326 expression as miR-101-3p levels rise. This trend suggests that miR-326 expression is highly sensitive to changes in miR-101-3p in the context of organ metastasis, while other tissue types, such as submucosal invasion, show a much weaker or negligible association.
The main effects plot further confirms that miR-101-3p positively influences miR-326 expression in a consistent manner across all conditions, albeit with varying degrees depending on tissue invasion type. Tissue invasion itself also exhibits variability in its impact on miR-326 expression. Organ metastasis emerges as the invasion type most strongly associated with higher miR-326 levels, followed by lymphovascular invasion, while muscular and submucosal invasion show minimal effects. This underscores the differential regulatory impact of tissue invasion types on miRNA expression.
These findings have important implications for understanding the molecular mechanisms underlying colon cancer progression. The strong interaction between miR-101-3p and miR-326, particularly in the context of organ metastasis, suggests a potential cooperative role of these miRNAs in promoting tumor aggressiveness and metastatic behavior. Moreover, the tissue-specific variation in miR-326 expression highlights the critical influence of the tumor microenvironment on miRNA dynamics. These results emphasize the need for further exploration of miR-101-3p and miR-326 as potential biomarkers or therapeutic targets, especially in advanced stages of colon cancer characterized by organ metastasis. This could aid in the development of precision medicine strategies tailored to specific invasion patterns.
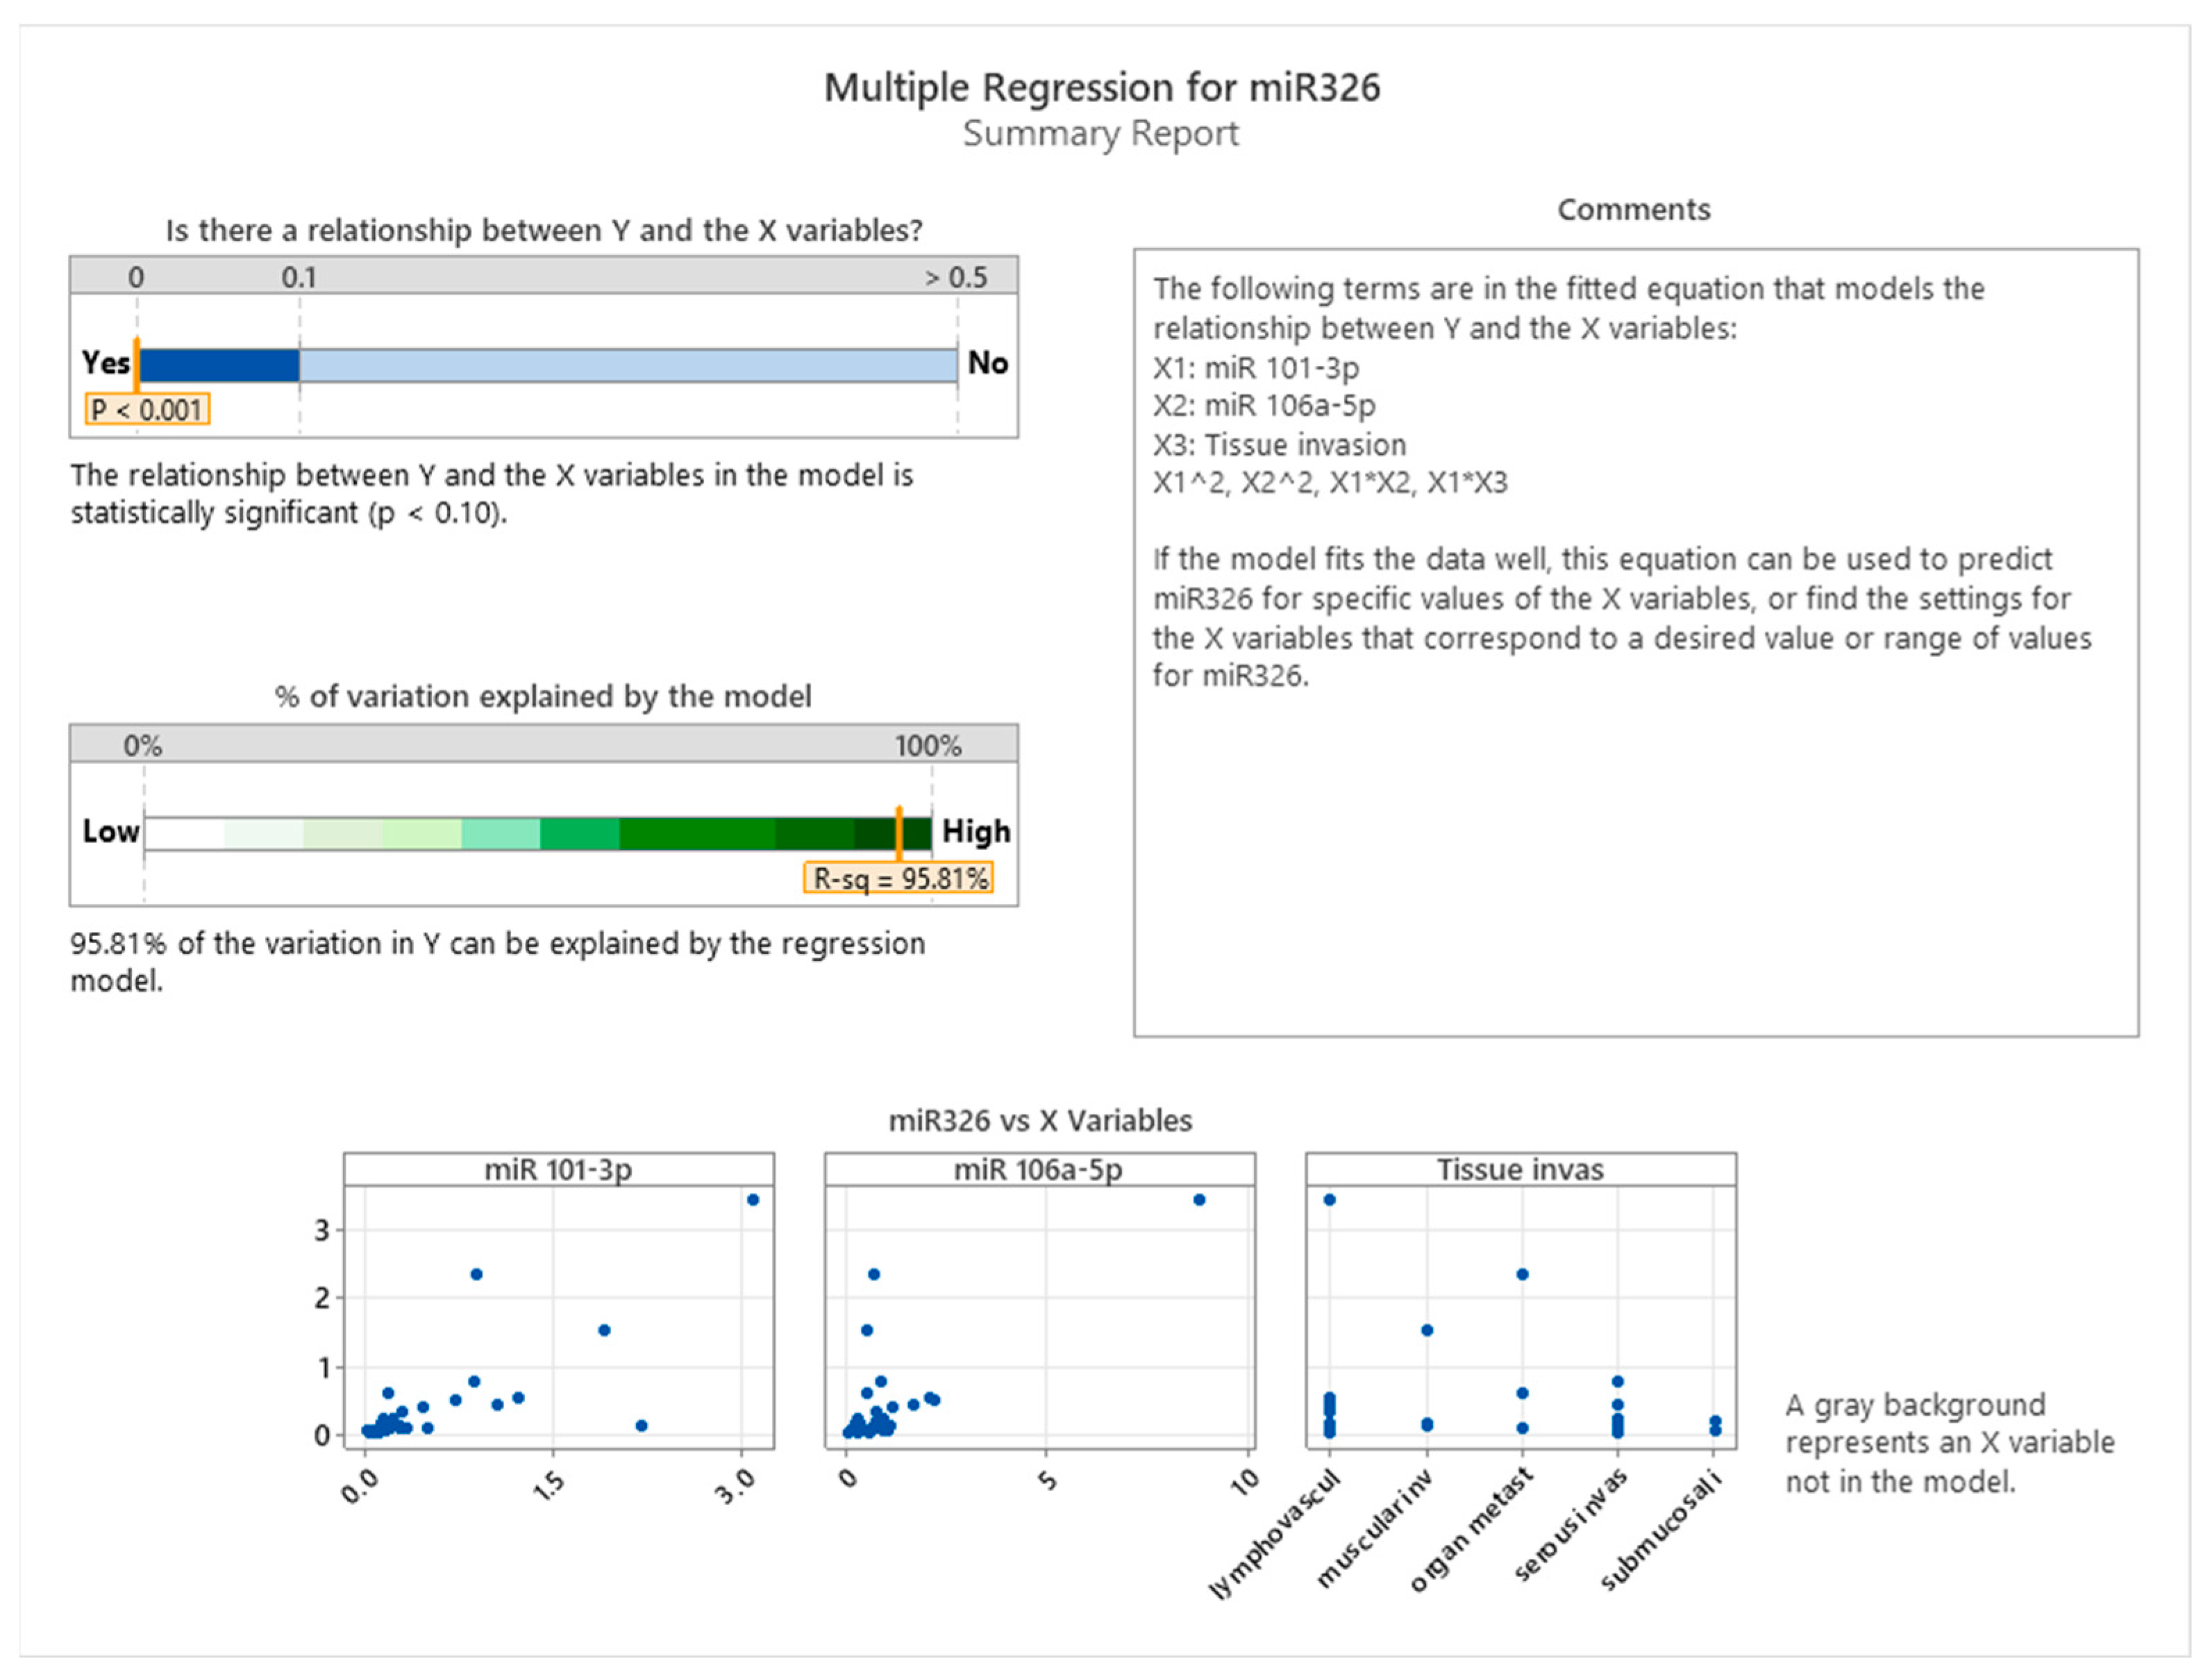
The summary of the regression model presented in
Figure 8 demonstrated a statistically significant relationship between miR-326 and the predictors (
p < 0.001). This model accounted for 95.81% of the variation in miR-326 expression, as indicated by the high R-squared value. The fitted model included main effects for miR-101-3p, miR-106a-5p, and tissue invasiveness, as well as interaction terms (e.g., miR-101-3p × tissue invasiveness) and non-linear effects (e.g., miR-101-3p squared). This comprehensive approach captures both direct and interactive influences of the predictors.
Scatterplots of miR-326 versus each predictor further illustrate the relationships. For miR-101-3p and miR-106a-5p, a non-linear pattern is evident, supporting the inclusion of quadratic terms in the model. Tissue invasiveness categories, on the other hand, display a categorical influence on miR-326 expression, highlighting the tumor microenvironment’s distinct role in shaping miRNA regulation.
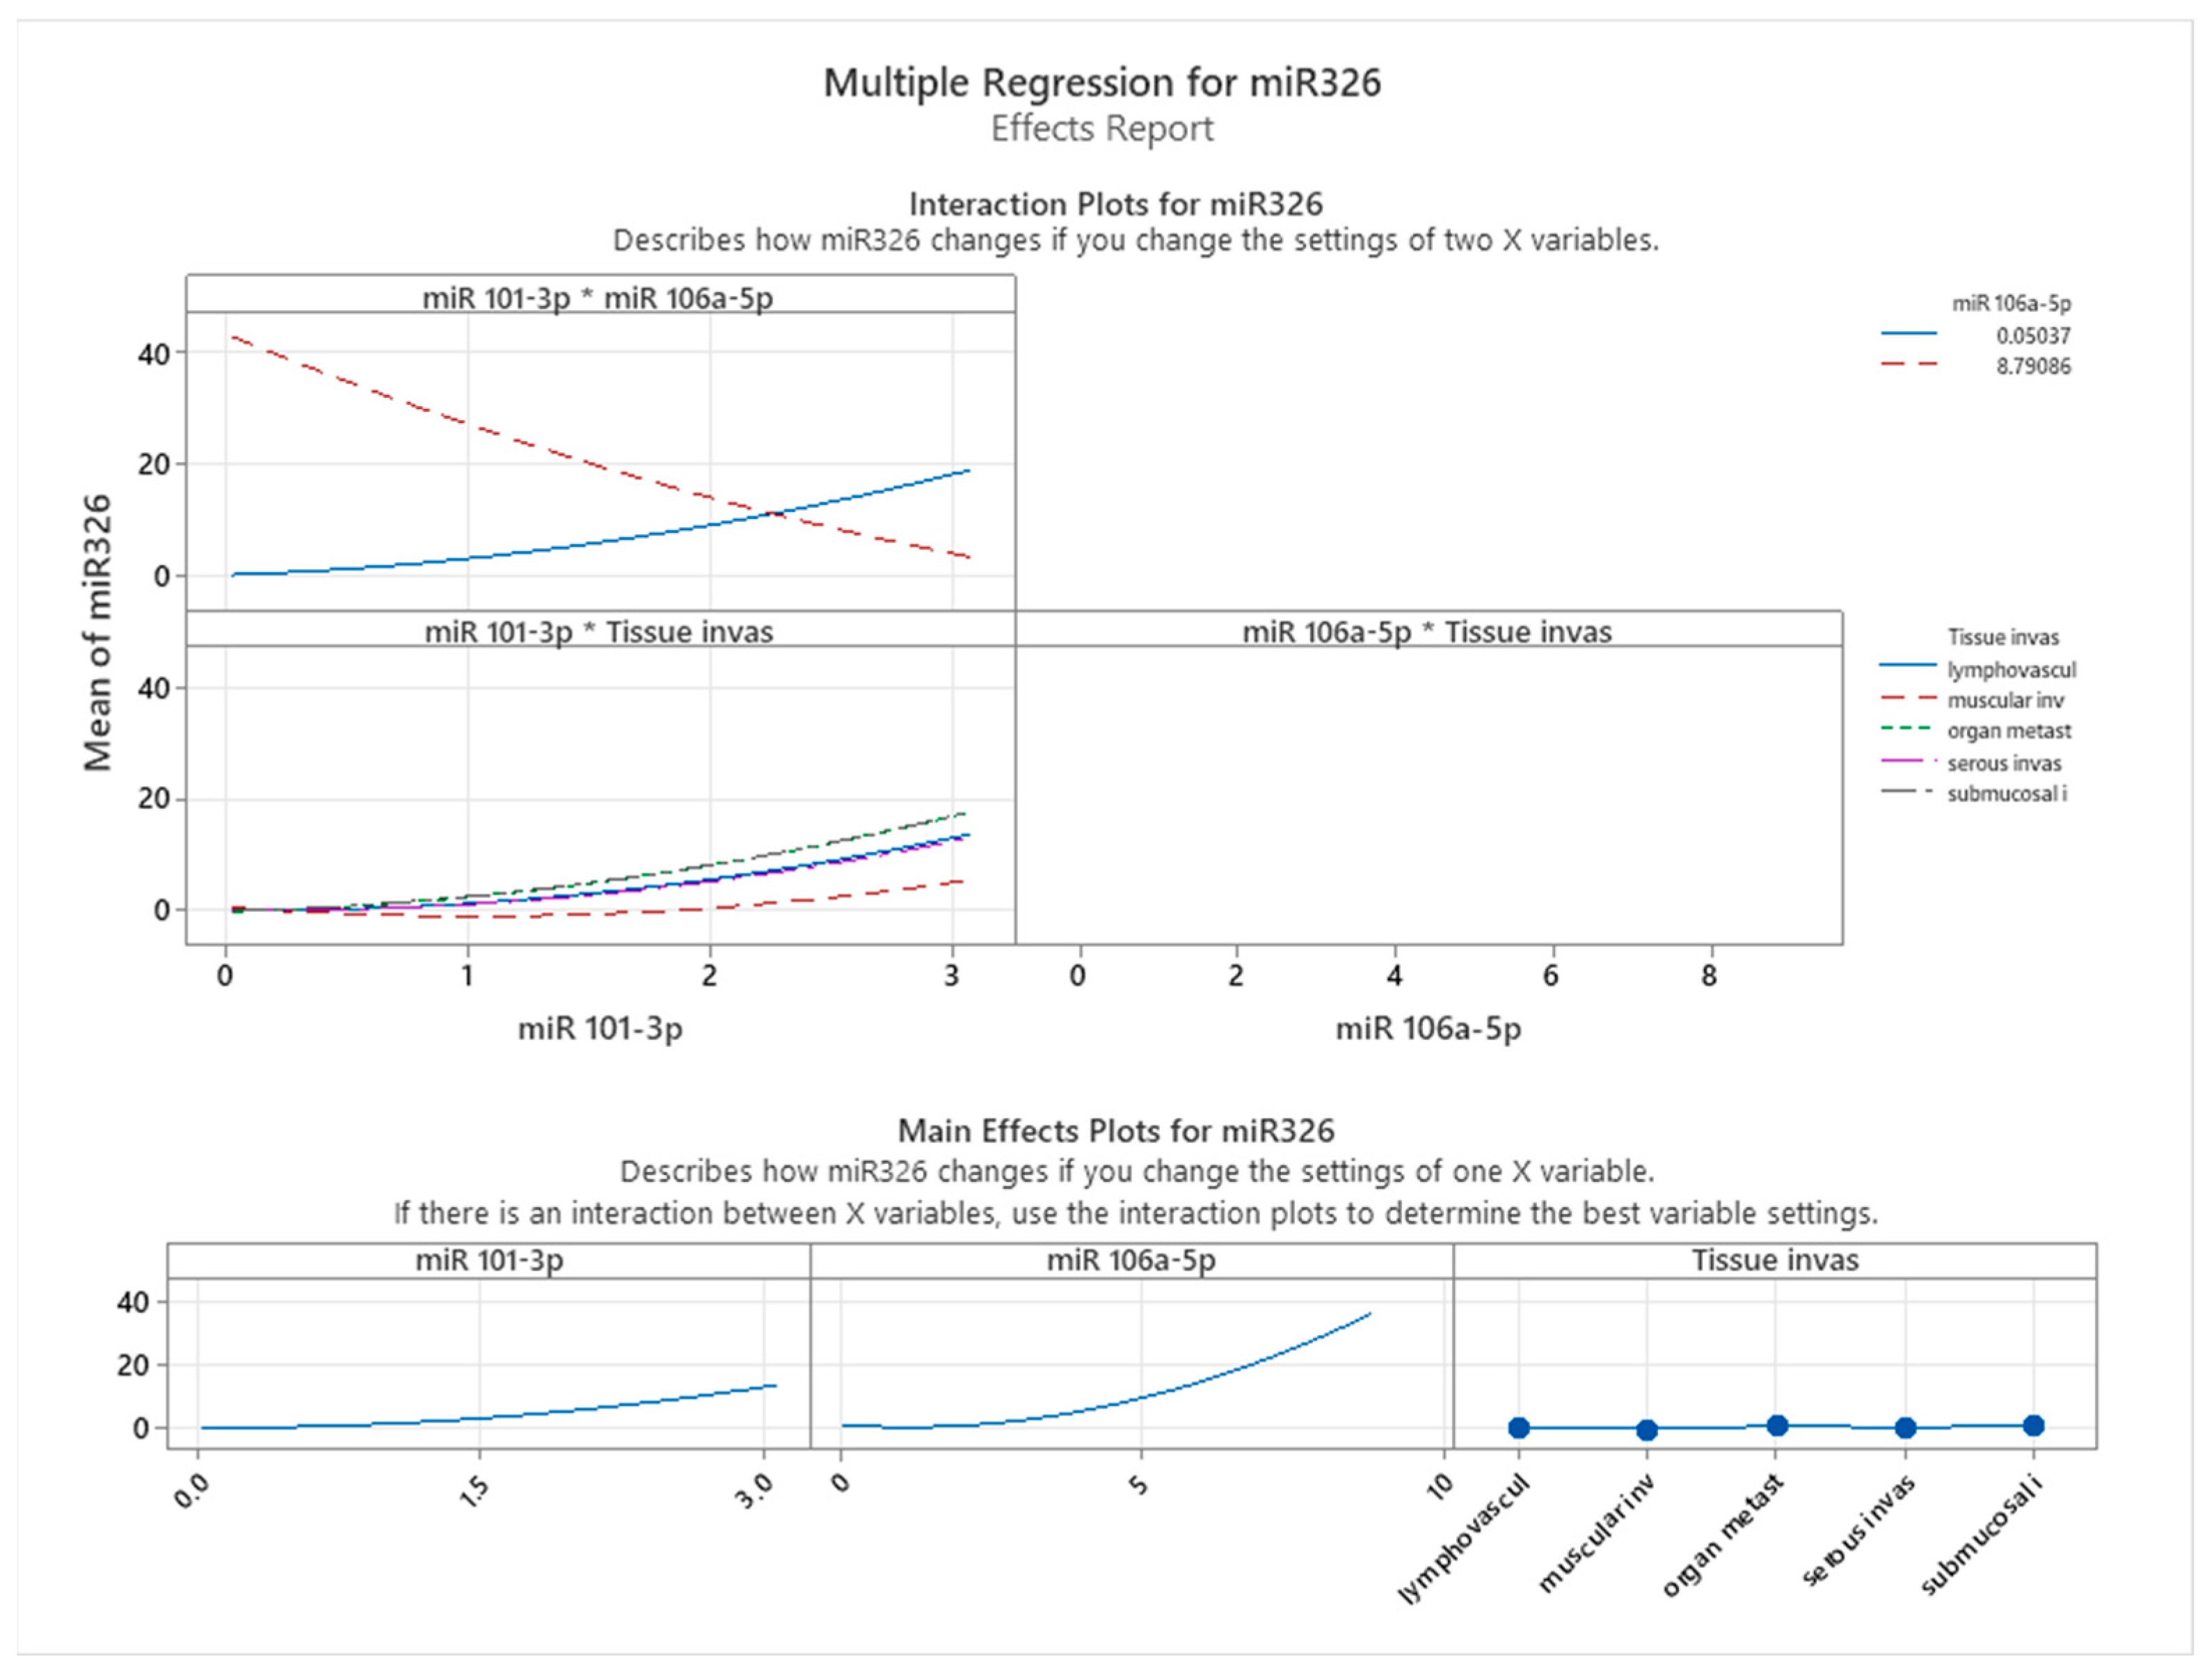
To understand these relationships further, interaction and main effects plots were examined (see
Figure 9). Interaction plots revealed notable effects of predictor interactions on miR-326 expression. Specifically, the interplay between miR-101-3p and miR-106a-5p displayed a dynamic relationship: at lower miR-101-3p levels, higher miR-106a-5p levels correlated with reduced miR-326 expression. However, this relationship reversed at higher miR-101-3p levels, suggesting a context-dependent regulatory effect. The interaction between miR-106a-5p and tissue invasiveness consistently showed that increasing miR-106a-5p levels were associated with elevated miR-326 expression across tissue types. However, the magnitude of this effect varied, with tissue categories such as lymphovascular invasion and organ metastasis exhibiting the highest levels of miR-326 expression. Main effects plots supported these observations. miR-106a-5p exerted a strong positive influence on miR-326 expression, while miR-101-3p demonstrated a moderate, non-linear effect. Tissue invasiveness categories displayed unique mean levels of miR-326 expression, emphasizing the importance of the tumor environment in regulating miRNA levels.
The stepwise regression approach, as detailed in
Figure 10, provided further insights into the incremental contributions of predictors and interaction terms to the model. miR-101-3p was the most significant predictor, contributing the largest increase in adjusted R-squared (~20%), with a
p-value < 0.001. Tissue invasiveness added an additional ~10% to the explained variance, highlighting its contextual relevance.
While miR-106a-5p had a smaller direct impact, its interaction and non-linear terms significantly enhanced the model fit. For instance, the interaction term between miR-101-3p and tissue invasiveness (X1 × X3) was highly significant, underscoring the complex interplay between these variables. Additionally, quadratic terms for both miRNAs improved the model, further supporting the non-linear relationships observed in the scatterplots.
Summary of Findings
Together, these findings highlight the complex nature of miRNA interactions in colon cancer tissues. miR-101-3p expression showed a significant association with miR-326 expression, while miR-106a-5p displayed complex interaction patterns with other miRNAs. These findings indicate correlations rather than direct regulatory mechanisms. Tissue invasiveness emerged as an important contextual factor, influencing miR-326 expression levels in a manner consistent with tumor aggressiveness and stage of invasion. The model explains nearly all observed variation in miR-326 expression, emphasizing the intricate relationships between miRNAs and tumor progression while underscoring the need for further experimental validation.


 ,
, 


