

Acute Leukemia of Ambiguous Lineage: Diagnosis and Evaluation by Flow Cytometry


Simple Summary
Abstract
1. Introduction
2. Update on ALAL/MPAL Diagnosis
- (1)
- The total number of neoplastic blasts in the blood or bone marrow must be ≥20% of the total cells based on morphological evaluation.
- (2)
- Blasts in MPAL show differentiation along more than one lineage that meets MPAL lineage-defining criteria (as outlined in Table 1). In contrast, blasts in AUL lack sufficient immunophenotypic differentiation along any cell lineage.
- (3)
- The leukemia cannot be classified into other clinically or genetically defined categories.
3. Update on ALAL/MPAL Classification
4. Update on Immunophenotypic Criteria in Diagnosing MPAL
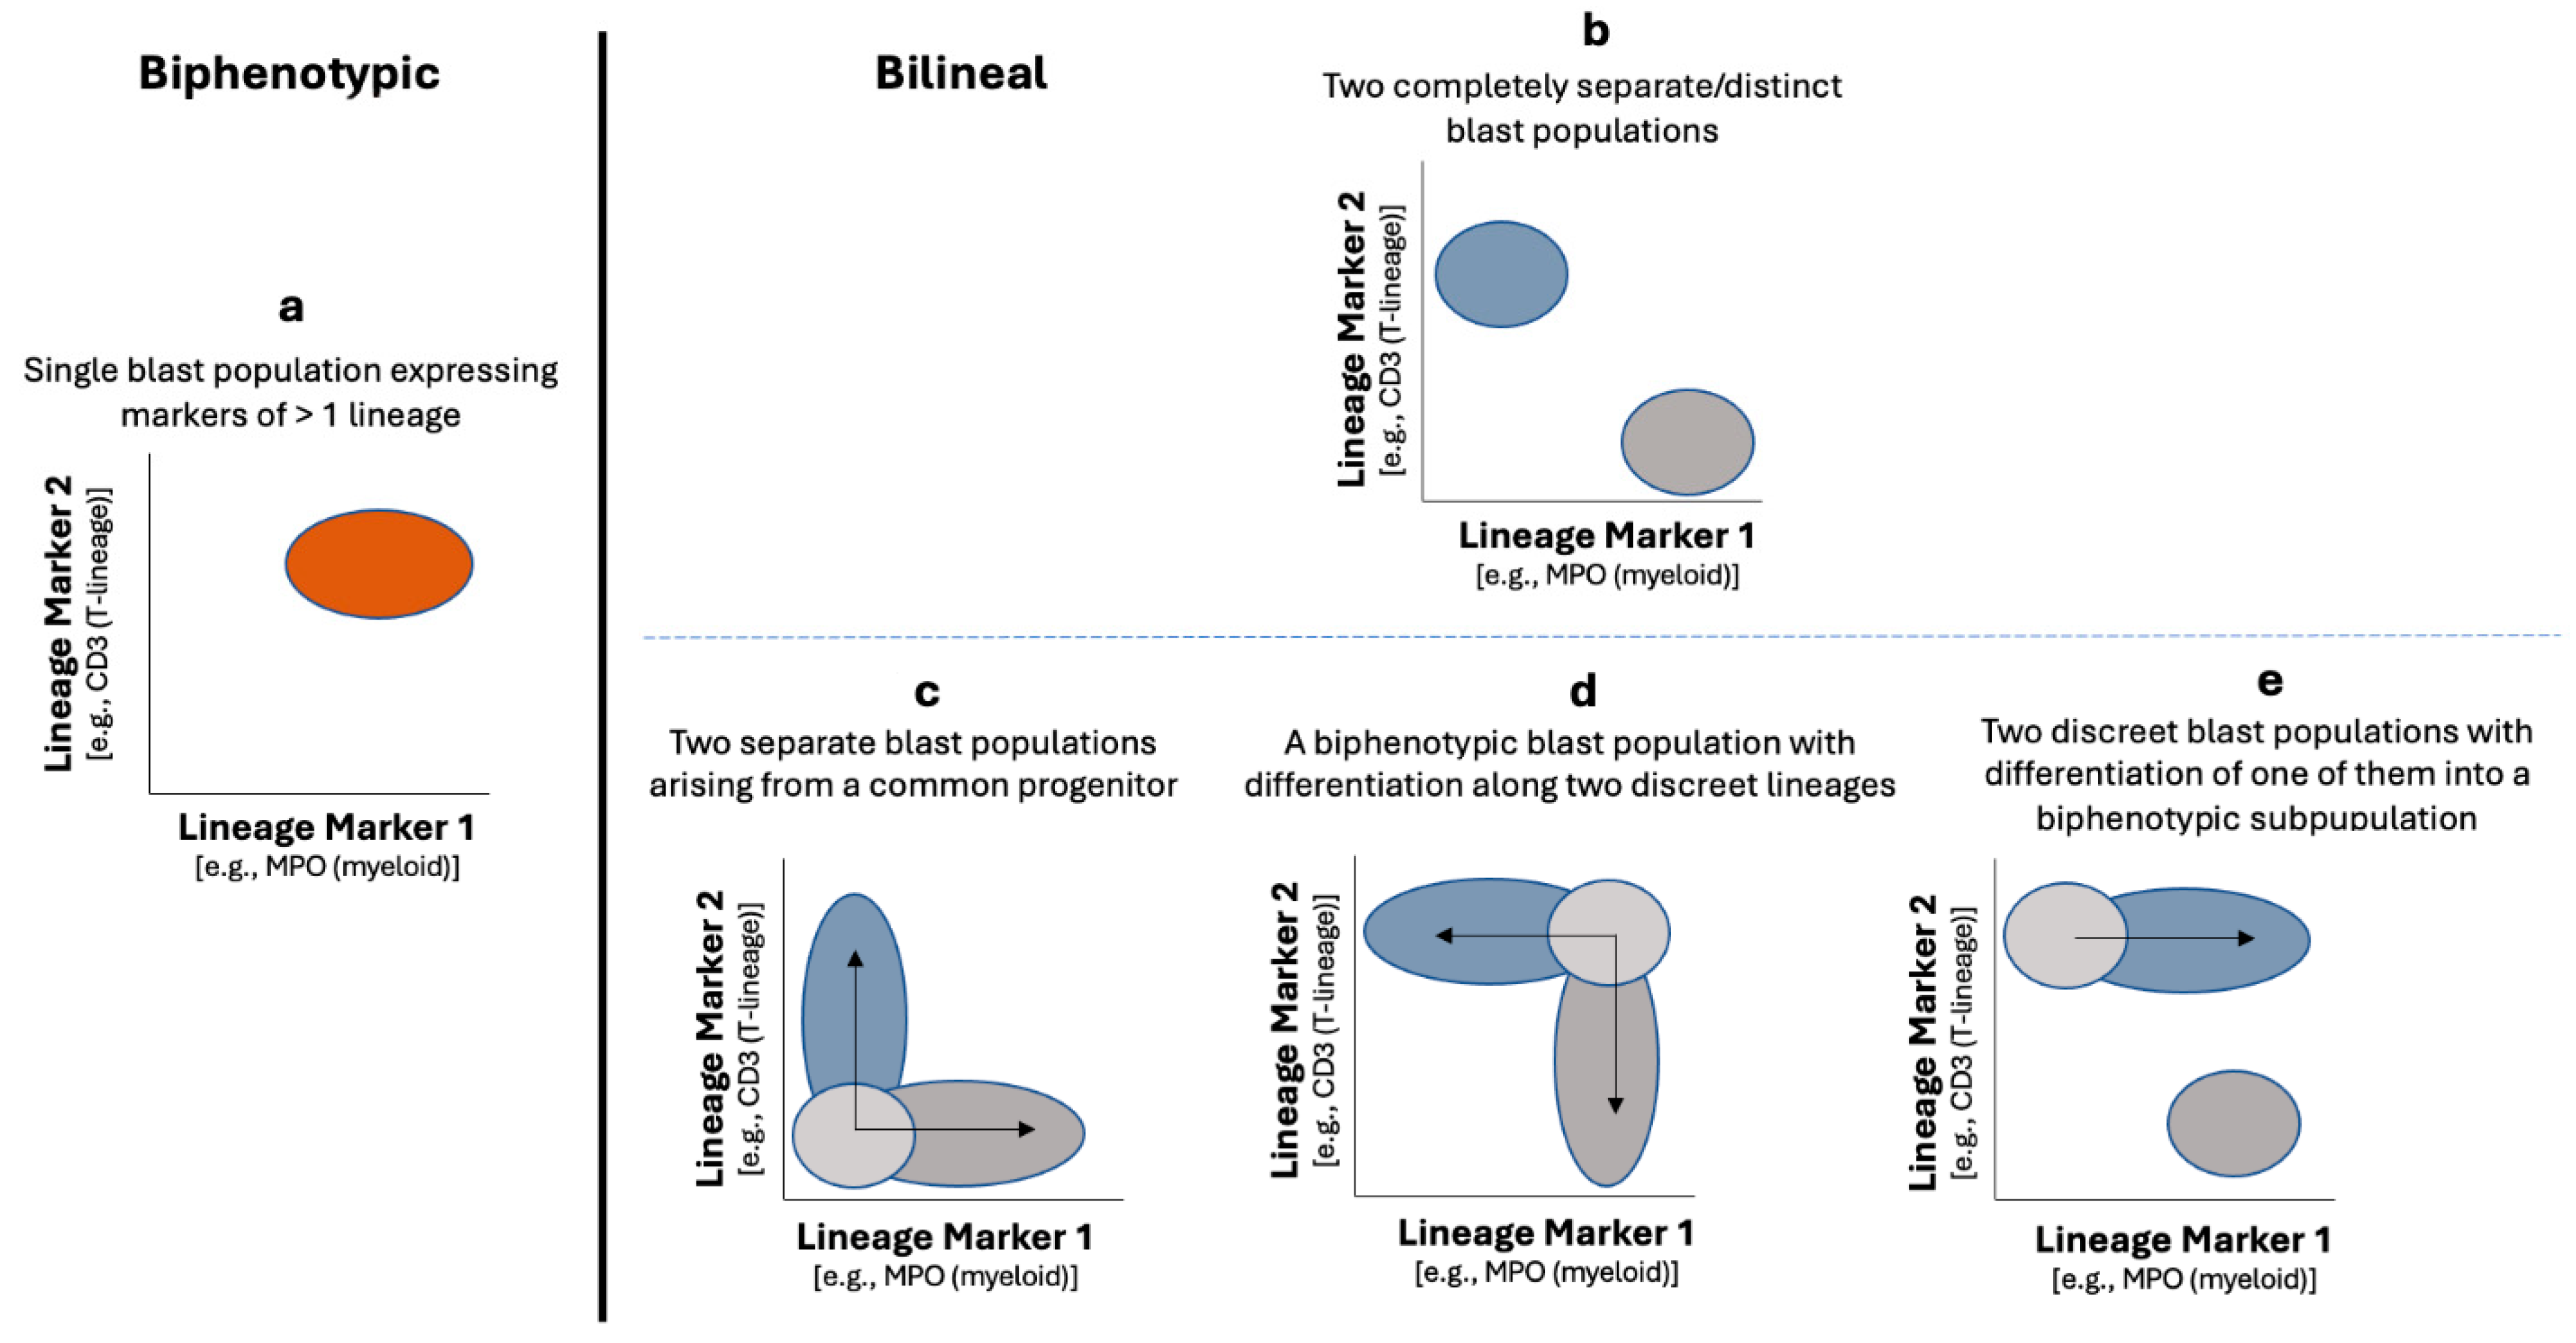
4.1. Biphenotypic Versus Bilineal MPAL
4.2. When and How to Apply the Lineage-Defining Criteria in MPAL Diagnosis
4.2.1. MPAL, Bilineal/Trilineal with Two or More Separate Discrete Blast Populations (Figure 1, Pattern 1b)
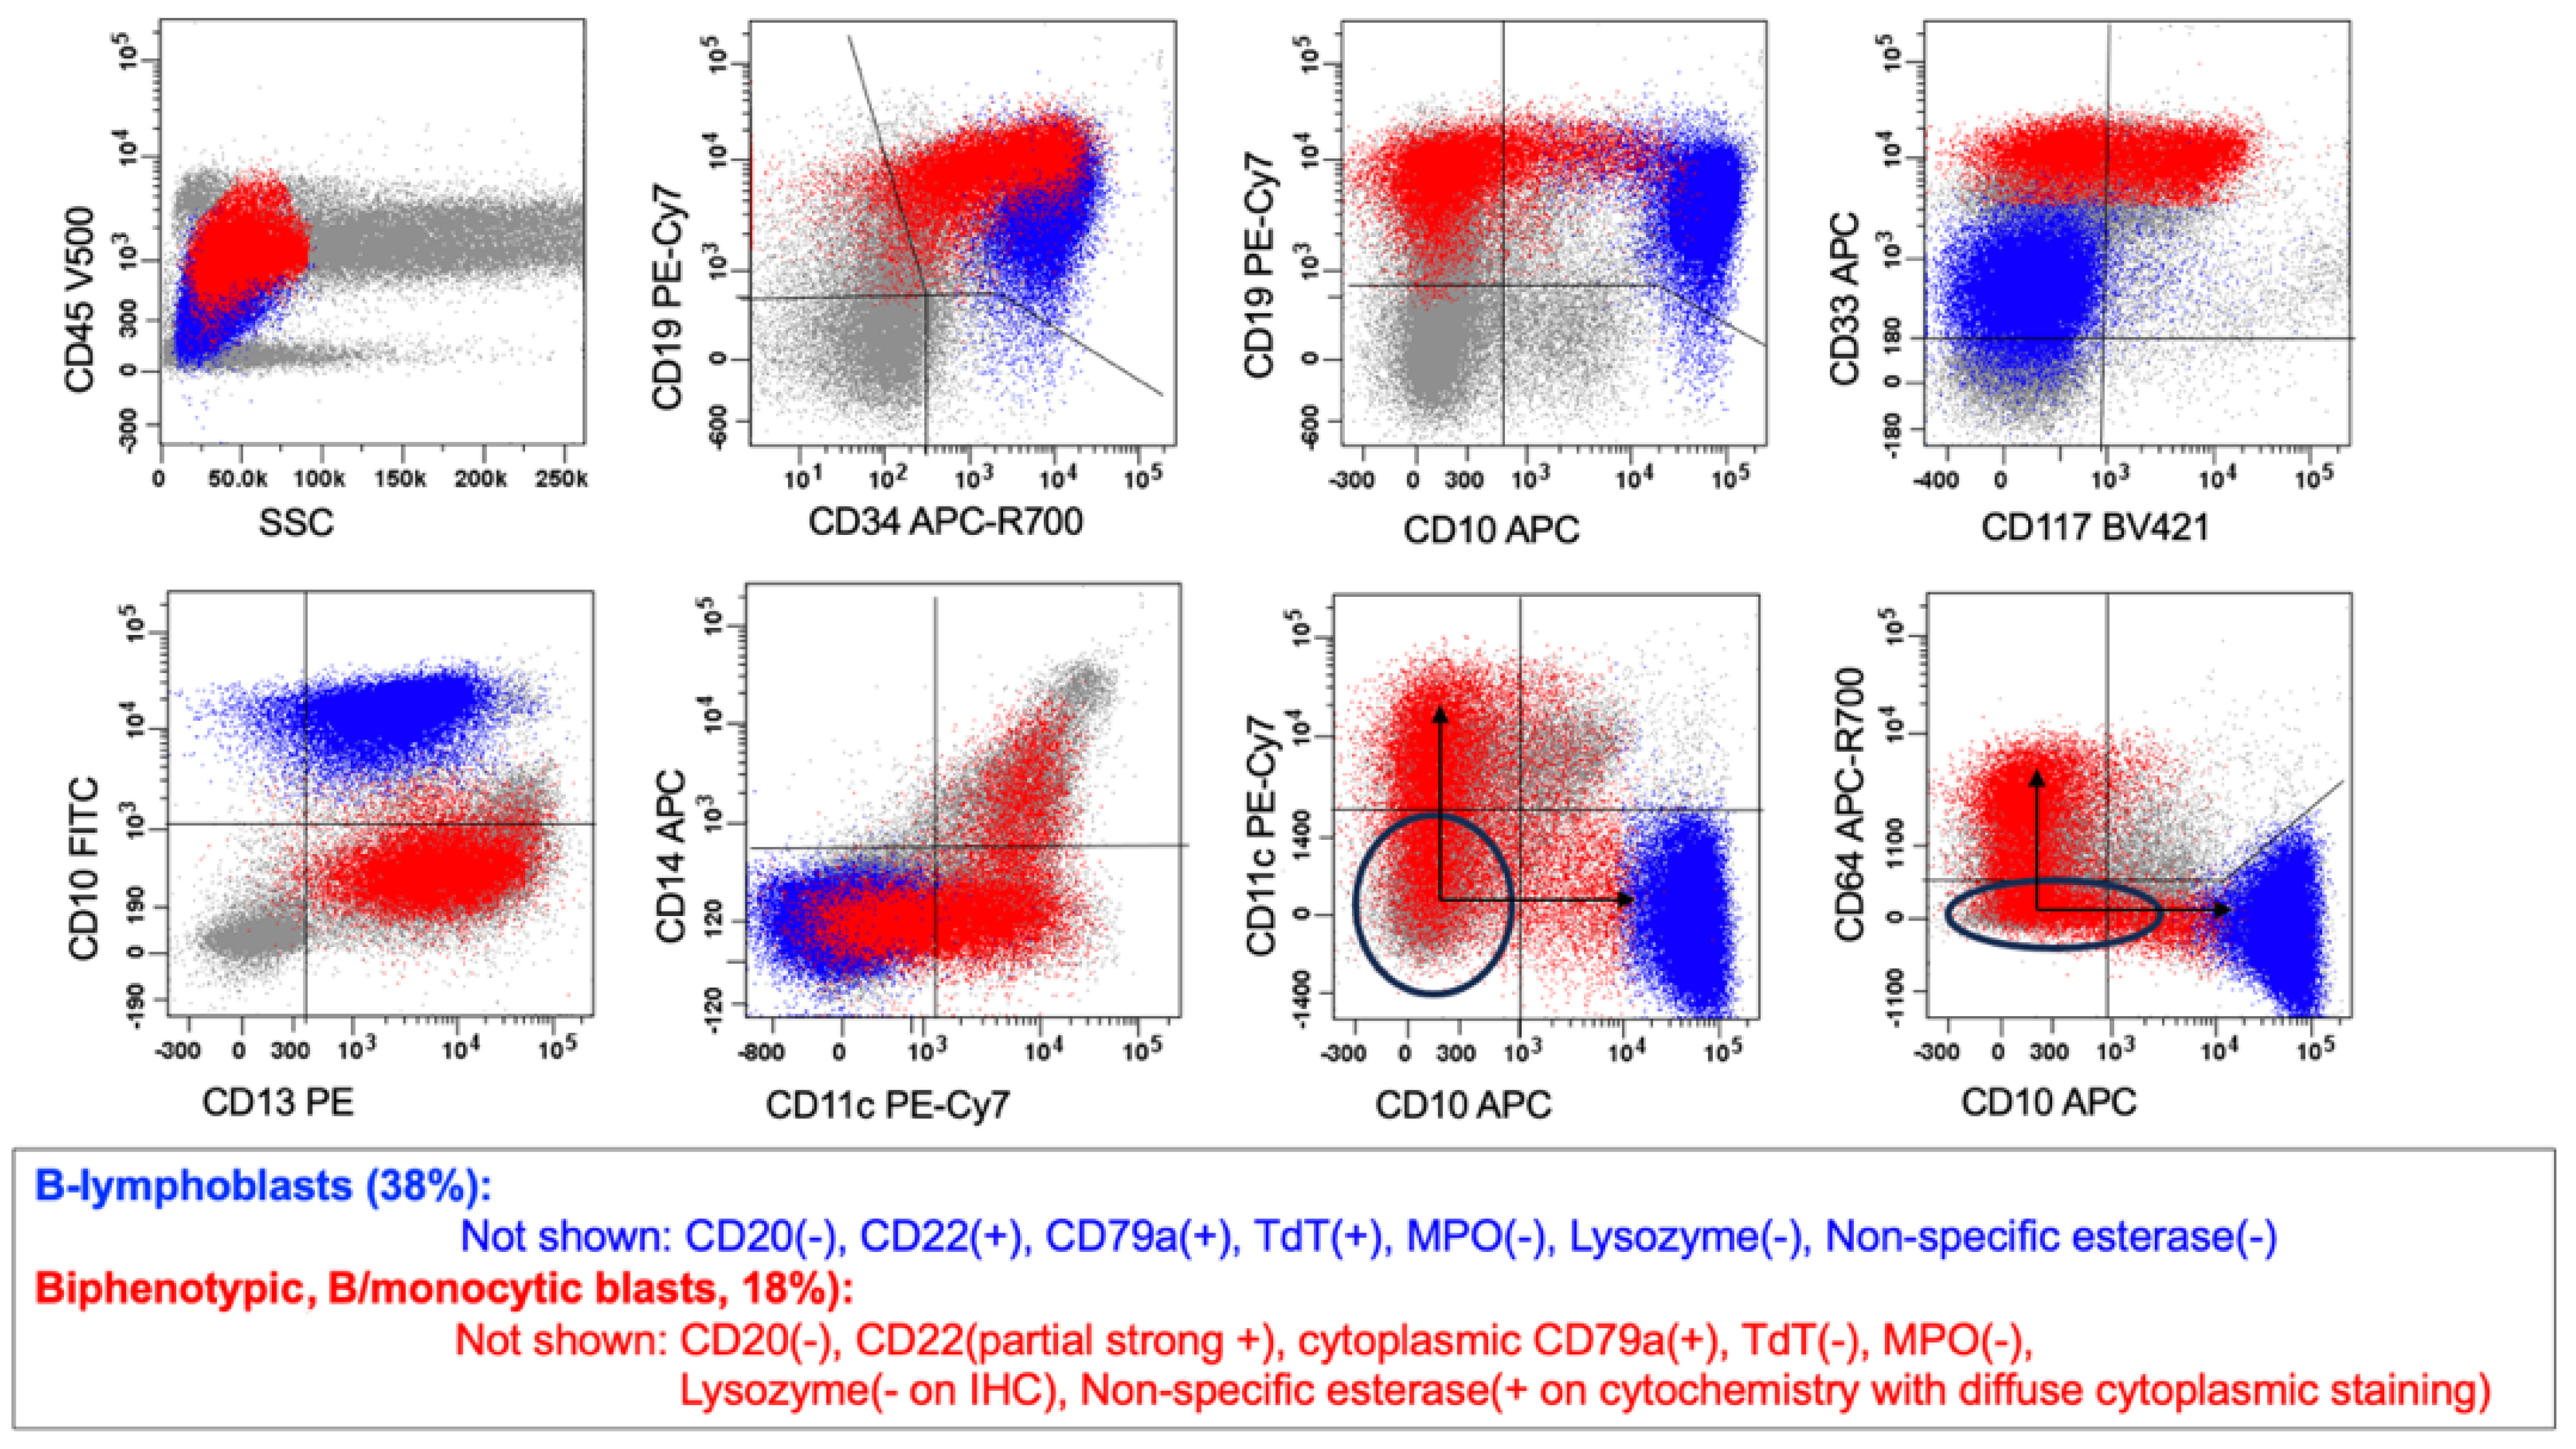
4.2.2. MPAL, Biphenotypic/Bilineal of Other Patterns
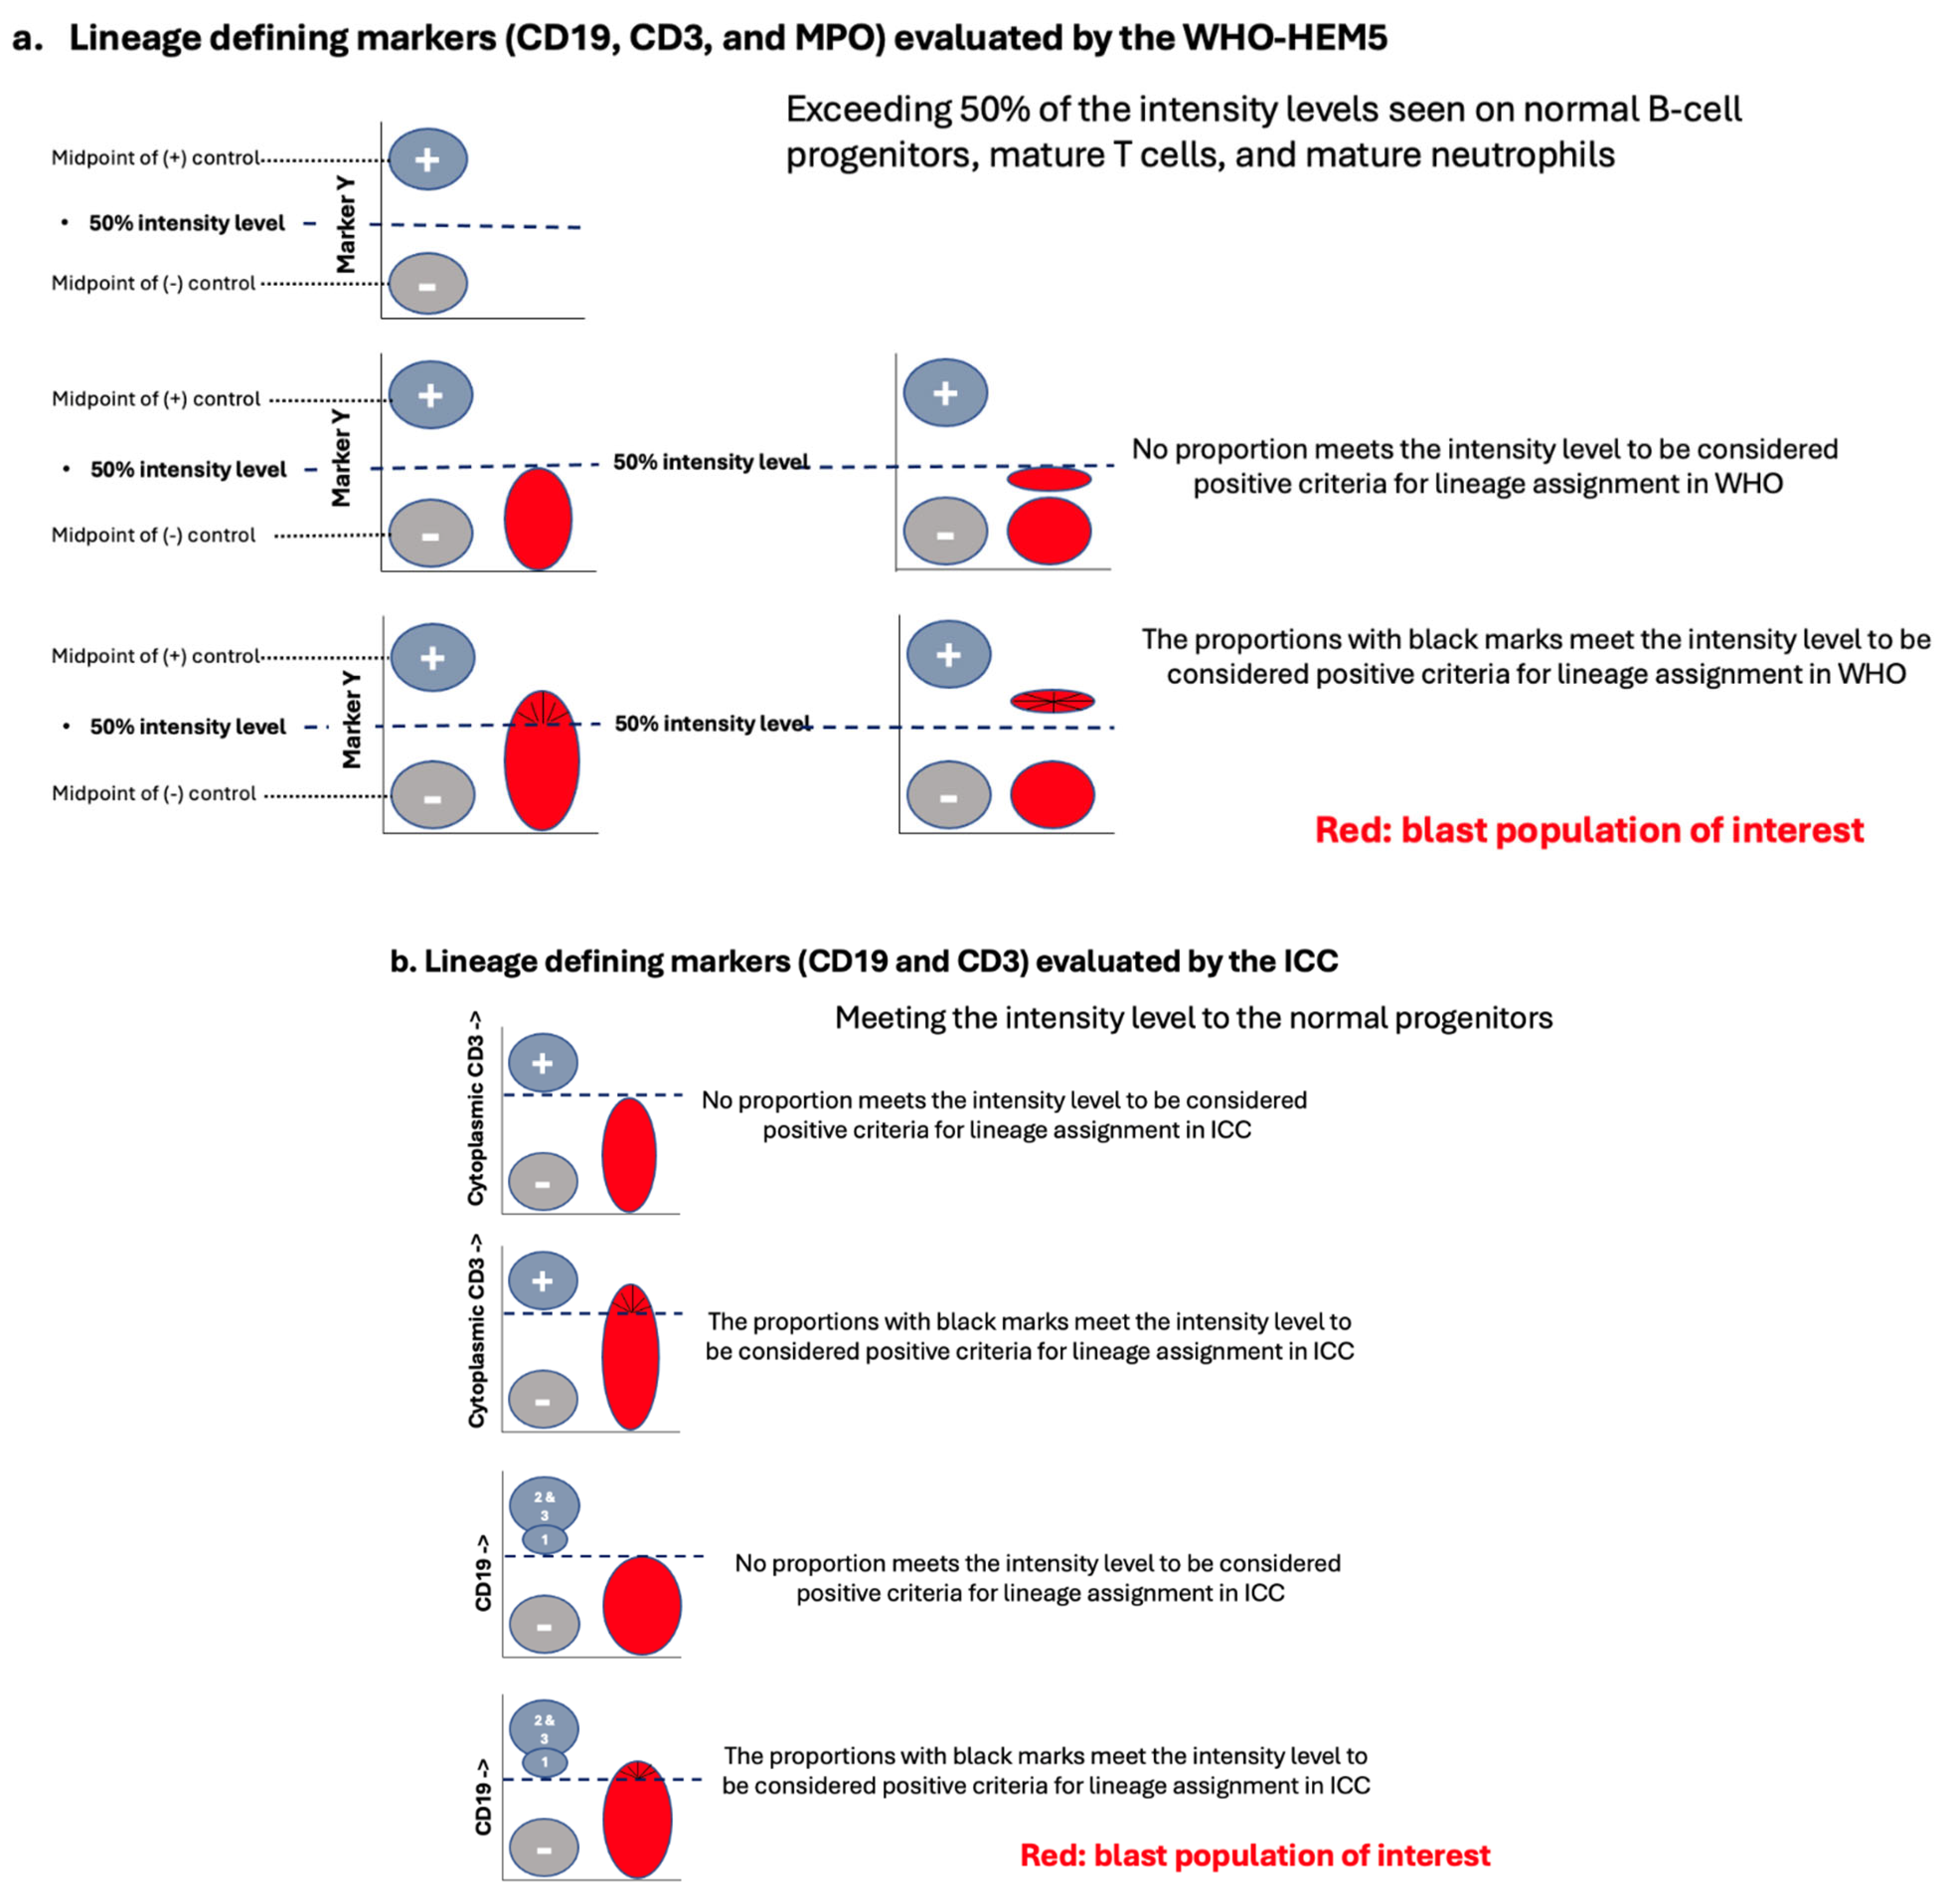
4.3. B-Lineage Assignment
4.4. T-Lineage Assignment
4.5. Myeloid Lineage Assignment
5. ALAL/MPAL with Defining Genetic Abnormalities
5.1. MPAL with BCR::ABL1 Fusion
5.2. MPAL with KMT2A Rearrangement
5.3. MPAL with ZNF384 Rearrangement
5.4. ALAL/MPAL with BCL11B Rearrangement/Activation
6. ALAL/MPAL Defined Immunophenotypically
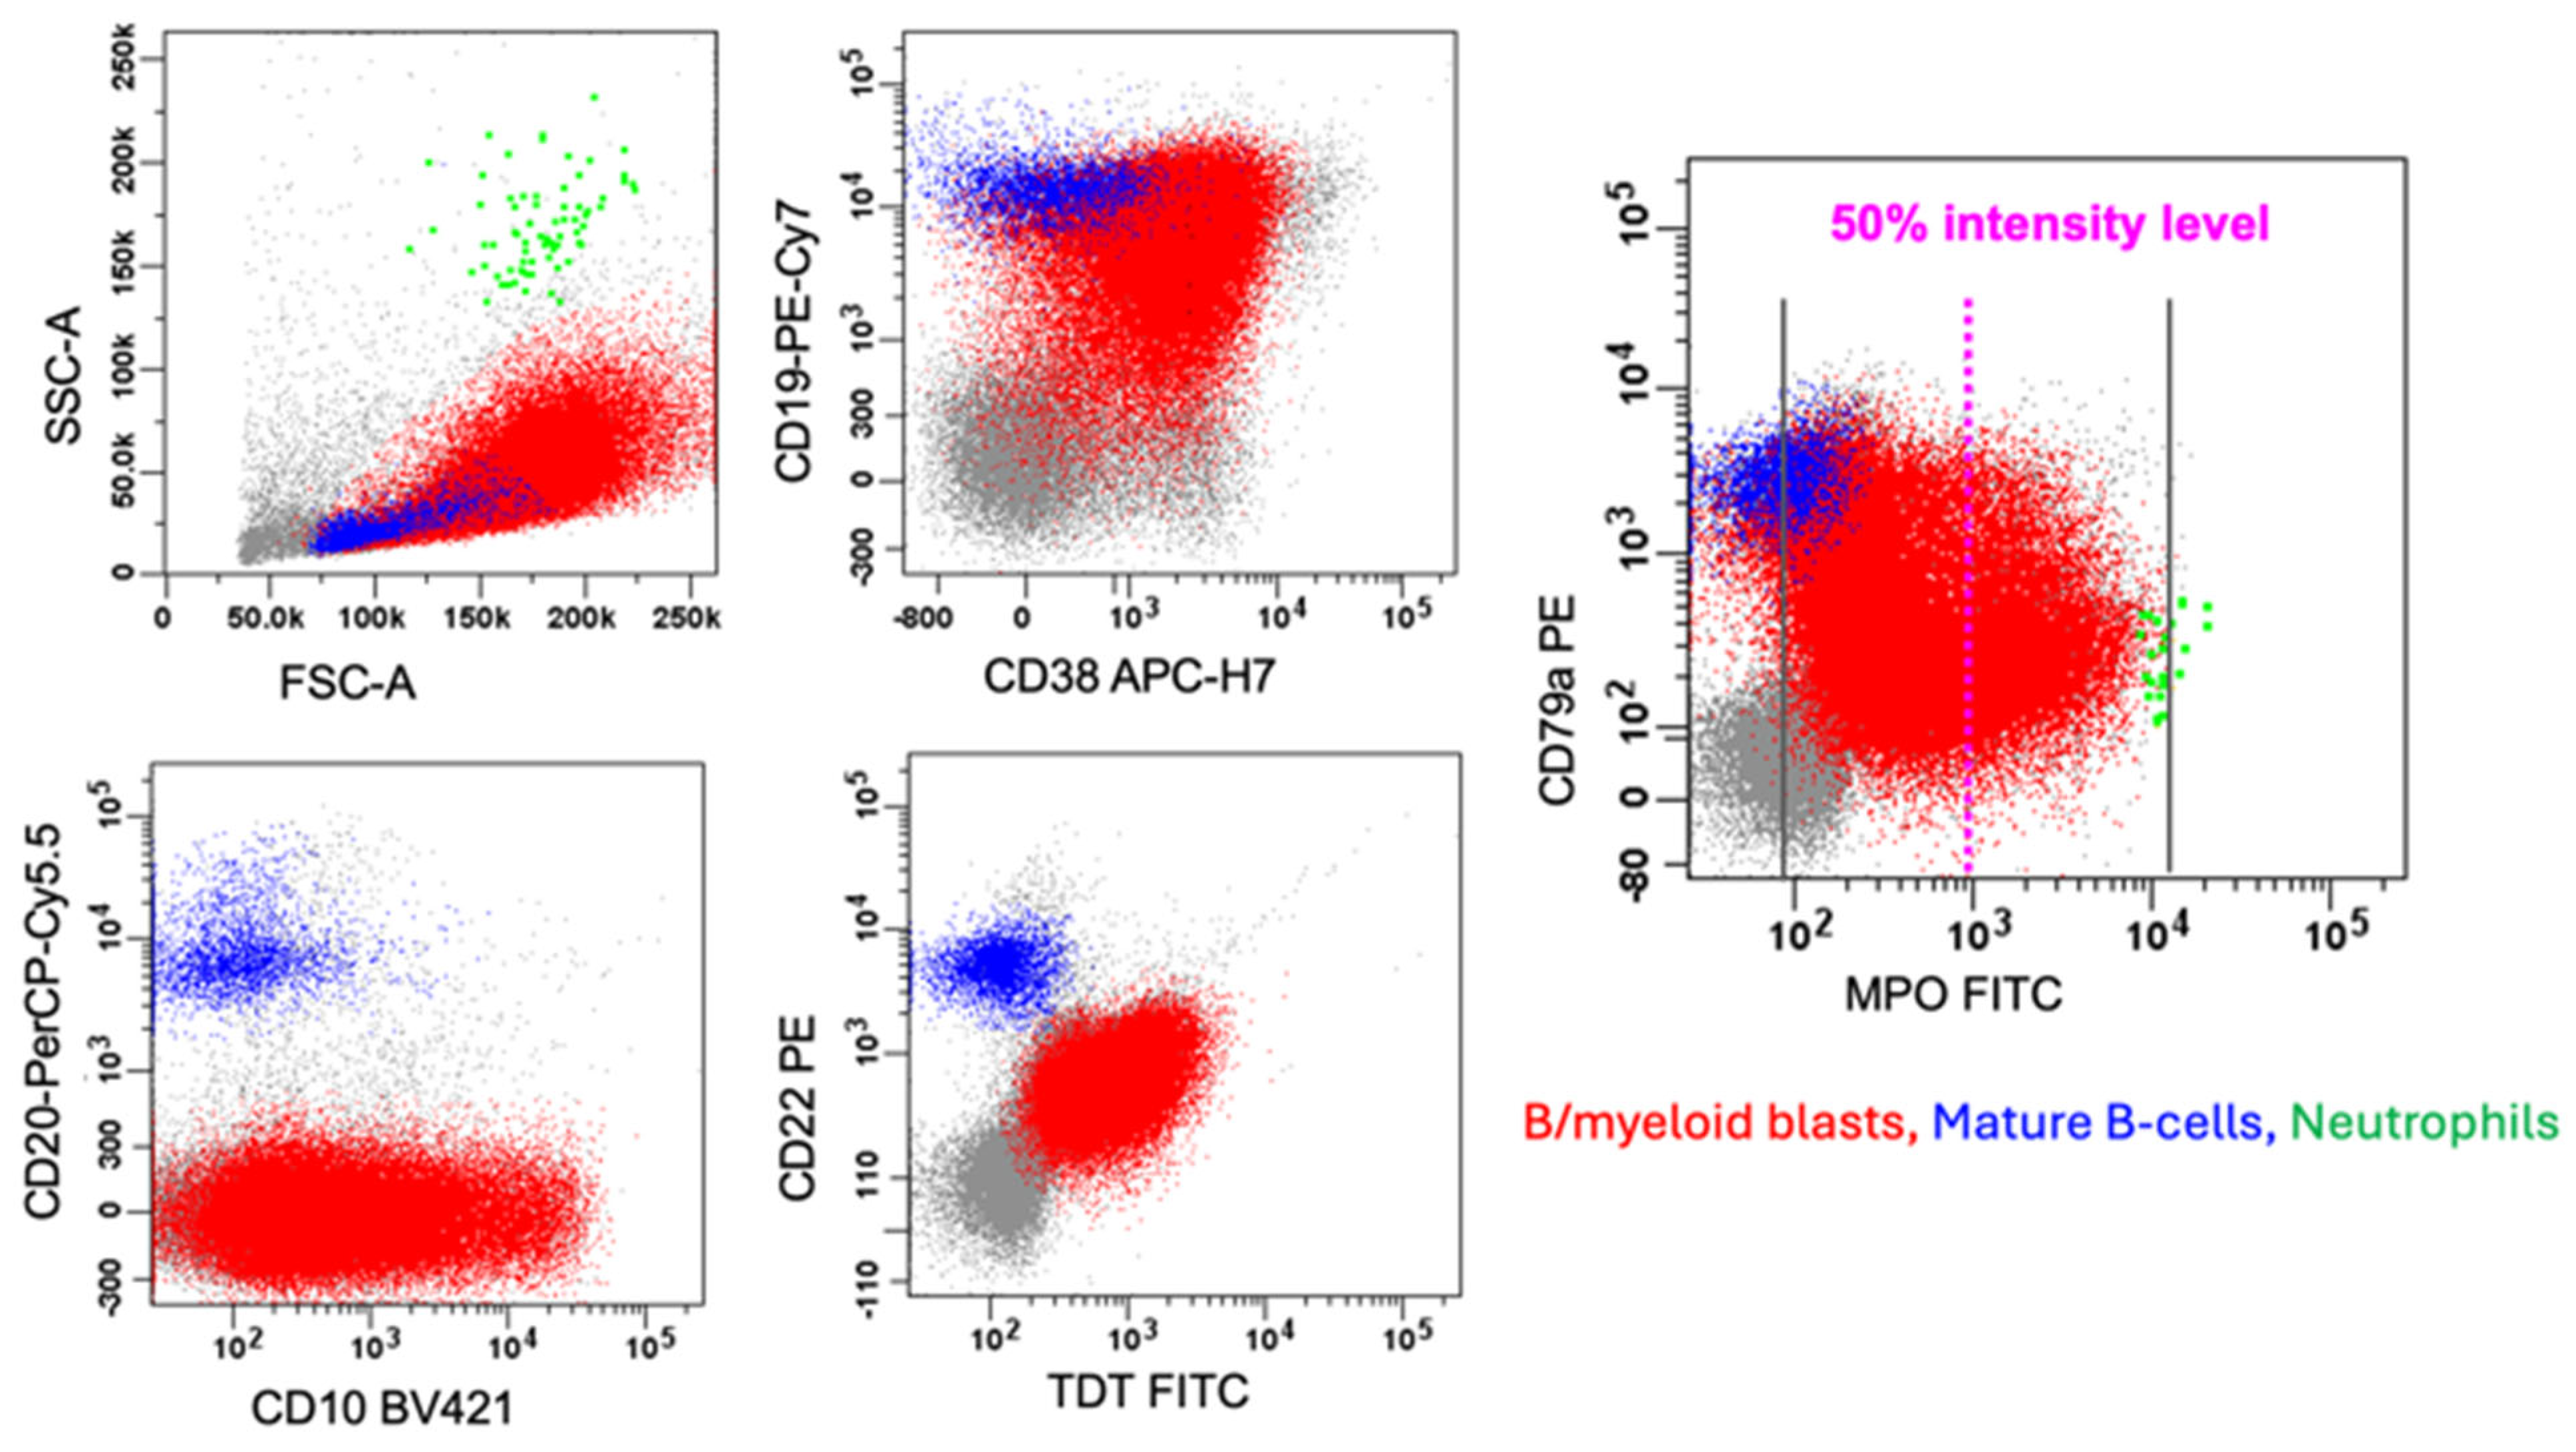
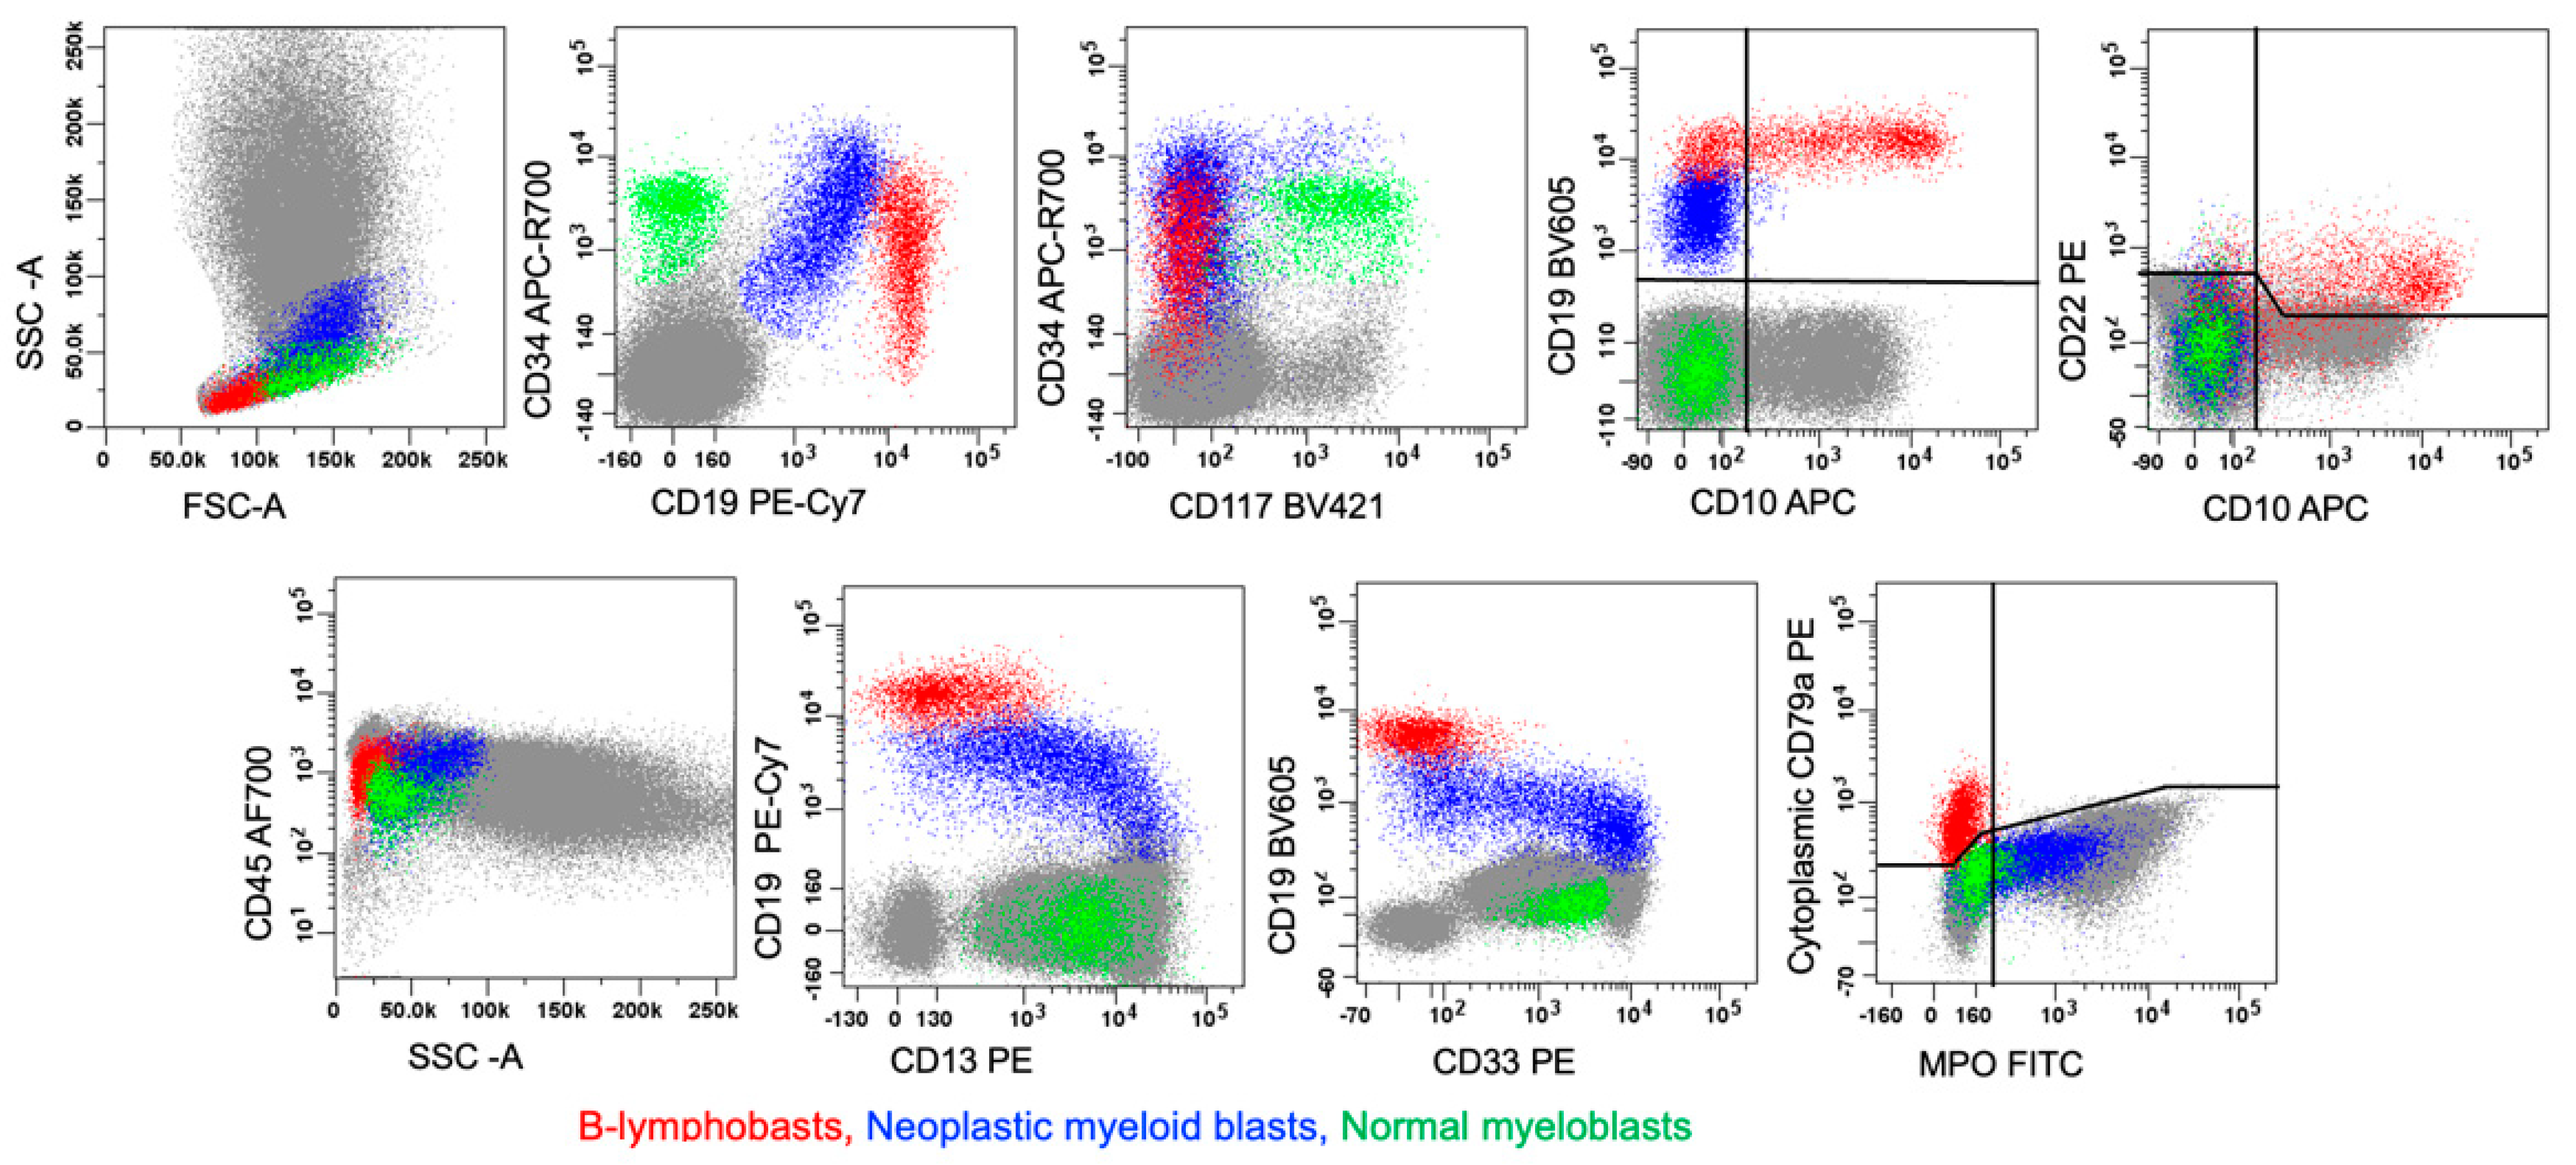
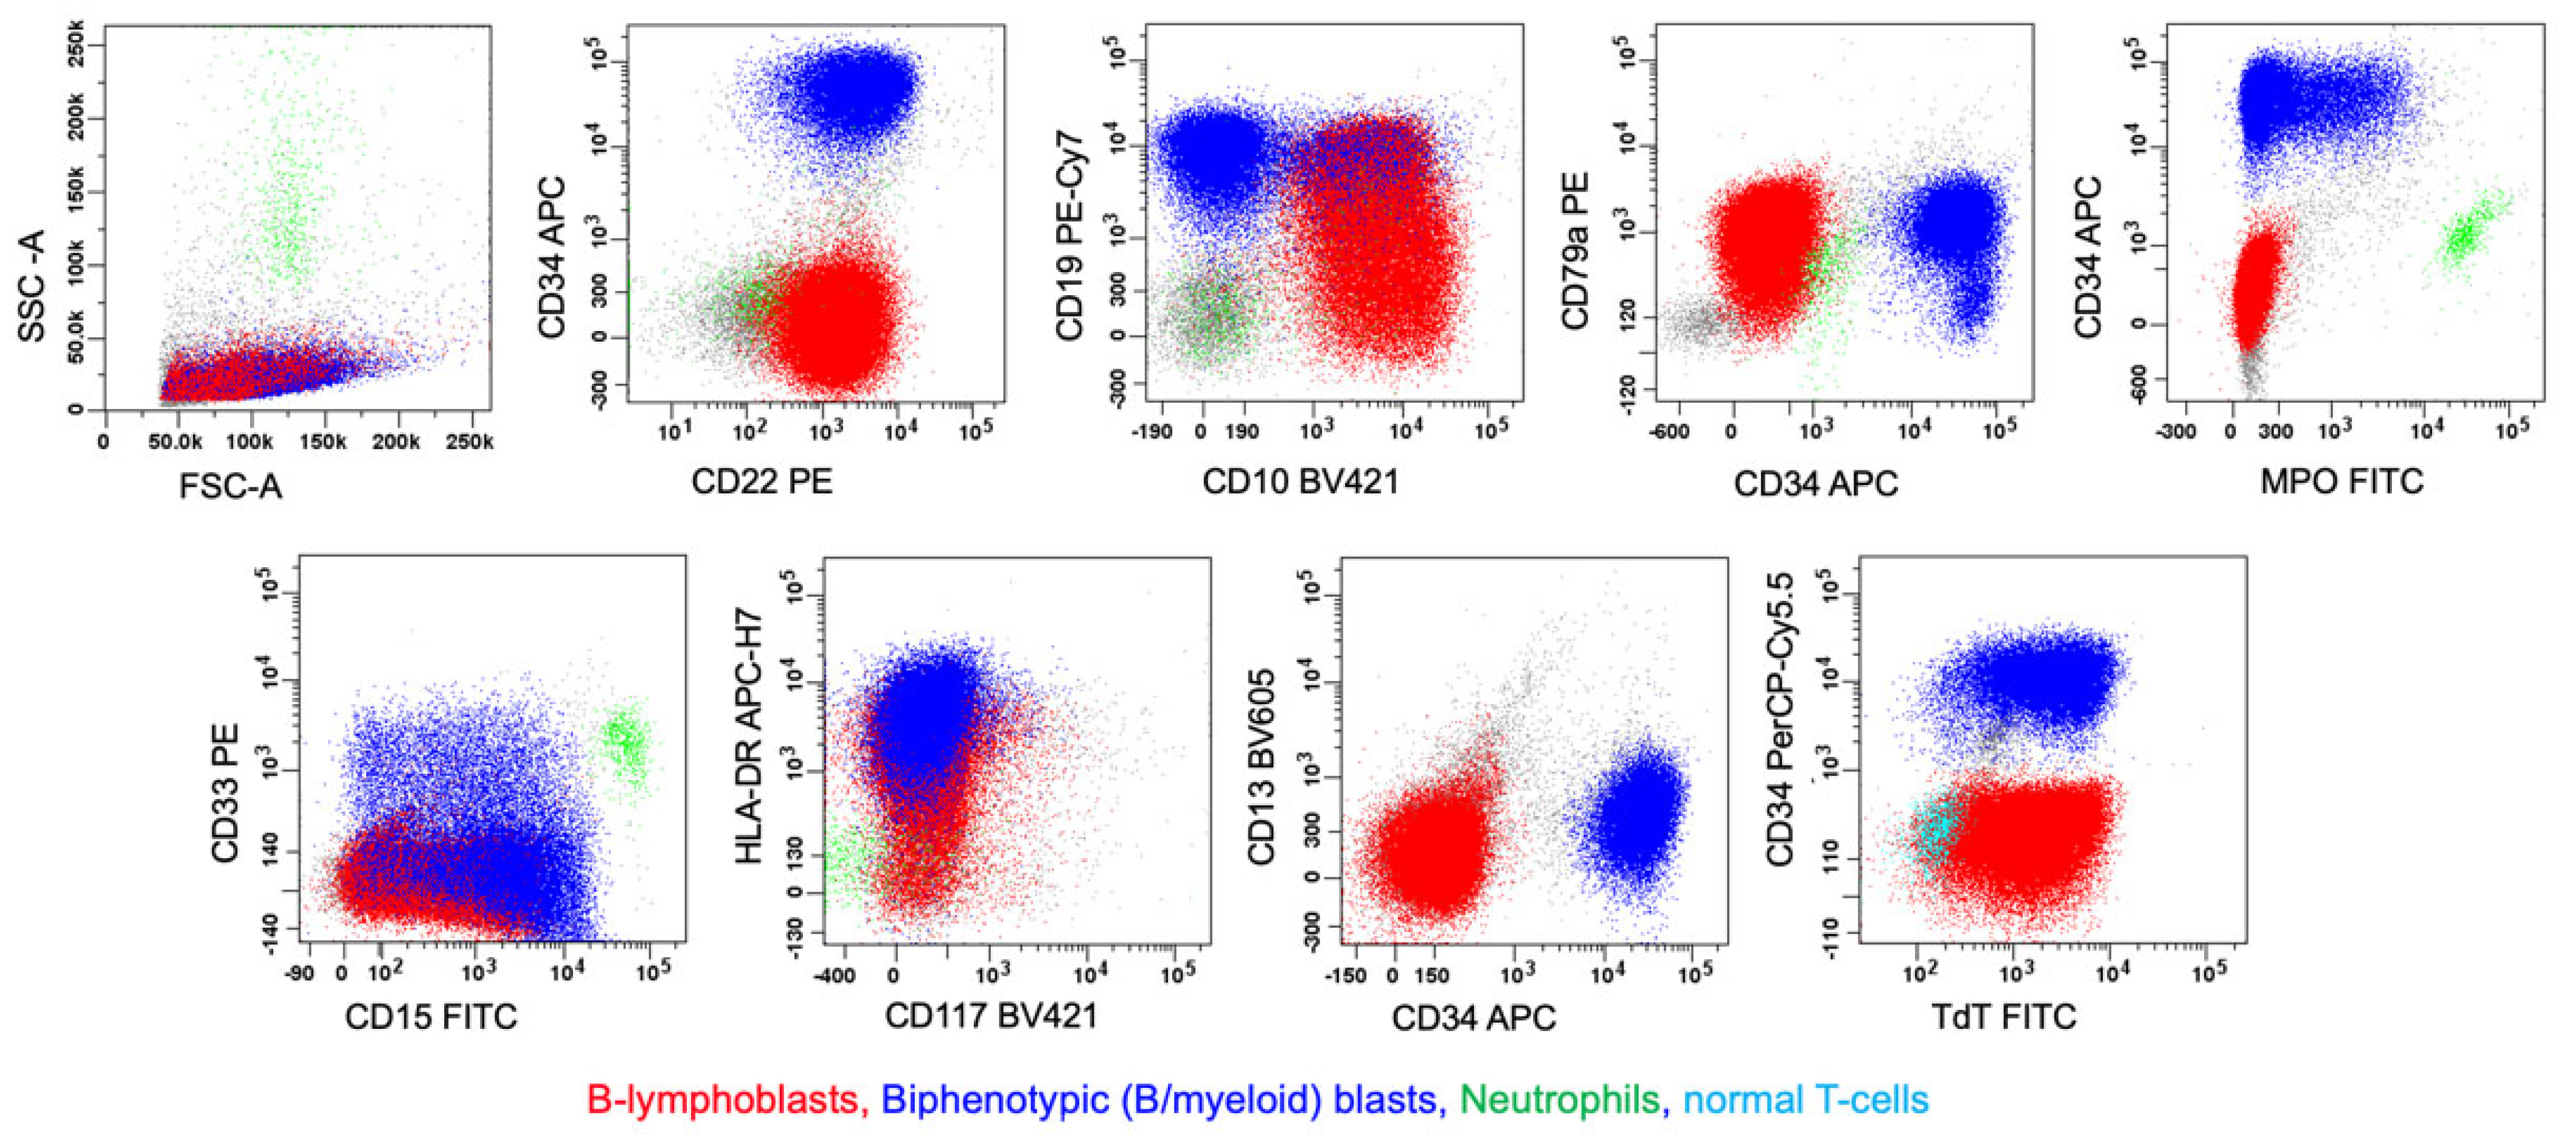
6.1. B/myeloid MPAL
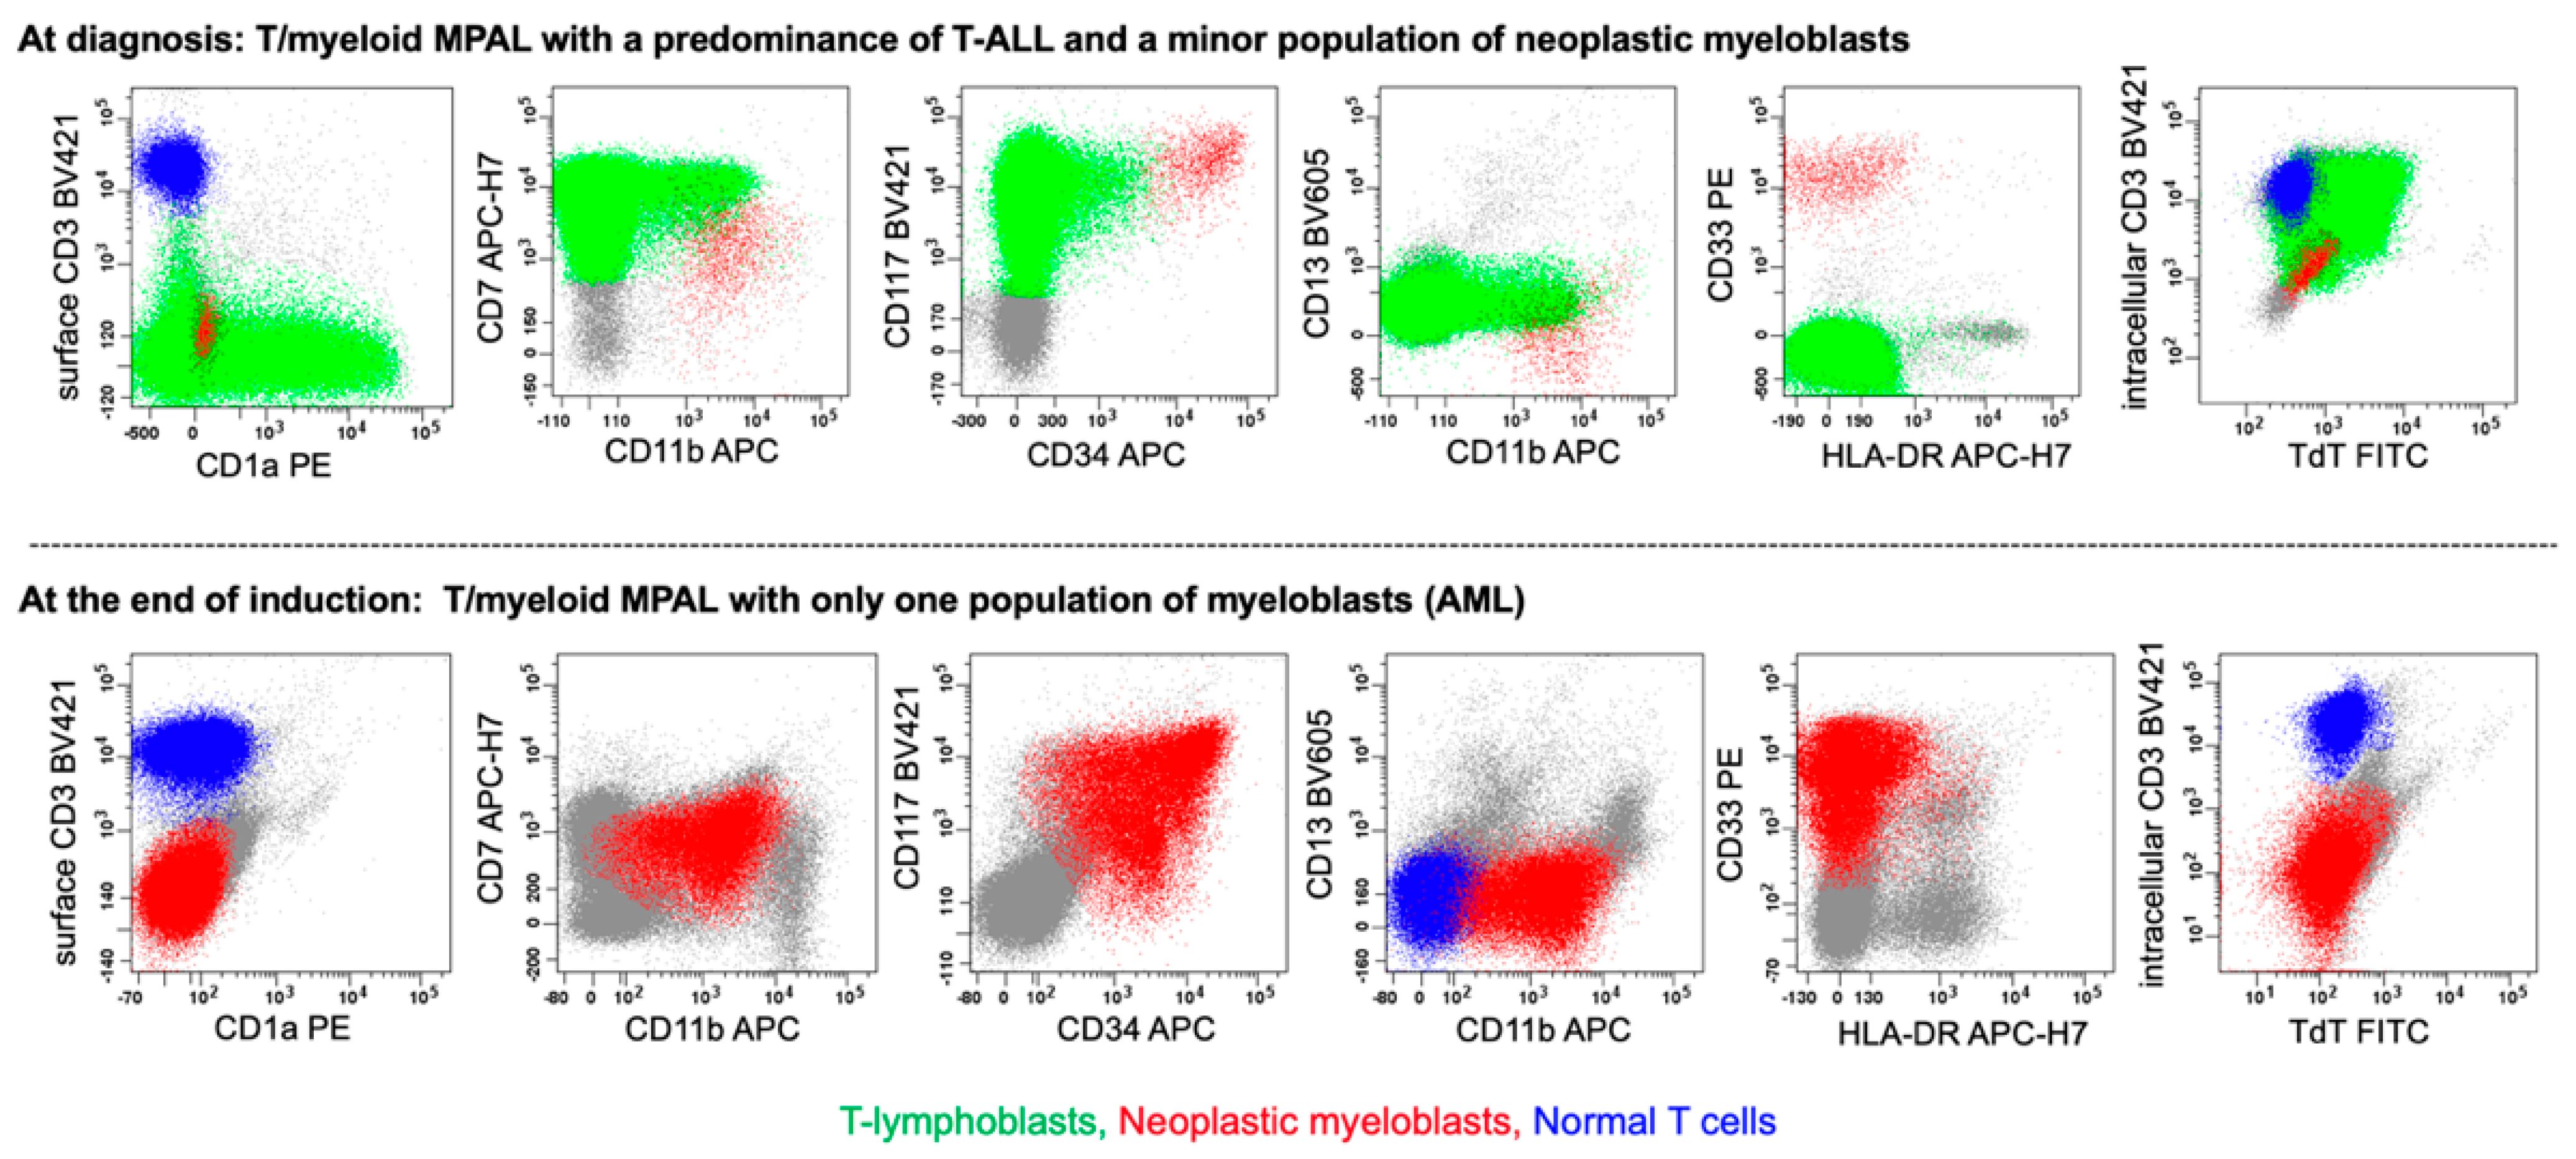
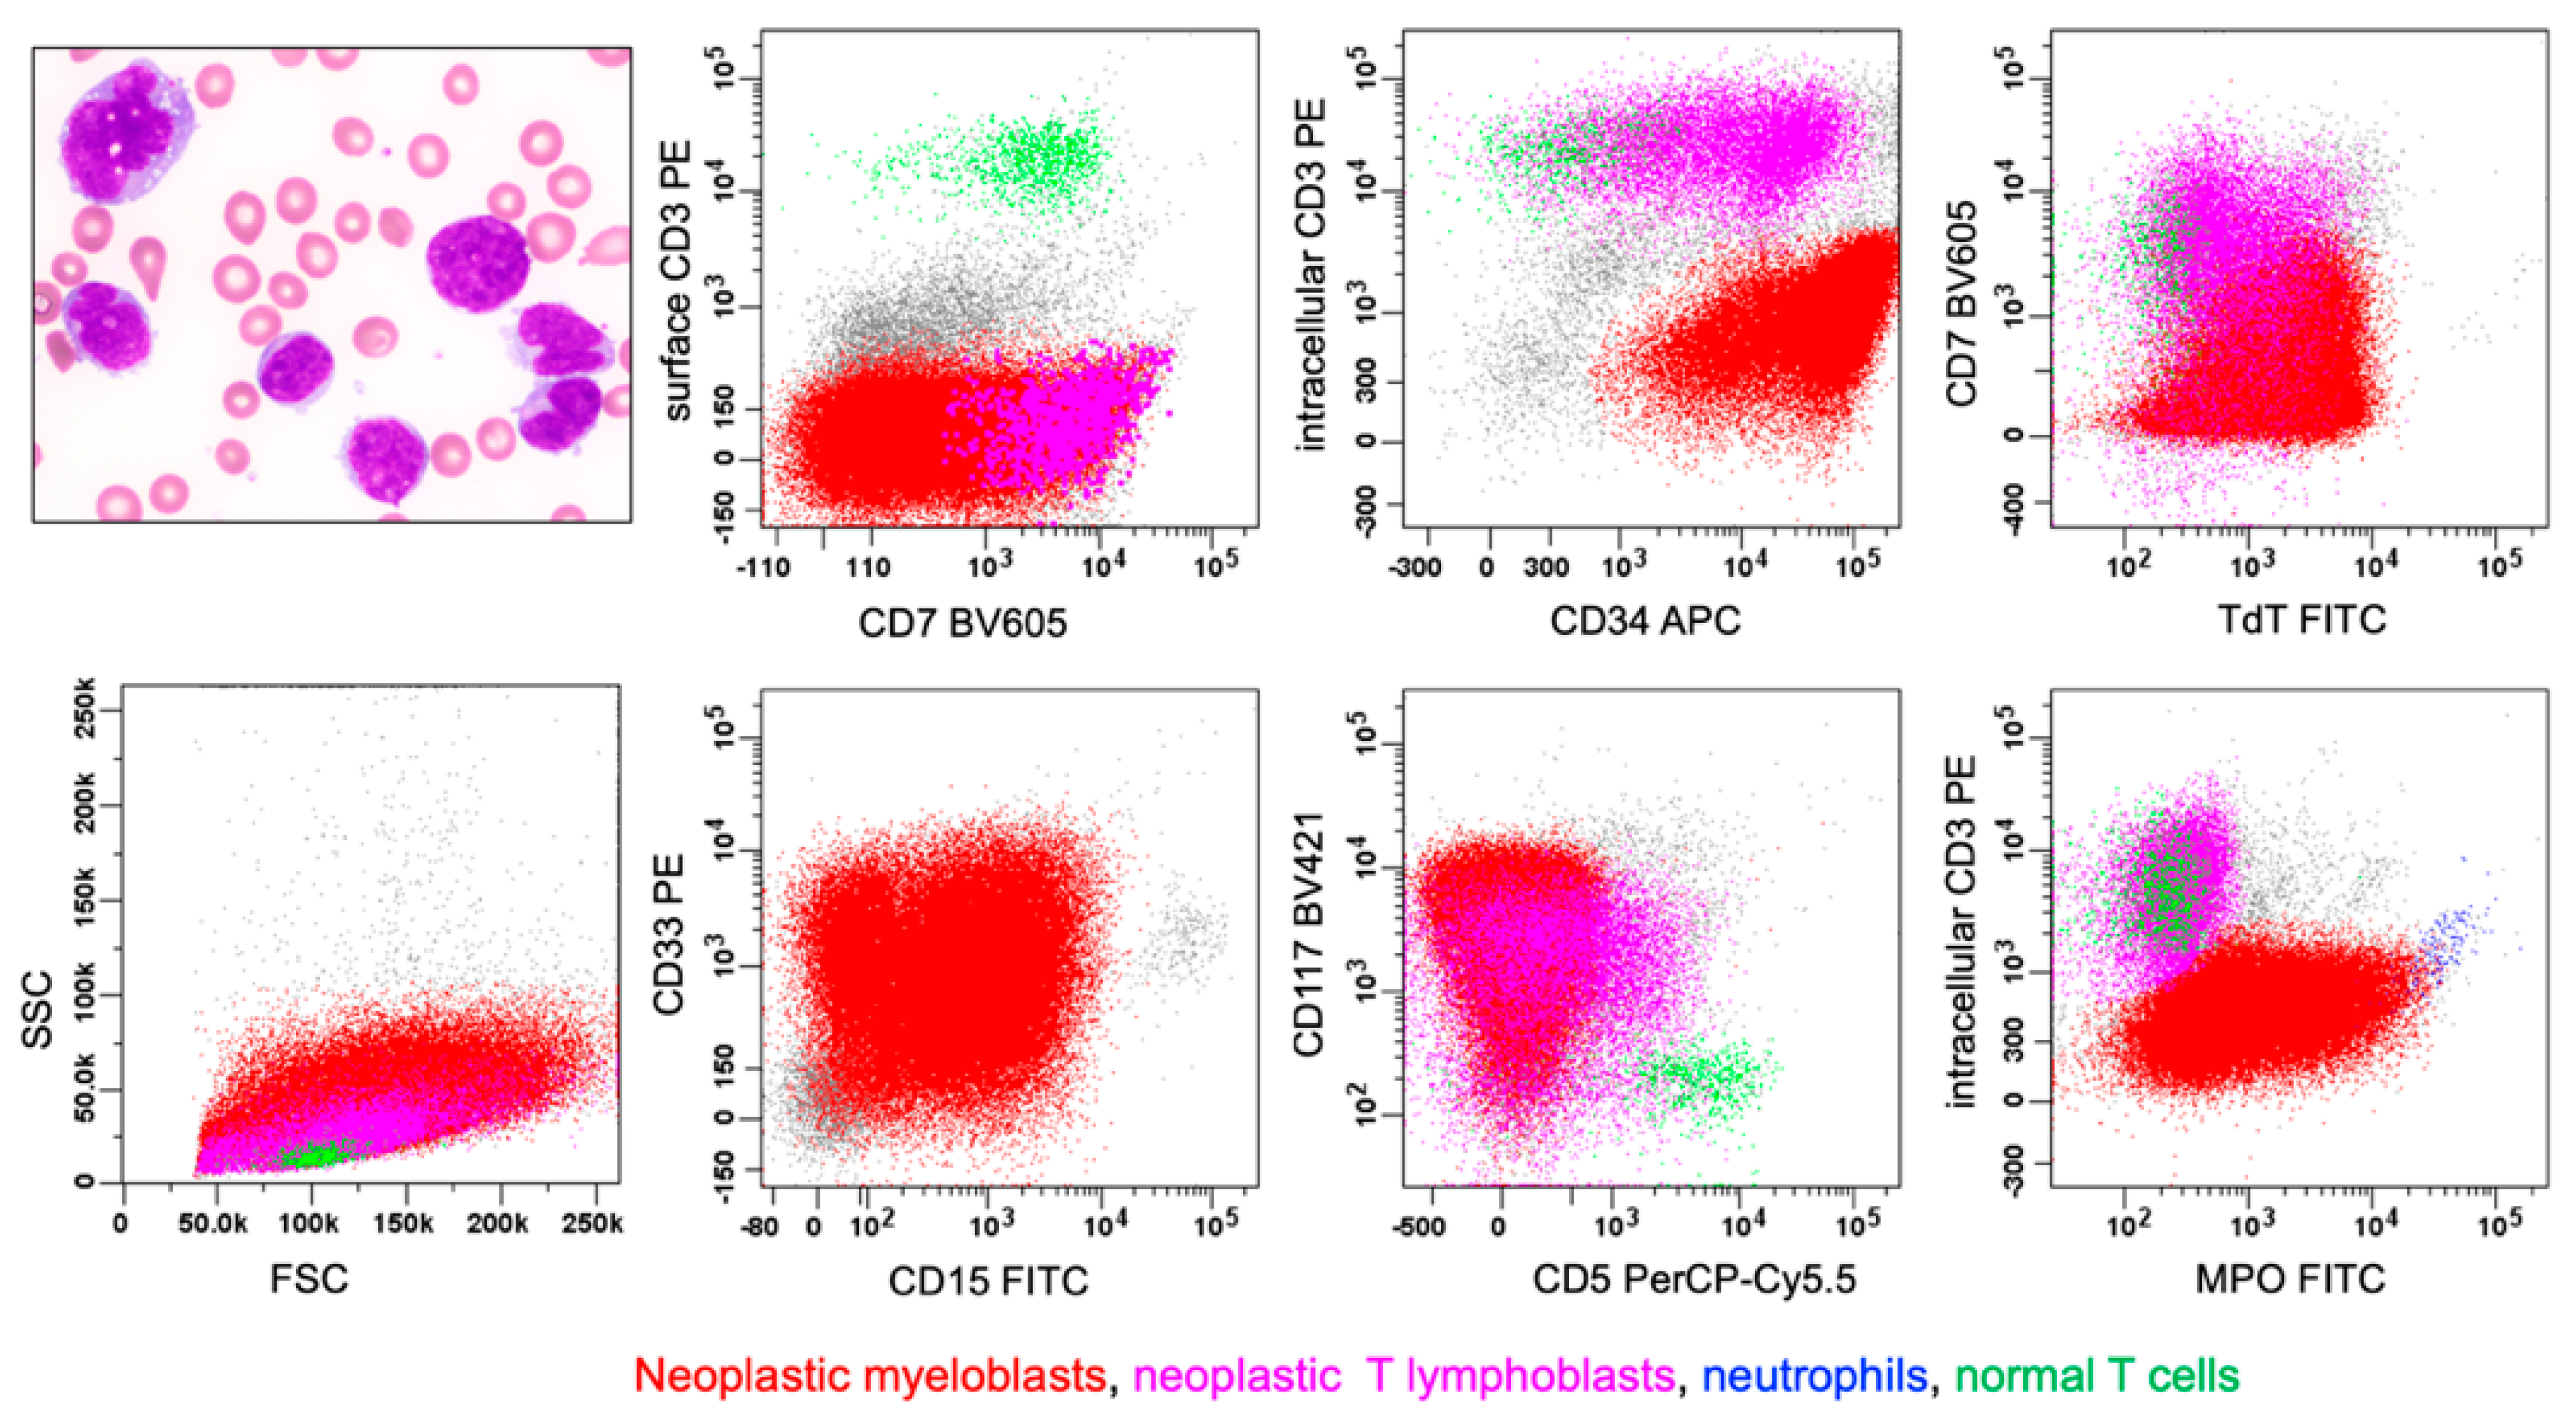
6.2. T/myeloid MPAL
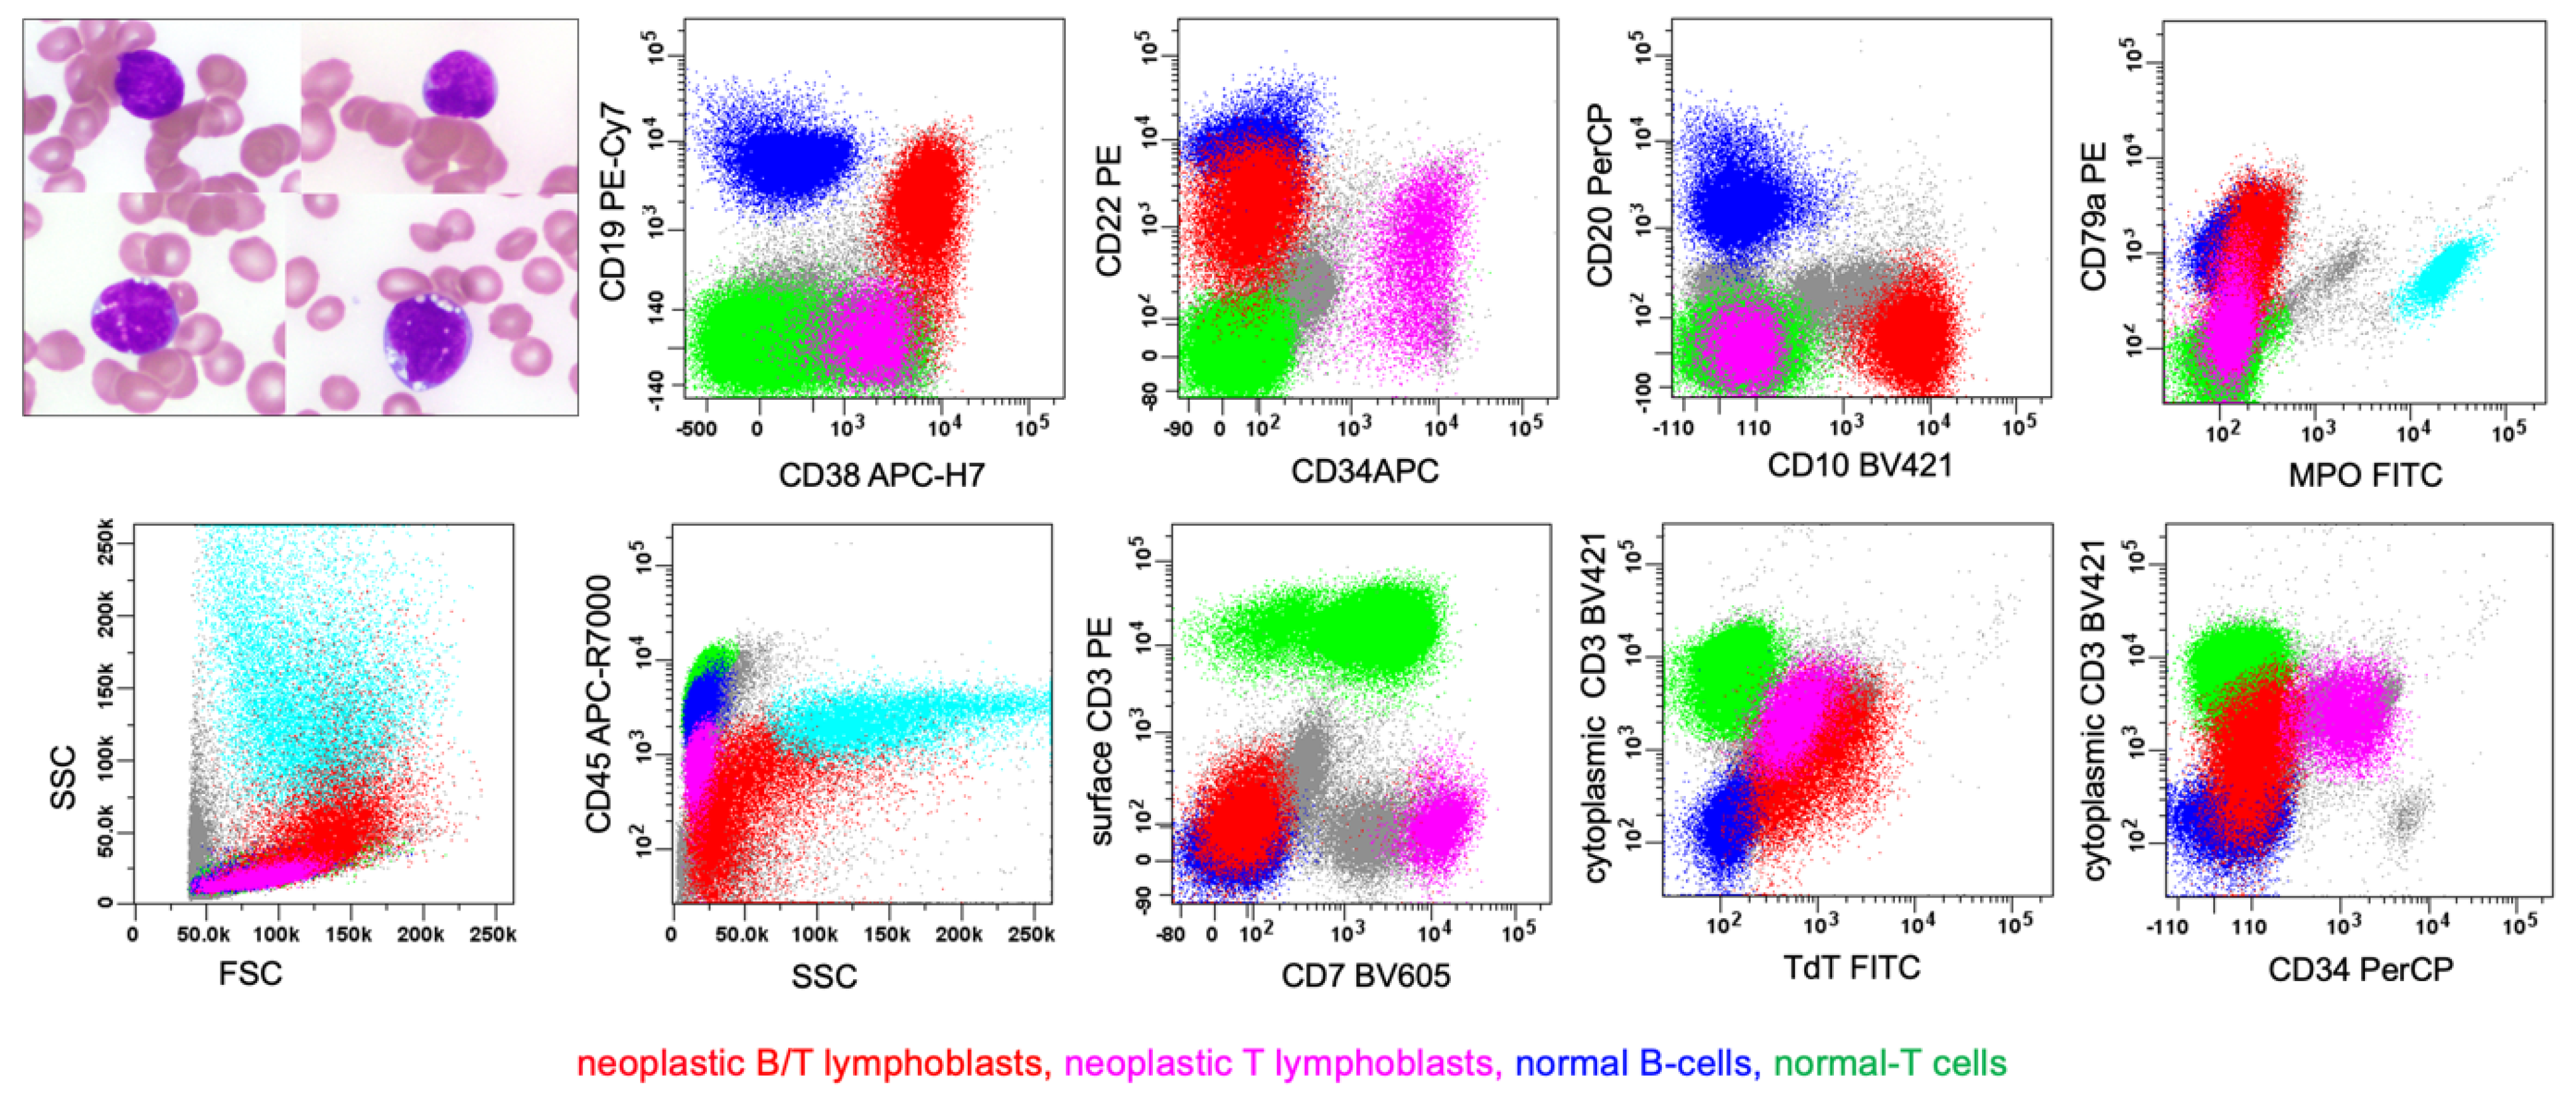
6.3. Rare Type: B/T MPAL
6.4. Rare Type: B/T/myeloid MPAL
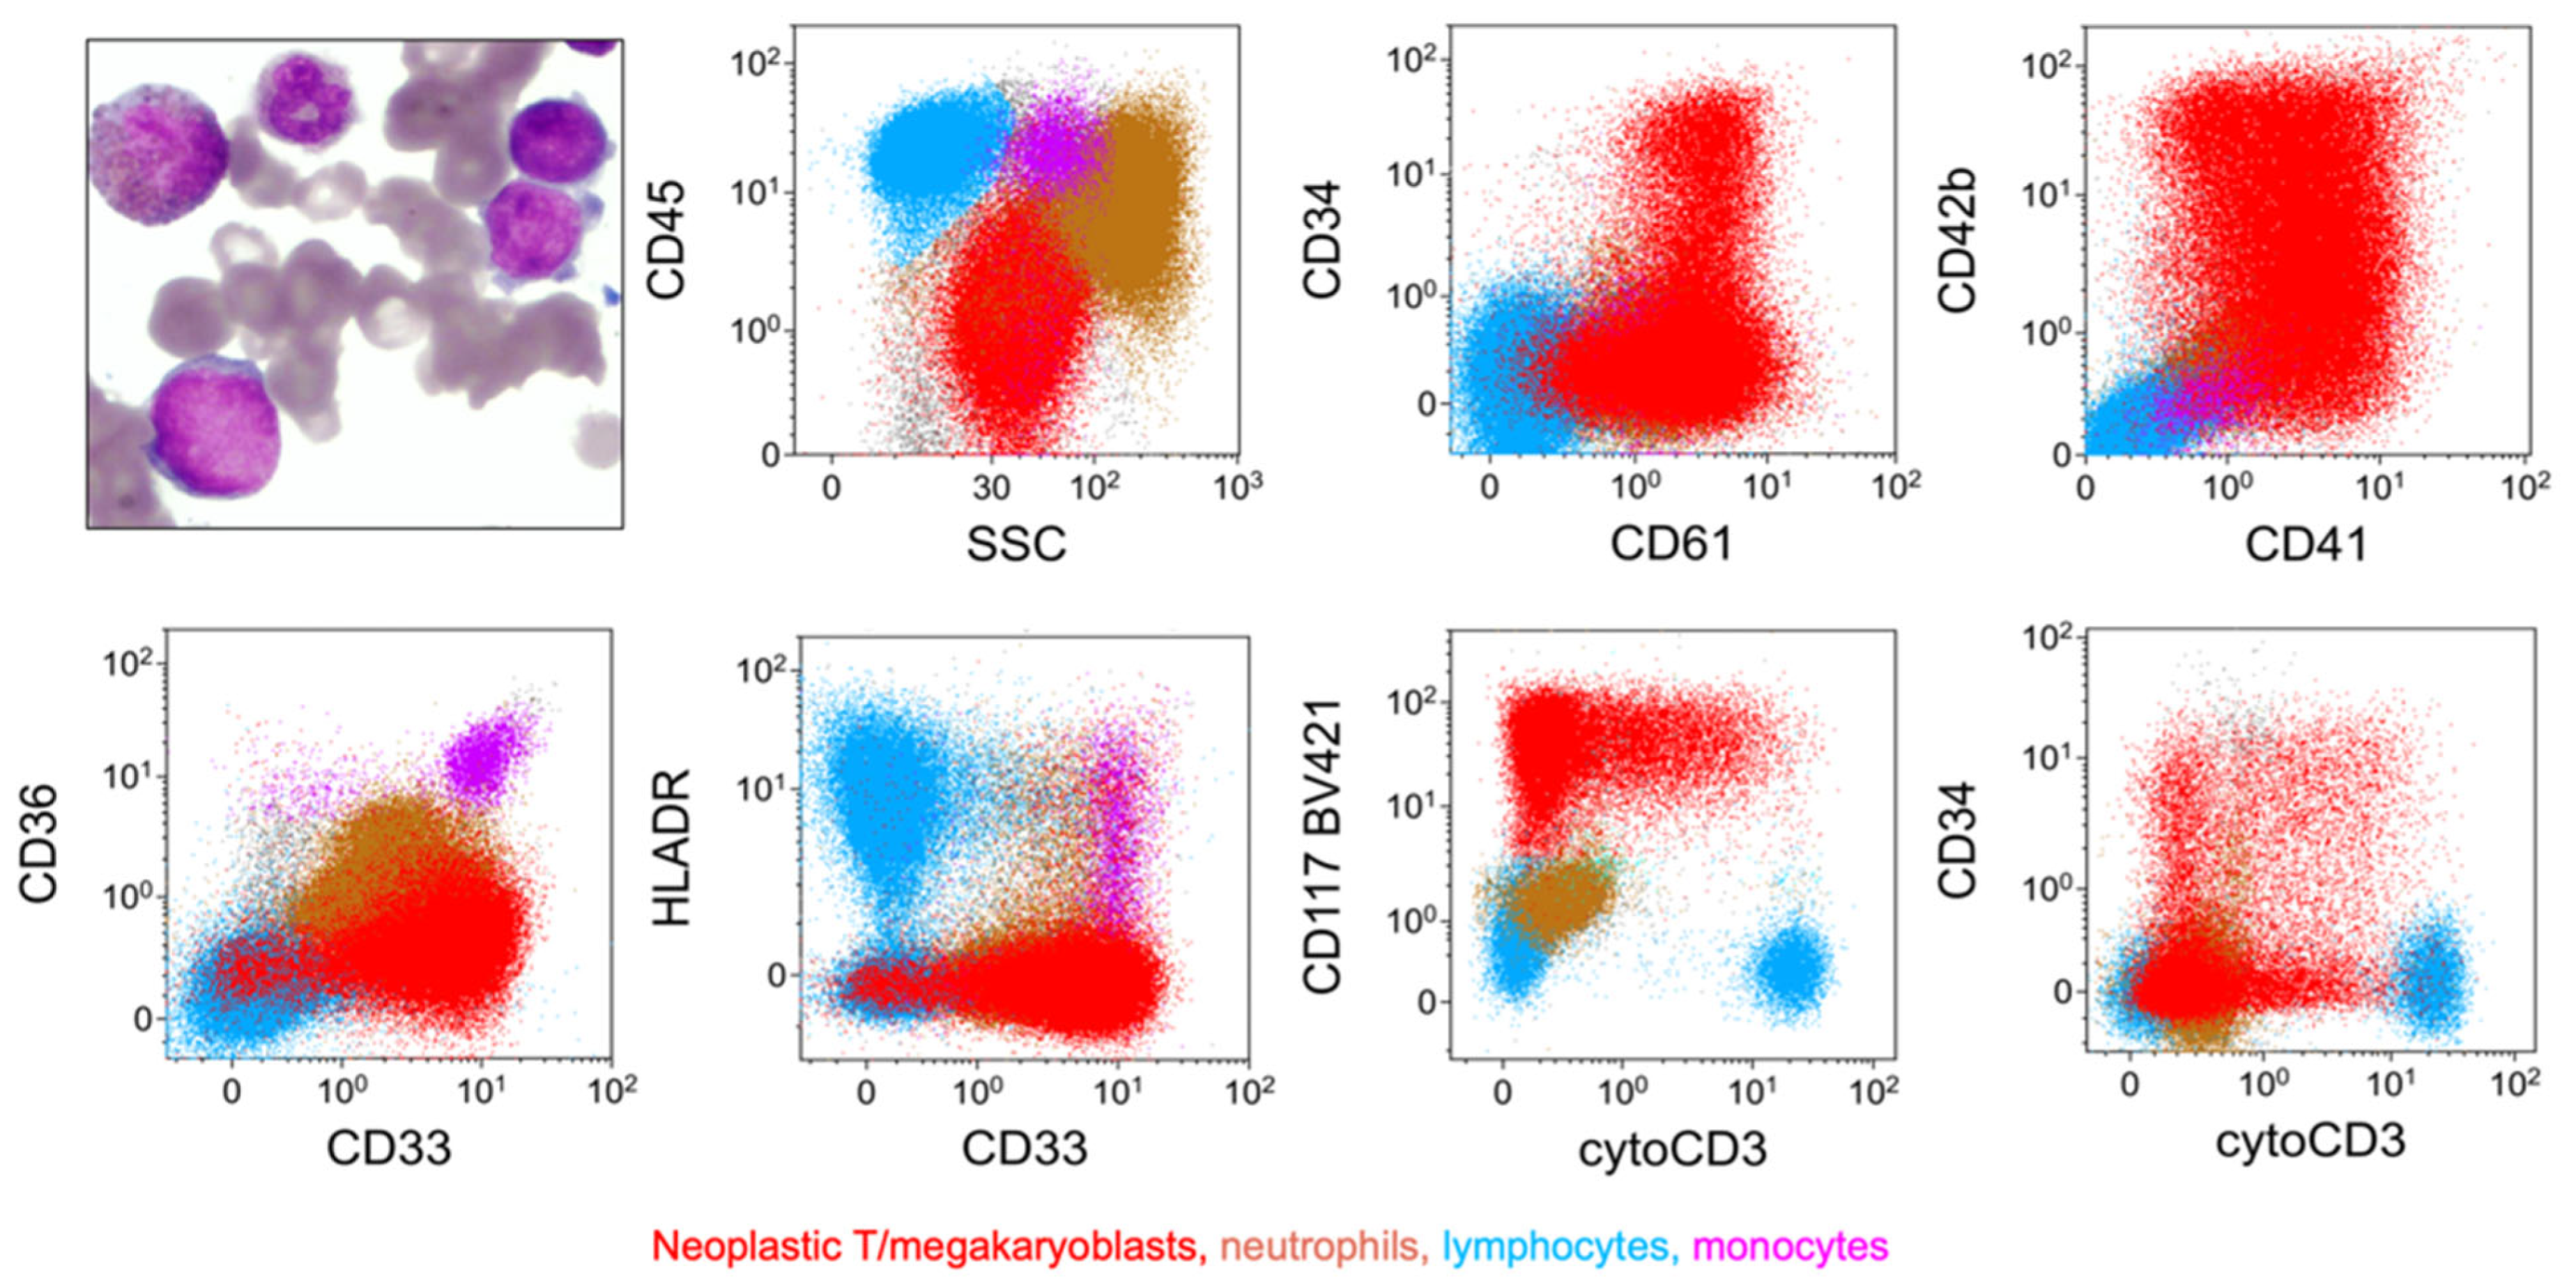
6.5. Rare Type: T/megakaryocytic (T/Mk) MPAL
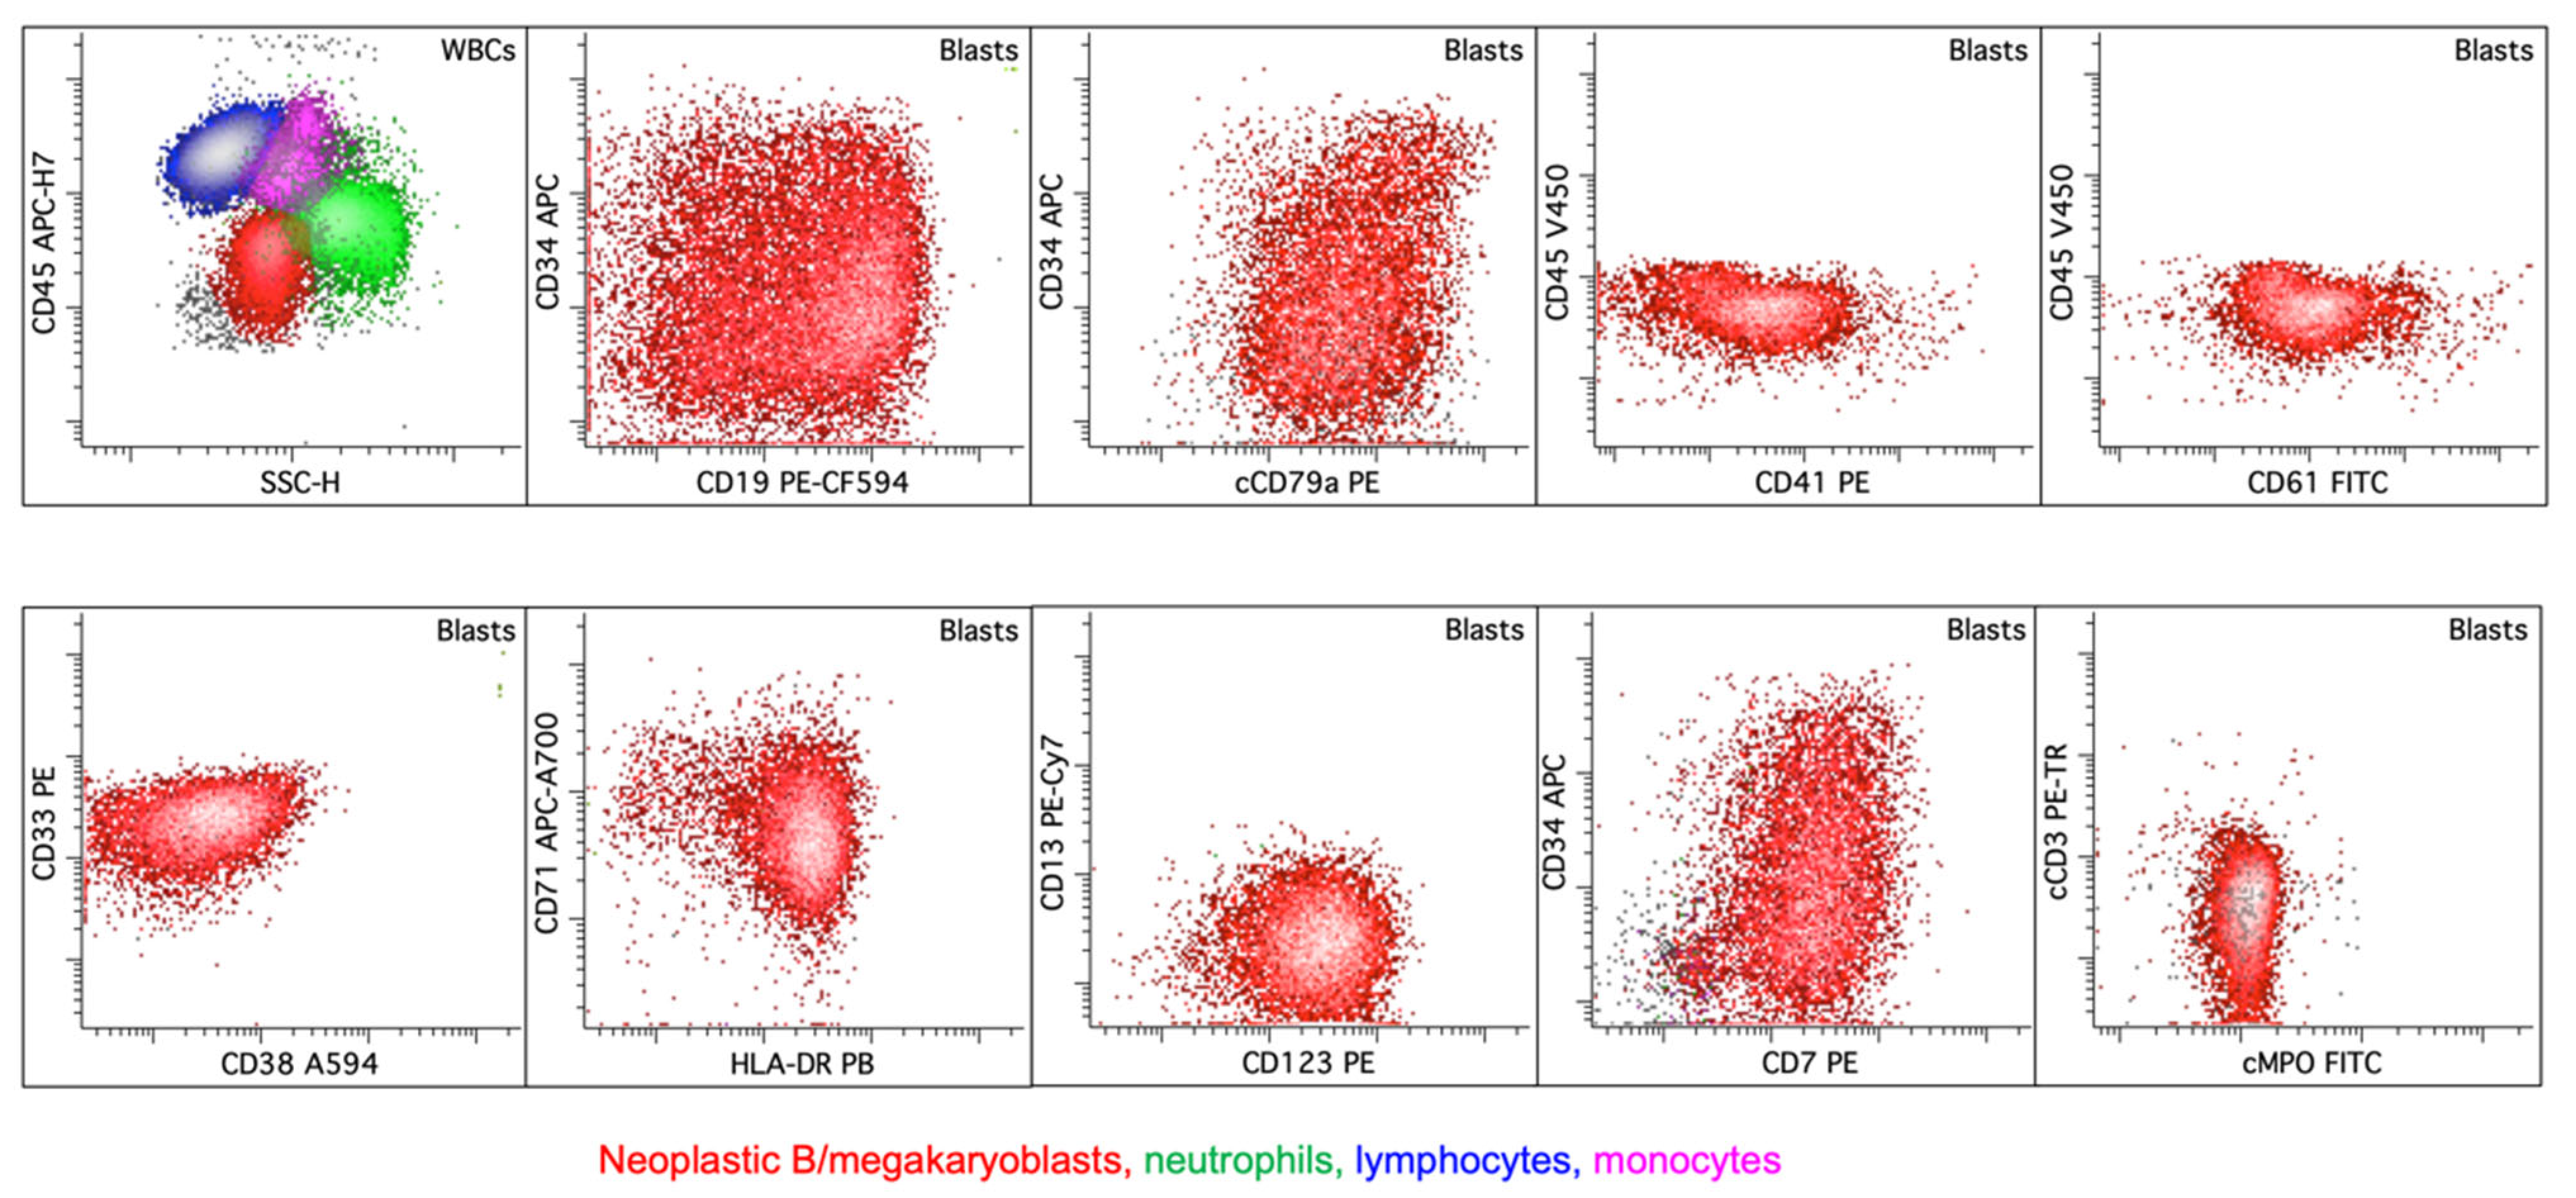
6.6. Rare Type: B/Megakaryocytic (B/Mk) MPAL
6.7. Acute Undifferentiated Leukemia
6.8. Acute Leukemia of Ambiguous Lineage, Not Otherwise Specified
7. Differential Diagnosis of MPAL from Its Immunophenotypic Mimics
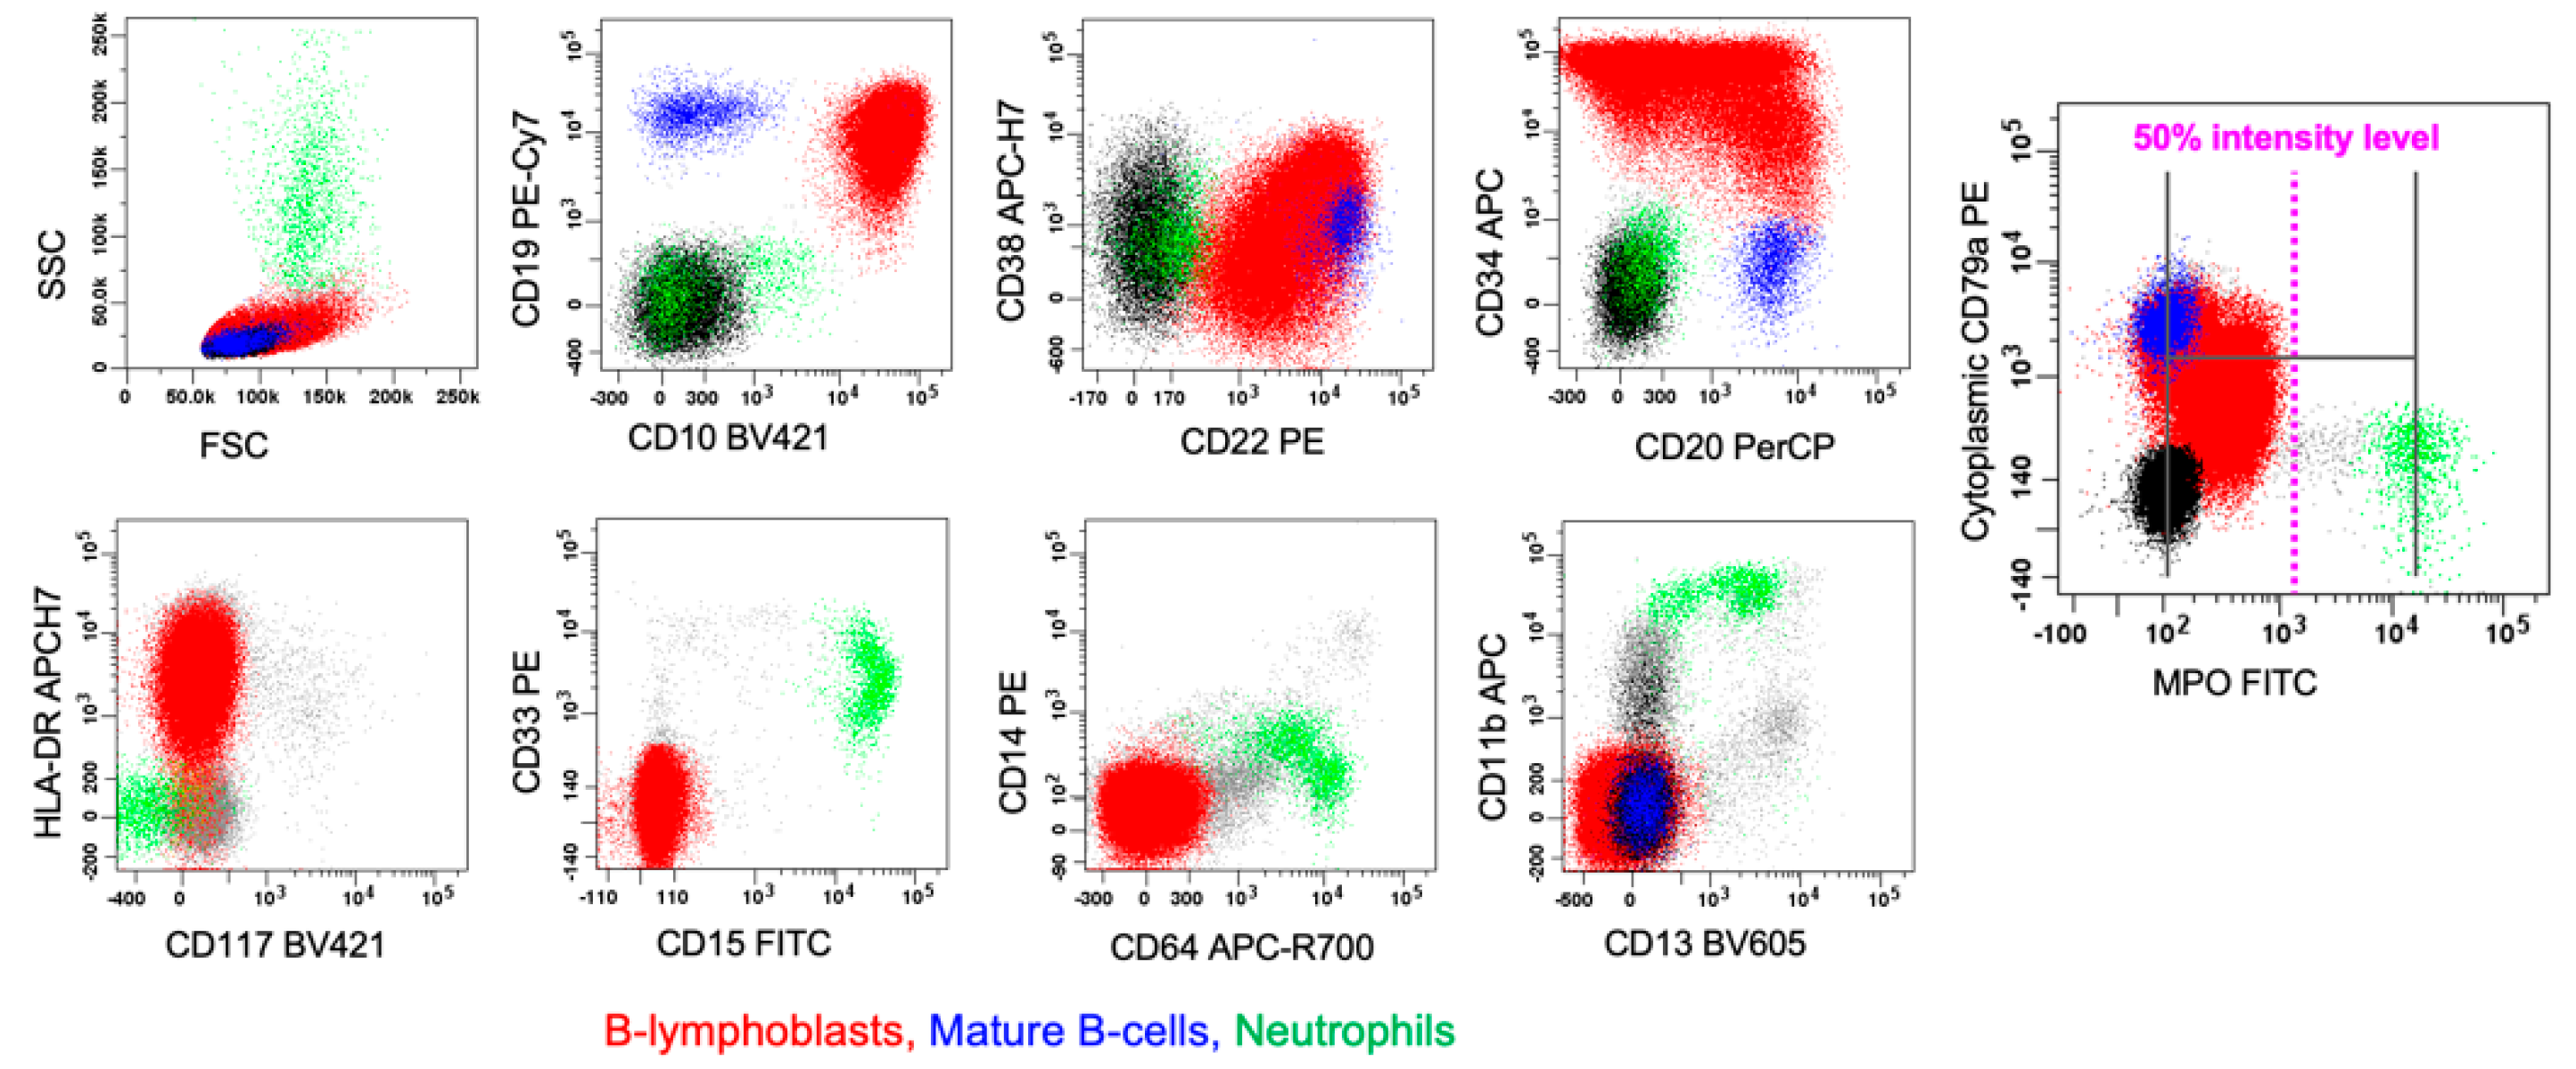
7.1. B-ALL with Dim MPO Expression
7.2. AML with RUNX1::RUNX1T1
7.3. ETP-ALL
7.4. Myeloid and Lymphoid Neoplasm with Tyrosine Kinase Gene Fusions
8. Conclusions
Author Contributions
Funding
Acknowledgments
Conflicts of Interest
Abbreviations
| WHO-HEM5 | The 5th edition of the World Health Organization Classification of Tumors of the Hematopoietic and Lymphoid Tissues |
| ICC | The International Consensus Classification |
| ALAL | Acute leukemia of ambiguous lineage |
| MPAL | Mixed-phenotype acute leukemia |
| AUL | Acute undifferentiated leukemia |
| AML | Acute myeloid leukemia |
| ALL | Lymphoblastic leukemia |
| AML-MR | A subtype of AML with myelodysplasia-related (MR) changes |
| MPO | Myeloperoxidase |
| Lineage-defining markers | Markers used to assign the lineage differentiation for diagnosis of MPAL by the WHO-HEM5/ICC, such as CD3 and MPO |
| Lineage-associated markers | Markers commonly expressed but not specific for the lineage commitment, such as CD13 and CD33 |
References
- Khoury, J.D.; Solary, E.; Abla, O.; Akkari, Y.; Alaggio, R.; Apperley, J.F.; Bejar, R.; Berti, E.; Busque, L.; Chan, J.K.C.; et al. The 5th edition of the World Health Organization Classification of Haematolymphoid Tumours: Myeloid and Histiocytic/Dendritic Neoplasms. Leukemia 2022, 36, 1703–1719. [Google Scholar] [CrossRef] [PubMed]
- Weinberg, O.K.; Arber, D.A.; Döhner, H.; Mullighan, C.G.; Orgel, E.; Porwit, A.; Stone, R.M.; Borowitz, M.J. The International Consensus Classification of acute leukemias of ambiguous lineage. Blood 2023, 141, 2275–2277. [Google Scholar] [CrossRef]
- Wood, B. Acute Leukaemias of Mixed or Ambiguous Lineage. In Haematolymphoid Tumours [Internet], 5th ed.; International Agency for Research on Cancer, Ed.; WHO Classification of Tumours Editorial Board: Lyon, France, 2024; WHO Classification of Tumors Series, Volume 11; Available online: https://tumourclassification.iarc.who.int/chapters/63 (accessed on 25 February 2025).
- Arber, D.A.; Orazi, A.; Hasserjian, R.P.; Borowitz, M.J.; Calvo, K.R.; Kvasnicka, H.-M.; Wang, S.A.; Bagg, A.; Barbui, T.; Branford, S.; et al. International Consensus Classification of Myeloid Neoplasms and Acute Leukemias: Integrating morphologic, clinical, and genomic data. Blood 2022, 140, 1200–1228. [Google Scholar] [CrossRef] [PubMed]
- Zheng, R.; Fuda, F.; Gagan, J.R.; Weinberg, O.K.; Koduru, P.; Cantu, M.; Ludwig, K.; Truscott, J.M.; Collins, R.; Chung, S.; et al. Genomic heterogeneity within B/T mixed phenotype acute leukemia in a context of an immunophenotype. Leuk. Res. Rep. 2024, 21, 100410. [Google Scholar] [CrossRef] [PubMed]
- Galera, P.; Dilip, D.; Derkach, A.; Chan, A.; Zhang, Y.; Persaud, S.; Mishra, T.; Kramer, K.; Kathpalia, M.; Liu, Y.; et al. Defining 2 Biologically and Clinically Distinct Groups in Acute Leukemia with a Mixed Phenotype. Blood, 2025; in press. [Google Scholar] [PubMed]
- Wood, B. Society for Hematopathology Grand Rounds Presentation on “Flow Cytometric Analysis of MPAL: Update on the WHO Classification”. 5 March 2023. Available online: https://www.societyofhematopathology.org/grand-rounds/flow-cytometric-analysis-of-MPAL (accessed on 25 February 2025).
- Han, L.; Zheng, R.; Fuda, F.; Cantu, M.D.; Koduru, P.; Jaso, J.M.; Weinberg, O.; Germans, S.; Chen, M.; Xu, J.; et al. Genomic and Clinicopathological Characterization of CRLF2-Rearranged Mixed Phenotype Acute Leukemia. Pediatr. Blood Cancer. 2025, 72, e31507. [Google Scholar] [CrossRef]
- Borowitz, M.J. Mixed phenotype acute leukemia. Cytom. B Clin. Cytom. 2014, 86, 152–153. [Google Scholar] [CrossRef]
- Fuda, F.; Chen, W. Lineage determination in mixed phenotype acute leukemia: Response to Marcondes et al. Cytom. B Clin. Cytom. 2014, 86, 150–151. [Google Scholar] [CrossRef]
- Demina, I.; Mikhailova, E.; Zerkalenkova, E.; Semchenkova, A.; Roumiantseva, J.; Borkovskaya, A.; Matveev, E.; Abramov, D.; Konovalov, D.; Miakova, N.; et al. Laboratory characterization of the pediatric B/T subtype of mixed-phenotype acute leukemia: Report of a case series. Am. J. Clin. Pathol. 2024, 162, 180–190. [Google Scholar] [CrossRef]
- Oberley, M.J.; Li, S.; Orgel, E.; Phei Wee, C.; Hagiya, A.; O’Gorman, M.R.G. Clinical Significance of Isolated Myeloperoxidase Expression in Pediatric B-Lymphoblastic Leukemia. Am. J. Clin. Pathol. 2017, 147, 374–381. [Google Scholar] [CrossRef]
- Weinberg, O.K.; Dennis, J.; Zia, H.; Chen, P.; Chu, A.; Koduru, P.; Luu, H.S.; Fuda, F.; Chen, W. Adult mixed phenotype acute leukemia (MPAL): B/myeloid MPAL(isoMPO) is distinct from other MPAL subtypes. Int. J. Lab. Hematol. 2023, 45, 170–178. [Google Scholar] [CrossRef]
- Patkar, N.; Bhanshe, P.; Rajpal, S.; Joshi, S.; Chaudhary, S.; Chatterjee, G.; Tembhare, P.; Dhamne, C.; Prasad, M.; Moulik, N.R.; et al. NARASIMHA: Novel Assay based on Targeted RNA Sequencing to Identify ChiMeric Gene Fusions in Hematological Malignancies. Blood Cancer J. 2020, 10, 50. [Google Scholar] [CrossRef] [PubMed]
- Yan, L.; Ping, N.; Zhu, M.; Sun, A.; Xue, Y.; Ruan, C.; Drexler, H.G.; MacLeod, R.A.F.; Wu, D.; Chen, S. Clinical, immunophenotypic, cytogenetic, and molecular genetic features in 117 adult patients with mixed-phenotype acute leukemia defined by WHO-2008 classification. Haematologica 2012, 97, 1708–1712. [Google Scholar] [CrossRef] [PubMed]
- Matutes, E.; Pickl, W.F.; Veer, M.V.; Morilla, R.; Swansbury, J.; Strobl, H.; Attarbaschi, A.; Hopfinger, G.; Ashley, S.; Bene, M.C.; et al. Mixed-phenotype acute leukemia: Clinical and laboratory features and outcome in 100 patients defined according to the WHO 2008 classification. Blood 2011, 117, 3163–3171. [Google Scholar] [CrossRef] [PubMed]
- Takahashi, K.; Wang, F.; Morita, K.; Yan, Y.; Hu, P.; Zhao, P.; Zhar, A.A.; Wu, C.J.; Gumbs, C.; Little, L.; et al. Integrative genomic analysis of adult mixed phenotype acute leukemia delineates lineage associated molecular subtypes. Nat. Commun. 2018, 9, 2670. [Google Scholar] [CrossRef]
- Alexander, T.B.; Gu, Z.; Iacobucci, I.; Dickerson, K.; Choi, J.K.; Xu, B.; Payne-Turner, D.; Yoshihara, H.; Loh, M.L.; Horan, J.; et al. The genetic basis and cell of origin of mixed phenotype acute leukaemia. Nature 2018, 562, 373–379. [Google Scholar] [CrossRef]
- Wang, Q.; Cai, W.Z.; Wang, Q.R.; Zhu, M.Q.; Yan, L.Z.; Yu, Y.; Bao, X.B.; Shen, H.J.; Yao, H.; Xie, J.D.; et al. Integrative genomic and transcriptomic profiling reveals distinct molecular subsets in adult mixed phenotype acute leukemia. Am. J. Hematol. 2022, 98, 66–78. [Google Scholar] [CrossRef]
- Zaliova, M.; Winkowska, L.; Stuchly, J.; Fiser, K.; Triska, P.; Zwyrtkova, M.; Hrusak, O.; Starkova, J.; Sramkova, L.; Stary, J.; et al. A novel class of ZNF384 aberrations in acute leukemia. Blood Adv. 2021, 5, 4393–4397. [Google Scholar] [CrossRef]
- Shinsuke, H.; Kentaro, O.; Kazuhiko, N.; Hitoshi, I.; Yukihide, M.; Kohji, O.; Akinori, Y.; Kazuki, T.; Yuya, S.; Ai, Y.; et al. ZNF384-related fusion genes define a subgroup of childhood B-cell precursor acute lymphoblastic leukemia with a characteristic immunotype. Haematologica 2017, 102, 118–129. [Google Scholar]
- McGinnis, E.; Yang, D.; Au, N.; Morrison, D.; Chipperfield, K.M.; Setiadi, A.F.; Liu, L.; Tsang, A.; Vercauteren, S.M. Clinical and laboratory features associated with myeloperoxidase expression in pediatric B-lymphoblastic leukemia. Cytom. B Clin. Cytom. 2021, 100, 446–453. [Google Scholar] [CrossRef]
- Montefiori, L.E.; Bendig, S.; Gu, Z.; Chen, X.; Pölönen, P.; Ma, X.; Murison, A.; Zeng, A.; Garcia-Prat, L.; Dickerson, K.; et al. Enhancer Hijacking Drives Oncogenic BCL11B Expression in Lineage-Ambiguous Stem Cell Leukemia. Cancer Discov. 2021, 11, 2846–2867. [Google Scholar] [CrossRef]
- Di Giacomo, D.; La Starza, R.; Gorello, P.; Pellanera, F.; Kalender Atak, Z.; De Keersmaecker, K.; Pierini, V.; Harrison, C.J.; Arniani, S.; Moretti, M.; et al. 14q32 rearrangements deregulating BCL11B mark a distinct subgroup of T-lymphoid and myeloid immature acute leukemia. Blood 2021, 138, 773–784. [Google Scholar]
- Wang, W.; Beird, H.; Kroll, C.J.; Hu, S.; Bueso-Ramos, C.E.; Fang, H.; Tang, G.; Tang, Z.; Wang, F.; Takahashi, K.; et al. T(6;14)(q25;q32) involves BCL11B and is highly associated with mixed-phenotype acute leukemia, T/myeloid. Leukemia 2020, 34, 2509–2512. [Google Scholar] [CrossRef] [PubMed]
- Montefiori, L.E.; Mullighan, C.G. Redefining the biological basis of lineage-ambiguous leukemia through genomics: BCL11B deregulation in acute leukemias of ambiguous lineage. Best Pract. Res. Clin. Haematol. 2021, 34, 101329. [Google Scholar] [CrossRef] [PubMed]
- Dimopoulos, Y.P.; Loghavi, S. Acute leukemia of ambiguous lineage with BCL11B rearrangement. Blood 2024, 143, 183. [Google Scholar] [CrossRef]
- Xiao, W.; Bharadwaj, M.; Levine, M.; Farnoud, N.; Pastore, F.; Getta, B.M.; Hultquist, A.; Famulare, C.; Medina, J.S.; Patel, M.A.; et al. PHF6 and DNMT3A mutations are enriched in distinct subgroups of mixed phenotype acute leukemia with T-lineage differentiation. Blood Adv. 2018, 2, 3526–3539. [Google Scholar] [CrossRef] [PubMed]
- Choi, S.M.; Frederiksen, J.K.; Ross, C.W.; Bixby, D.L.; Shao, L. Philadelphia Chromosome-like Mixed-Phenotype Acute Leukemia Demonstrating P2RY8-CRLF2 Fusion and JAK1 Mutation. Am. J. Clin. Pathol. 2017, 148, 523–528. [Google Scholar] [CrossRef]
- Zhang, J.; Ding, L.; Holmfeldt, L.; Wu, G.; Heatley, S.L.; Payne-Turner, D.; Easton, J.; Chen, X.; Wang, J.; Rusch, M.; et al. The genetic basis of early T-cell precursor acute lymphoblastic leukaemia. Nature 2012, 481, 157–163. [Google Scholar] [CrossRef]
- Liu, Y.; Easton, J.; Shao, Y.; Maciaszek, J.; Wang, Z.; Wilkinson, M.R.; McCastlain, K.; Edmonson, M.; Pounds, S.B.; Shi, L.; et al. The genomic landscape of pediatric and young adult T-lineage acute lymphoblastic leukemia. Nat. Genet. 2017, 49, 1211–1218. [Google Scholar] [CrossRef]
- Porwit, A.; Bene, M.C. Multiparameter flow cytometry applications in the diagnosis of mixed phenotype acute leukemia. Cytom. B Clin. Cytom. 2019, 96, 183–194. [Google Scholar] [CrossRef]
- Alexander, T.B.; Orgel, E. Mixed Phenotype Acute Leukemia: Current Approaches to Diagnosis and Treatment. Curr. Oncol. Rep. 2021, 23, 22. [Google Scholar] [CrossRef]
- Mi, X.; Griffin, G.; Lee, W.; Patel, S.; Ohgami, R.; Ok, C.Y.; Wang, S.; Geyer, J.T.; Xiao, W.; Roshal, M.; et al. Genomic and clinical characterization of B/T mixed phenotype acute leukemia reveals recurrent features and T-ALL like mutations. Am. J. Hematol. 2018, 93, 1358–1367. [Google Scholar] [CrossRef]
- Rossi, J.G.; Rubio, P.; Alonso, C.N.; Bernasconi, A.R.; Sajaroff, E.O.; Digiorge, J.; Baialardo, E.; Eandi-Eberle, S.; Guitter, M.; Fernandez-Barbieri, A.; et al. Cytoplasmic CD3 expression in infant acute megakaryoblastic leukemia: A new ambiguous lineage subtype? Leuk. Res. 2018, 71, 6–12. [Google Scholar] [CrossRef]
- Klairmont, M.M.; Choi, J.K. Mixed-phenotype acute leukemia, T/megakaryoblastic. Blood 2018, 132, 2418. [Google Scholar] [CrossRef] [PubMed]
- Panda, D.; Chatterjee, G.; Sardana, R.; Khanka, T.; Ghogale, S.; Deshpande, N.; Badrinath, Y.; Shetty, D.; Narula, G.; Banavali, S.; et al. Utility of CD36 as a novel addition to the immunophenotypic signature of RAM-phenotype acute myeloid leukemia and study of its clinicopathological characteristics. Cytom. B Clin. Cytom. 2021, 100, 206–217. [Google Scholar] [CrossRef] [PubMed]
- Wongworawat, Y.C.; Eskandari, G.; Gaikwad, A.; Marcogliese, A.N.; Ferguson, L.S.; Brackett, J.; Punia, J.N.; Elghetany, M.T.; Kulkarni, R.; Rao, P.H.; et al. Frequent detection of CBFA2T3::GLIS2 fusion and RAM-phenotype in pediatric non-Down syndrome acute megakaryoblastic leukemia: A possible novel relationship with aberrant cytoplasmic CD3 expression. Leuk. Lymphoma 2023, 64, 462–467. [Google Scholar] [CrossRef]
- Khanlari, M.; Wang, L.; Bolen, C.Y.; Otanez, F.S.B.; Furtado, L.V.; Key, L.; Irwin, L.; Wang, W.; Klco, J.M. CBFA2T3::GLIS2-positive acute leukemia with RAM and mixed T/megakaryocytic phenotype. EJHaem 2023, 4, 765–769. [Google Scholar] [CrossRef]
- Weinberg, O.K.; Porwit, A.; Orazi, A.; Hasserjian, R.P.; Foucar, K.; Duncavage, E.J.; Arber, D.A. The International Consensus Classification of acute myeloid leukemia. Virchows Arch. 2023, 482, 27–37. [Google Scholar] [CrossRef] [PubMed]
- Weinberg, O.K.; Hasserjian, R.P.; Baraban, E.; Ok, C.Y.; Geyer, J.T.; Philip, J.K.S.S.; Kurzer, J.H.; Rogers, H.J.; Nardi, V.; Stone, R.M.; et al. Clinical, immunophenotypic, and genomic findings of acute undifferentiated leukemia and comparison to acute myeloid leukemia with minimal differentiation: A study from the bone marrow pathology group. Mod. Pathol. 2019, 32, 1373–1385. [Google Scholar] [CrossRef]
- Bene, M.C.; Porwit, A. Mixed Phenotype/Lineage Leukemia: Has Anything Changed for 2021 on Diagnosis, Classification, and Treatment? Curr. Oncol. Rep. 2022, 24, 1015–1022. [Google Scholar] [CrossRef]
- Cox, A.M.; Kim, D.; Garcia, R.; Fuda, F.S.; Weinberg, O.K.; Chen, W. Automated prediction of acute promyelocytic leukemia from flow cytometry data using a graph neural network pipeline. Am. J. Clin. Pathol. 2024, 161, 264–272. [Google Scholar] [CrossRef]
- Fuda, F.; Chen, M.; Chen, W.; Cox, A. Artificial intelligence in clinical multiparameter flow cytometry and mass cytometry-key tools and progress. Semin. Diagn. Pathol. 2023, 40, 120–128. [Google Scholar] [CrossRef] [PubMed]
- Robinson, J.P.; Ostafe, R.; Iyengar, S.N.; Rajwa, B.; Fischer, R. Flow Cytometry: The Next Revolution. Cells 2023, 12, 1875. [Google Scholar] [CrossRef] [PubMed]
- Brestoff, J.R. Full spectrum flow cytometry in the clinical laboratory. Int. J. Lab. Hematol. 2023, 45 (Suppl. S2), 44–49. [Google Scholar] [CrossRef] [PubMed]
- Ng, D.P.; Simonson, P.D.; Tarnok, A.; Lucas, F.; Kern, W.; Rolf, N.; Bogdanoski, G.; Green, C.; Brinkman, R.R.; Czechowska, K. Recommendations for using artificial intelligence in clinical flow cytometry. Cytom. B Clin. Cytom. 2024, 106, 228–238. [Google Scholar] [CrossRef] [PubMed]


| WHO-HEM5 | ICC |
|---|---|
| ALAL with defining genetic abnormalities MPAL with BCR::ABL1 fusion MPAL with KMT2A rearrangement ALAL with other defined genetic alterations ALAL with BCL11B rearrangement MPAL with ZNF384 rearrangement | MPAL with defining genetic alterations MPAL with BCR::ABL1 MPAL with t(v;11q23.3); KMT2A rearranged MPAL with BCL11B activation MPAL with ZNF384 rearrangement |
| ALAL defined immunophenotypically MPAL, B/myeloid MPAL, T/myeloid MPAL, B/T MPAL, B/T/myeloid MPAL, T/megakaryocytic ALAL NOS Acute undifferentiated leukemia | MPAL with defining immunophenotypic changes B/myeloid MPAL T/myeloid MPAL B/T/myeloid MPAL B/T MPAL ALAL NOS Acute undifferentiated leukemia |
| (a) (Slightly Modified from the WHO-HEM5) * | |
| Lineage * | Criterion |
| B-lineage CD19 strong positive a or CD19 weak positive b | If CD19 strong, one or more of the following is also strongly expressed: CD10, CD22, or CD79a c or If CD19 weak, two or more of the following are also strongly expressed: CD10, CD22, or CD79a c |
| T-lineage CD3 (cytoplasmic or surface) d | Intensity in part exceeds 50% of that of mature T cells by flow cytometry or Immunocytochemistry-positive with non-ζ-chain reagent |
| Myeloid lineage Myeloperoxidase or Monocytic differentiation | MPO intensity in part exceeds 50% of the mature neutrophil level or If two or more of these monocytic-associated markers (i.e., NSE, CD64, CD11c, CD14, or lysozyme) are expressed |
| a CD19 intensity on at least a proportion of the population exceeds 50% of that of normal B-cell progenitors by flow cytometry. b CD19 intensity does not exceed 50% of that of normal B-cell progenitor by flow cytometry on any proportion of the blasts. c CD79a cannot be used as a criterion for B-lineage assignment if the blasts also show T-lineage differentiation. d Using CD3 epsilon-chain antibody. * Specificity on the lineage commitment is enhanced by demonstrating antigen expression recapitulating maturational expression similar to their non-leukemic cellular counterparts and a coordinated pattern of expression of multiple antigens along the same lineage. | |
| (b) (Slightly Modified from ICC) | |
| Lineage | Markers |
| B-lineage | |
| Strong CD19 a plus | ≥1 marker expression of CD10, CD22, or CD79a |
| Weak CD19 plus | ≥1 marker expression of CD10, CD22, or CD79a |
| Consider immunohistochemical stains for B-lineage | PAX5, OCT2, BOB1 |
| T-lineage | |
| CD3 (surface or cytoplasmic) b | |
| Myeloid lineage | |
| MPO or | |
| Monocytic differentiation | CD11c, CD14, CD64, nonspecific esterase (cytochemistry), or lysozyme (IHC) |
| a Expression should be at least similar to that seen in stage I B-cell precursors or mature B cells. b At least a fraction of the blasts should express CD3 intensity similar to that of background mature T cells. | |
Disclaimer/Publisher’s Note: The statements, opinions and data contained in all publications are solely those of the individual author(s) and contributor(s) and not of MDPI and/or the editor(s). MDPI and/or the editor(s) disclaim responsibility for any injury to people or property resulting from any ideas, methods, instructions or products referred to in the content. |
© 2025 by the authors. Licensee MDPI, Basel, Switzerland. This article is an open access article distributed under the terms and conditions of the Creative Commons Attribution (CC BY) license (https://creativecommons.org/licenses/by/4.0/).
Share and Cite
Fuda, F.; Chen, W. Acute Leukemia of Ambiguous Lineage: Diagnosis and Evaluation by Flow Cytometry. Cancers 2025, 17, 871. https://doi.org/10.3390/cancers17050871
Fuda F, Chen W. Acute Leukemia of Ambiguous Lineage: Diagnosis and Evaluation by Flow Cytometry. Cancers. 2025; 17(5):871. https://doi.org/10.3390/cancers17050871
Chicago/Turabian StyleFuda, Franklin, and Weina Chen. 2025. "Acute Leukemia of Ambiguous Lineage: Diagnosis and Evaluation by Flow Cytometry" Cancers 17, no. 5: 871. https://doi.org/10.3390/cancers17050871
APA StyleFuda, F., & Chen, W. (2025). Acute Leukemia of Ambiguous Lineage: Diagnosis and Evaluation by Flow Cytometry. Cancers, 17(5), 871. https://doi.org/10.3390/cancers17050871