Simple Summary
Biology-guided radiotherapy (BgRT) uses PET radiotracer emissions as image guidance to deliver adaptive targeted radiation to tumors. Due to limitations of the PET radiotracer 18F-Fluorodeoxyglucose ([18F]FDG), there is significant interest in developing alternative radiotracers for BgRT. Fibroblast activation protein (FAP) is a transmembrane protein that is overexpressed in cancer-associated fibroblasts within multiple tumor types with minimal expression in normal tissues. Fibroblast activation protein inhibitors (FAPIs) bind avidly to FAP and can be labeled with a radiotracer such as Gallium-68 (68Ga). Multiple studies have compared [68Ga]Ga-FAPI-04 vs. [18F]FDG for diagnostic imaging, but no one has compared the utility of [68Ga]Ga-FAPI-04 vs. [18F]FDG for BgRT. This study was designed to compare calculated parameters from [68Ga]Ga-FAPI-04 vs. [18F]FDG PET-CT to determine if FAPI-04 can be a useful biological fiducial for BgRT. The findings from this work could have a significant impact on the field by providing evidence that [68Ga]Ga-FAPI-04 is a superior agent for image-guided adaptive radiation therapy.
Abstract
Background/Objectives: Biology-guided radiotherapy (BgRT) is a novel technology utilizing PET radiotracer emissions to deliver image-guided adaptive RT. 18F-Fluorodeoxyglucose ([18F]FDG) is the most common PET radiotracer but has background in the liver and brain because it is taken up by viable tumor cells as well as inflammatory cells. Fibroblast activation protein (FAP) is overexpressed in cancer-associated fibroblasts with minimal expression in normal tissues. FAP inhibitors (FAPIs) bind to FAP, and a FAPI labeled with Gallium-68 (68Ga) is a novel radiotracer with high tumor selectivity. Multiple studies have compared [68Ga]Ga-FAPI-04 vs. [18F]FDG for diagnostic imaging, but [68Ga]Ga-FAPI-04 vs. [18F]FDG have never been compared in terms of their utility for BgRT. Purpose: This study was designed to assess the utility of [68Ga]Ga-FAPI-04 vs. [18F]FDG for BgRT used to treat pancreatic, liver, lung, head and neck, and cervical cancers. Methods: A radiation oncologist specializing in each cancer contoured the gross tumor volume (GTV) on [18F]FDG PET-CT and [68Ga]Ga-FAPI-04 PET-CT images. Auto-contours were generated using an auto-threshold of 40% of the maximum Standardized Uptake Value (SUV). The suitability of [68Ga]Ga-FAPI-04 vs. [18F]FDG for BgRT was evaluated by comparing Normalized Net Activity Concentration (NNA) and Normalized Target Signal (NTS) for each cancer. Results: NNA and NTS for [68Ga]Ga-FAPI-04 and [18F]FDG met the requirements for [18F]FDG-guided BgRT (NNA > 5.0 kBq/mL, NTS > 2.7) for all disease sites. NNAFAPI was significantly greater than NNAFDG for pancreatic, H&N, and cervical cancer. NTSFAPI was significantly greater than NTSFDG for pancreatic, liver, and lung cancer. Conclusions: [68Ga]Ga-FAPI-04 is a novel radiotracer for BgRT and has the greatest potential impact in the treatment of pancreatic cancer.
1. Introduction
Biology-guided radiotherapy (BgRT) continuously acquires PET signals to provide real-time image-guided radiation delivery [1]. This method may facilitate the treatment of oligometastatic or oligoprogressive lesions based on their PET radiotracer avidity, thus providing a novel motion management approach in which the PET signal acts as a fiducial for radiation treatment [2,3,4]. [18F]FDG is the most commonly used radiotracer for PET-CT. However, there are multiple limitations to using [18F]FDG as a radiotracer for BgRT. [18F]FDG is not specific for tumor cells and is taken up by all proliferating cells, resulting in significant background in the brain, liver, and bladder, and is a glucose analog, so patients must fast before imaging to ensure maximal tumor uptake [5].
There is significant interest in developing new radiotracers in both the diagnostic setting (for PET imaging) and the therapeutic setting (as a systemically injected radiopharmaceutical). Fibroblast activation protein (FAP) is a type II transmembrane serine protease that is overexpressed in cancer-associated fibroblasts (CAFs) found in most epithelial tumors [6]. Multiple groups have developed radionuclide-labeled fibroblast activation protein inhibitors (FAPIs) that specifically bind to FAP for diagnostic and therapeutic purposes [7,8].
FAPI-PET-CT can image many different tumors (including pancreatic, lung, esophageal, breast, and gastric cancers) [9,10]. These radionuclide-labeled FAPI compounds have less uptake in the brain and liver, allowing for more accurate tumor delineation with less background. In addition, FAPI PET-CT is better than [18F]FDG PET-CT for detecting metastatic lymph nodes and distant metastases [6,11]. While there are multiple studies comparing characteristics of FAPI vs. [18F]FDG for diagnostic imaging [12,13], there has never been a comparison of FAPI vs. [18F]FDG in fulfilling the prerequisites for the delivery of BgRT.
Gallium-68 [68Ga]FAPI-04 is a well-studied quinoline-based radiolabeled compound targeting FAP with very low physiologic background uptake and good stability in serum that is quickly removed from normal organs in vivo. The chemical structures of [68Ga]Ga-FAPI-04 and [18F]FDG are shown in the Supplementary Information. Since [68Ga]Ga-FAPI-04 PET can be performed without fasting and has a short uptake time, it has the potential to improve patient comfort and accelerate clinical workflow. In this study, we sought to quantitatively assess the utility of [68Ga]Ga-FAPI-04 vs. [18F]FDG for biology-guided radiotherapy by comparing two key characteristics of radiotracers, the Normalized Net Activity Concentration (NNA) (goal > 5 kBq/mL to deliver BgRT) and the Normalized Target Signal (NTS) (goal > 2.7 for BgRT treatment planning & > 2.0 for BgRT delivery) [14]. To do this, we compared and analyzed PET imaging datasets of patients with a diverse group of solid tumors imaged with both [18F]FDG and [68Ga]Ga-FAPI-04.
2. Materials and Methods
This study was conducted under IRB 20039. PET-CTs were obtained for 50 patients with liver, pancreas, lung, head and neck, and cervical cancers using both [18F]FDG and [68Ga]Ga-FAPI-04 radiotracers (n = 10 patients per disease site with 4 DICOM image sets per patient (PET and CT for both [18F]FDG and [68Ga]Ga-FAPI-04). A radiation oncologist with expertise in each disease site contoured the gross tumor volume (GTV) on both the [18F]FDG PET-CT images and [68Ga]Ga-FAPI-04 PET-CT images. In addition, auto-contours were generated on the FDG PET-CT and FAPI PET-CT images using an auto-threshold of 40% of the maximum Standardized Uptake Value (SUV) for each lesion using Varian VelocityTM version 3.2 (Figure 1A).
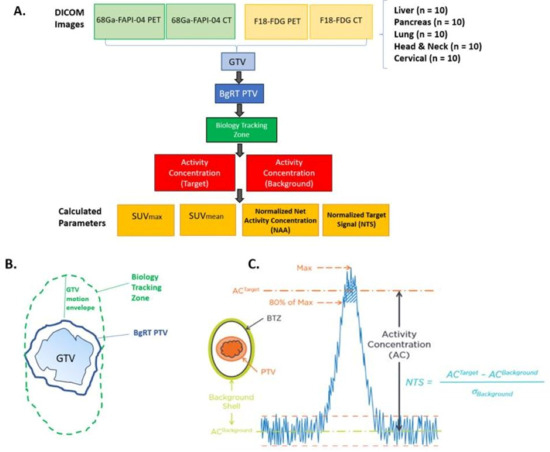
Figure 1.
Schematic of methods and definitions for [18F]FDG vs. [68Ga]Ga-FAPI-04 PET study. (A). Study design: PET-CTs were obtained for 50 patients with liver, pancreas, lung, head and neck and cervical cancers using both [18F]FDG and [68Ga]Ga-FAPI-04 (n = 10 patients per disease site with 4 DICOM image sets each (PET and CT for both tracers). The gross tumor volume (GTV) was contoured on the [18F]FDG and [68Ga]Ga-FAPI-04 PET-CT images. The following parameters were then measured or calculated: GTV (in cc), SUVmax, volume of GTV receiving 80% of SUVmax, SUVmean (mean SUV in the volume receiving 80% of SUVmax), activity concentration of target, activity concentration of background, normalized net activity concentration (NNA), and normalized target signal (NTS). (B). Generating the biology tracking zone (BTZ): To create the BgRT PTV, the GTV was contoured, and a 3–5 mm margin was added based on disease site (see Supplementary Table S1 for more info). To create the biology tracking zone (BTZ), a “GTV motion envelope” was added, incorporating each disease site’s average motion in all directions. (C). Normalized target signal (NTS) was defined as [AC (Target)−AC (Background)]/(Standard Deviation of Background). AC (Activity concentration) of the target was defined as mean AC (in kBq/mL) in the volume of GTV receiving 80% of SUV max. AC (activity concentration) of the background was defined as the mean AC (in kBq/mL) in the background shell (defined as a 3 mm margin around the BTZ).
We chose to use a 40% SUVmax threshold for both [68Ga]Ga-FAPI-04 and [18F]FDG auto-contouring because this is the most common maximum standardized uptake value (SUVmax) used to delineate the GTV using FDG [15]. While [68Ga]Ga-FAPI-04 PET has not yet been used in radiation treatment planning, a 40% SUVmax threshold has been used to compare tumor volume between [68Ga]Ga-FAPI-04 and [18F]FDG [16,17].
To define the BgRT planning tumor volume (PTV), a margin was added to the GTV (3 mm for head and neck cancer and 5 mm expansion for other disease sites). A customized “GTV motion envelope” was added to the BgRT PTV, based on the typical extent of motion observed on 4D-CT scans for each tumor site. The Biology Tracking Zone (BTZ) was defined as the Internal Target Volume (ITV) plus the biological-guidance margin with an added setup margin (Figure 1B). ITV accounts for tumor motion during respiration and is derived from 4D-CT or PET imaging to ensure adequate coverage during radiation treatment. For gastrointestinal tumors near the diaphragm (i.e., pancreatic and liver tumors), it was assumed that these tumors move about 1 cm in the superior-inferior direction and 5 mm in the anterior–posterior direction. For lung cancer, it was assumed that they move uniformly about 1 cm in all directions. For head and neck and cervical tumors, it was assumed that these tumors have minimal (0.2–0.3mm) movement in all directions. The following parameters were calculated for both physician contours and auto-contours: GTV (cc), SUVmax, volume of GTV correlating with 80% of SUVmax, and SUVmean.
To assess the feasibility of biology-guided radiotherapy (BgRT), two unique imaging-derived metrics: Normalized Net Activity concentration (NNA) and Normalized Target Signal (NTS) are required by the FDA to determine whether a radiotracer provides sufficient signal intensity within the tumor (NNA) and adequate contrast relative to surrounding tissue (NTS) to enable BgRT planning and delivery. NNA reflects the absolute radiotracer emission within the target volume, while NTS quantifies the tumor-to-background signal ratio [18,19,20]. Both metrics are essential for ensuring that BgRT systems can reliably track and treat tumors in real time.
The activity concentration of the target was defined as Mean AC (kBq/mL) in the volume of GTV receiving 80% of SUV max. The activity concentration of the Background was defined as mean AC (kBq/mL) in the 3 mm ring around the BTZ. The standard deviation (STD) of the Activity Concentration_Background was measured using Eclipse. The normalized net activity (NNA) Concentration was defined as AC_Target minus AC_Background and corrected by time decay due to individual patient injection time variation. Time decay correction was calculated based on (telapsed−tBgRT) and the half-life of the radiotracer (68.3 min for [68Ga]Ga-FAPI-04 and 109 min for [18F]FDG), where telapsed is the time from injection to image acquisition and tBgRT is estimated as 60 min for [18F]FDG BgRT treatment and 30 min for [68Ga]Ga-FAPI-04. NNA FAPI was further normalized by the ratio of injected activity of [18F]FDG to [68Ga]Ga-FAPI-04 because the amount of [18F]FDG injected compared to [68Ga]Ga-FAPI-04 was significantly higher, as shown in Equation (1) and Equation (2), respectively. The NTS was calculated as follows: (AC_Target−AC_Background)/Standard Deviation of Background (Figure 1C). At the outset of the study, we determined that the Normalized Net Activity Concentration in the target must be >5 kBq/mL to treat patients with [18F]FDG-directed BgRT. In addition, we determined that the Normal Target Signal needs to be >2.7 for BgRT treatment planning and >2.0 for BgRT delivery. Descriptive statistics with 95% confidence intervals were calculated for all parameters. Two-sided paired t-tests were utilized to test for significant differences (α = 0.05) between [68Ga]Ga-FAPI-04 and [18F]FDG for SUV mean, NNA, and NTS.
3. Results
3.1. Normalized Net Activity Concentration (NNA) and Normalized Target Signal (NTS)
The normalized net activity concentration (NNA) was greater than 5.0 kBq/mL for all tumor sites using both [18F]FDG and [68Ga]Ga-FAPI-04, and the normalized target signal (NTS) was greater than 2.7 for all tumor types using both [18F]FDG and [68Ga]Ga-FAPI-04. This suggests that both radiotracers generate a sufficient signal-to-background ratio necessary to deliver BgRT (Figure 2A and Figure 3A). Paired t-tests were utilized to test for significant differences (α = 0.05) between [68Ga]Ga-FAPI-04 and [18F]FDG (Figure 2B,C, and Figure 3B,C). In order to compare the magnitude of difference between NTSFAPI and NTSFDG, the t-ratio (which is the standardized mean difference in NTSFAPI vs. NTSFDG) was also calculated for all disease sites (Figure 4B).
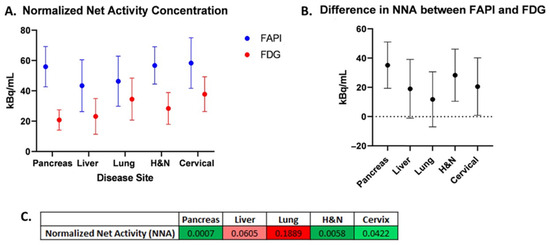
Figure 2.
Normalized net activity concentration (NNA) for [68Ga]Ga-FAPI-04vs. [18F]FDG. (A) Comparison of mean NNAFAPI vs. NNAFDG for each disease site. (B) Difference in mean NNAFAPI and NNAFDG for each disease site. Error bars represent 95% confidence intervals. (C) Table of p-values from two-sided paired t-tests comparing NNA for [68Ga]Ga-FAPI-04 and [18F]FDG (green shades correspond to p < 0.05; red shades correspond to p > 0.05).
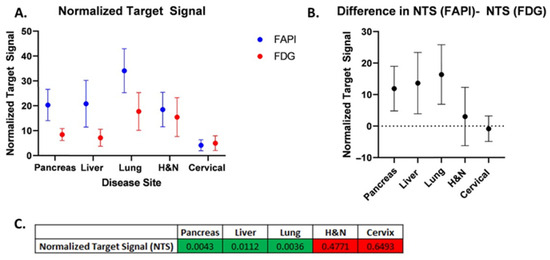
Figure 3.
Normalized target signal (NTS) for [68Ga]Ga-FAPI-04vs. [18F]FDG. (A) Comparison of mean NTSFAPI vs. NTSFDG for each disease site. (B) Difference in mean NTSFAPI and NTSFDG for each disease site. Error bars represent 95% confidence intervals. (C) Table of p-values from two-sided paired t-tests comparing NTS for [68Ga]Ga-FAPI-04 and [18F]FDG (green shades correspond to p < 0.05; red shades correspond to p > 0.05).
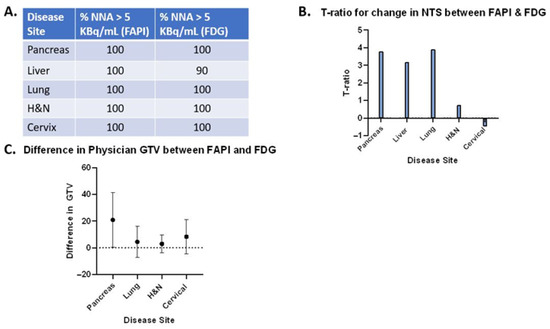
Figure 4.
“Synthesis Matrix”, providing an overall comparison of [68Ga]Ga-FAPI-04 vs. [18F]FDG PET-CT. (A). Table summarizing the percentage of patient cases with NNAFAPI greater than 5 kBq/mL and the percentage of patient cases with NNAFDG greater than 5 kBq/mL. (B). t-ratio for standardized mean change in NTS between [68Ga]Ga-FAPI-04 and [18F]FDG for all disease sites. (C). Difference in gross tumor volume (GTV) in cc between [68Ga]Ga-FAPI-04 and [18F]FDG. Note: Liver contours were removed from this analysis because the volumes of some liver lesions were much greater due to the [68Ga]Ga-FAPI-04-avid rim around a central necrotic core. Error bars represent the standard deviation. Supplementary Information contains additional data tables, patient-level metrics including injected dose, uptake time, and tumor volumes for both tracers.
3.2. Gross Tumor Volume (GTV) Analysis
We conducted a volumetric analysis of the difference in GTV (cc) from physician contours on both FAPI and FDG PET-CT (Figure 5C), utilizing the paired t-test. The difference in GTV was statistically significant in pancreatic cancer, suggesting that [68Ga]Ga-FAPI-04 may identify stromal elements of pancreatic tumors that do not light up on [18F]FDG PET-CT. There were only small differences in the GTV for all other disease sites (lung, liver, H&N, and cervical cancers) (Figure 4C). Since FAPI staining was visualized in a rim around the central necrotic core for some liver lesions, some contoured GTVs had large volumes (>100 cc), which led to significant differences in the GTVs for [68Ga]Ga-FAPI-04 vs. [18F]FDG. It is challenging to deliver BgRT to tumors that do not have a homogeneous FAPI signal because the radiotracer signal is necessary for targeting the radiation. Therefore, liver lesions were excluded from the volumetric comparison because further investigation is needed to determine if [68Ga]Ga-FAPI-04 is useful for tumors in the liver.
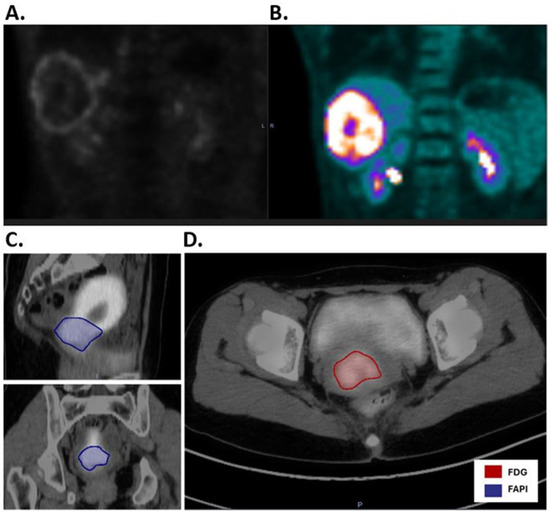
Figure 5.
Comparison of [68Ga]Ga-FAPI-04PET-CT and [18F]FDG PET-CT for liver and cervical cancers. (A). [68Ga]Ga-FAPI-04 PET-CT of liver cancer reveals rim-like expression of [68Ga]Ga-FAPI-04 uptake surrounding the necrotic core of the tumor. (B). As a comparison, [18F]FDG PET-CT reveals an [18F] FDG-avid tumor in the liver, as well as [18F]FDG uptake in the bilateral kidneys. (C). Sagittal and coronal images of [68Ga]Ga-FAPI-04 PET-CT of cervical cancer illustrate a [68Ga]Ga-FAPI-04 positive GTV (blue) as well as significant [68Ga]Ga-FAPI-04 signal in the normal uterus. (D). As a comparison, the axial image of [18F]FDG PET-CT shows the GTV (red) with less background signal in the uterus.
3.2.1. Pancreatic Cancer
Our comparison of NNA and NTS for [68Ga]Ga-FAPI-04 and [18F]FDG revealed differences in the applicability of BgRT for different tumor types. For pancreatic cancer, the mean NNAFAPI was more than double the mean NNAFDG (55.98 and 20.8, respectively; p = 0.0007). The mean NTSFAPI is more than double the mean NTSFDG (20.3 and 8.43, respectively; p = 0.0043). On average, there is approximately one more pancreatic tumor identified on [68Ga]Ga-FAPI-04 images than on [18F]FDG images (p = 0.0078). Based on the t-ratio describing the change in NTS between [68Ga]Ga-FAPI-04 and [18F]FDG, pancreatic cancer may be the most promising disease site to treat with FAPI BgRT.
3.2.2. Lung Cancer
For lung cancer, the GTV, SUVmax, and SUVmean for [68Ga]Ga-FAPI-04 were all greater than for [18F]FDG. The mean NNAFAPI was 46.39 kBq/mL, and the mean NNAFDG was 34.57 kBq/mL (not significant). However, the mean NTSFAPI was 34.11, and the mean NTSFDG was 17.75 (p = 0.0036). Based on the t-ratio describing the change in NTS between [68Ga]Ga-FAPI-04 and [18F]FDG, lung cancer deserves further investigation as a disease site to treat with [68Ga]Ga-FAPI-04-based BgRT. For head and neck cancer, the mean NNAFAPI was 56.77 kBq/mL and the mean NNAFDG was 28.42 kBq/mL (p = 0.0058). The mean NTSFAPI was 18.51, and the mean NTSFDG was 15.48; the difference was not statistically significant. In addition, more lesions were found on [68Ga]Ga-FAPI-04-PET than on [18F]FDG -PET. Specifically, more lesions were identified in the lymph nodes, as has been described in the literature [12].
3.2.3. Liver Cancer
For liver cancer, the mean NNAFAPI was 43.41 kBq/mL and the mean NNAFDG was 23.15 kBq/mL, p = 0.0605). The mean NTSFAPI was 20.85, and the mean NTSFDG was 7.18, which was statistically significant (p = 0.0112), suggesting that the NTSFAPI for liver cancer was more than double the NTSFDG. Based on the t-ratio describing the change in NTS between [68Ga]Ga-FAPI-04 and [18F]FDG, liver cancer deserves further investigation for BgRT. Importantly, [68Ga]Ga-FAPI-04 has no background uptake in the liver like [18F]FDG. However, 4 of 10 liver lesions had a ring of FAPI signal around a central necrotic core (Figure 5A,B). Given that a relatively homogeneous FAPI signal is needed to target the whole tumor with BgRT, inhomogeneities of the [68Ga]Ga-FAPI-04 signal in liver lesions may exclude some patients with liver cancer from [68Ga]Ga-FAPI-04-based BgRT. In addition, the unusual pattern of [68Ga]Ga-FAPI-04 staining in a rim-like pattern led to some liver tumors having very large FAPI volumes.
3.2.4. Cervical Cancer
For cervical cancer, the mean NNAFAPI was 58.36 kBq/mL and the mean NNAFDG was 37.81 kBq/mL, and the difference was statistically significant (p = 0.042). The mean NTSFAPI was 4.18, and the mean NTSFDG was 5.02, but the difference was not statistically significant. In addition, [68Ga]Ga-FAPI-04 has a strong signal in the endometrium due to stromal cells in the endometrium (Figure 5C,D) [11]. Therefore, the SUVmean of cervical cancer was similar to the SUVmean of the uterus (Figure 4), and this excessive background signal will likely preclude treatment of this cervical cancer with [68Ga]Ga-FAPI-04 BgRT.
4. Discussion
Here, we present the first study evaluating a quinoline-based FAP inhibitor bound to a DOTA chelator [68Ga]Ga-FAPI-04 versus [18F]FDG for real-time PET-based biology-guided radiation therapy in a variety of cancer types, including pancreatic cancer, liver cancer, lung cancer, head and neck, and cervical cancer. The goal of the study was to determine which disease sites could be treated with [68Ga]Ga-FAPI-04 BgRT more effectively than with [18F]FDG BgRT using established parameters required for the delivery of BgRT.
At the outset of this study, we chose to use the established thresholds of [18F]FDG-directed BgRT, namely that the NNA must be greater than 5.0 kBq/mL and the NTS must be greater than 2.7 kBq/mL for the delivery of BgRT. It should be noted, however, that the actual thresholds for these metrics have not yet been established for [68Ga]Ga-FAPI-04-directed BgRT. Furthermore, these threshold values are expected to be higher than those required for [18F]FDG due to the shorter half-life, smaller positron fraction, and higher maximum positron energy of 68Ga compared to 18F. Nevertheless, the NNAFAPI was statistically significantly greater than the NNAFDG in pancreatic cancer, head and neck cancer, and cervical cancer, suggesting that [68Ga]Ga-FAPI-04 reactivity is higher than [18F]FDG reactivity in these cancer types (Figure 2). This highlights the abundance of cancer-associated fibroblasts in these disease sites and emphasizes the fact that the tumor stroma makes up a large portion of these tumors. Not surprisingly, some of these tumor types with abundant stroma have previously been shown to be optimal targets for FAPI imaging [21,22]. NNA is a threshold value (or a binary variable), and values greater than 5 kBq/mL are needed to treat tumors with BgRT. In the majority of cases, NNA was greater than 5 kBq/mL, and therefore those patients may be suitable for treatment with BgRT using both [68Ga]Ga-FAPI-04 and [18F]FDG (as shown in Figure 4A). However, in disease sites where NNAFAPI is significantly greater than NNAFDG, the BgRT treatment delivery may be more robust because of the stronger [68Ga]Ga-FAPI-04 PET signal, or we may be able to reduce the injected activity of [68Ga]Ga-FAPI-04 and use fewer millicuries for each treatment.
Next, we evaluated the Normalized Target Signal (NTS), which measures the difference in activity concentration between the target and background, divided by the standard deviation of the background, to capture the “signal to noise” ratio of each radiotracer. NTS is a continuous variable where larger values represent a greater signal-to-noise ratio, which is essential for accurate delivery of BgRT. As such, we consider NTS to be the most important variable to consider when evaluating radiotracers for BgRT. In this study, we found that the NTSFAPI was greater than the NTSFDG in pancreatic cancer, liver cancer, and lung cancer (Figure 3). In order to compare the magnitude of difference between NTSFAPI and NTSFDG, we calculated the t-ratio (the standardized mean difference in NTSFAPI vs. NTSFDG) (Figure 4B). Based on the t-ratio for change in NTS between [68Ga]Ga-FAPI-04 and [18F]FDG, we identified that pancreatic cancer, liver cancer, and lung cancer are all disease sites that deserve further investigation for [68Ga]Ga-FAPI-04-based BgRT.
The unusual distribution of [68Ga]Ga-FAPI-04 in some liver lesions (a rim of [68Ga]Ga-FAPI-04 around a central necrotic core) is as elucidated an interesting biological phenomenon that deserves further exploration. Further studies are needed to compare the [68Ga]Ga-FAPI-04 distribution in hepatocellular carcinoma (HCC) with that of colorectal metastases to the liver and visualize cancer-associated fibroblast-mediated crosstalk with HCC or metastatic cancer cells in the liver tumor microenvironment [23]. The lack of a significant difference in NNA between tracers in the liver and lung is worth further investigation. One possible explanation may be attributed to physiological background uptake: FDG has known hepatic and pulmonary uptake, while FAPI may show variable uptake depending on fibrosis and stromal-immune interactions. Another possible reason is the tumor microenvironment: Lesions in the liver and lung may have similar FAP expression or lytic activity as the organs themselves, reducing tracer contrast. Taken together, our data suggest that a subset of patients with liver tumors may benefit from BgRT, but careful patient selection will be required due to the spatial distribution of [68Ga]Ga-FAPI-04 in liver tumors.
In addition, we noted that [68Ga]Ga-FAPI-04 has better uptake in the lymph nodes than [18F]FDG in lung cancer, head and neck cancer, and cervical cancer. This is consistent with published reports showing that another 68Ga-radiolabelled FAPI was useful to detect nodal metastases in four out of five nodes that were confirmed pathologically [24]. Since CAFs promote tumor growth and invasion, the presence of CAFs correlates with a poor prognosis [21,23,24], and there may be more [68Ga]Ga-FAPI-04-avid regions in advanced-stage tumors that have more nodal involvement.
Lastly, we observed that there is a positive [68Ga]Ga-FAPI-04 signal in the normal uterus, likely related to high stromal content within the endometrium or myometrium [11]. This created a significant background signal that may interfere with BgRT treatment for cervical cancer.
Another caveat to consider is that the expression of FAPI is not limited to cancer-associated fibroblasts [25] since FAP is expressed during remodeling of the extracellular matrix, which occurs during wound healing [26] and in benign diseases like scleroderma and idiopathic pulmonary fibrosis [6]. While patients with comorbidities such as systemic sclerosis may not be the best candidates for treatment with systemic therapeutic FAPIs, biology-guided radiotherapy is potentially a good option for these patients, as the physician can identify specific FAPI-positive regions to treat while excluding FAPI-positive regions related to non-oncologic processes, provided they are sufficiently far away from the treatment targets.
Given that the NTSFAPI was greater than the NTSFDG in pancreatic cancer, liver cancer, and lung cancer, and the t-ratio for change in NTS between [68Ga]Ga-FAPI-04 and [18F]FDG was greatest for these disease sites, these disease sites deserve further investigation for BgRT. However, some liver tumors had a ring-like pattern of [68Ga]Ga-FAPI-04 that could make it difficult to develop an acceptable BgRT plan quality for certain patients. For pancreatic cancer, the NNAFAPI was also much higher than the NNAFDG since pancreatic cancer contains a high amount of desmoplastic stroma composed of cancer-associated fibroblasts. Since the NNAFAPI is significantly higher than the NNAFDG for pancreatic cancer, we may be able to reduce the injected activity of [68Ga]Ga-FAPI-04 and use fewer millicuries of [68Ga]Ga-FAPI-04 for each treatment. The difference in the GTV was also greatest in pancreatic cancer, suggesting that [68Ga]Ga-FAPI-04 may identify stromal elements of the tumor that do not light up on [18F]FDG PET-CT. Taken together, the significant difference between NTSFAPI vs. NTSFDG and the difference in GTV suggest that pancreatic cancer may have the greatest potential to be successfully treated with [68Ga]Ga-FAPI-04 guided BgRT (Figure 4).
We acknowledge that NNA and NTS alone may not fully capture the complexity of dose delivery in BgRT, especially in the context of patient motion. While our study aimed to provide a preliminary comparison of tracer suitability based on imaging-derived metrics, dosimetric and phantom validation would strengthen the conclusions. Future work involving motion phantoms and dose simulations to validate BgRT feasibility is being planned.
While this study focused on [68Ga]Ga-FAPI-04, it is important to acknowledge that other FAP-targeting tracers, such as [68Ga]Ga-FAPI-46 [27,28,29] and [18F]F-FAPI-74 [30,31], may exhibit different pharmacokinetics, tumor retention profiles, and background uptake characteristics. These differences could influence their suitability for BgRT applications, particularly in terms of signal persistence, biodistribution, and image contrast. For example, [18F]F-FAPI-74 benefits from a longer half-life and higher production yield, which may enhance workflow scalability. Future studies comparing these tracers head-to-head in the context of BgRT are warranted to determine the optimal agent for specific tumor types and clinical scenarios.
5. Conclusions
In conclusion, our work suggests that [68Ga]Ga-FAPI-04 represents a novel radiotracer for real-time BgRT in multiple cancer types, specifically in gastrointestinal and thoracic malignancies. This innovative approach could incorporate new imaging markers from nuclear medicine into radiation treatment planning and delivery to open a whole new paradigm in radiation oncology. Additional studies are needed to determine which patient populations will benefit the most from this approach.
Supplementary Materials
The following supporting information can be downloaded at: https://www.mdpi.com/article/10.3390/cancers17223648/s1, Figure S1: The chemical structures of [68Ga]Ga-FAPI-04 and [18F]FDG; Table S1: Data table containing patient-level metrics including injected dose, uptake time, tumor volumes and activity concentration (AC) used to calculate Normalized Target Signal (NTS) and Normalized Net Activity (NNA).
Author Contributions
Conceptualization, H.M.M., T.M.W. and A.L.; methodology, H.M.M. and A.L.; data curation, H.M.M., T.M.W., A.A., S.S., S.G., Y.-J.C., T.K. and Z.W.; formal analysis, H.M.M., T.K., Z.W., T.D. and A.L.; resources, A.L., D.L., L.Q., Y.C. and L.L.; writing—original draft preparation, H.M.M.; writing—review and editing, H.M.M., T.M.W. and A.L.; visualization, H.M.M.; supervision, H.M.M. and A.L.; project administration, H.M.M.; funding acquisition, A.L. All authors have read and agreed to the published version of the manuscript.
Funding
This research was funded by a RefleXion grant to City of Hope (A.L). Heather McGee reports research funding from the NIH/NCI (R00CA256526) and the AACR (Award 23-40-21-MCGE), both of which are unrelated to this project.
Institutional Review Board Statement
The study was conducted in accordance with the Declaration of Helsinki and approved by the Institutional Review Board (or Ethics Committee) of City of Hope City of Hope IRB #20039 29 February 2020.
Informed Consent Statement
Informed consent was obtained from all subjects involved in the study.
Data Availability Statement
Research data are stored in an institutional repository and will be shared upon request to the corresponding author.
Acknowledgments
We would like to acknowledge all the patients who participated in this study, as well as all of the physicians and physics faculty in the Department of Radiation Oncology who contributed to insightful discussions about this work.
Conflicts of Interest
An Liu reports prior consultant fees and research funding from RefleXion, Heather McGee reports she was a past consultant for RefleXion (which ended in 2021 prior to this study), Arya Amini reports research funding from RefleXion and Varian, and David Leung reports that he was employed by RefleXion. No other potential conflicts of interest relevant to this article exist.
References
- Oderinde, O.M.; Shirvani, S.M.; Olcott, P.D.; Kuduvalli, G.; Mazin, S.; Larkin, D. The technical design and concept of a PET/CT linac for biology-guided radiotherapy. Clin. Transl. Radiat. Oncol. 2021, 29, 106–112. [Google Scholar] [CrossRef] [PubMed]
- Shirvani, S.M.; Huntzinger, C.J.; Melcher, T.; Olcott, P.D.; Voronenko, Y.; Bartlett-Roberto, J.; Mazin, S. Biology-guided radiotherapy: Redefining the role of radiotherapy in metastatic cancer. Br. J. Radiol. 2021, 94, 20200873. [Google Scholar] [CrossRef] [PubMed]
- Lancia, A.; Ingrosso, G.; Detti, B.; Festa, E.; Bonzano, E.; Linguanti, F.; Camilli, F.; Bertini, N.; La Mattina, S.; Orsatti, C.; et al. Biology-guided radiotherapy in metastatic prostate cancer: Time to push the envelope? Front. Oncol. 2024, 14, 1455428. [Google Scholar] [CrossRef] [PubMed]
- Ladbury, C.; Eustace, N.; Amini, A.; Dandapani, S.; Williams, T. Biology-Guided Radiation Therapy: An Evolving Treatment Paradigm. Surg. Oncol. Clin. N. Am. 2023, 32, 553–568. [Google Scholar] [CrossRef]
- Cuaron, J.; Dunphy, M.; Rimner, A. Role of FDG-PET scans in staging, response assessment, and follow-up care for non-small cell lung cancer. Front. Oncol. 2012, 2, 208. [Google Scholar] [CrossRef]
- Dendl, K.; Koerber, S.A.; Kratochwil, C.; Cardinale, J.; Finck, R.; Dabir, M.; Novruzov, E.; Watabe, T.; Kramer, V.; Choyke, P.L.; et al. FAP and FAPI-PET/CT in Malignant and Non-Malignant Diseases: A Perfect Symbiosis? Cancers 2021, 13, 4946. [Google Scholar] [CrossRef]
- Qin, C.; Shao, F.; Gai, Y.; Liu, Q.; Ruan, W.; Liu, F.; Hu, F.; Lan, X. 68Ga-DOTA-FAPI-04 PET/MR in the Evaluation of Gastric Carcinomas: Comparison with 18F-FDG PET/CT. J. Nucl. Med. 2022, 63, 81–88. [Google Scholar] [CrossRef]
- Wang, Y.; Luo, W.; Li, Y. [68Ga]Ga-FAPI-04 PET MRI/CT in the evaluation of gastric carcinomas compared with [18F]-FDG PET MRI/CT: A meta-analysis. Eur. J. Med. Res. 2023, 28, 34. [Google Scholar] [CrossRef]
- Huang, X.; Xiao, H.; Shi, Y.; Ben, S. Integrating single-cell and bulk RNA sequencing to develop a cancer-associated fibroblast-related signature for immune infiltration prediction and prognosis in lung adenocarcinoma. J. Thorac. Dis. 2023, 15, 1406–1425. [Google Scholar] [CrossRef]
- Kratochwil, C.; Flechsig, P.; Lindner, T.; Abderrahim, L.; Altmann, A.; Mier, W.; Adeberg, S.; Rathke, H.; Röhrich, M.; Winter, H.; et al. (68)Ga-FAPI PET/CT: Tracer Uptake in 28 Different Kinds of Cancer. J. Nucl. Med. 2019, 60, 801–805. [Google Scholar] [CrossRef]
- Dendl, K.; Koerber, S.A.; Finck, R.; Mokoala, K.M.G.; Staudinger, F.; Schillings, L.; Heger, U.; Röhrich, M.; Kratochwil, C.; Sathekge, M.; et al. (68)Ga-FAPI-PET/CT in patients with various gynecological malignancies. Eur. J. Nucl. Med. Mol. Imaging 2021, 48, 4089–4100. [Google Scholar] [CrossRef]
- Chang, W.Y.; Tseng, N.C.; Chen, L.Y.; Chang, C.W.; Huang, Y.Y.; Huang, Y.T.; Ou, Y.C.; Peng, N.J. Comparison of the Detection Performance Between FAP and FDG PET/CT in Various Cancers: A Systemic Review and Meta-analysis. Clin. Nucl. Med. 2023, 48, 132–142. [Google Scholar] [CrossRef]
- Giesel, F.L.; Kratochwil, C.; Schlittenhardt, J.; Dendl, K.; Eiber, M.; Staudinger, F.; Kessler, L.; Fendler, W.P.; Lindner, T.; Koerber, S.A.; et al. Head-to-head intra-individual comparison of biodistribution and tumor uptake of (68)Ga-FAPI and (18)F-FDG PET/CT in cancer patients. Eur. J. Nucl. Med. Mol. Imaging 2021, 48, 4377–4385. [Google Scholar] [CrossRef] [PubMed]
- Surucu, M.; Vitzthum, L.; Chang, D.T.; Gensheimer, M.; Kovalchuk, N.; Han, B.; lagaru, A.; Silva, A.J.D.; Narayanan, M.; Aksoy, D.; et al. Evaluation of Measured PET Activity Metrics from the First-in-Human Biology-Guided Radiotherapy Clinical Trial. In Proceedings of the AAPM 65th Annual Meeting & Exhibition: AAPM, Houston, TX, USA, 23–27 July 2023. [Google Scholar]
- Tibdewal, A.; Patil, M.; Misra, S.; Purandare, N.; Rangarajan, V.; Mummudi, N.; Karimundackal, G.; Jiwnani, S.; Agarwal, J. Optimal Standardized Uptake Value Threshold for Auto contouring of Gross Tumor Volume using Positron Emission Tomography/Computed Tomography in Patients with Operable Nonsmall-Cell Lung Cancer: Comparison with Pathological Tumor Size. Indian J. Nucl. Med. 2021, 36, 7–13. [Google Scholar] [CrossRef] [PubMed]
- Biehl, K.J.; Kong, F.-M.; Dehdashti, F.; Jin, J.-Y.; Mutic, S.; El Naqa, I.; A Siegel, B.; Bradley, J.D. 18F-FDG PET definition of gross tumor volume for radiotherapy of non-small cell lung cancer: Is a single standardized uptake value threshold approach appropriate? J. Nucl. Med. 2006, 47, 1808–1812. [Google Scholar] [PubMed]
- Hirmas, N.; Hamacher, R.; Sraieb, M.; Ingenwerth, M.; Kessler, L.; Pabst, K.M.; Barbato, F.; Lueckerath, K.; Kasper, S.; Nader, M.; et al. Fibroblast-Activation Protein PET and Histopathology in a Single-Center Database of 324 Patients and 21 Tumor Entities. J. Nucl. Med. 2023, 64, 711–716. [Google Scholar] [CrossRef]
- Zhang, H.; Gibbard, G.; Shen, C.; Banks, T.I.; Peng, H.; Da Silva, A.; Kuduvalli, G.; Aguilera, T.A.; Dan, T.; Badiyan, S.N.; et al. Expanding SCINTIX Biology-Guided Radiotherapy Beyond Lung and Bone: A Planning Feasibility and Dosimetric Study on the RefleXion X1 System. Technol. Cancer Res. Treat. 2025, 24, 15330338251365334. [Google Scholar] [CrossRef]
- Cai, B.; Banks, T.I.; Shen, C.; Prasad, R.; Bal, G.; Lin, M.H.; Godley, A.; Pompos, A.; Garant, A.; Westover, K.; et al. Strategies for Offline Adaptive Biology-Guided Radiotherapy (BgRT) on a PET-Linac Platform. Cancers 2025, 17, 2470. [Google Scholar] [CrossRef]
- Surucu, M.; Ashraf, M.R.; Romero, I.O.; Zalavari, L.T.; Pham, D.; Vitzthum, L.K.; Gensheimer, M.F.; Yang, Y.; Xing, L.; Kovalchuk, N.; et al. Commissioning of a novel PET-Linac for biology-guided radiotherapy (BgRT). Med. Phys. 2024, 51, 4389–4401. [Google Scholar] [CrossRef]
- Wang, Q.; Zhao, Y.; Wang, F.; Tan, G. Clustering and machine learning-based integration identify cancer associated fibroblasts genes’ signature in head and neck squamous cell carcinoma. Front. Genet. 2023, 14, 1111816. [Google Scholar] [CrossRef]
- Sunami, Y.; Boker, V.; Kleeff, J. Targeting and Reprograming Cancer-Associated Fibroblasts and the Tumor Microenvironment in Pancreatic Cancer. Cancers 2021, 13, 697. [Google Scholar] [CrossRef] [PubMed]
- Song, M.; He, J.; Pan, Q.Z.; Yang, J.; Zhao, J.; Zhang, Y.J.; Huang, Y.; Tang, Y.; Wang, Q.; He, J.; et al. Cancer-Associated Fibroblast-Mediated Cellular Crosstalk Supports Hepatocellular Carcinoma Progression. Hepatology 2021, 73, 1717–1735. [Google Scholar] [CrossRef] [PubMed]
- Wegen, S.; Roth, K.S.; Weindler, J.; Claus, K.; Linde, P.; Trommer, M.; Akuamoa-Boateng, D.; van Heek, L.; Baues, C.; Schömig-Markiefka, B.; et al. First Clinical Experience With [68Ga]Ga-FAPI-46-PET/CT Versus [18F]F-FDG PET/CT for Nodal Staging in Cervical Cancer. Clin. Nucl. Med. 2023, 48, 150–155. [Google Scholar] [CrossRef]
- Hotta, M.; Rieger, A.C.; Jafarvand, M.G.; Menon, N.; Farolfi, A.; Benz, M.R.; Calais, J. Non-oncologic incidental uptake on FAPI PET/CT imaging. Br. J. Radiol. 2023, 96, 20220463. [Google Scholar] [CrossRef] [PubMed]
- Yuan, Z.; Li, Y.; Zhang, S.; Wang, X.; Dou, H.; Yu, X.; Zhang, Z.; Yang, S.; Xiao, M. Extracellular matrix remodeling in tumor progression and immune escape: From mechanisms to treatments. Mol. Cancer 2023, 22, 48. [Google Scholar] [CrossRef]
- Meyer, C.; Dahlbom, M.; Lindner, T.; Vauclin, S.; Mona, C.; Slavik, R.; Czernin, J.; Haberkorn, U.; Calais, J. Radiation Dosimetry and Biodistribution of (68)Ga-FAPI-46 PET Imaging in Cancer Patients. J. Nucl. Med. 2020, 61, 1171–1177. [Google Scholar] [CrossRef]
- Mona, C.E.; Benz, M.R.; Hikmat, F.; Grogan, T.R.; Lueckerath, K.; Razmaria, A.; Riahi, R.; Slavik, R.; Girgis, M.D.; Carlucci, G.; et al. Correlation of (68)Ga-FAPi-46 PET Biodistribution with FAP Expression by Immunohistochemistry in Patients with Solid Cancers: Interim Analysis of a Prospective Translational Exploratory Study. J. Nucl. Med. 2022, 63, 1021–1026. [Google Scholar] [CrossRef]
- Ruan, D.; Sun, J.; Han, C.; Cai, J.; Yu, L.; Zhao, L.; Pang, Y.; Zuo, C.; Sun, L.; Wang, Z.; et al. (68)Ga-FAPI-46 PET/CT in the evaluation of gliomas: Comparison with (18)F-FDG PET/CT and contrast-enhanced MRI. Theranostics 2024, 14, 6935–6946. [Google Scholar] [CrossRef]
- Giesel, F.L.; Adeberg, S.; Syed, M.; Lindner, T.; Jiménez-Franco, L.D.; Mavriopoulou, E.; Staudinger, F.; Tonndorf-Martini, E.; Regnery, S.; Rieken, S. FAPI-74 PET/CT Using Either (18)F-AlF or Cold-Kit (68)Ga Labeling: Biodistribution, Radiation Dosimetry, and Tumor Delineation in Lung Cancer Patients. J. Nucl. Med. 2021, 62, 201–207. [Google Scholar] [CrossRef]
- Watabe, T.; Naka, S.; Tatsumi, M.; Kamiya, T.; Kimura, T.; Shintani, Y.; Abe, K.; Miyake, T.; Shimazu, K.; Kobayashi, S.; et al. Initial Evaluation of [(18)F]FAPI-74 PET for Various Histopathologically Confirmed Cancers and Benign Lesions. J. Nucl. Med. 2023, 64, 1225–1231. [Google Scholar] [CrossRef]
Disclaimer/Publisher’s Note: The statements, opinions and data contained in all publications are solely those of the individual author(s) and contributor(s) and not of MDPI and/or the editor(s). MDPI and/or the editor(s) disclaim responsibility for any injury to people or property resulting from any ideas, methods, instructions or products referred to in the content. |
© 2025 by the authors. Licensee MDPI, Basel, Switzerland. This article is an open access article distributed under the terms and conditions of the Creative Commons Attribution (CC BY) license (https://creativecommons.org/licenses/by/4.0/).