Apparent Diffusion Coefficient and Native T1 Mapping Histogram Analyses Reveal Tumor Proliferation and Microenvironment in Neuroblastoma Xenografts
Simple Summary
Abstract
1. Introduction
2. Materials and Methods
2.1. Ethics Approval
2.2. Selection and Culturing of Cell Lines
2.3. Calculation of Sample Size for Experimental Animals
2.4. Establishment of Xenograft Models
2.5. MRI Examination
2.6. Mice Sacrifice and Histopathological Analysis
2.7. ADC and Native T1 Map Histogram Analysis
2.8. Statistical Analysis
3. Results
3.1. Comparison of Ki-67 Expression, MVD, and CVF
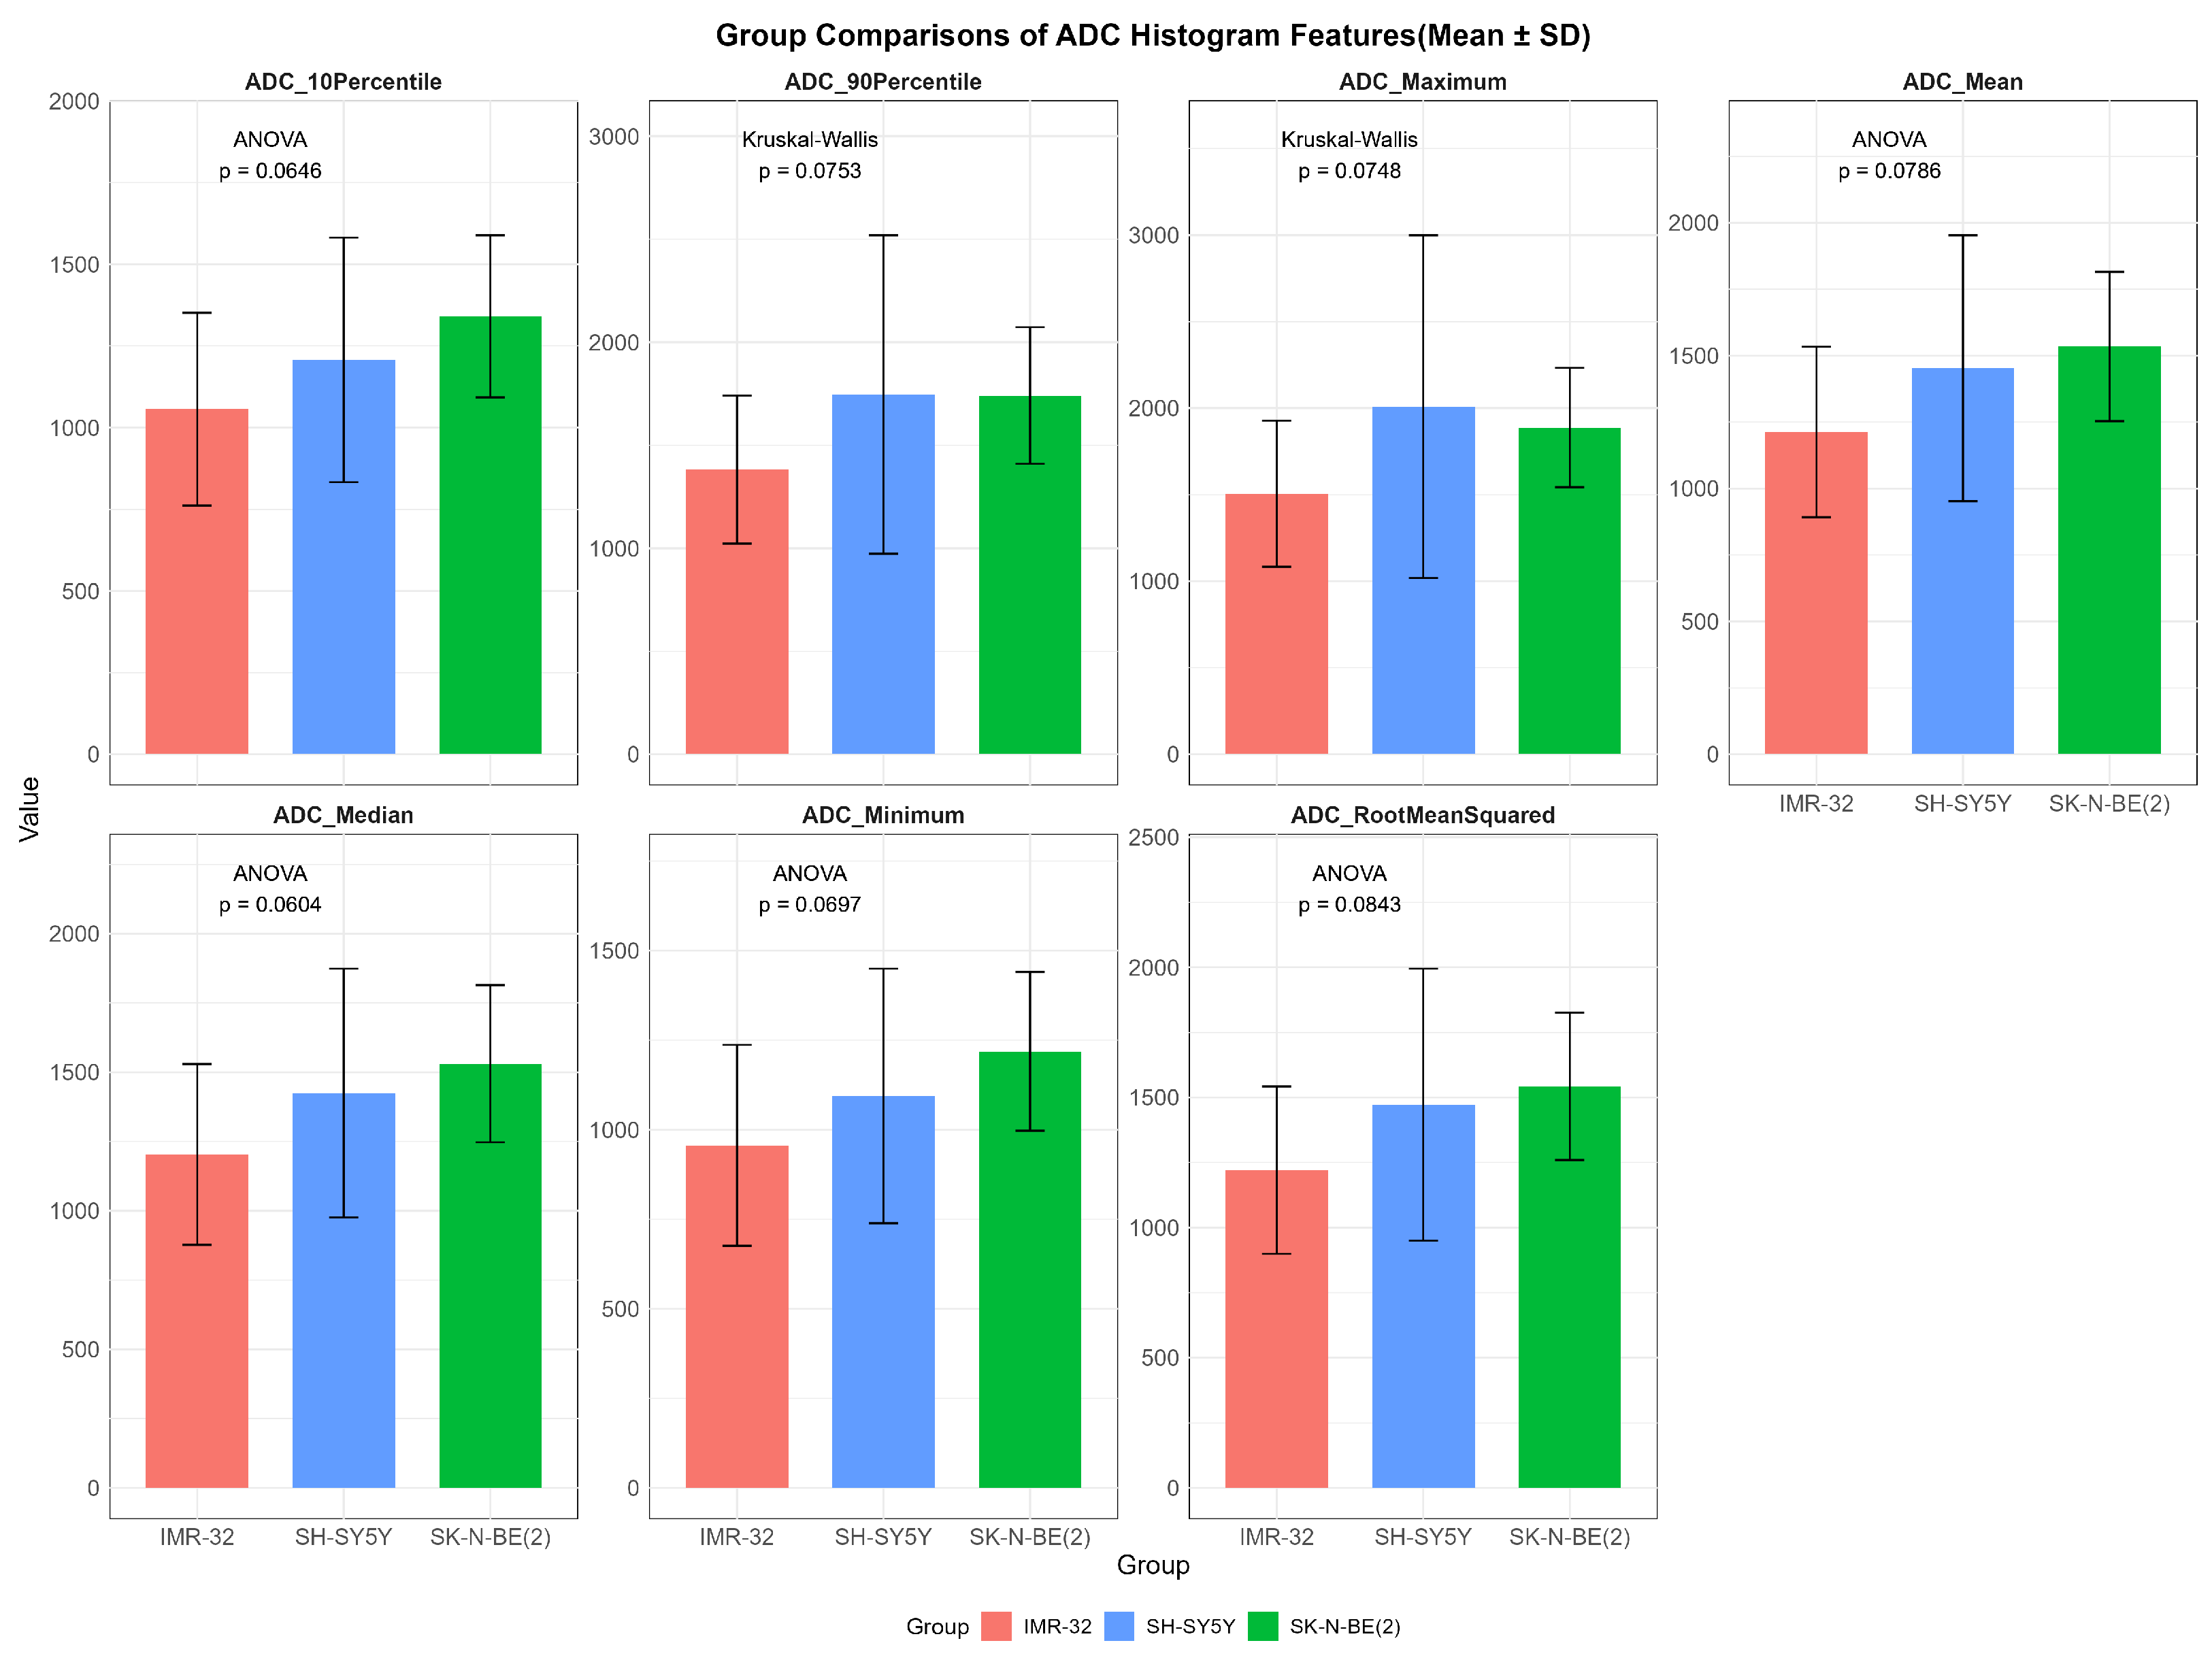
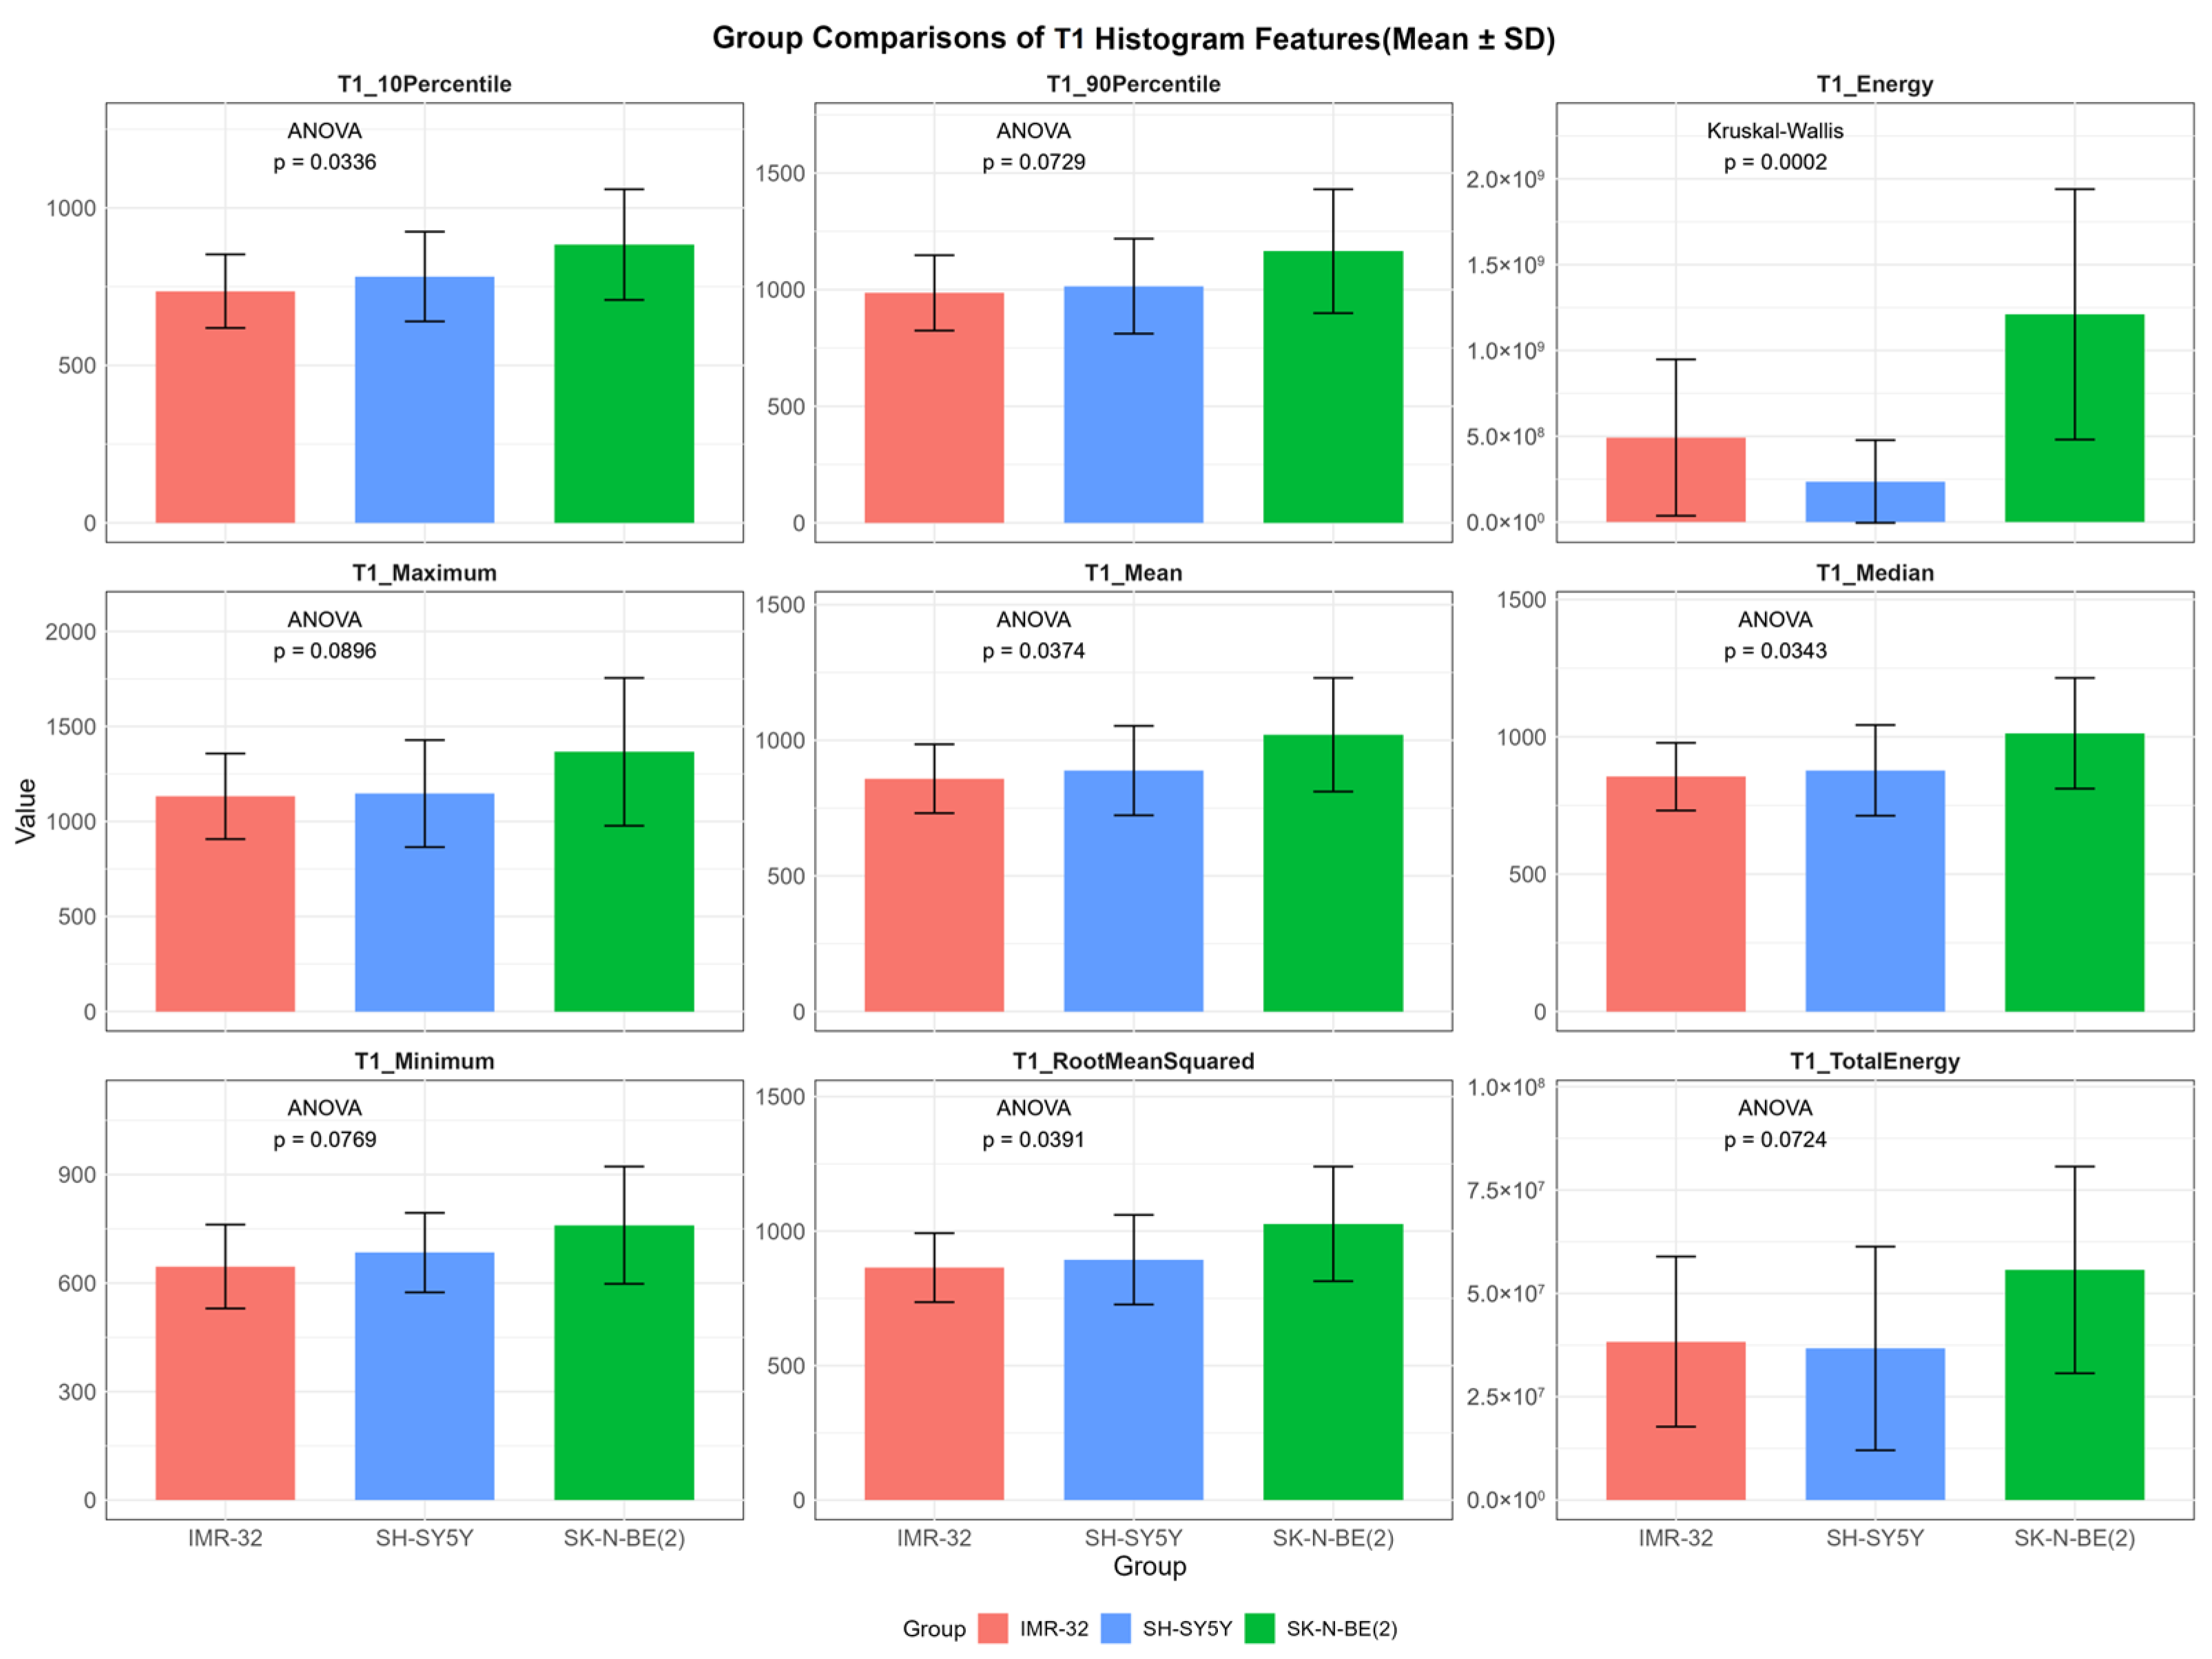
3.2. Comparison of ADC and Native T1 Mapping Histogram Features
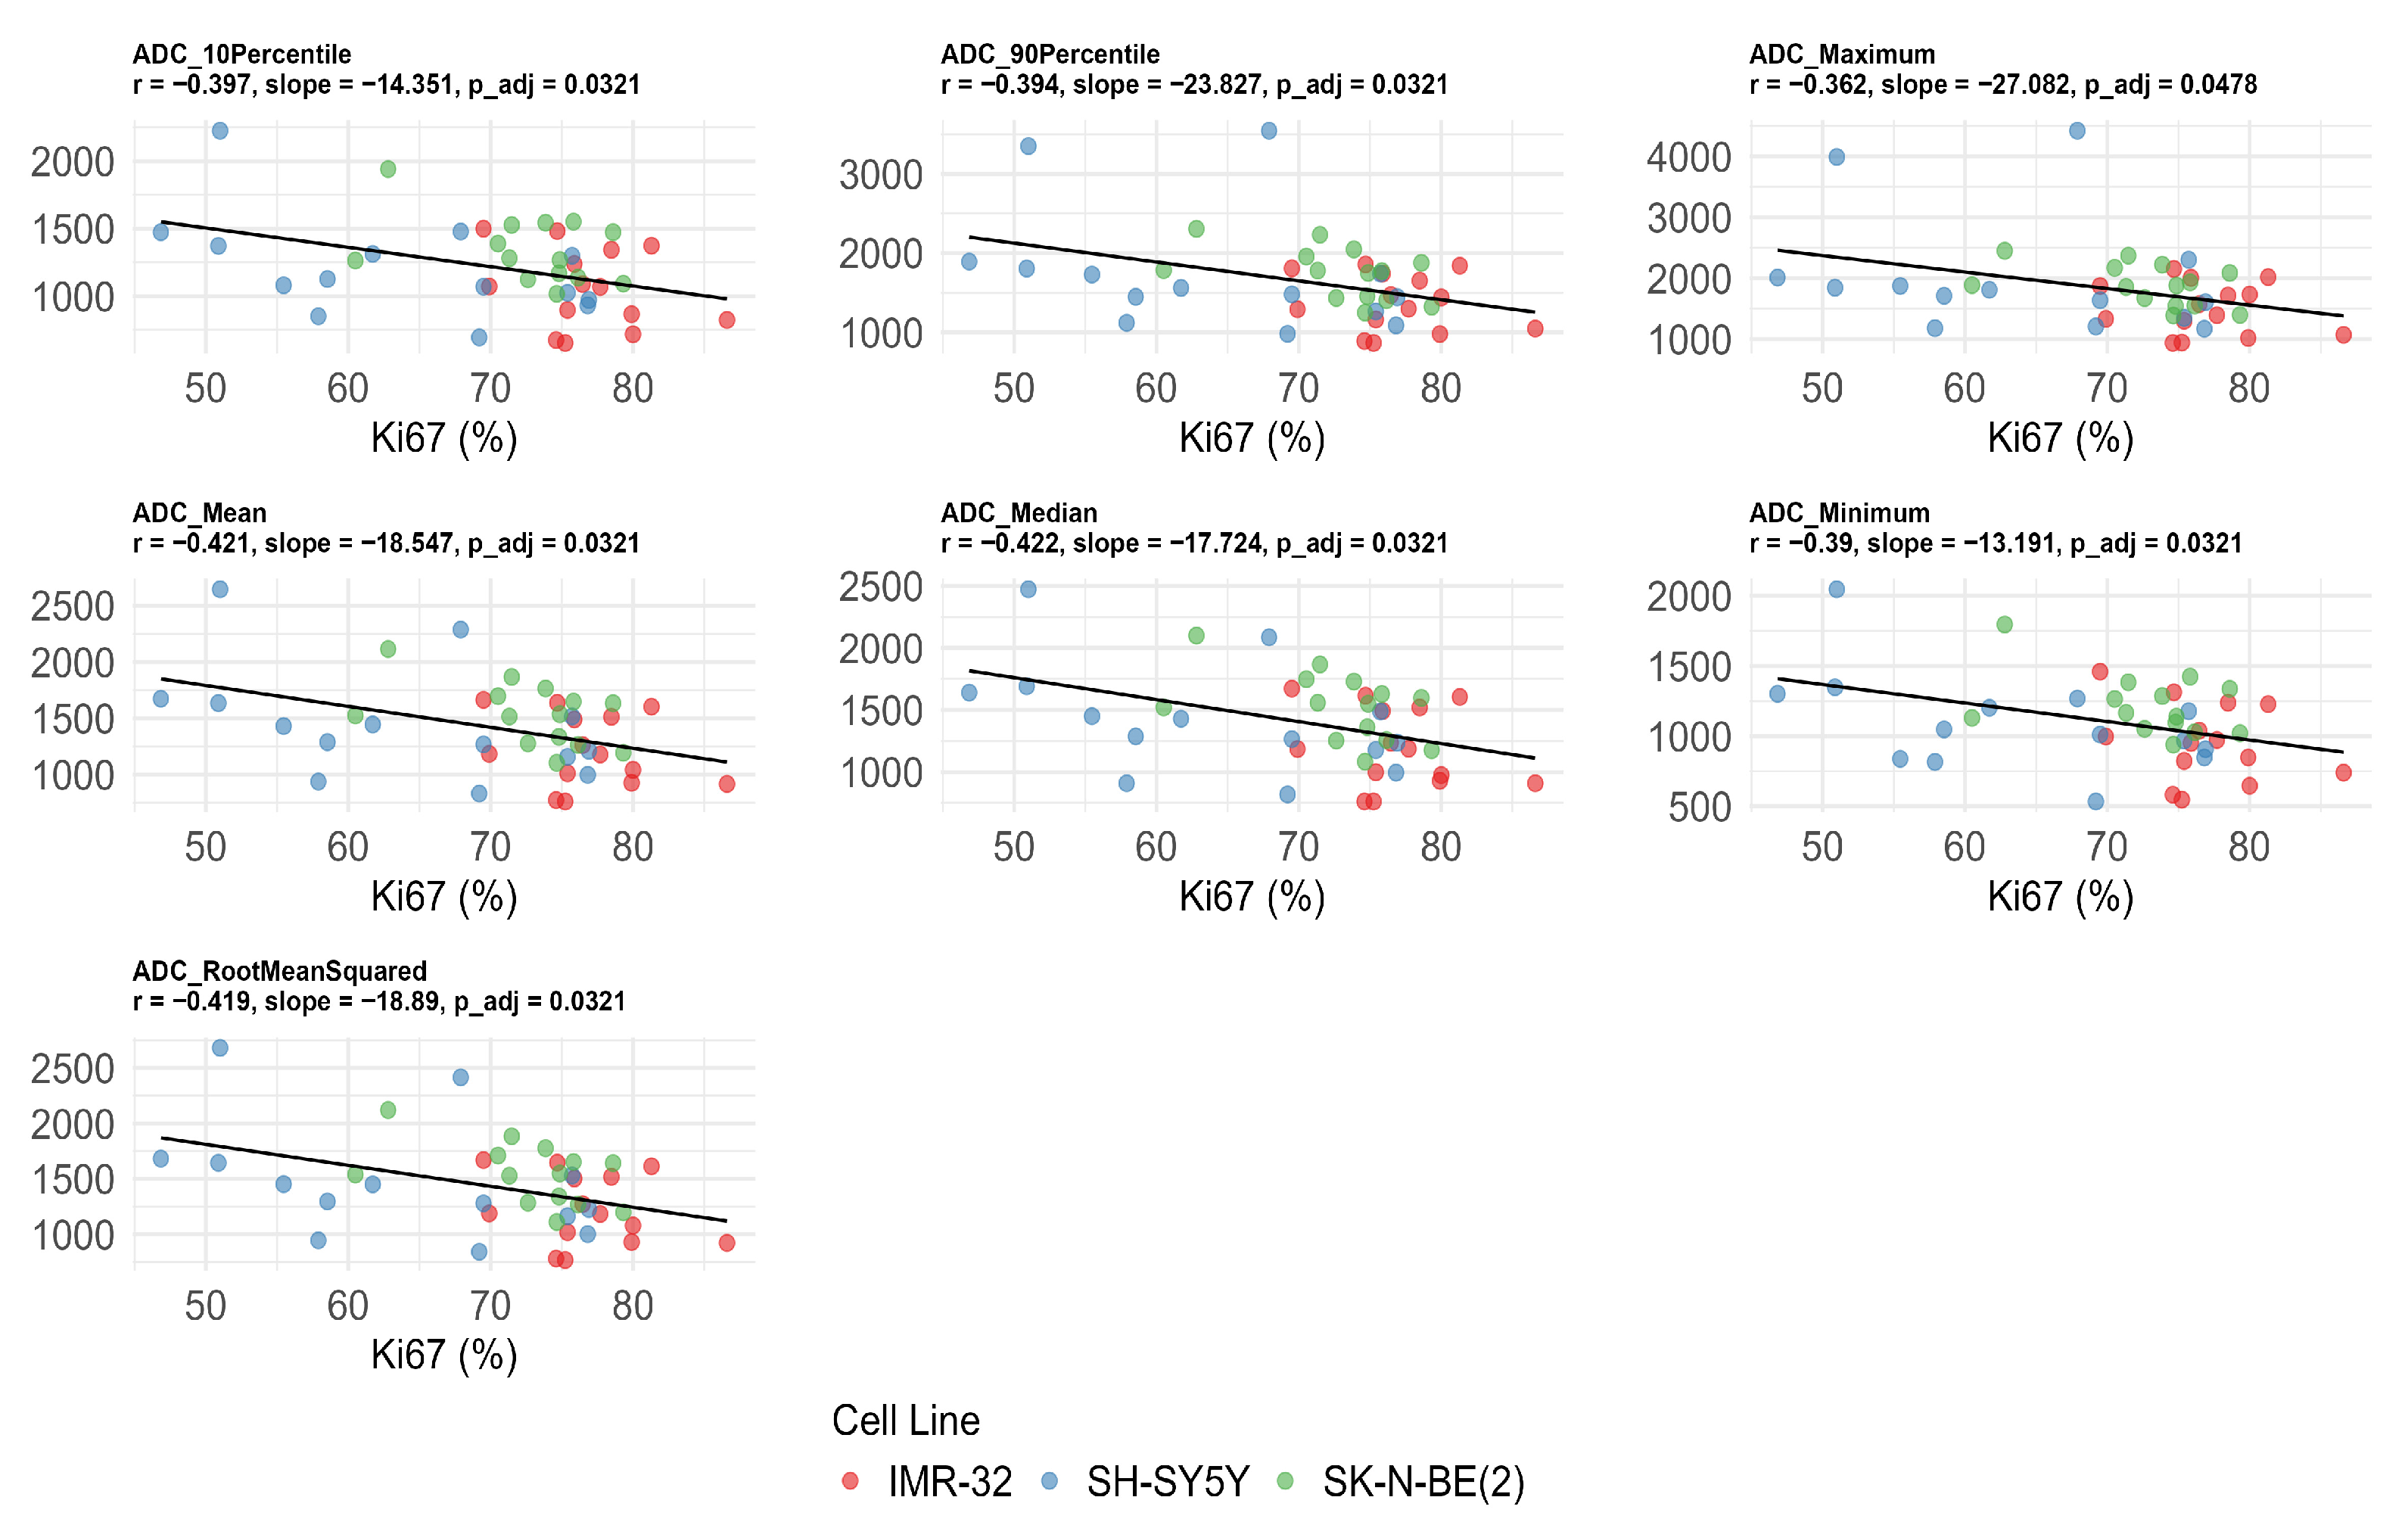
3.3. Correlation Between ADC Values, Ki-67 Expression, MVD, and CVF
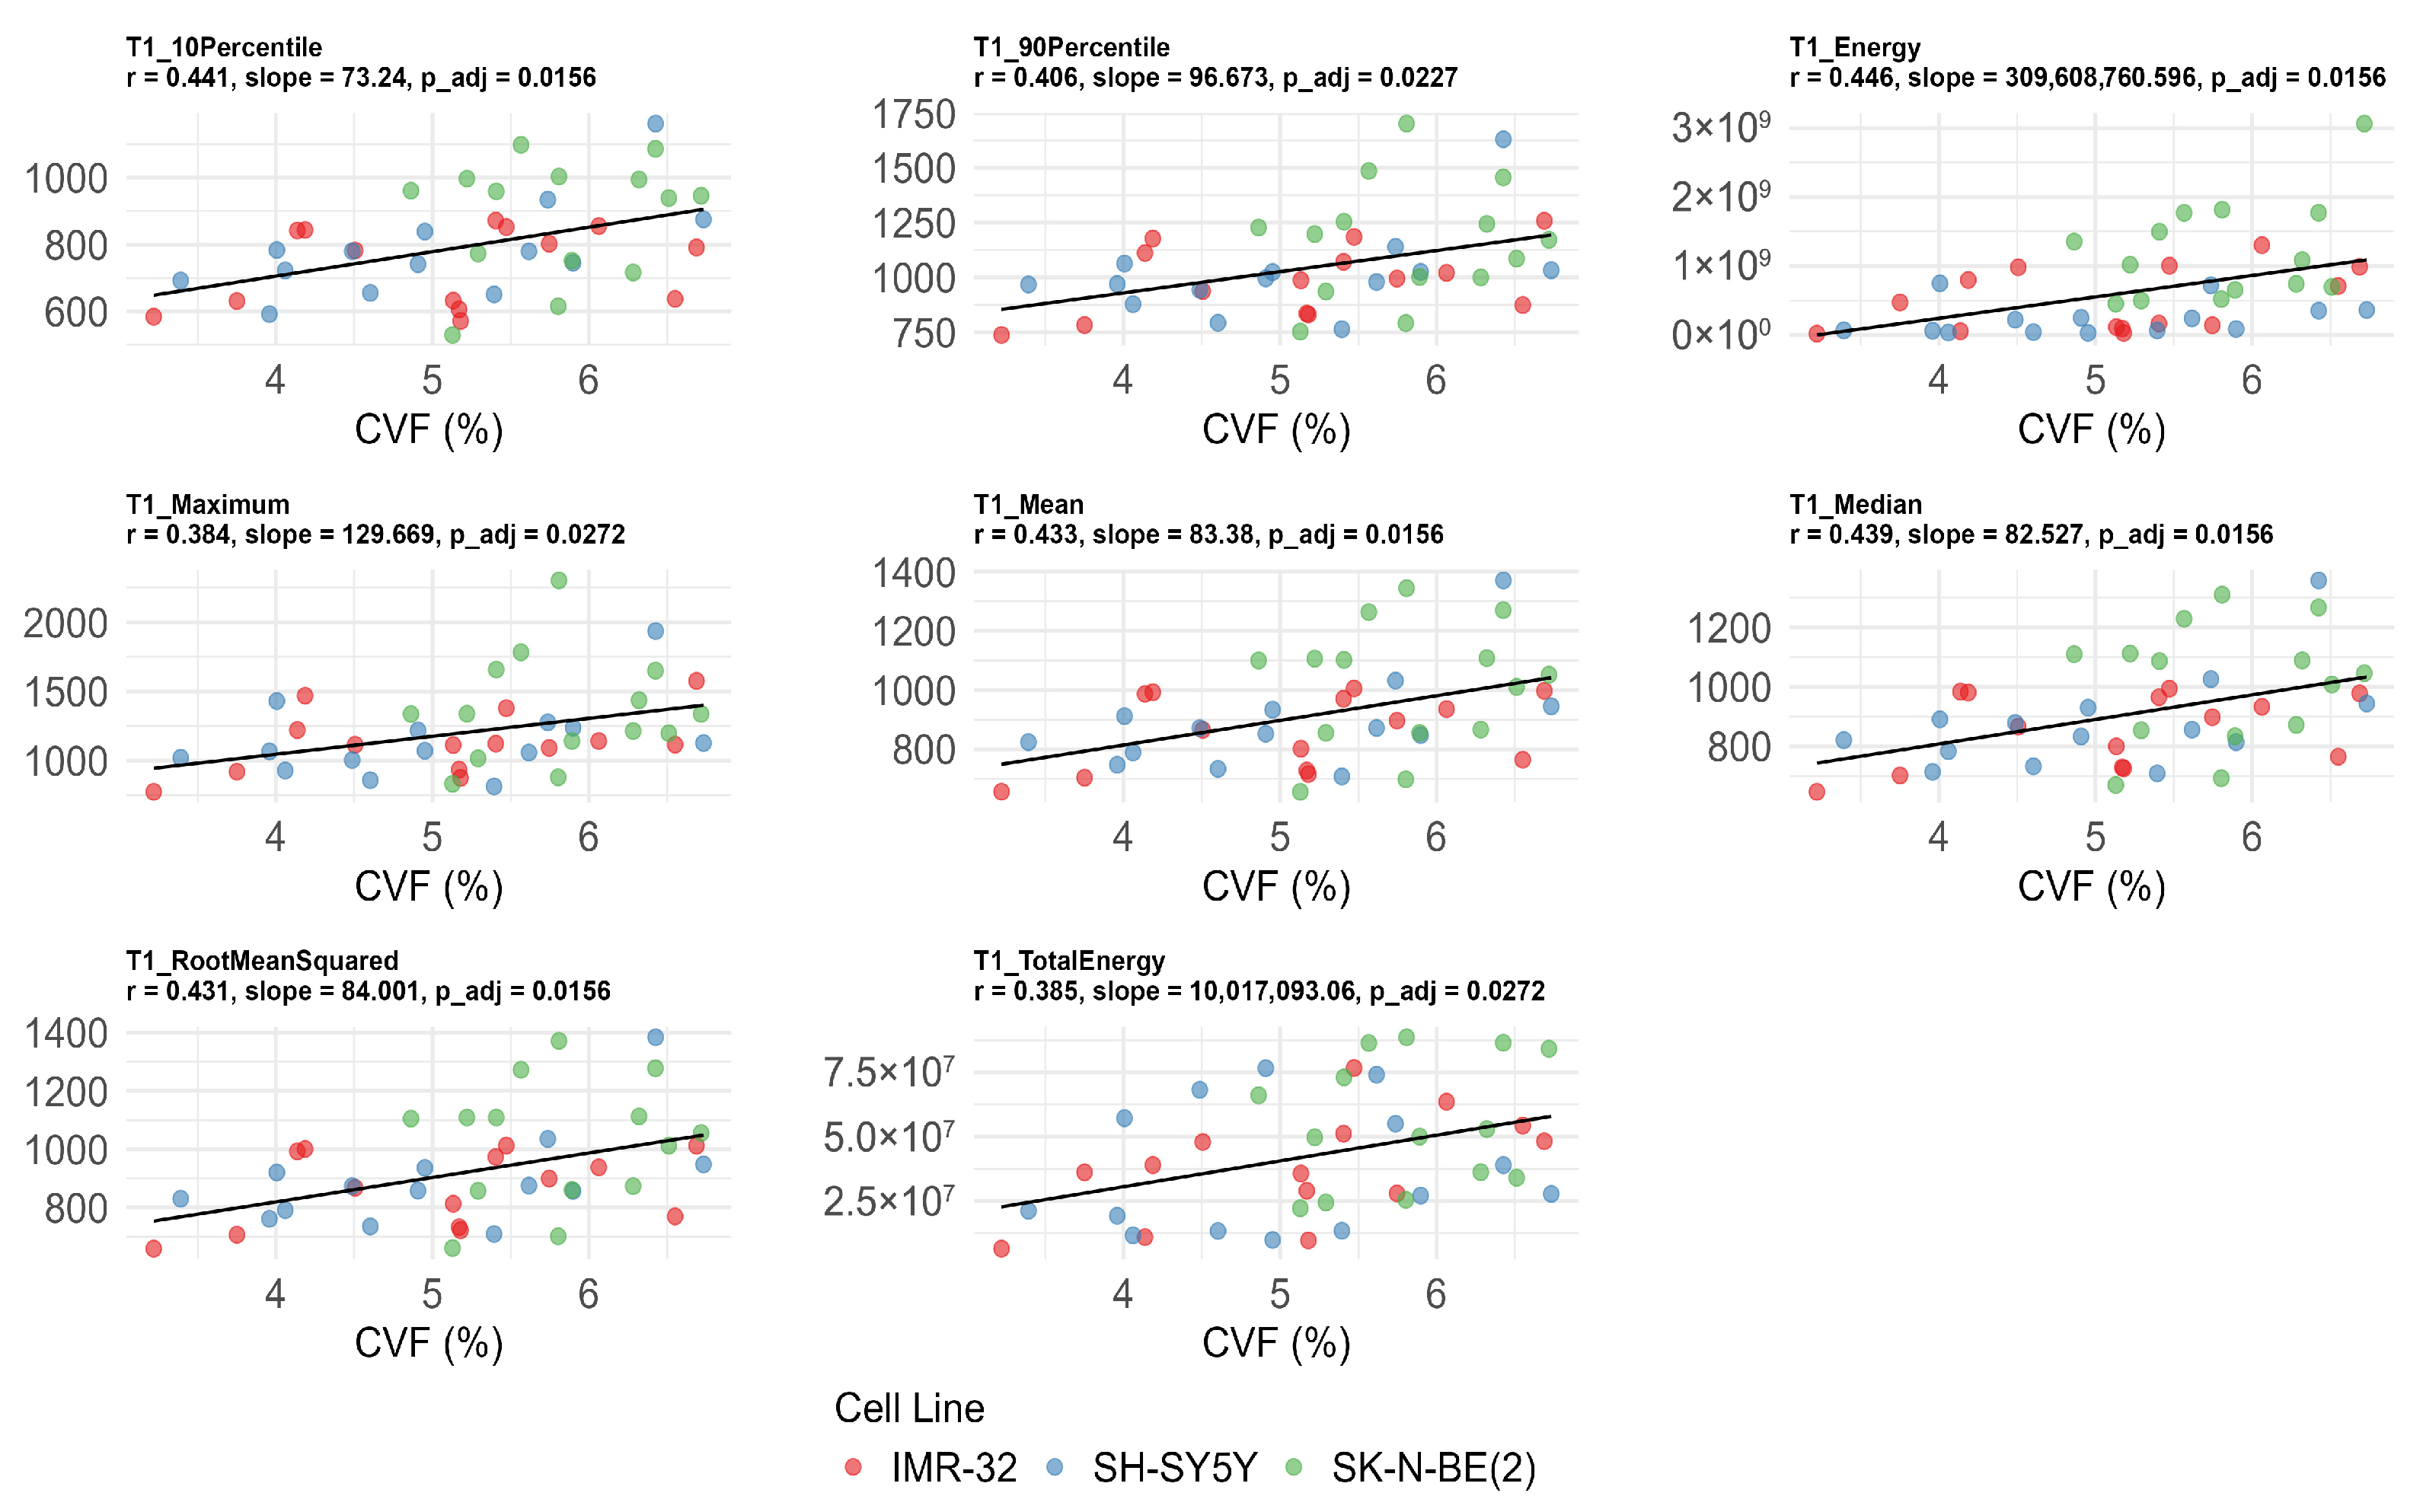
3.4. Correlation Between T1 Values, Ki-67 Expression, MVD, and CVF
3.5. Inter-Observer Agreement
4. Discussion
4.1. Summary of Key Findings and Translational Implications
4.2. Impact of MYCN Amplification on Tumor Biology
4.3. ADC Histogram Features and Tumor Proliferation
4.4. Variability in the Associations Between ADC and MVD
4.5. T1 Histogram Features Reflecting Tumor Microenvironment
4.6. Limitations and Future Directions
5. Conclusions
Supplementary Materials
Author Contributions
Funding
Institutional Review Board Statement
Informed Consent Statement
Data Availability Statement
Conflicts of Interest
Abbreviations
| TME | tumor microenvironment |
| ECM | extracellular matrix |
| MVD | microvessel density |
| MRI | magnetic resonance imaging |
| ROI | region of interest |
| T1WI | T1-weighted imaging |
| T2WI | T2-weighted imaging |
| DWI | diffusion-weighted imaging |
| ADC | apparent diffusion coefficient |
| TR | repetition time |
| TE | echo time |
| FOV | field of view |
| VFA | variable flip angle |
| CVF | collagen volume fraction |
| ANOVA | one-way analysis of variance |
| SD | standard deviation |
| ICCs | intra-class correlation coefficients |
| IVIM | intravoxel incoherent motion |
| FDR | false discovery rate |
| SPGR | spoiled gradient-recalled echo |
References
- Gomez, R.L.; Ibragimova, S.; Ramachandran, R.; Philpott, A.; Ali, F.R. Tumoral heterogeneity in neuroblastoma. Biochim. Et Biophys. Acta. Rev. Cancer 2022, 1877, 188805. [Google Scholar] [CrossRef]
- Jarzembowski, J.A.; Navarro, S.; Shimada, H. Peripheral neuroblastic tumors behaving badly: An update on high-risk morphologic and molecular groupings. Virchows Arch. Int. J. Pathol. 2025, 486, 895–903. [Google Scholar] [CrossRef]
- Stafman, L.L.; Beierle, E.A. Cell Proliferation in Neuroblastoma. Cancers 2016, 8, 13. [Google Scholar] [CrossRef] [PubMed]
- Irwin, M.S.; Goldsmith, K.C. Current and Emerging Biomarkers: Impact on Risk Stratification for Neuroblastoma. J. Natl. Compr. Cancer Netw. JNCCN 2024, 22, e247051. [Google Scholar] [CrossRef] [PubMed]
- Louault, K.; De Clerck, Y.A.; Janoueix-Lerosey, I. The neuroblastoma tumor microenvironment: From an in-depth characterization towards novel therapies. EJC Paediatr. Oncol. 2024, 3, 100161. [Google Scholar] [CrossRef] [PubMed]
- Henke, E.; Nandigama, R.; Ergün, S. Extracellular Matrix in the Tumor Microenvironment and Its Impact on Cancer Therapy. Front. Mol. Biosci. 2019, 6, 160. [Google Scholar] [CrossRef]
- Privitera, L.; Musleh, L.; Paraboschi, I.; Ogunlade, O.; Ogunbiyi, O.; Hutchinson, J.C.; Sebire, N.; Beard, P.; Giuliani, S. Dynamic Changes in Microvascular Density Can Predict Viable and Non-Viable Areas in High-Risk Neuroblastoma. Cancers 2023, 15, 917. [Google Scholar] [CrossRef]
- Yuan, Z.; Li, Y.; Zhang, S.; Wang, X.; Dou, H.; Yu, X.; Zhang, Z.; Yang, S.; Xiao, M. Extracellular matrix remodeling in tumor progression and immune escape: From mechanisms to treatments. Mol. Cancer 2023, 22, 48. [Google Scholar] [CrossRef]
- Horwacik, I. The Extracellular Matrix and Neuroblastoma Cell Communication-A Complex Interplay and Its Therapeutic Implications. Cells 2022, 11, 3172. [Google Scholar] [CrossRef]
- Tadeo, I.; Berbegall, A.P.; Navarro, S.; Castel, V.; Noguera, R. A stiff extracellular matrix is associated with malignancy in peripheral neuroblastic tumors. Pediatr. Blood Cancer 2017, 64, e26449. [Google Scholar] [CrossRef]
- Tadeo, I.; Berbegall, A.P.; Castel, V.; García-Miguel, P.; Callaghan, R.; Påhlman, S.; Navarro, S.; Noguera, R. Extracellular matrix composition defines an ultra-high-risk group of neuroblastoma within the high-risk patient cohort. Br. J. Cancer 2016, 115, 480–489. [Google Scholar] [CrossRef]
- Polychronopoulos, P.A.; Bedoya-Reina, O.C.; Johnsen, J.I. The Neuroblastoma Microenvironment, Heterogeneity and Immunotherapeutic Approaches. Cancers 2024, 16, 1863. [Google Scholar] [CrossRef]
- Wang, H.; Cai, J. Quantitative MRI in Childhood Neuroblastoma: Beyond the Assessment of Image-defined Risk Factors. Radiol. Imaging Cancer 2024, 6, e240089. [Google Scholar] [CrossRef]
- Tambasco, D.; Zlotnik, M.; Joshi, S.; Moineddin, R.; Harris, S.; Villani, A.; Malkin, D.; Morgenstern, D.A.; Doria, A.S. Characterisation of Paediatric Neuroblastic Tumours by Quantitative Structural and Diffusion-Weighted MRI. J. Clin. Med. 2024, 13, 6660. [Google Scholar] [CrossRef]
- Abele, N.; Langner, S.; Felbor, U.; Lode, H.; Hosten, N. Quantitative Diffusion-Weighted MRI of Neuroblastoma. Cancers 2023, 15, 1940. [Google Scholar] [CrossRef]
- Mora, J.; Castañeda, A.; Colombo, M.C.; Gorostegui, M.; Gomez, F.; Mañe, S.; Santa-Maria, V.; Garraus, M.; Macias, N.; Perez-Jaume, S.; et al. Clinical and Pathological Evidence of Anti-GD2 Immunotherapy Induced Differentiation in Relapsed/Refractory High-Risk Neuroblastoma. Cancers 2021, 13, 1264. [Google Scholar] [CrossRef] [PubMed]
- Keller, S.; Borde, T.; Brangsch, J.; Adams, L.C.; Kader, A.; Reimann, C.; Gebert, P.; Hamm, B.; Makowski, M. Native T1 Mapping Magnetic Resonance Imaging as a Quantitative Biomarker for Characterization of the Extracellular Matrix in a Rabbit Hepatic Cancer Model. Biomedicines 2020, 8, 412. [Google Scholar] [CrossRef] [PubMed]
- Li, Z.; Sun, J.; Hu, X.; Huang, N.; Han, G.; Chen, L.; Zhou, Y.; Bai, W.; Yang, X. Assessment of liver fibrosis by variable flip angle T1 mapping at 3.0T. J. Magn. Reson. Imaging 2016, 43, 698–703. [Google Scholar] [CrossRef]
- Li, J.; Gao, X.; Dominik Nickel, M.; Cheng, J.; Zhu, J. Native T1 mapping for differentiating the histopathologic type, grade, and stage of rectal adenocarcinoma: A pilot study. Cancer Imaging Off. Publ. Int. Cancer Imaging Soc. 2022, 22, 30. [Google Scholar] [CrossRef]
- Adams, L.C.; Ralla, B.; Jurmeister, P.; Bressem, K.K.; Fahlenkamp, U.L.; Hamm, B.; Busch, J.; Makowski, M.R. Native T1 Mapping as an In Vivo Biomarker for the Identification of Higher-Grade Renal Cell Carcinoma: Correlation With Histopathological Findings. Investig. Radiol. 2019, 54, 118–128. [Google Scholar] [CrossRef]
- Beck, K.S.; Chang, S.; Hyun, K.; Sung, Y.E.; Lee, K.Y.; Jung, J.I. T1 and T2 Mapping for Characterization of Mediastinal Masses: A Feasibility study. Can. Assoc. Radiol. J. 2023, 74, 723–736. [Google Scholar] [CrossRef]
- Zormpas-Petridis, K.; Poon, E.; Clarke, M.; Jerome, N.P.; Boult, J.K.R.; Blackledge, M.D.; Carceller, F.; Koers, A.; Barone, G.; Pearson, A.D.J.; et al. Noninvasive MRI Native T(1) Mapping Detects Response to MYCN-targeted Therapies in the Th-MYCN Model of Neuroblastoma. Cancer Res. 2020, 80, 3424–3435. [Google Scholar] [CrossRef]
- Lu, J.; Zhao, S.; Ma, F.; Li, H.; Li, Y.; Qiang, J. Whole-tumor ADC histogram analysis for differentiating endometriosis-related tumors: Seromucinous borderline tumor, clear cell carcinoma and endometrioid carcinoma. Abdom. Radiol. 2023, 48, 724–732. [Google Scholar] [CrossRef]
- Ghosh, A.; Yekeler, E.; Dalal, D.; Holroyd, A.; States, L. Whole-tumour apparent diffusion coefficient (ADC) histogram analysis to identify MYCN-amplification in neuroblastomas: Preliminary results. Eur. Radiol. 2022, 32, 8453–8462. [Google Scholar] [CrossRef]
- Yan, P.; Qi, F.; Bian, L.; Xu, Y.; Zhou, J.; Hu, J.; Ren, L.; Li, M.; Tang, W. Comparison of Incidence and Outcomes of Neuroblastoma in Children, Adolescents, and Adults in the United States: A Surveillance, Epidemiology, and End Results (SEER) Program Population Study. Med. Sci. Monit. Int. Med. J. Exp. Clin. Res. 2020, 26, e927218. [Google Scholar] [CrossRef]
- Agarwal, P.; Glowacka, A.; Mahmoud, L.; Bazzar, W.; Larsson, L.G.; Alzrigat, M. MYCN Amplification Is Associated with Reduced Expression of Genes Encoding γ-Secretase Complex and NOTCH Signaling Components in Neuroblastoma. Int. J. Mol. Sci. 2023, 24, 8141. [Google Scholar] [CrossRef]
- Yamashita, K.; Kiyonari, S.; Tsubota, S.; Kishida, S.; Sakai, R.; Kadomatsu, K. Thymidylate synthase inhibitor raltitrexed can induce high levels of DNA damage in MYCN-amplified neuroblastoma cells. Cancer Sci. 2020, 111, 2431–2439. [Google Scholar] [CrossRef]
- López-Carrasco, A.; Martín-Vañó, S.; Burgos-Panadero, R.; Monferrer, E.; Berbegall, A.P.; Fernández-Blanco, B.; Navarro, S.; Noguera, R. Impact of extracellular matrix stiffness on genomic heterogeneity in MYCN-amplified neuroblastoma cell line. J. Exp. Clin. Cancer Res. 2020, 39, 226. [Google Scholar] [CrossRef]
- Cheung, B.B.; Kleynhans, A.; Mittra, R.; Kim, P.Y.; Holien, J.K.; Nagy, Z.; Ciampa, O.C.; Seneviratne, J.A.; Mayoh, C.; Raipuria, M.; et al. A novel combination therapy targeting ubiquitin-specific protease 5 in MYCN-driven neuroblastoma. Oncogene 2021, 40, 2367–2381. [Google Scholar] [CrossRef]
- Wang, F.; Yang, Q.; Zhang, Y.; Liu, J.; Liu, M.; Zhu, J. 3D variable flip angle T1 mapping for differentiating benign and malignant liver lesions at 3T: Comparison with diffusion weighted imaging. BMC Med. Imaging 2022, 22, 146. [Google Scholar] [CrossRef]
- Tao, J.; Yin, Z.; Li, X.; Zhang, Y.; Zhang, K.; Yang, Y.; Fang, S.; Wang, S. Correlation between IVIM parameters and microvessel architecture: Direct comparison of MRI images and pathological slices in an orthotopic murine model of rhabdomyosarcoma. Eur. Radiol. 2023, 33, 8576–8584. [Google Scholar] [CrossRef]
- Koo, T.K.; Li, M.Y. A Guideline of Selecting and Reporting Intraclass Correlation Coefficients for Reliability Research. J. Chiropr. Med. 2016, 15, 155–163. [Google Scholar] [CrossRef]
- Dhanasekaran, R.; Deutzmann, A.; Mahauad-Fernandez, W.D.; Hansen, A.S.; Gouw, A.M.; Felsher, D.W. The MYC oncogene—The grand orchestrator of cancer growth and immune evasion. Nat. Rev. Clin. Oncol. 2022, 19, 23–36. [Google Scholar] [CrossRef]
- Bartolucci, D.; Montemurro, L.; Raieli, S.; Lampis, S.; Pession, A.; Hrelia, P.; Tonelli, R. MYCN Impact on High-Risk Neuroblastoma: From Diagnosis and Prognosis to Targeted Treatment. Cancers 2022, 14, 4421. [Google Scholar] [CrossRef]
- Lai, B.; Yi, Y.; Yang, X.; Li, X.; Xu, L.; Yan, Z.; Yang, L.; Han, R.; Hu, H.; Duan, X. Dynamic contrast-enhanced and diffusion-weighted MRI of cervical carcinoma: Correlations with Ki-67 proliferation status. Magn. Reson. Imaging 2024, 112, 136–143. [Google Scholar] [CrossRef]
- Li, J.L.; Xu, Y.; Xiang, Y.S.; Wu, P.; Shen, A.J.; Wang, P.J.; Wang, F. Comparative Analysis of Amide Proton Transfer and Diffusionweighted Imaging for Assessing Ki-67, p53 and PD-L1 Expression in Bladder Cancer. Acad. Radiol. 2025, 32, 834–843. [Google Scholar] [CrossRef]
- Ma, L.; Guo, L.; Zhu, X.; Yi, X.; Du, W.; Lan, X.; Wang, P. Diffusion-weighted MRI of advanced gastric cancer: Correlations of the apparent diffusion coefficient with Borrmann classification, proliferation and aggressiveness. Abdom. Radiol 2025, 50, 3395–3405. [Google Scholar] [CrossRef]
- Surov, A.; Meyer, H.J.; Wienke, A. Associations between apparent diffusion coefficient (ADC) and KI 67 in different tumors: A meta-analysis. Part 1: ADC(mean). Oncotarget 2017, 8, 75434–75444. [Google Scholar] [CrossRef]
- Yang, Y.; Fang, S.; Tao, J.; Liu, Y.; Wang, C.; Yin, Z.; Chen, B.; Duan, Z.; Liu, W.; Wang, S. Correlation of Apparent Diffusion Coefficient With Proliferation and Apoptotic Indexes in a Murine Model of Fibrosarcoma: Comparison of Four Methods for MRI Region of Interest Positioning. J. Magn. Reson. Imaging 2023, 57, 1406–1413. [Google Scholar] [CrossRef]
- Jung, D.C.; Lee, H.J.; Seo, J.W.; Park, S.Y.; Lee, S.J.; Lee, J.H.; Kim, I.H. Diffusion-weighted imaging of a prostate cancer xenograft model seen on a 7 Tesla animal MR scanner: Comparison of ADC values and pathologic findings. Korean J. Radiol. 2012, 13, 82–89. [Google Scholar] [CrossRef][Green Version]
- Meyer, H.J.; Hamerla, G.; Leifels, L.; Höhn, A.K.; Surov, A. Whole-lesion ADC histogram analysis is not able to reflect microvessel density in HNSCC. Medicine 2019, 98, e15520. [Google Scholar] [CrossRef]
- Jamin, Y.; Tucker, E.R.; Poon, E.; Popov, S.; Vaughan, L.; Boult, J.K.; Webber, H.; Hallsworth, A.; Baker, L.C.; Jones, C.; et al. Evaluation of clinically translatable MR imaging biomarkers of therapeutic response in the TH-MYCN transgenic mouse model of neuroblastoma. Radiology 2013, 266, 130–140. [Google Scholar] [CrossRef]
- Lo Buglio, G.; Lo Cicero, A.; Campora, S.; Ghersi, G. The Multifaced Role of Collagen in Cancer Development and Progression. Int. J. Mol. Sci. 2024, 25, 13523. [Google Scholar] [CrossRef]
- Kuczek, D.E.; Larsen, A.M.H.; Thorseth, M.L.; Carretta, M.; Kalvisa, A.; Siersbæk, M.S.; Simões, A.M.C.; Roslind, A.; Engelholm, L.H.; Noessner, E.; et al. Collagen density regulates the activity of tumor-infiltrating T cells. J. Immunother. Cancer 2019, 7, 68. [Google Scholar] [CrossRef]
- Yalcin, A.; Goktepeli, M.; Taydas, O.; Sayar, I. Native T1 mapping of the breast in MRI to differentiate fibroadenomas from benign phyllodes tumors: A preliminary study. Magma 2022, 35, 441–447. [Google Scholar] [CrossRef]
- Lian, C.; Zhuang, L.; Wang, Z.; Liang, J.; Wu, Y.; Huang, Y.; Dai, Y.; Huang, R. The diagnostic performance of T1 mapping in the assessment of breast lesions: A preliminary study. Eur. J. Radiol. 2024, 177, 111589. [Google Scholar] [CrossRef]
- Qu, J.; Pan, B.; Su, T.; Chen, Y.; Zhang, T.; Chen, X.; Zhu, X.; Xu, Z.; Wang, T.; Zhu, J.; et al. T1 and T2 mapping for identifying malignant lymph nodes in head and neck squamous cell carcinoma. Cancer Imaging Off. Publ. Int. Cancer Imaging Soc. 2023, 23, 125. [Google Scholar] [CrossRef]
- Cao, T.; Jiang, R.; Zheng, L.; Zhang, R.; Chen, X.; Wang, Z.; Jiang, P.; Chen, Y.; Zhong, T.; Chen, H.; et al. T1 and ADC histogram parameters may be an in vivo biomarker for predicting the grade, subtype, and proliferative activity of meningioma. Eur. Radiol. 2023, 33, 258–269. [Google Scholar] [CrossRef]
- Krawczyk, E.; Kitlińska, J. Preclinical Models of Neuroblastoma-Current Status and Perspectives. Cancers 2023, 15, 3314. [Google Scholar] [CrossRef]


| Feature | Unit (ADC) | Unit (T1) | Interpretation |
|---|---|---|---|
| 10Percentile | ×10−6 mm2/s | ms | Intensity value at the 10th percentile of the voxel distribution |
| 90Percentile | ×10−6 mm2/s | ms | Intensity value at the 90th percentile of the voxel distribution |
| Energy | (×10−6 mm2/s)2 | ms2 | Sum of squared voxel intensities; higher values indicate greater overall intensity magnitude |
| Entropy | — | — | Measure of randomness or uncertainty in voxel intensities; higher values indicate greater heterogeneity |
| InterquartileRange | ×10−6 mm2/s | ms | Difference between the 75th and 25th percentile intensity values |
| Kurtosis | — | — | Degree of peakedness of the intensity distribution; higher values indicate sharper peaks or more extreme values |
| Maximum | ×10−6 mm2/s | ms | Maximum voxel intensity |
| MeanAbsoluteDeviation | ×10−6 mm2/s | ms | Average absolute deviation of voxel intensities from the mean |
| Mean | ×10−6 mm2/s | ms | Average voxel intensity |
| Median | ×10−6 mm2/s | ms | Median voxel intensity |
| Minimum | ×10−6 mm2/s | ms | Minimum voxel intensity |
| Range | ×10−6 mm2/s | ms | Difference between maximum and minimum voxel intensities |
| RobustMeanAbsoluteDeviation | ×10−6 mm2/s | ms | Average absolute deviation of voxel intensities from the mean |
| RootMeanSquared | ×10−6 mm2/s | ms | Square root of the mean of squared voxel intensities; reflects overall magnitude |
| Skewness | — | — | Degree of asymmetry of the intensity distribution relative to the mean |
| TotalEnergy | (×10−6 mm2/s)2 × mm3 | ms2 × mm3 | Energy feature scaled by the total voxel volume |
| Uniformity | — | — | Sum of squared voxel intensities normalized by the total number of voxels; higher values indicate greater homogeneity |
| Variance | (×10−6 mm2/s)2 | ms2 | Mean of squared deviations of voxel intensities from the mean; reflects distribution spread |
| ADC Features | Ki-67 | MVD | CVF | |||||||||
|---|---|---|---|---|---|---|---|---|---|---|---|---|
| r | Slope | p-Value | FDR p-Value | r | Slope | p-Value | FDR p-Value | r | Slope | p-Value | FDR p-Value | |
| 10Percentile | −0.397 | −14.351 | 0.009 | 0.032 * | −0.188 | −3.674 | 0.234 | 0.429 | 0.160 | 55.217 | 0.312 | 0.803 |
| 90Percentile | −0.394 | −23.827 | 0.010 | 0.032 * | −0.186 | −6.094 | 0.238 | 0.429 | 0.031 | 17.885 | 0.846 | 0.948 |
| Energy | −0.095 | −1,986,692.721 | 0.548 | 0.617 | 0.089 | 1,002,664.923 | 0.576 | 0.654 | 0.242 | 48,067,808.520 | 0.123 | 0.803 |
| Entropy | −0.223 | −0.015 | 0.156 | 0.234 | −0.031 | −0.001 | 0.846 | 0.875 | 0.020 | 0.013 | 0.898 | 0.948 |
| InterquartileRange | −0.297 | −5.599 | 0.057 | 0.110 | −0.112 | −1.150 | 0.478 | 0.615 | −0.092 | −16.635 | 0.561 | 0.803 |
| Kurtosis | 0.045 | 0.004 | 0.778 | 0.824 | −0.270 | −0.013 | 0.083 | 0.429 | −0.021 | −0.017 | 0.896 | 0.948 |
| Maximum | −0.362 | −27.082 | 0.019 | 0.048 * | −0.214 | −8.692 | 0.173 | 0.429 | −0.010 | −7.395 | 0.948 | 0.948 |
| MeanAbsoluteDeviation | −0.292 | −3.191 | 0.061 | 0.110 | −0.139 | −0.822 | 0.381 | 0.571 | −0.103 | −10.738 | 0.517 | 0.803 |
| Mean | −0.421 | −18.547 | 0.005 | 0.032 * | −0.189 | −4.509 | 0.230 | 0.429 | 0.111 | 46.511 | 0.485 | 0.803 |
| Median | −0.422 | −17.724 | 0.005 | 0.032 * | −0.186 | −4.228 | 0.238 | 0.429 | 0.139 | 55.800 | 0.379 | 0.803 |
| Minimum | −0.390 | −13.191 | 0.011 | 0.032 * | −0.208 | −3.811 | 0.186 | 0.429 | 0.145 | 46.933 | 0.359 | 0.803 |
| Range | −0.251 | −13.891 | 0.108 | 0.177 | −0.163 | −4.881 | 0.302 | 0.494 | −0.103 | −54.329 | 0.516 | 0.803 |
| RobustMeanAbsoluteDeviation | −0.307 | −2.463 | 0.048 | 0.108 | −0.117 | −0.508 | 0.461 | 0.615 | −0.088 | −6.740 | 0.580 | 0.803 |
| RootMeanSquared | −0.419 | −18.890 | 0.006 | 0.032 * | −0.193 | −4.717 | 0.221 | 0.429 | 0.097 | 41.760 | 0.542 | 0.803 |
| Skewness | −0.021 | −0.001 | 0.894 | 0.894 | −0.310 | −0.009 | 0.046 | 0.429 | −0.156 | −0.081 | 0.324 | 0.803 |
| TotalEnergy | −0.098 | −930,886.009 | 0.539 | 0.617 | 0.088 | 452,553.132 | 0.581 | 0.654 | 0.240 | 21,859,364.951 | 0.126 | 0.803 |
| Uniformity | 0.215 | 0.001 | 0.172 | 0.238 | 0.025 | 0.000 | 0.875 | 0.875 | −0.011 | 0.000 | 0.947 | 0.948 |
| Variance | −0.183 | −1916.782 | 0.246 | 0.316 | −0.188 | −1062.828 | 0.234 | 0.429 | −0.220 | −22,012.572 | 0.161 | 0.803 |
| T1 Features | Ki-67 | MVD | CVF | |||||||||
|---|---|---|---|---|---|---|---|---|---|---|---|---|
| r | Slope | p-Value | FDR p-Value | r | Slope | p-Value | FDR p-Value | r | Slope | p-Value | FDR p-Value | |
| 10Percentile | −0.248 | −4.310 | 0.114 | 0.660 | 0.231 | 2.183 | 0.140 | 0.168 | 0.441 | 73.24 | 0.003 | 0.016 * |
| 90Percentile | −0.124 | −3.098 | 0.433 | 0.708 | 0.332 | 4.478 | 0.032 | 0.096 | 0.406 | 96.673 | 0.008 | 0.023 * |
| Energy | 0.129 | 9,417,086.726 | 0.414 | 0.708 | 0.286 | 11,260,685.37 | 0.067 | 0.100 | 0.446 | 309,608,760.6 | 0.003 | 0.016 * |
| Entropy | 0.127 | 0.007 | 0.422 | 0.708 | 0.368 | 0.011 | 0.016 | 0.075 | 0.256 | 0.14 | 0.102 | 0.154 |
| InterquartileRange | 0.096 | 0.662 | 0.546 | 0.754 | 0.265 | 0.993 | 0.090 | 0.115 | 0.116 | 7.687 | 0.463 | 0.490 |
| Kurtosis | −0.219 | −0.020 | 0.163 | 0.660 | 0.184 | 0.009 | 0.245 | 0.245 | 0.256 | 0.218 | 0.101 | 0.154 |
| Maximum | −0.086 | −3.058 | 0.586 | 0.754 | 0.359 | 6.884 | 0.019 | 0.075 | 0.384 | 129.669 | 0.012 | 0.027 * |
| MeanAbsoluteDeviation | 0.075 | 0.290 | 0.639 | 0.766 | 0.318 | 0.669 | 0.040 | 0.100 | 0.168 | 6.23 | 0.287 | 0.345 |
| Mean | −0.176 | −3.556 | 0.264 | 0.660 | 0.288 | 3.14 | 0.065 | 0.100 | 0.433 | 83.38 | 0.004 | 0.016 * |
| Median | −0.174 | −3.433 | 0.270 | 0.660 | 0.270 | 2.883 | 0.084 | 0.115 | 0.439 | 82.527 | 0.004 | 0.016 * |
| Minimum | −0.265 | −4.038 | 0.090 | 0.660 | 0.220 | 1.817 | 0.161 | 0.182 | 0.332 | 48.339 | 0.032 | 0.063 |
| Range | 0.037 | 0.980 | 0.815 | 0.863 | 0.356 | 5.067 | 0.021 | 0.075 | 0.324 | 81.33 | 0.036 | 0.065 |
| RobustMeanAbsoluteDeviation | 0.109 | 0.308 | 0.493 | 0.739 | 0.286 | 0.44 | 0.066 | 0.100 | 0.117 | 3.156 | 0.462 | 0.490 |
| RootMeanSquared | −0.172 | −3.504 | 0.277 | 0.660 | 0.292 | 3.223 | 0.061 | 0.100 | 0.431 | 84.001 | 0.004 | 0.016 * |
| Skewness | −0.051 | −0.003 | 0.750 | 0.844 | 0.184 | 0.005 | 0.244 | 0.245 | 0.064 | 0.031 | 0.689 | 0.689 |
| TotalEnergy | 0.166 | 452,989.793 | 0.293 | 0.660 | 0.436 | 643,801.091 | 0.004 | 0.071 | 0.385 | 10,017,093.06 | 0.012 | 0.027 * |
| Uniformity | −0.183 | −0.001 | 0.246 | 0.660 | −0.374 | −0.001 | 0.015 | 0.075 | −0.214 | −0.007 | 0.173 | 0.239 |
| Variance | 0.019 | 26.533 | 0.904 | 0.904 | 0.290 | 216.393 | 0.062 | 0.100 | 0.192 | 2524.117 | 0.223 | 0.287 |
Disclaimer/Publisher’s Note: The statements, opinions and data contained in all publications are solely those of the individual author(s) and contributor(s) and not of MDPI and/or the editor(s). MDPI and/or the editor(s) disclaim responsibility for any injury to people or property resulting from any ideas, methods, instructions or products referred to in the content. |
© 2025 by the authors. Licensee MDPI, Basel, Switzerland. This article is an open access article distributed under the terms and conditions of the Creative Commons Attribution (CC BY) license (https://creativecommons.org/licenses/by/4.0/).
Share and Cite
Wang, H.; Cheng, X.; Hu, Q.; Nie, L.; Zhu, W.; Tong, Y.; Chen, X.; He, L.; Zhu, H.; Huang, J.; et al. Apparent Diffusion Coefficient and Native T1 Mapping Histogram Analyses Reveal Tumor Proliferation and Microenvironment in Neuroblastoma Xenografts. Cancers 2025, 17, 3433. https://doi.org/10.3390/cancers17213433
Wang H, Cheng X, Hu Q, Nie L, Zhu W, Tong Y, Chen X, He L, Zhu H, Huang J, et al. Apparent Diffusion Coefficient and Native T1 Mapping Histogram Analyses Reveal Tumor Proliferation and Microenvironment in Neuroblastoma Xenografts. Cancers. 2025; 17(21):3433. https://doi.org/10.3390/cancers17213433
Chicago/Turabian StyleWang, Haoru, Xiang Cheng, Qian Hu, Lisha Nie, Weiyi Zhu, Yingxue Tong, Xin Chen, Ling He, Huiru Zhu, Jie Huang, and et al. 2025. "Apparent Diffusion Coefficient and Native T1 Mapping Histogram Analyses Reveal Tumor Proliferation and Microenvironment in Neuroblastoma Xenografts" Cancers 17, no. 21: 3433. https://doi.org/10.3390/cancers17213433
APA StyleWang, H., Cheng, X., Hu, Q., Nie, L., Zhu, W., Tong, Y., Chen, X., He, L., Zhu, H., Huang, J., Su, J., Zeng, C., & Cai, J. (2025). Apparent Diffusion Coefficient and Native T1 Mapping Histogram Analyses Reveal Tumor Proliferation and Microenvironment in Neuroblastoma Xenografts. Cancers, 17(21), 3433. https://doi.org/10.3390/cancers17213433


