The Impact of Design Misspecifications on Survival Outcomes in Cancer Clinical Trials
Simple Summary
Abstract
1. Introduction
2. Methods
2.1. Design Framework
2.1.1. Event-Based Design
2.1.2. Fixed Follow-Up Duration Design
2.2. Simulation Setup
2.2.1. Original Designs
- Two arms randomized at a 1:1 ratio;
- Survival distribution of control arm:
- ○
- follows exponential distribution;
- ○
- median survival time = 3 years;
- Treatment effect:
- ○
- proportional hazards;
- ○
- hazard ratio (HR, experiment versus control) = 0.6;
- Type I error of one-sided 0.025 and 90% power;
- Accrual rate = 10 pts/month, uniformly distributed.
2.2.2. Deviations Evaluated
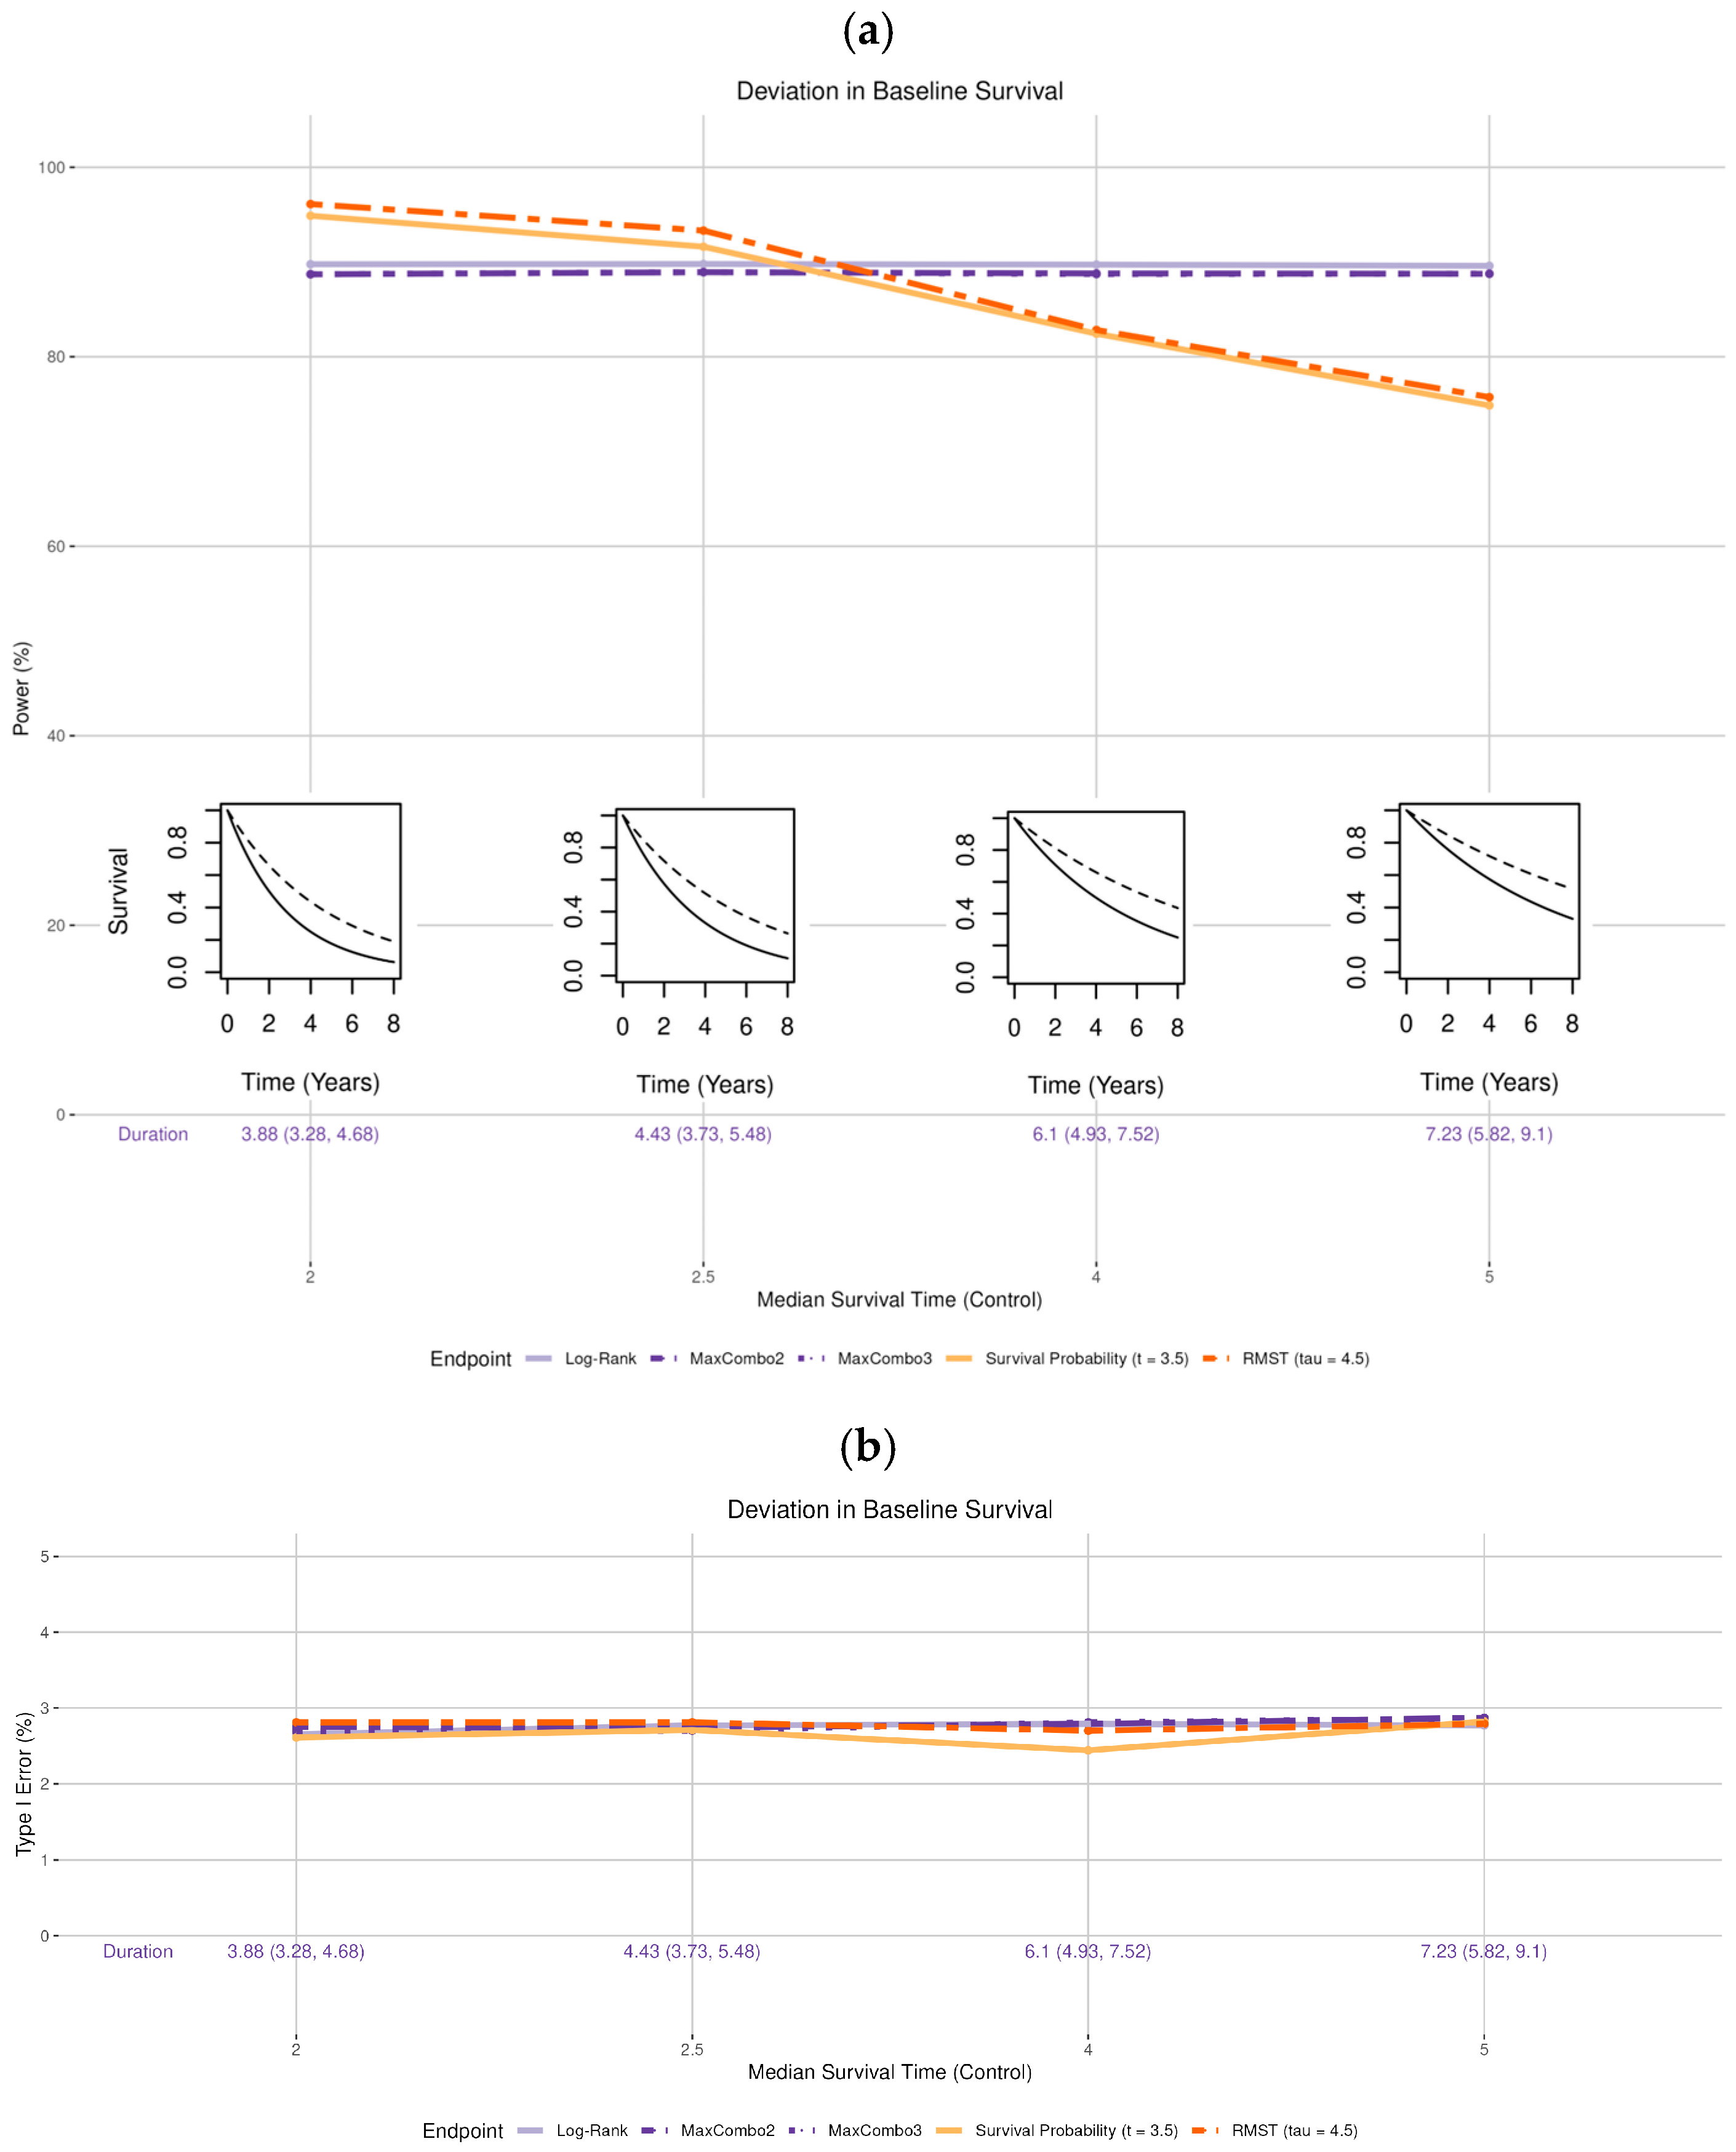
- Survival distribution of the control arm (Figure 2 insets): the observed median survival was set to be shorter than the expected time of 3 years (2 and 2.5 years, i.e., worse survival) and longer than expected (4 and 5 years, i.e., better survival).
- Treatment effect:
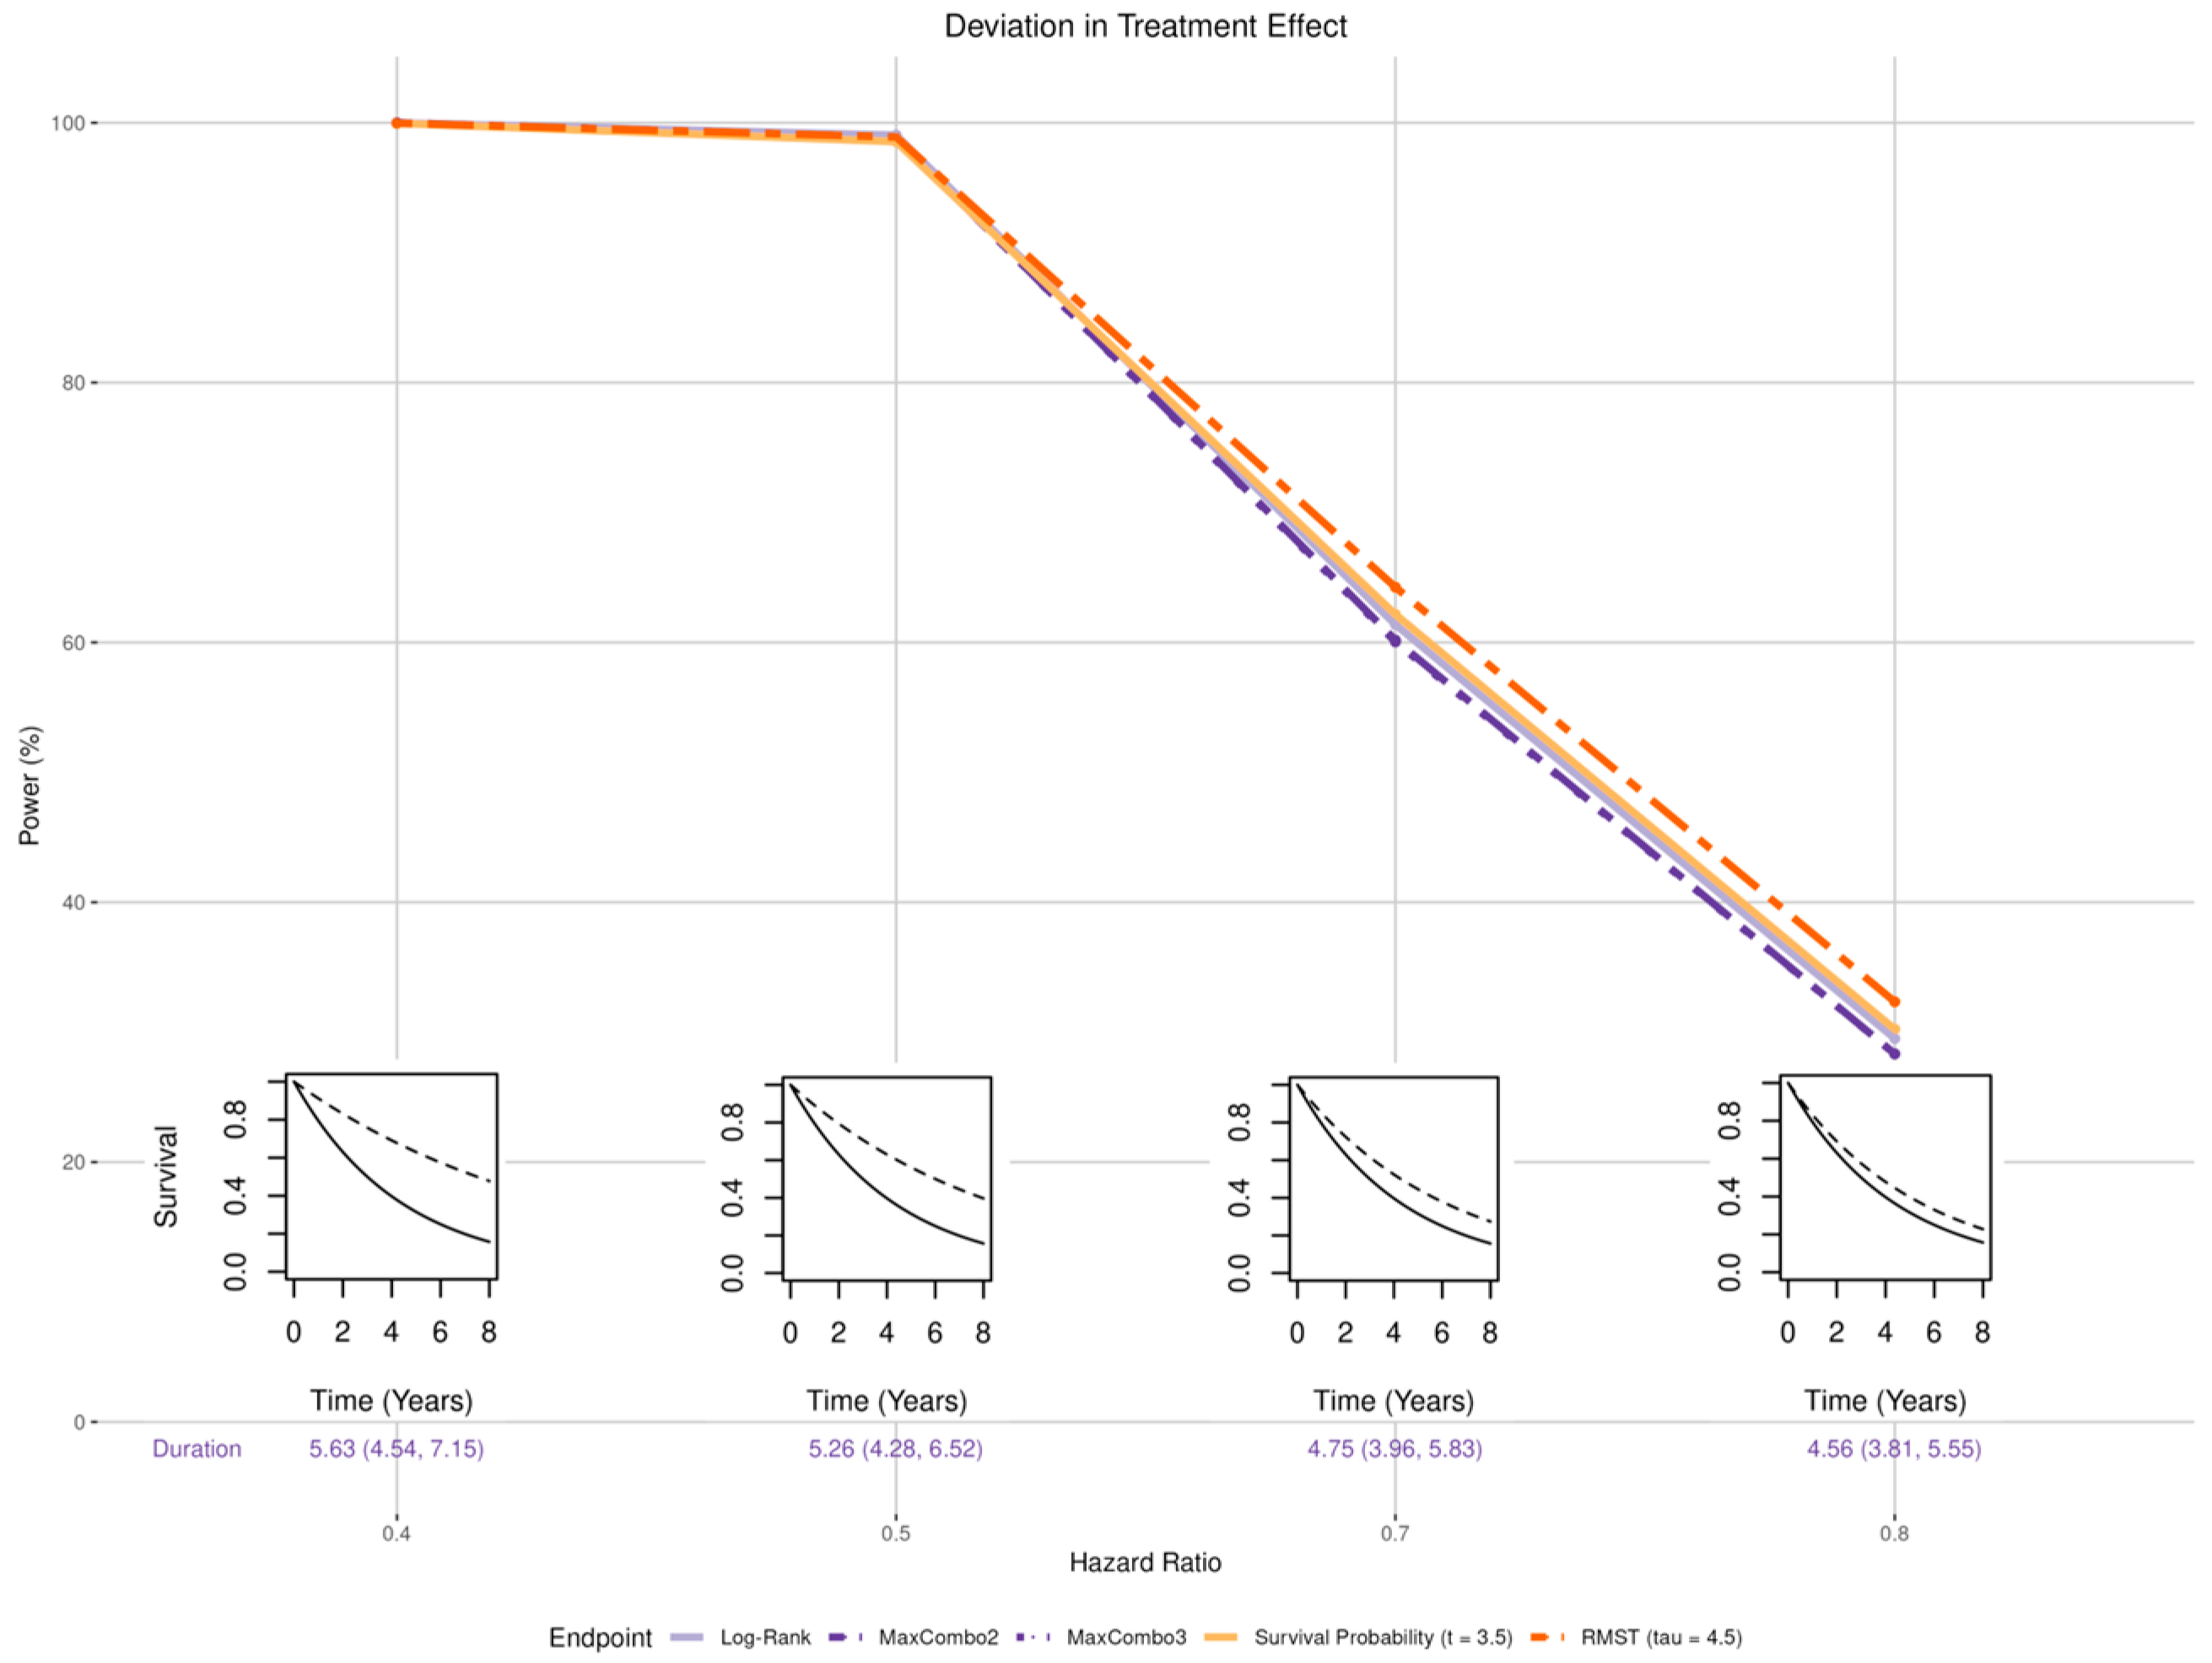
- Magnitude (Figure 3 insets): the treatment effect was set to be larger than the expected hazard ratio of 0.6 (HR of 0.4 and 0.5) and smaller than expected (HR of 0.7 and 0.8).
- Non-proportional hazards (NPH):
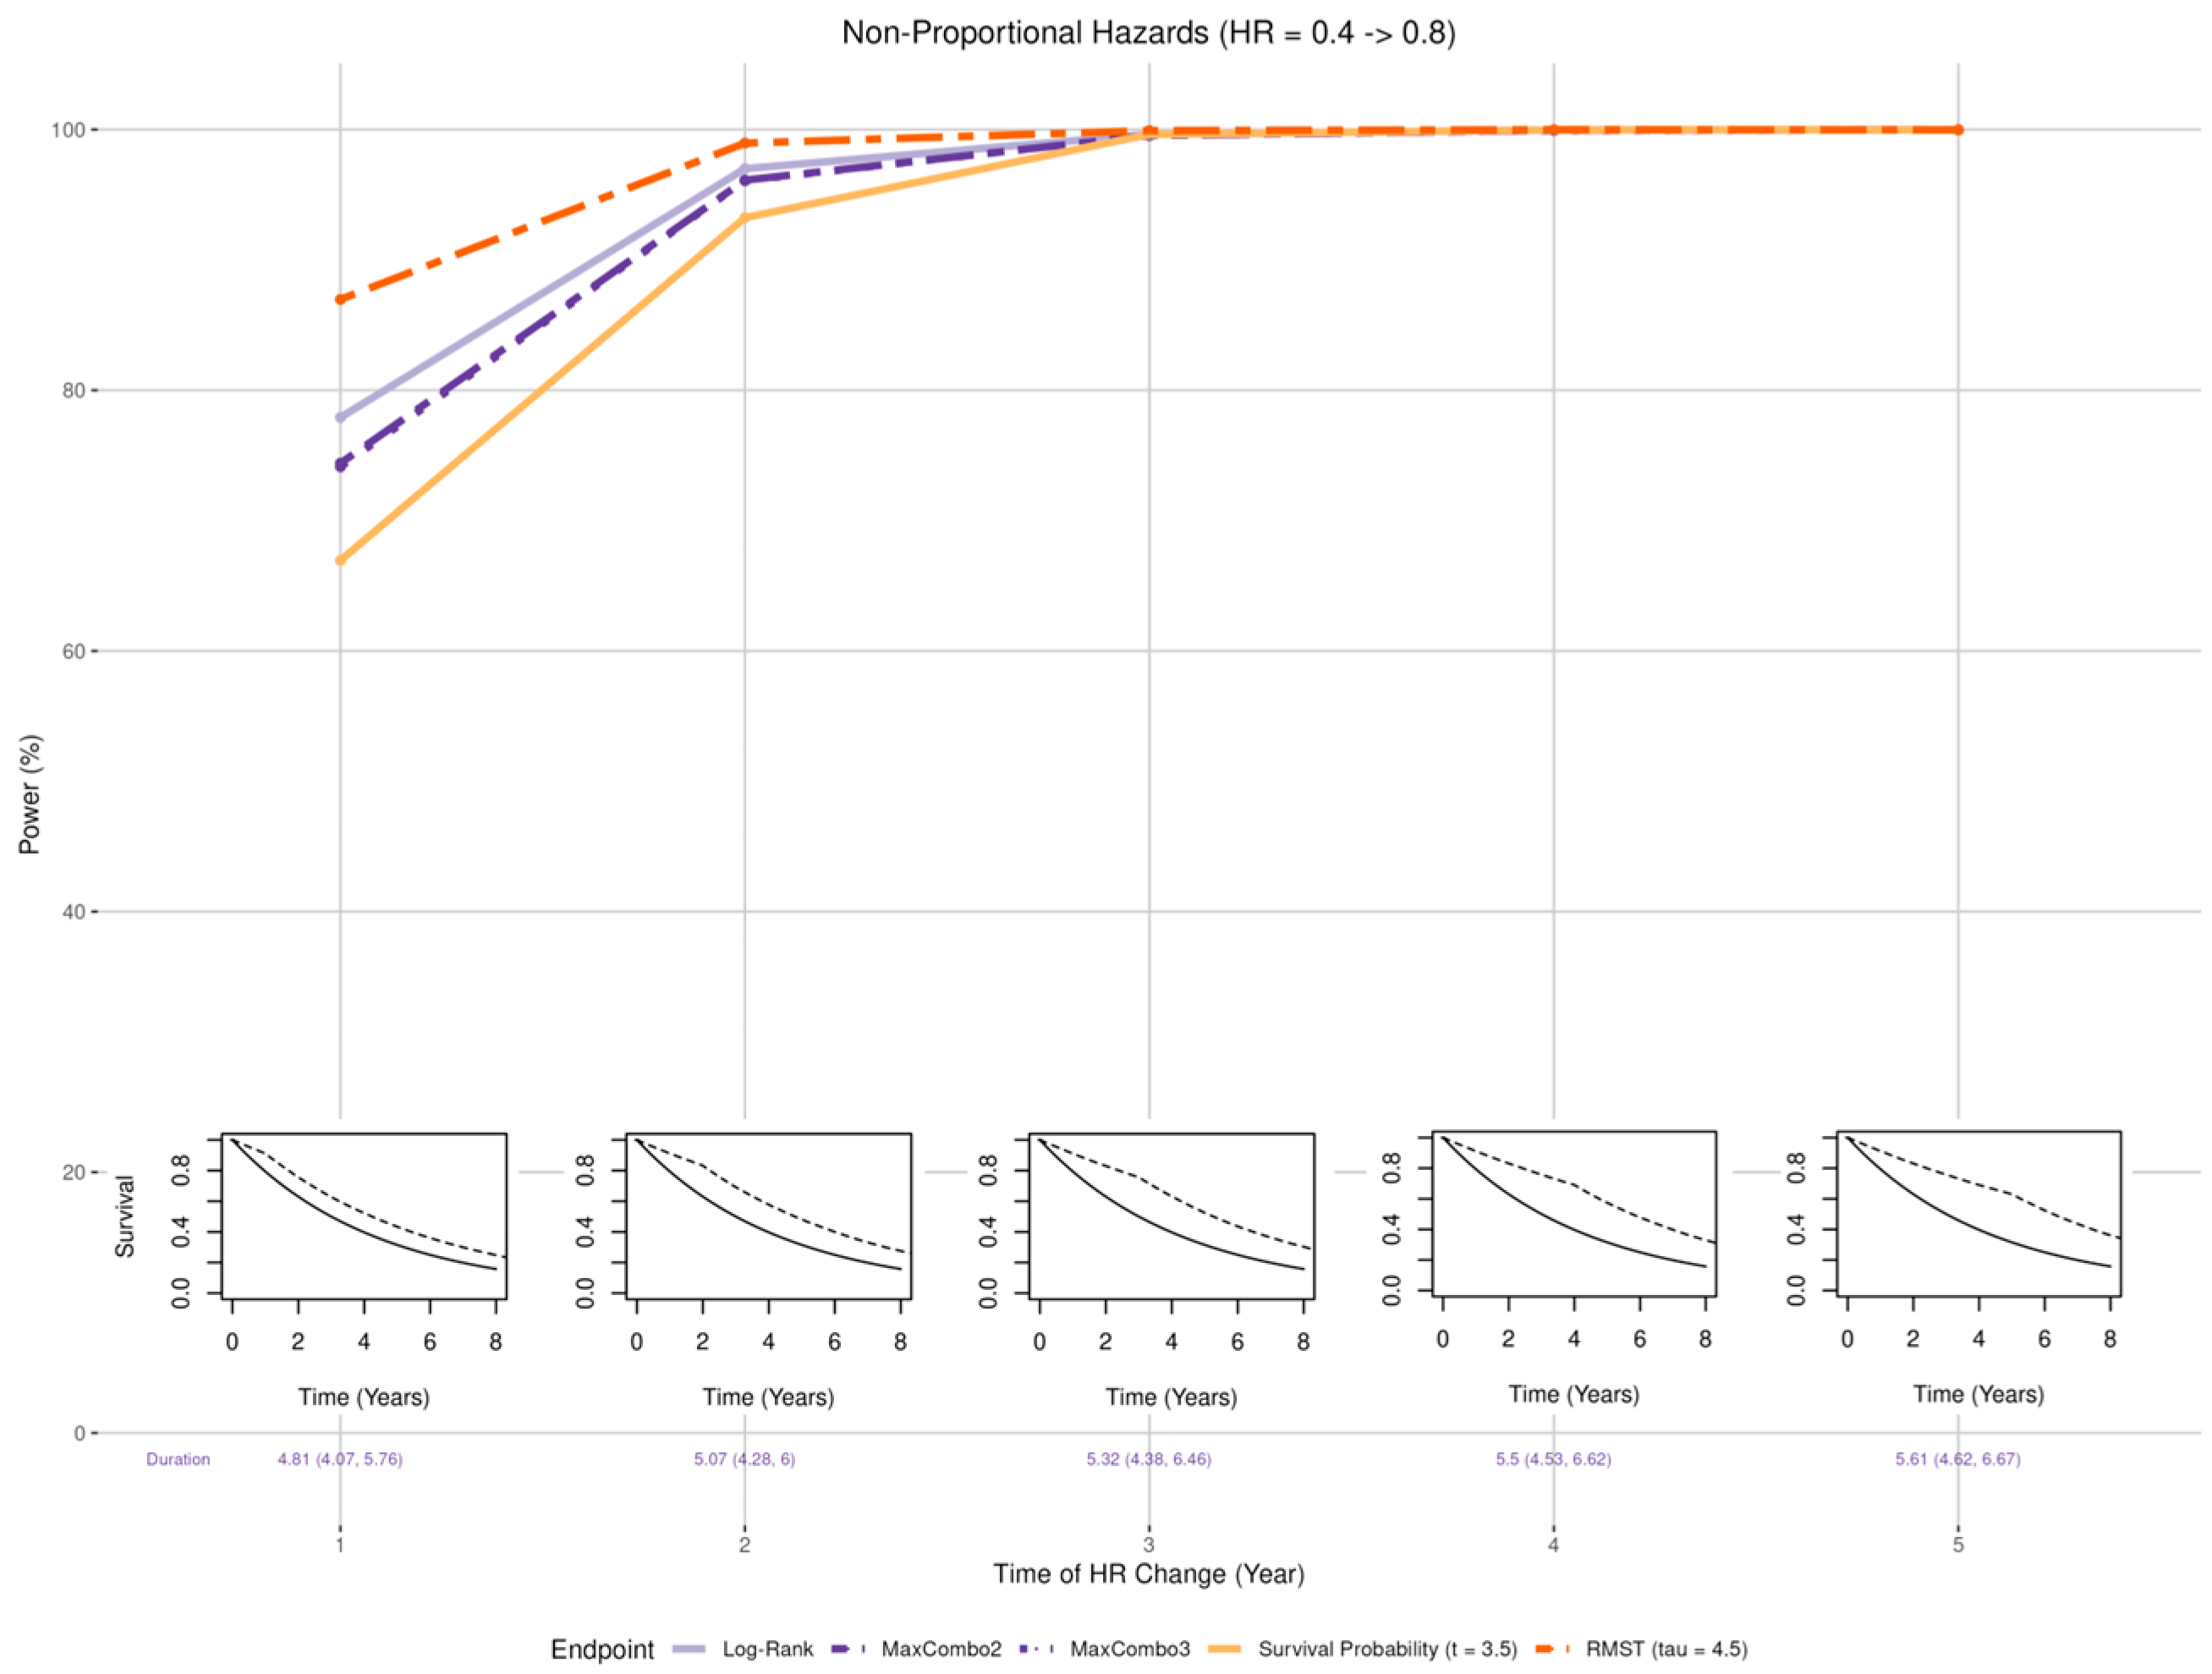
- Early benefit (Figure 4 insets): Larger than expected early treatment effect (HR = 0.4) in the first years post enrollment and smaller than expected effect (HR = 0.8) after years where = 1, 2, 3, 4, and 5;
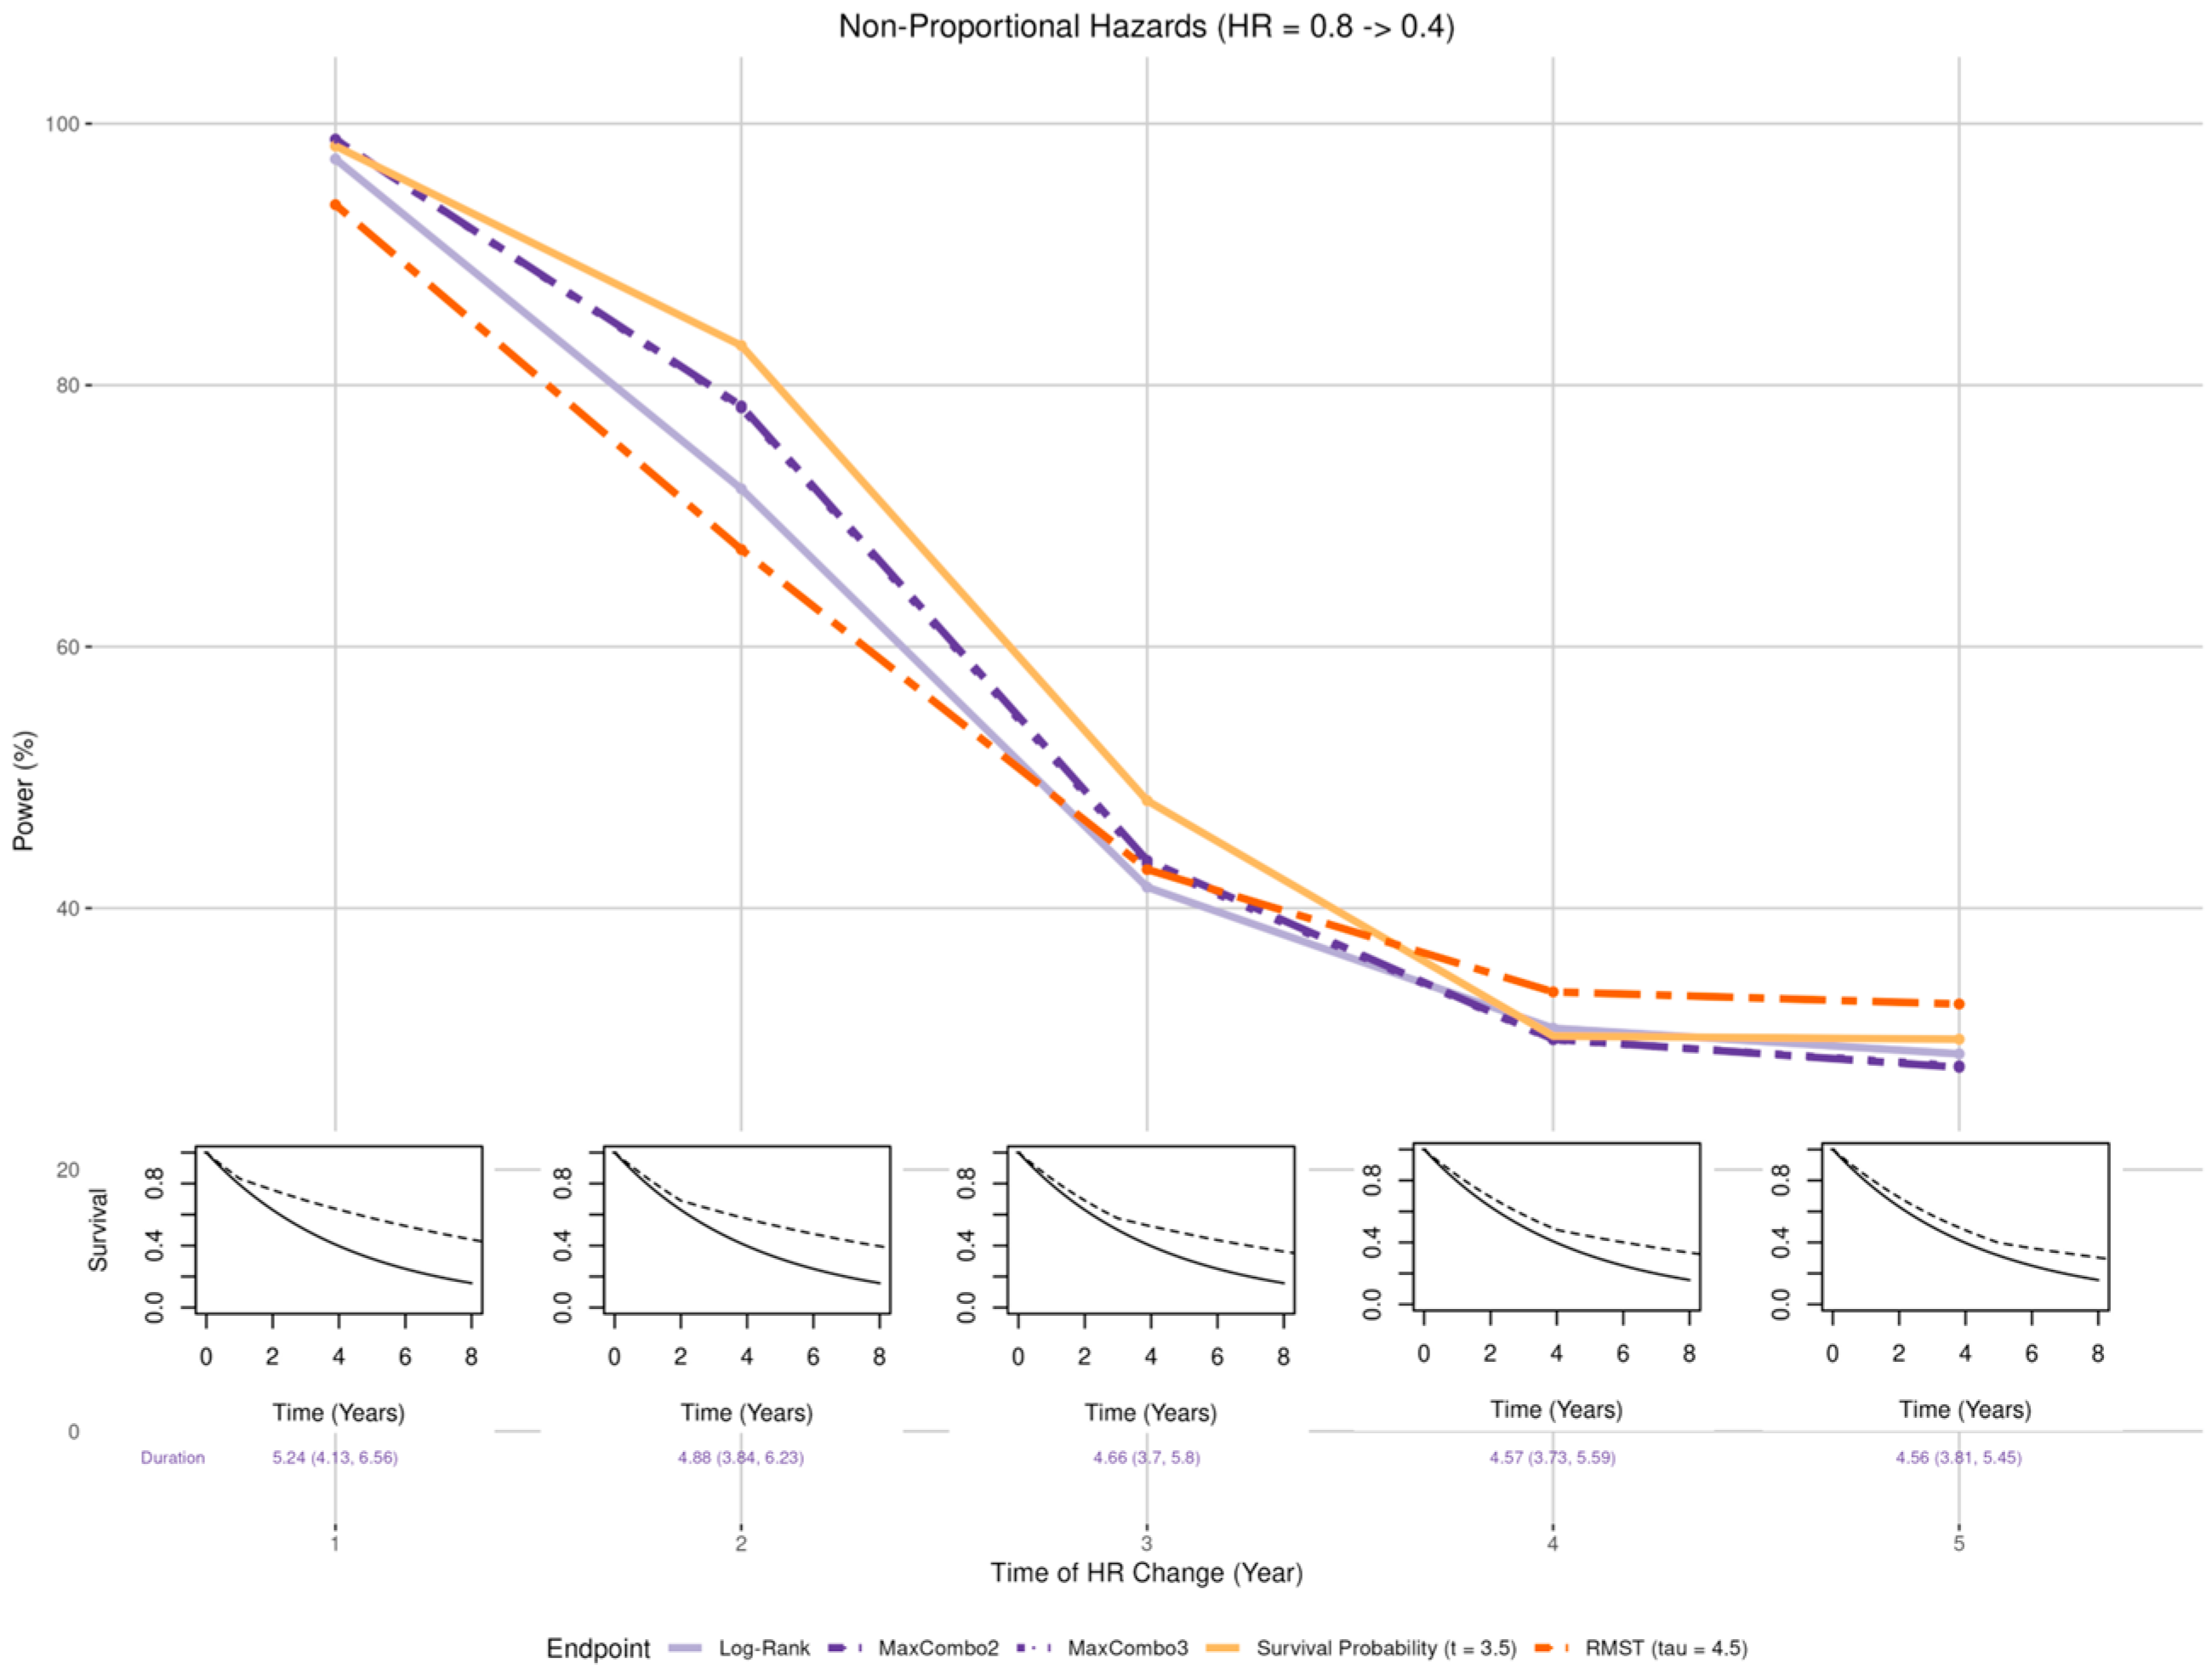
- Late benefit (Figure 5 insets): Smaller than expected early treatment effect (HR = 0.8) in the first years post enrollment and larger than expected effect (HR = 0.4) after years where = 1, 2, 3, 4, and 5;
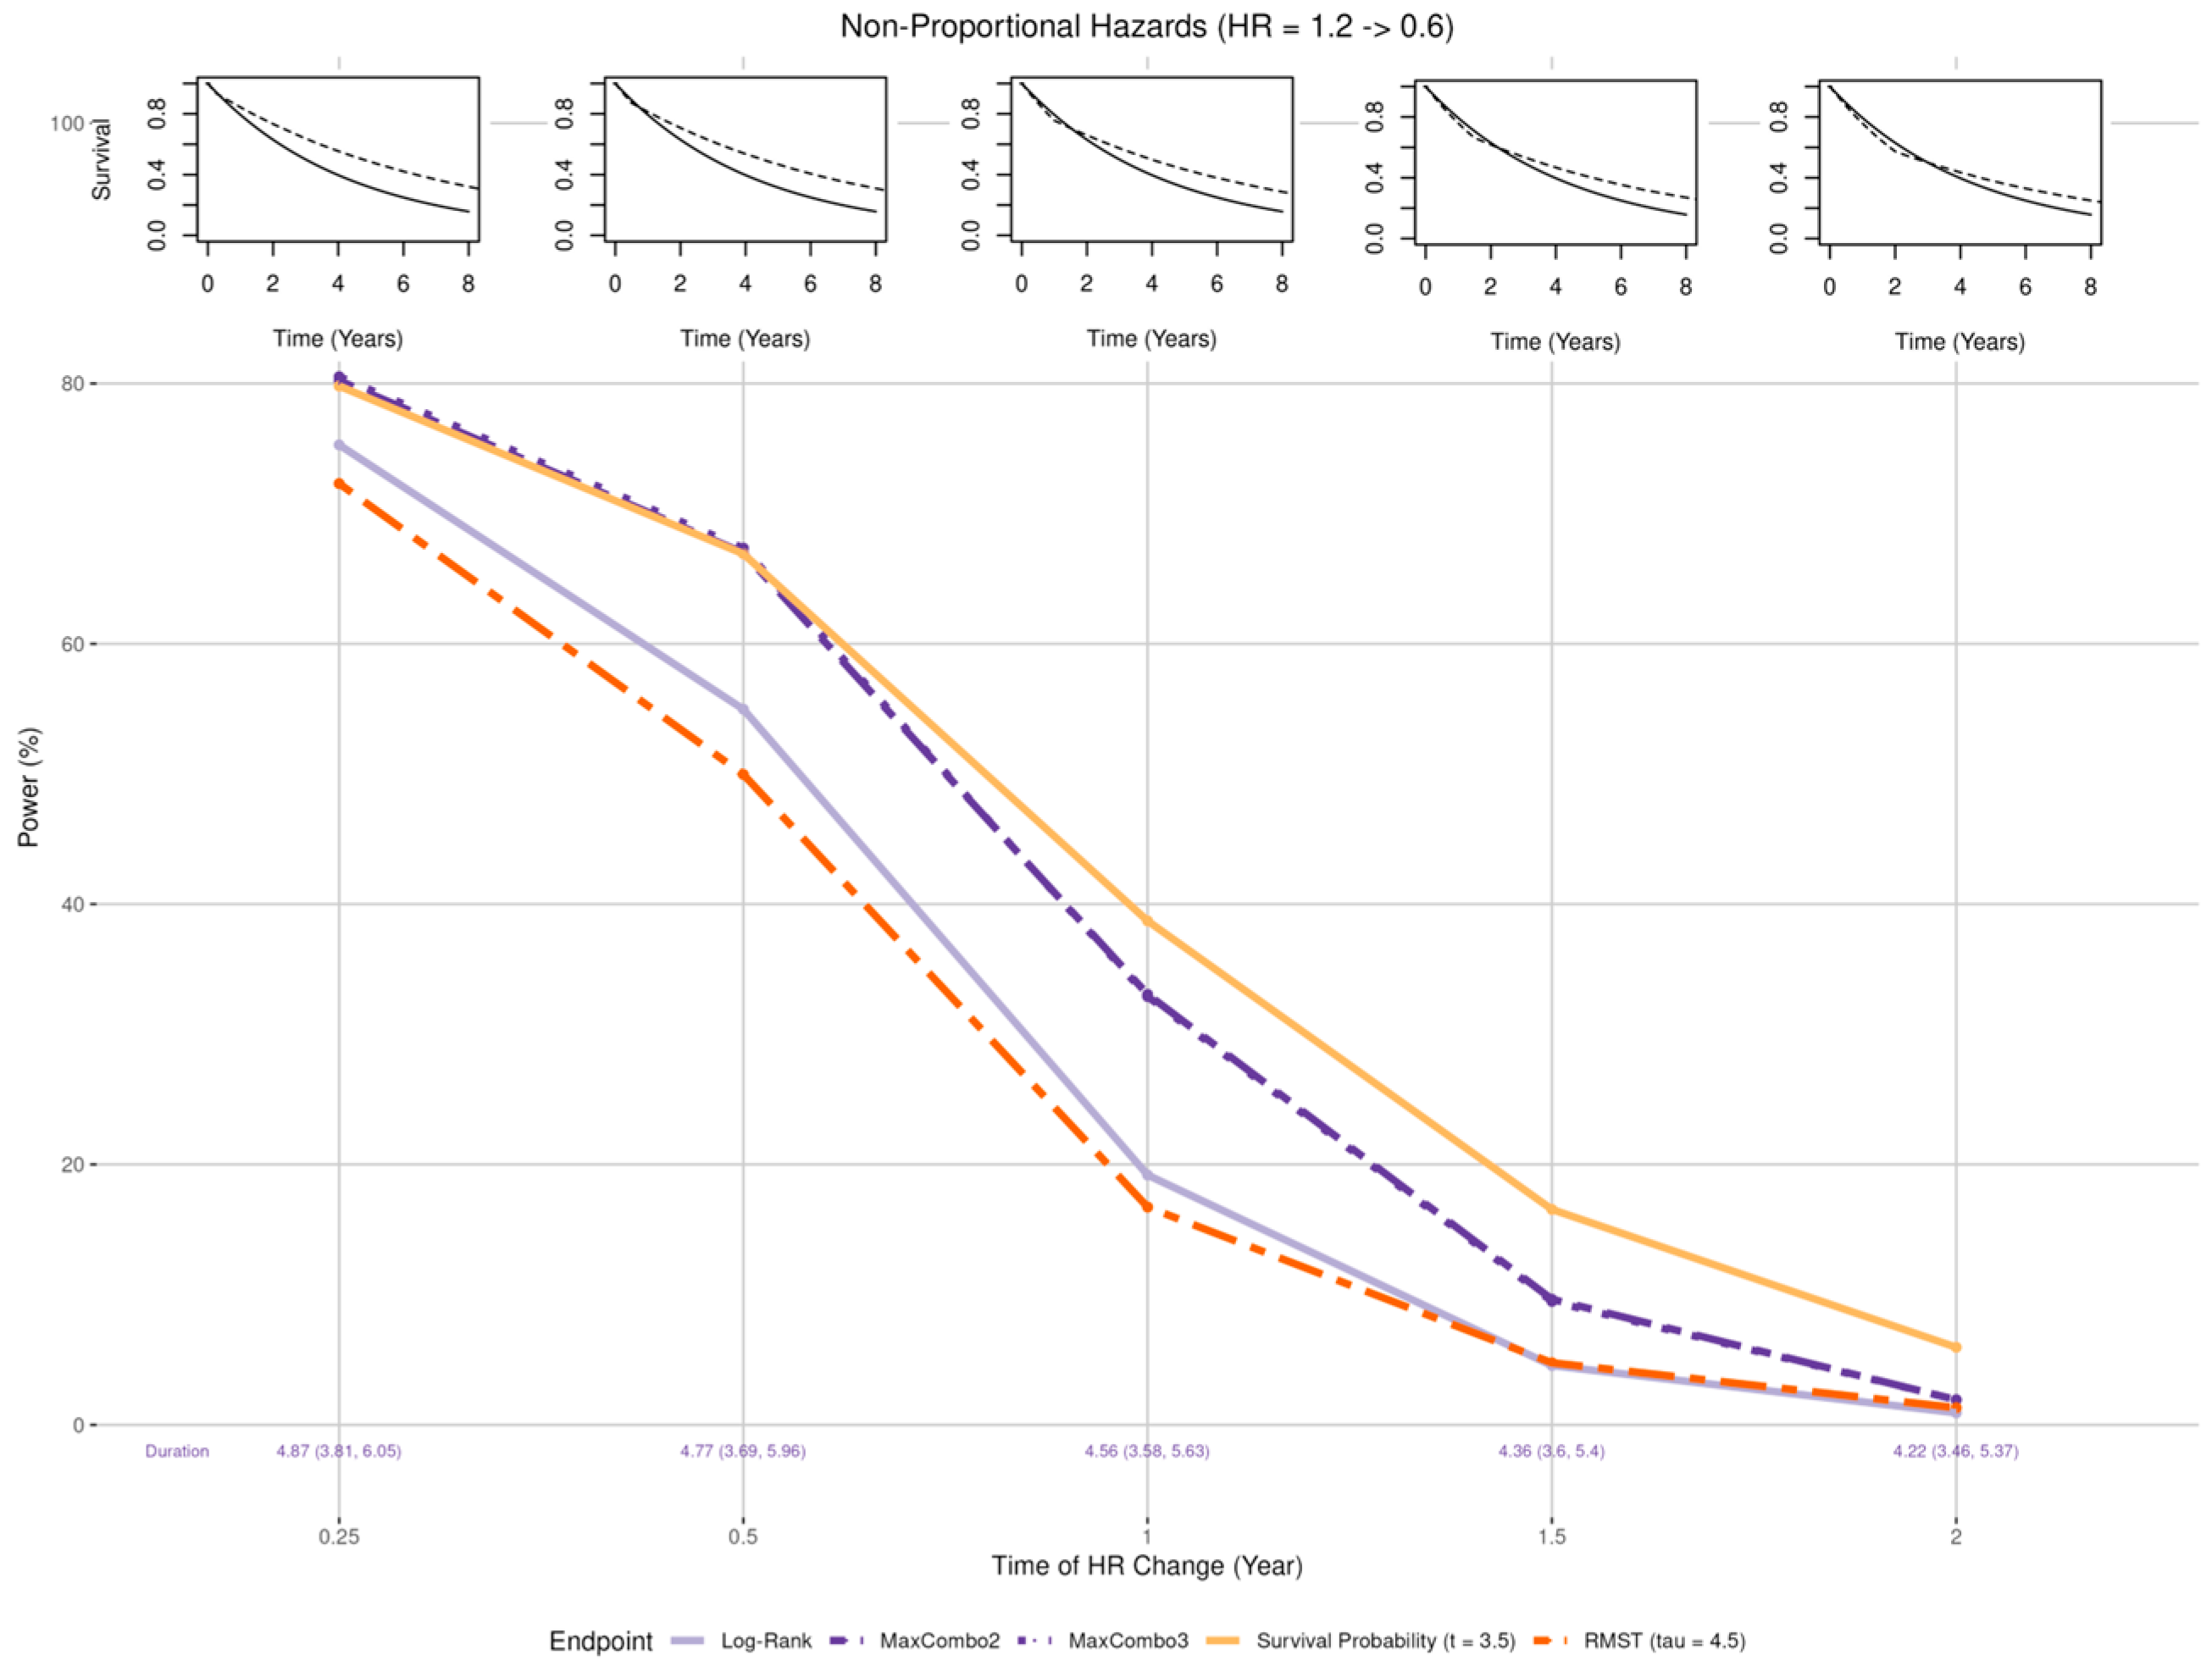
- Crossing hazard (Figure 6 insets): Worse than expected survival in treatment arm (HR = 1.2) in the first years post enrollment and the same as expected treatment effect (HR = 0.6) after years where = 0.25, 0.5, 1, 1.5, and 2.
- Accrual rate: Faster than expected accrual (i.e., full enrollment in 2 and 2.5 years) and slower than expected accrual (i.e., full enrollment in 3.5 and 4 years).
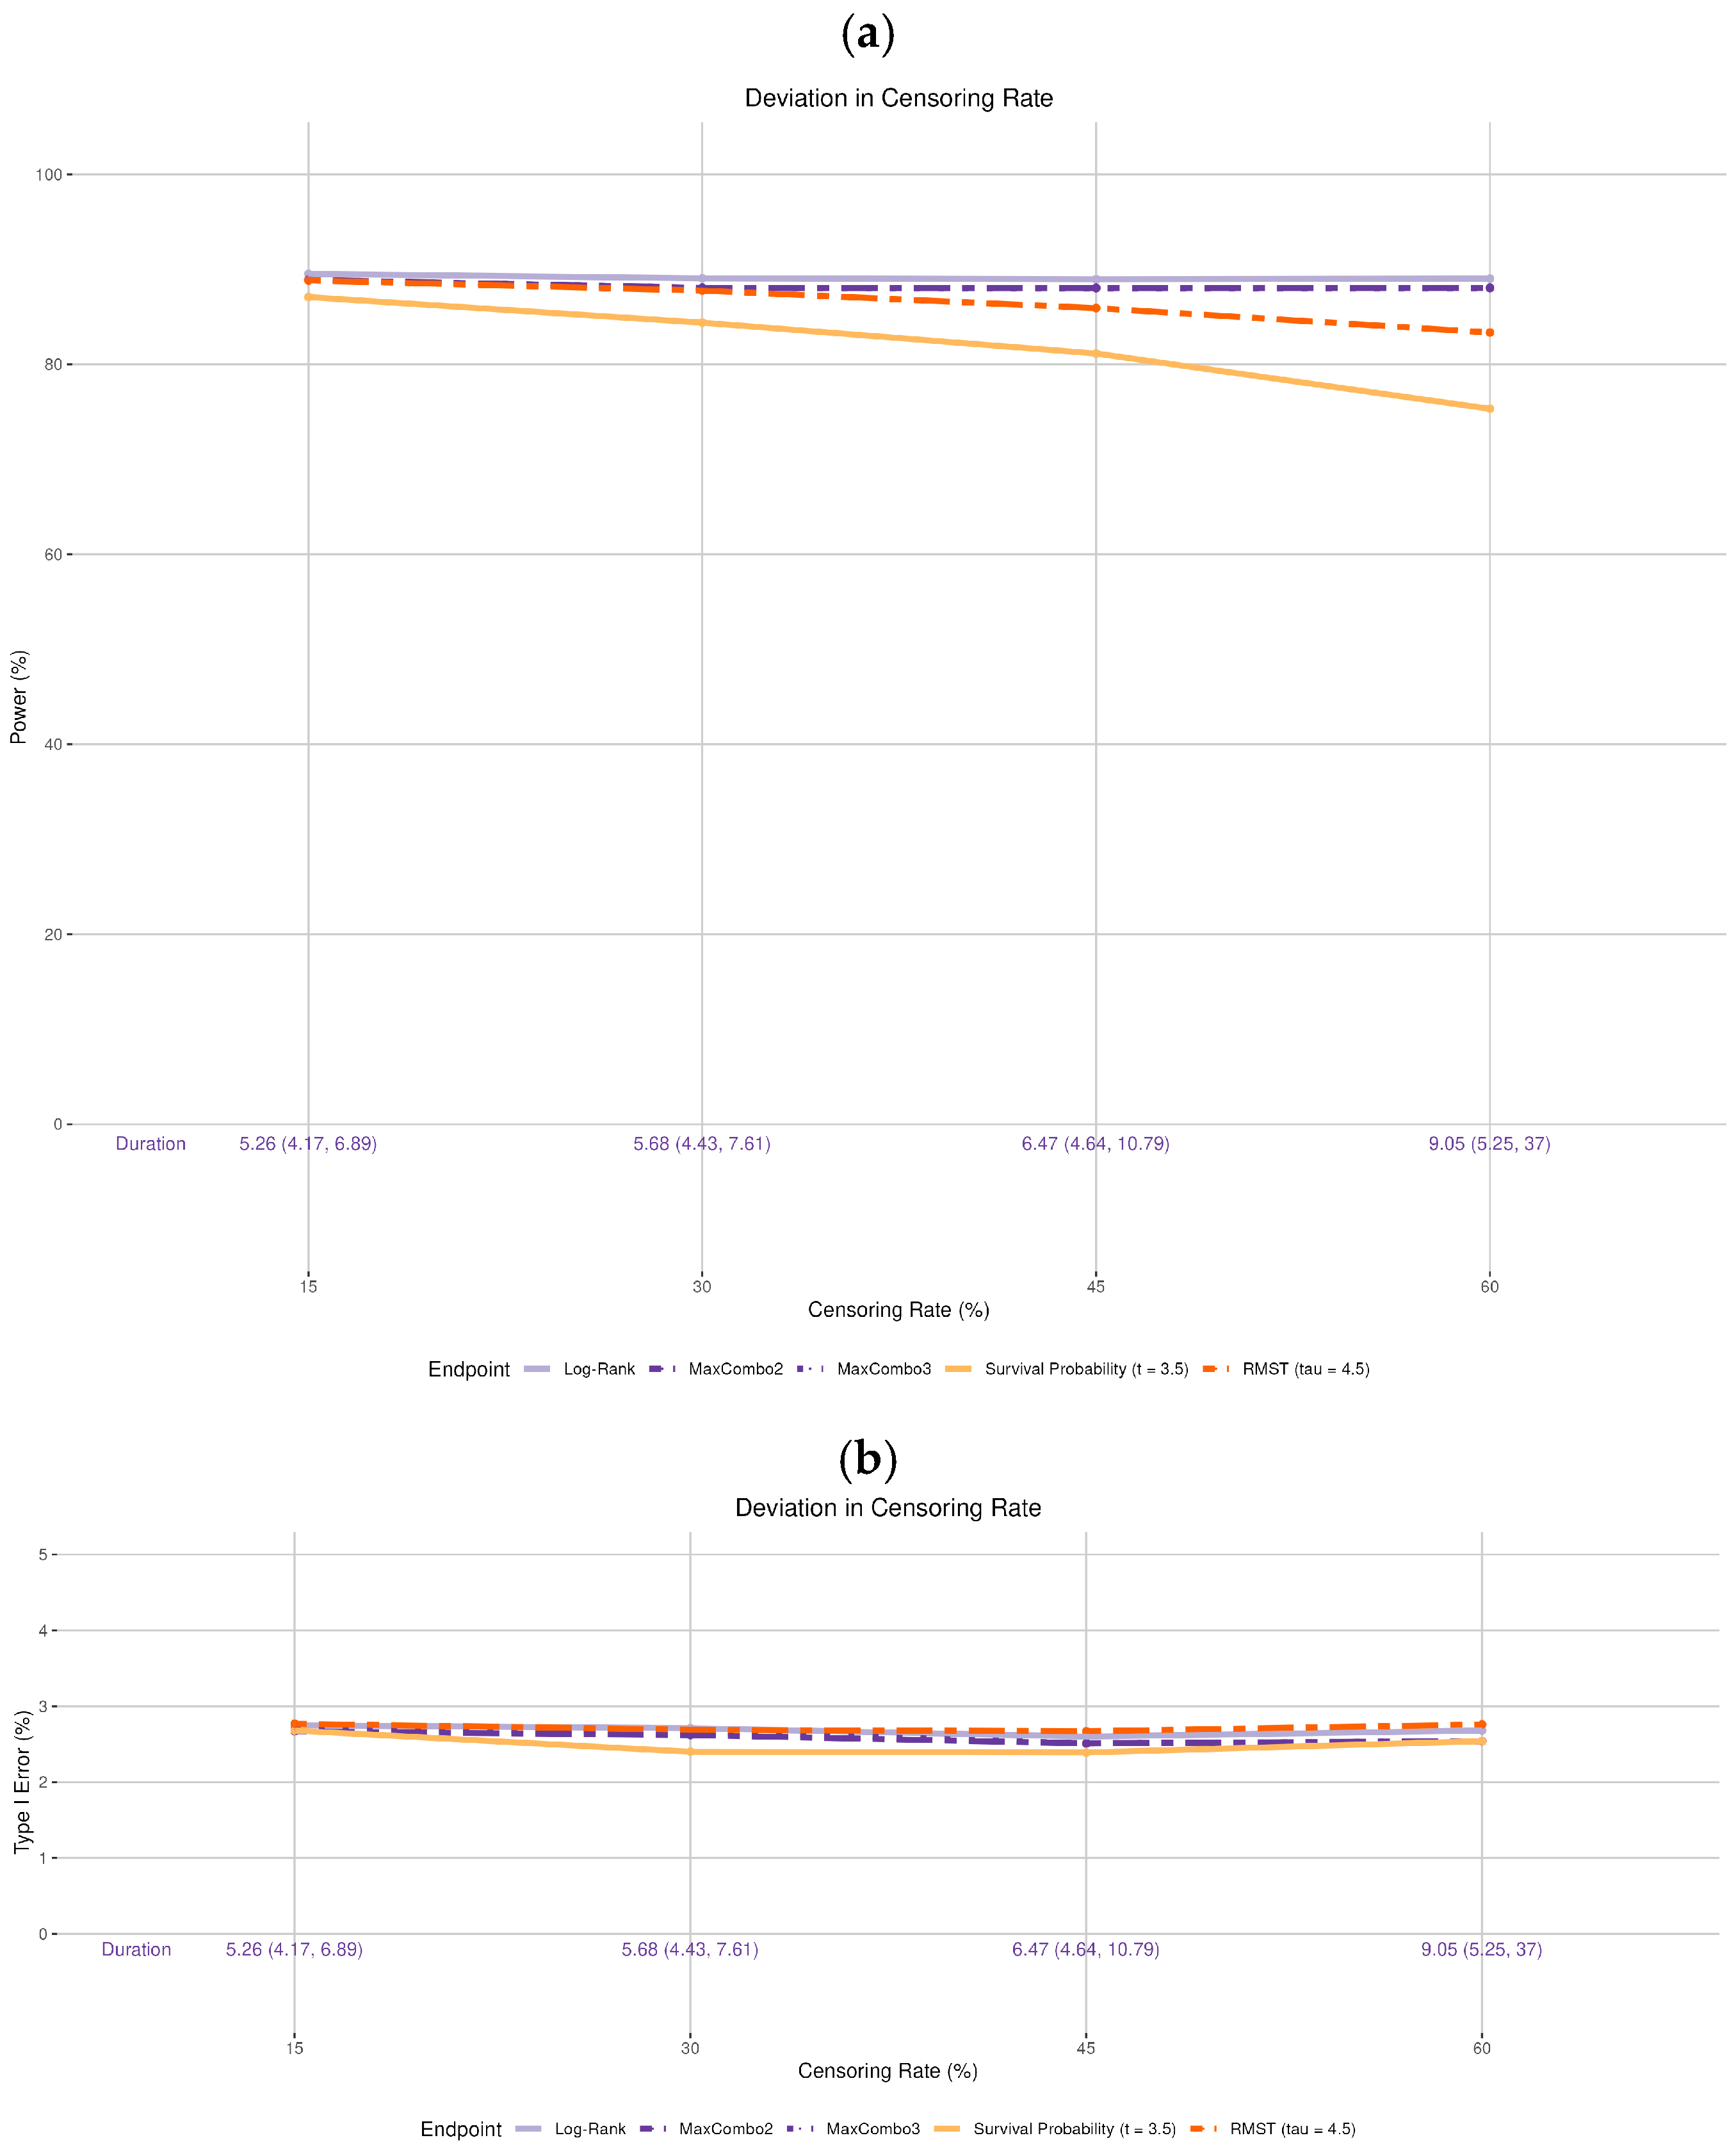
- Drop-out rate: The original design assumes no drop-out. We incorporated various drop-out rates. The drop-out process is assumed to follow the exponential distribution with 15%, 30%, 45%, and 60% cumulative proportion by 5 years, independent of the survival process (i.e., non-informative censoring). Note that the observed drop-out rates vary based on the time of statistical analysis and are not the same as the cumulative 5-year rate. For example, for the 30% drop-out setting in simulation, the median observed drop-out rates by 3.5 and 4.5 years were 16.6% and 19.2%, respectively; for the 60% drop-out setting, the median observed drop-out rates by 3.5 and 4.5 years were 36.3% and 40.6%, respectively. Additionally, we did not incorporate informative censoring, where the censoring process and the survival process are dependent, as it would not only affect statistical power but also raise concerns about the validity of the trial. Addressing this issue is beyond the scope of the current manuscript.
3. Results
3.1. Deviation in Survival Distribution of the Control Arm
3.2. Deviation in the Treatment Effect
3.2.1. Magnitude of Effect
3.2.2. Non-Proportional Hazards, Larger Early Benefit
3.2.3. Non-Proportional Hazards, Larger Late Benefit
3.2.4. Non-Proportional Hazards, Crossing Hazard
3.3. Deviation in the Accrual Rate
3.4. Deviation in the Drop-Out Rate
4. Discussion
- Deviation in the control arm’s survival rate does not affect the power of the log-rank and MaxCombo but it affects the total duration of the trial. The power of the RMST test and survival probability decrease when the control arm’s survival is better than the assumed distribution and increase when the control arm survival is worse than the assumed rate. These changes in power are due to an interplay between the change in the magnitude of the survival difference (in both survival probability and RMST, resulting from the deviation from baseline survival rate) coupled with the change in the estimation precision due to the censoring rate at time and . This observation is consistent with the results found in Appendix 4 of Eaton et al. for RMST [20].
- When the proportional hazards assumption is misspecified, the RMST test is least affected when there is a larger early treatment effect; the survival probability was least affected when there is larger late treatment effect, especially when the larger treatment effect occurs prior to the prespecified time of the survival probability; while the survival probability test and MaxCombo were the least affected with crossing hazards. Of note, in scenarios where the statistical power of the survival probability test is less affected than the other tests, it is due to the fact that the hazard-based tests and the RMST test evaluate the cumulative effect of treatment where small treatment effect in the early period dilutes the overall effect and, similarly, the harm of the treatment in the early period cancels out benefit of the late period. In contrast, the survival probability only evaluates the survival difference at 3.5 years regardless of the direction of early treatment effect. The power of the MaxCombo tests is less affected than the log-rank and the RMST in scenarios with crossing hazard since the method is designed to select the weight combination that maximizes the difference.
- While deviations in the drop-out rate and accrual rate are seldom discussed in clinical trial manuscripts, they can significantly prolong the trial duration. An excessively prolonged trial can dramatically increase the monetary cost of the trial, and the standard of care may change during the trial period, rendering the trial conclusions less relevant. Additionally, a high drop-out rate can also reduce the study power.
5. Conclusions
Author Contributions
Funding
Institutional Review Board Statement
Informed Consent Statement
Data Availability Statement
Conflicts of Interest
Abbreviations
| RMST | Restricted mean survival time |
Appendix A
MaxCombo Test
- , observed number of events in group 1 at time ,
- , expected number of events in group 1 at time ,
- , variance of expected number of events in group 1 at time ,
- is the total number of events at time ,
- is the total number of events at time , for each event time ,
- .
| Type of Test | ||
| (0, 0) | 1 | Log-rank |
| (1, 0) | Test early difference | |
| (0, 1) | Test late difference | |
| (1, 1) | Test middle difference |
- Two-component MaxCombo test with weights [(0,0) and (0,0.5)], defined as .
- Three-component MaxCombo test with weights [(0,0), (0,0.5), and (0.5, 0)], defined as .
References
- U.S. Food and Drug Administration. Clinical Trial Endpoints for the Approval of Cancer Drugs and Biologics, Guidance for Industry. 2018. Available online: https://www.fda.gov/media/71195/download (accessed on 27 January 2021).
- Fleming, T.R.; Harrington, D.P. Counting Processes and Survival Analysis; Wiley Series in Probability and Statistics; Wiley-Interscience: Hoboken, NJ, USA, 2005; pp. xiii, 429. [Google Scholar]
- Trinquart, L.; Jacot, J.; Conner, S.C.; Porcher, R. Comparison of Treatment Effects Measured by the Hazard Ratio and by the Ratio of Restricted Mean Survival Times in Oncology Randomized Controlled Trials. J. Clin. Oncol. 2016, 34, 1813–1819. [Google Scholar] [CrossRef] [PubMed]
- Holmes, E.M.; Bradbury, I.; Williams, L.; Korde, L.; de Azambuja, E.; Fumagalli, D.; Moreno-Aspitia, A.; Baselga, J.; Piccart-Gebhart, M.; Dueck, A.; et al. Are we assuming too much with our statistical assumptions? Lessons learned from the ALTTO trial. Ann. Oncol. 2019, 30, 1507–1513. [Google Scholar] [CrossRef] [PubMed]
- Simes, R.J.; Martin, A.J. Assumptions, damn assumptions and statistics. Ann. Oncol. 2019, 30, 1415–1416. [Google Scholar] [CrossRef] [PubMed]
- Lin, R.S.; Lin, J.; Roychoudhury, S.; Anderson, K.M.; Hu, T.L.; Huang, B.; Leon, L.F.; Liao, J.J.Z.; Liu, R.; Luo, X.D.; et al. Alternative Analysis Methods for Time to Event Endpoints Under Nonproportional Hazards: A Comparative Analysis. Stat. Biopharm. Res. 2020, 12, 187–198. [Google Scholar] [CrossRef]
- Bellmunt, J.; Bajorin, D.F. Pembrolizumab for Advanced Urothelial Carcinoma. N. Engl. J. Med. 2017, 376, 2304. [Google Scholar] [CrossRef] [PubMed]
- Weber, J.; Mandala, M.; Del Vecchio, M.; Gogas, H.J.; Arance, A.M.; Cowey, C.L.; Dalle, S.; Schenker, M.; Chiarion-Sileni, V.; Marquez-Rodas, I.; et al. Adjuvant Nivolumab versus Ipilimumab in Resected Stage III or IV Melanoma. N. Engl. J. Med. 2017, 377, 1824–1835. [Google Scholar] [CrossRef] [PubMed]
- Nørskov, A.K.; Lange, T.; Nielsen, E.E.; Gluud, C.; Winkel, P.; Beyersmann, J.; de Uña-Álvarez, J.; Torri, V.; Billot, L.; Putter, H.; et al. Assessment of assumptions of statistical analysis methods in randomised clinical trials: The what and how. BMJ Evid.-Based Med. 2021, 26, 121–126. [Google Scholar] [CrossRef] [PubMed]
- Gandhi, L.; Rodríguez-Abreu, D.; Gadgeel, S.; Esteban, E.; Felip, E.; De Angelis, F.; Domine, M.; Clingan, P.; Hochmair, M.J.; Powell, S.F.; et al. Pembrolizumab plus Chemotherapy in Metastatic Non–Small-Cell Lung Cancer. N. Engl. J. Med. 2018, 378, 2078–2092. [Google Scholar] [CrossRef] [PubMed]
- Wolchok, J.D.; Chiarion-Sileni, V.; Gonzalez, R.; Rutkowski, P.; Grob, J.J.; Cowey, C.L.; Lao, C.D.; Wagstaff, J.; Schadendorf, D.; Ferrucci, P.F.; et al. Overall Survival with Combined Nivolumab and Ipilimumab in Advanced Melanoma. N. Engl. J. Med. 2017, 377, 1345–1356. [Google Scholar] [CrossRef] [PubMed]
- Meyerhardt, J.A.; Shi, Q.; Fuchs, C.S.; Meyer, J.; Niedzwiecki, D.; Zemla, T.; Kumthekar, P.; Guthrie, K.A.; Couture, F.; Kuebler, P.; et al. Effect of Celecoxib vs Placebo Added to Standard Adjuvant Therapy on Disease-Free Survival Among Patients With Stage III Colon Cancer: The CALGB/SWOG 80702 (Alliance) Randomized Clinical Trial. JAMA 2021, 325, 1277–1286. [Google Scholar] [CrossRef] [PubMed]
- Schrag, D.; Weiser, M.; Saltz, L.; Mamon, H.; Gollub, M.; Basch, E.; Venook, A.; Shi, Q. Challenges and solutions in the design and execution of the PROSPECT Phase II/III neoadjuvant rectal cancer trial (NCCTG N1048/Alliance). Clin. Trials 2019, 16, 165–175. [Google Scholar] [CrossRef] [PubMed]
- Schrag, D.; Shi, Q.; Weiser, M.R.; Gollub, M.J.; Saltz, L.B.; Musher, B.L.; Goldberg, J.; Baghdadi, T.A.; Goodman, K.A.; McWilliams, R.R.; et al. Preoperative Treatment of Locally Advanced Rectal Cancer. N. Engl. J. Med. 2023, 389, 322–334. [Google Scholar] [CrossRef] [PubMed]
- Argulian, A.; Karol, A.B.; Paredes, R.; Oguntuyo, K.; Weintraub, L.S.; Miller, J.; Fujiwara, Y.; Joshi, H.; Doroshow, D.B.; Galsky, M.D. Assessing patient withdrawal in cancer clinical trials: A systematic evaluation of reasons and transparency in reporting. J. Clin. Oncol. 2025, 43, e23003. [Google Scholar] [CrossRef]
- Mukhopadhyay, P.; Ye, J.; Anderson, K.M.; Roychoudhury, S.; Rubin, E.H.; Halabi, S.; Chappell, R.J. Log-Rank Test vs MaxCombo and Difference in Restricted Mean Survival Time Tests for Comparing Survival Under Nonproportional Hazards in Immuno-oncology Trials: A Systematic Review and Meta-analysis. JAMA Oncol. 2022, 8, 1294–1300. [Google Scholar] [CrossRef] [PubMed]
- R Core Team. R: A Language and Environment for Statistical Computing; R Foundation for Statistical Computing: Vienna, Austria, 2023. [Google Scholar]
- Ristl, R.; Ballarini, N.M.; Götte, H.; Schüler, A.; Posch, M.; König, F. Delayed treatment effects, treatment switching and heterogeneous patient populations: How to design and analyzeRCTsin oncology. Pharm. Stat. 2021, 20, 129–145. [Google Scholar] [CrossRef] [PubMed]
- Uno, H.; Tian, L.; Horiguchi, M.; Cronin, A.; Battioui, C.; Bell, J. survRM2: Comparing Restricted Mean Survival Time. 2022. Available online: https://cran.r-project.org/web/packages/survRM2/survRM2.pdf (accessed on 3 January 2025).
- Eaton, A.; Therneau, T.; Le-Rademacher, J. Designing clinical trials with (restricted) mean survival time endpoint: Practical considerations. Clin. Trials 2020, 17, 285–294. [Google Scholar] [CrossRef] [PubMed]
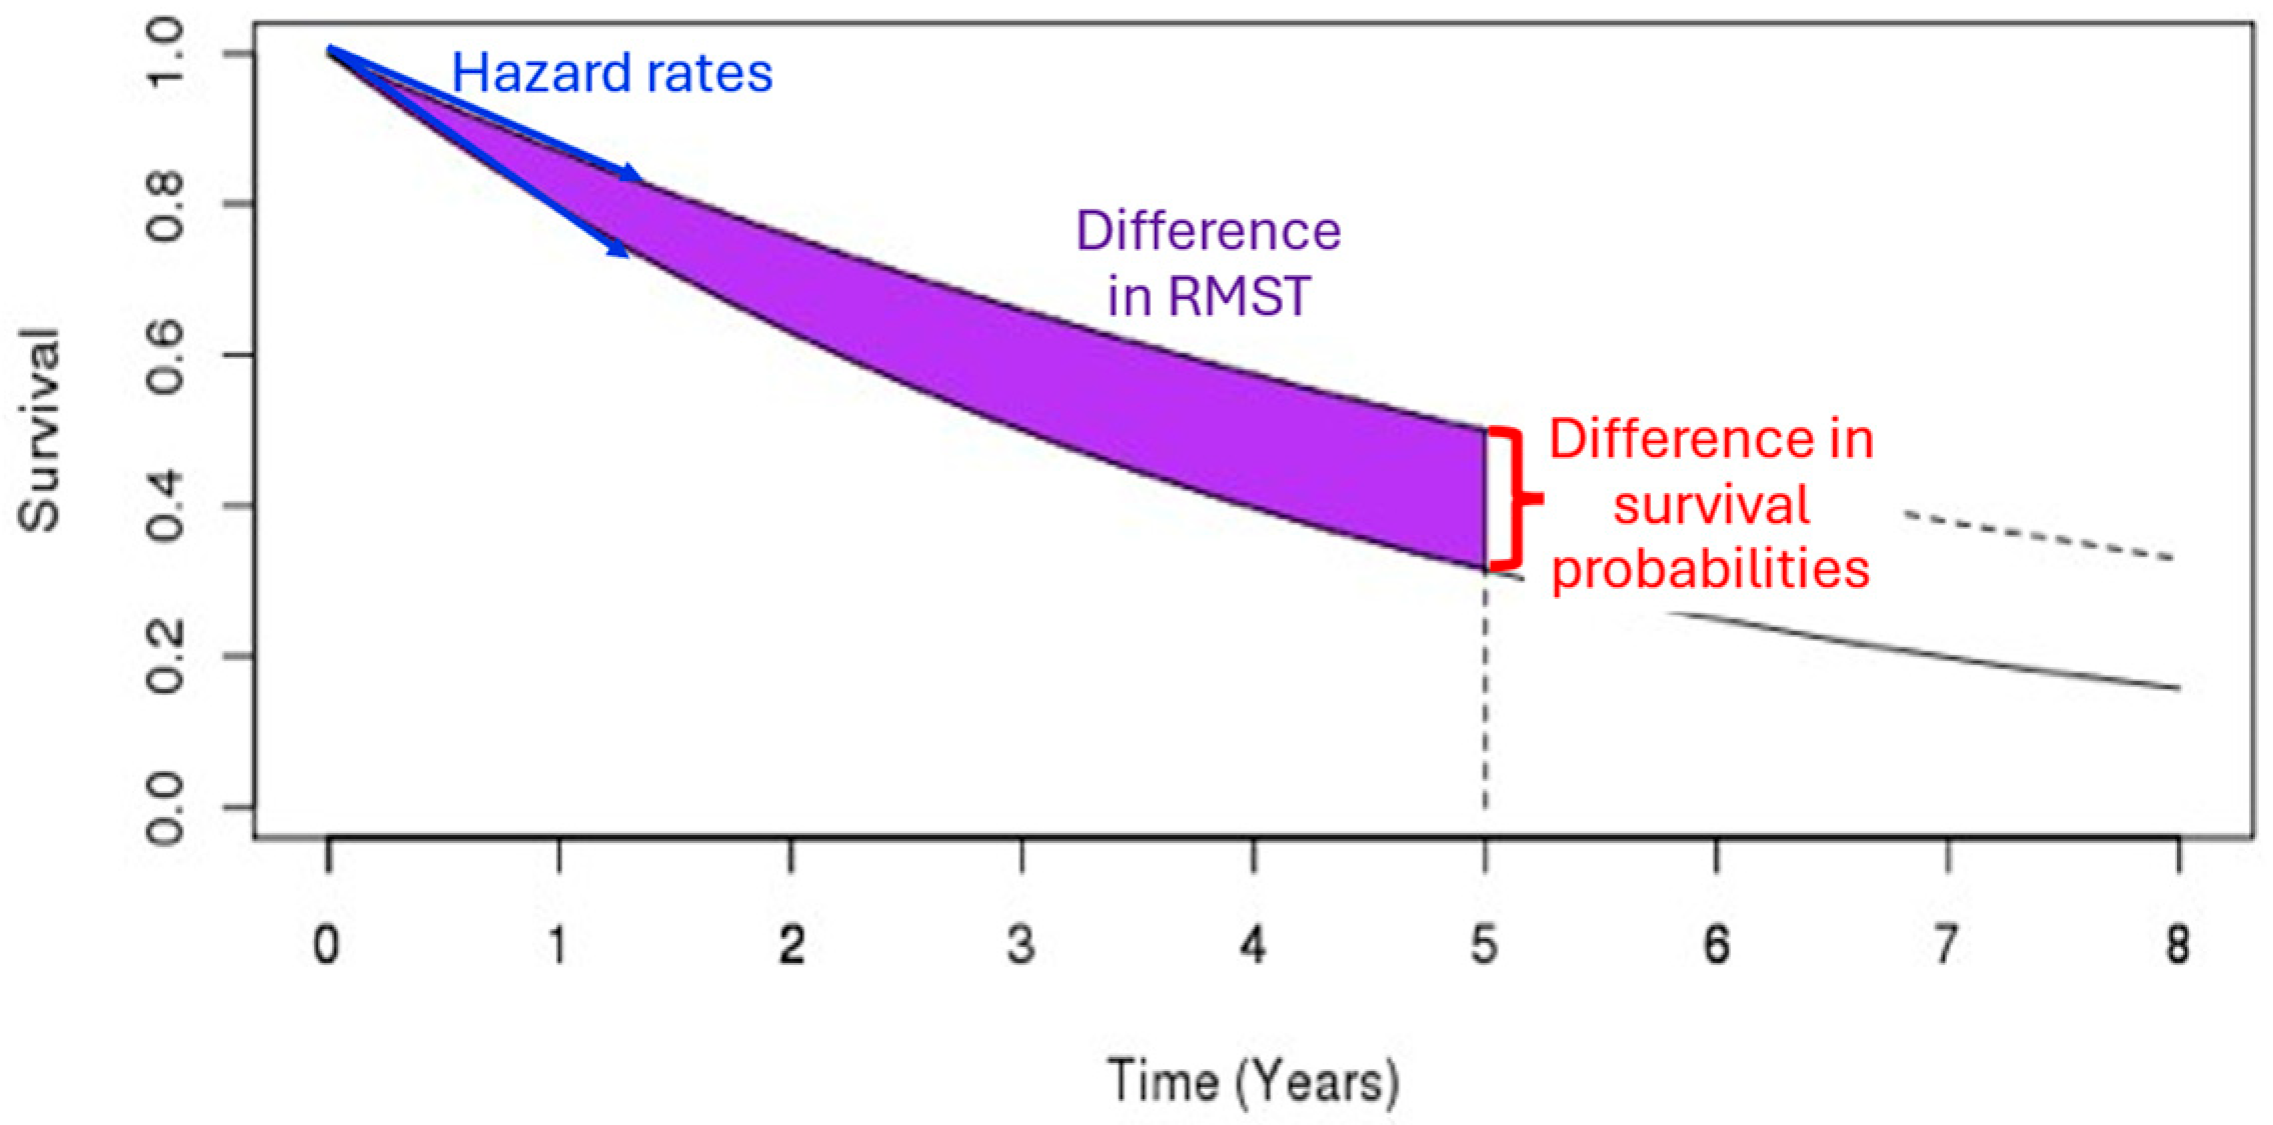
| Hazard Rate | Survival Probability | Restricted Mean Survival Time | ||
|---|---|---|---|---|
| Statistical Test | Log-rank test | MaxCombo test | Test of difference | Test of difference |
| Treatment effect quantified by | Hazard ratio | No corresponding quantity | Difference in survival probability | Difference in mean survival time |
| Trial size stated in terms of | The total number of events | The total number of events | Total number of patients enrolled | Total number of patients enrolled |
| Follow-up | All patients are followed until the total number of events are reached | All patients are followed until the total number of events are reached | Each patient is followed until event or time whichever occurs first; follow-up beyond does not contribute to test statistic | Each patient is followed until event or time whichever occurs first; follow-up beyond does not contribute to test statistic |
| Advantages | Uses all available data during follow-up; has the highest statistical power under proportional hazards assumption | Does not require proportional hazards assumption; uses all available data during follow-up | Does not require proportional hazards assumption; trial duration more predictable (depends only on the enrollment rate) | Does not require proportional hazards assumption; trial duration more predictable (depends only on the enrollment rate) |
| Disadvantages | Requires proportional hazards assumption (for optimal power and interpretability of hazard ratio); trial duration can be unpredictable (depends on time to reach number of events required) | Trial duration can be unpredictable (depends on time to reach number of events required) | Use only data up to time | Use only data up to time |
Disclaimer/Publisher’s Note: The statements, opinions and data contained in all publications are solely those of the individual author(s) and contributor(s) and not of MDPI and/or the editor(s). MDPI and/or the editor(s) disclaim responsibility for any injury to people or property resulting from any ideas, methods, instructions or products referred to in the content. |
© 2025 by the authors. Licensee MDPI, Basel, Switzerland. This article is an open access article distributed under the terms and conditions of the Creative Commons Attribution (CC BY) license (https://creativecommons.org/licenses/by/4.0/).
Share and Cite
Ou, F.-S.; Zemla, T.; Le-Rademacher, J.G. The Impact of Design Misspecifications on Survival Outcomes in Cancer Clinical Trials. Cancers 2025, 17, 2609. https://doi.org/10.3390/cancers17162609
Ou F-S, Zemla T, Le-Rademacher JG. The Impact of Design Misspecifications on Survival Outcomes in Cancer Clinical Trials. Cancers. 2025; 17(16):2609. https://doi.org/10.3390/cancers17162609
Chicago/Turabian StyleOu, Fang-Shu, Tyler Zemla, and Jennifer G. Le-Rademacher. 2025. "The Impact of Design Misspecifications on Survival Outcomes in Cancer Clinical Trials" Cancers 17, no. 16: 2609. https://doi.org/10.3390/cancers17162609
APA StyleOu, F.-S., Zemla, T., & Le-Rademacher, J. G. (2025). The Impact of Design Misspecifications on Survival Outcomes in Cancer Clinical Trials. Cancers, 17(16), 2609. https://doi.org/10.3390/cancers17162609


