Article

Dysregulated miRNA Expression and Its Association with Immune Checkpoints in Head and Neck Cancer

1
Molecular Signaling & Drug Discovery Laboratory, Department of Biochemistry, Central University of Punjab, Guddha, Bathinda 151401, India
2
Department of Molecular Biology, ICMR-National Institute of Cancer Prevention and Research, Noida 201301, India
3
Department of Microbiology, Chaudhary Charan Singh University, Meerut 250001, India
4
Department of ENT, Lok Nayak Hospital, New Delhi 110002, India
5
Department of ENT, Maulana Azad Medical College, New Delhi 110002, India
6
Department of Urology, School of Medicine, Case Western Reserve University, Cleveland, OH 44106, USA
*
Authors to whom correspondence should be addressed.
Cancers 2025, 17(13), 2169; https://doi.org/10.3390/cancers17132169
Submission received: 24 May 2025 / Revised: 23 June 2025 / Accepted: 26 June 2025 / Published: 27 June 2025

Simple Summary

The management of HNC is a major global challenge, with chemo-radiotherapy resistance and a low 5-year survival rate. Recently, the FDA has approved anti-PD1/PDL1-based immunotherapies for the better management and longer survival of HNC patients. However, immune-escaping mechanisms mitigate the antitumoral effect of anti-PD-1/PD-L1-based therapies. Dysregulated miRNAs are increasingly recognized as key players in immune evasion mechanisms through the modulation of several immune signaling pathways that are essential for antitumor immune responses. In this study, we aimed to identify miRNAs whose dysregulation is closely associated with immune-escaping mechanisms and lower survival rates in HNC patients. The present study found some key miRNAs that are associated with lower survival rates and immune evasion mechanisms. Targeting the identified miRNAs can help modulate immune evasion mechanisms and possibly enhance the efficacy of anti-PD-1/PD-L1 therapies, including other immune checkpoint therapies in HNC.

Abstract

Background: Head and neck cancer (HNC) remains a global health challenge with a poor 5-year survival rate among patients with relapsed or advanced-stage disease. Immune checkpoint blockade therapies have emerged as a promising approach to improve outcomes; however, their effectiveness is limited, with response rates of only 15–20% because of immune evasion mechanisms. MicroRNA (miRNA) dysregulation plays a key role in facilitating such immune evasion. In this study, we aim to identify specific miRNAs whose altered expression contributes to immune escape in HNC. Methods: We employed an integrated bioinformatics approach, incorporating differential expression analysis, survival analysis, target prediction, KEGG immune pathway analysis, a protein–protein interaction network, and the identification of hub genes using in silico tools. Results: Our analysis revealed that a high expression of miR-18a and miR-2355 was associated with reduced survival, with the median survival decreasing from 42.9 to 27.8 months, respectively, in advanced-stage patients. Conversely, a low expression of let-7c and miR-6510 was linked to poor prognosis, with survival decreasing from 40.1 to 19.2 months and from 50.1 to 26.8 months, respectively, across disease progression. Further pathway analysis revealed that these miRNAs are significantly involved in the regulation of key immune evasion signaling pathways, including T cell receptor, PD-L1/PD-1 checkpoint, JAK-STAT, TGF-beta, NF-kappa B, and TNF signaling pathways. Hub gene analysis identified AKT1, STAT3, NFKB1, CD4, IL2RB, TLR4, and CTLA-4 as potential dysregulated miRNA targets, with enrichment in immune-related signaling pathways. Conclusions: Taken together, these findings suggest that targeting these miRNAs could modulate immune evasion mechanisms and potentially enhance the efficacy of ICB therapies in HNC.

1. Introduction

Head and neck cancer (HNC) remains one of the most challenging cancers globally, with over 800,000 new cases and approximately 50% mortality annually [1]. Standard treatment options include surgery, radiotherapy, and chemotherapy, administered either alone or in combination [2]. However, despite surgical intervention, treatment outcomes remain limited due to factors such as resistance to chemoradiation, tumor aggressiveness, high heterogeneity, and immune evasion, with the latter being a major contributor to therapeutic failure in HNC [3]. Immunotherapy has significantly advanced cancer treatment, including for HNC. In particular, FDA-approved immune checkpoint inhibitors targeting PD-1/PDL-1 and CTLA-4 have demonstrated substantial progress in treatment strategies [4]. Nevertheless, only a subset of HNC patients, approximately 15–20%, exhibit a complete response, while the majority show partial or no response, limiting the overall survival rate for immune checkpoint blockade (ICB) therapy [5]. This underscores an urgent need to improve the efficacy of ICB therapies in HNC.
The involvement of dysregulated microRNAs (miRNAs) in tumorigenesis, metastasis, and immune modulation is well documented [6,7]. miRNAs are a class of small non-coding RNAs that regulate key cellular processes such as proliferation, differentiation, and apoptosis. The abnormal expression of these miRNAs has been implicated in the initiation and progression of various diseases, including cancer. In HNC, several miRNAs have been associated with disease development and progression through their regulation of tumor suppressors and immune-related genes. Specifically, the overexpression of miR-21, miR-24, miR-31, miR-184, miR-211, and miR-222 and the downregulation of miR-203, miR-100, miR-133, miR-375, miR-145, miR-218, miR-186, miR-191, miR-333, and miR-34a have been linked to HNC pathogenesis [8,9,10]. Growing evidence also highlights the role of dysregulated miRNAs in immune evasion, particularly through the modulation of PD-1/PDL-1 expression and the impairment of the antitumor activity of immune cells such as T cells, macrophages, and dendritic cells [11,12]. For example, preclinical studies have shown that dysregulated expression of miR-21 and miR-155 suppresses the antitumor immune response by modulating the T functions of these immune cells in HNC [13,14]. Conversely, the restoration of miR-34a and miR-146a expression has been demonstrated to regulate PD-L1 levels and the PD-1 checkpoint pathway by modulating PD-L1 expression in tumor cells in HNC [12,15].
However, the existing literature indicates that miRNA dysregulation in HNC contributes to immune evasion and plays a critical role in resistance to immunotherapy, particularly ICB therapy. Therefore, it is essential to identify specific miRNAs whose altered expression drives immune evasion and impairs the effectiveness of ICB therapy in HNC. In this study, we investigated the dysregulated expression of miRNAs implicated in the regulation of key immune evasion signaling pathways in HNC.

2. Materials and Methods

2.1. Identification and Survival Analysis of Differentially Expressed miRNAs in HNC

Differentially expressed miRNAs in primary HNC tumors were identified using the TCGA dataset via the UALCAN online tool [16]. Their expression patterns were further analyzed across HNC stages (stage 1: n = 26; stage 2: n = 71; stage 3: n = 75; stage 4: n = 242) compared to adjacent normal tissues (n = 44).
To assess their prognostic relevance, overall survival analysis was performed using the Kaplan–Meier Plotter Database (KMPD) on TCGA samples (primary tumors: n = 523; advanced stages: n = 317). KMPD utilizes Kaplan–Meier and log-rank tests through the miRpower platform, integrating data from METABRIC, TCGA, and GEO series [17].

2.2. Immune Regulation Analysis of miRNAs

Target genes of candidate miRNAs were predicted using TargetScan, which applies a seed-based matching algorithm to identify miRNA–mRNA interactions, retaining targets with at least a “7mer-m8” site [18]. These targets were then subjected to functional enrichment analysis using the DAVID database [19], focusing on immune-related KEGG signaling pathways involved in immune evasion. DAVID evaluates gene lists for enrichment in Gene Ontology (GO) categories—biological processes (BPs), cellular components (CCs), and molecular functions (MFs)—as well as KEGG pathways. Statistical significance was determined using the Benjamini–Hochberg correction to control the false discovery rate (FDR), with pathways showing p < 0.05 considered significant.

2.3. Protein–Protein Interaction Analysis and Hub Gene Identification

The miRNA target genes involved in statistically significant (p < 0.05) immune evasion pathways were used to construct a protein–protein interaction (PPI) network through the STRING database [https://string-db.org/]. The network was built with an interaction score of >0.4 (medium confidence) and active interaction sources. Cytoscape software (v3.38.1) and the cytoHubba app were used for PPI network analysis, with the “Maximal Clique Centrality” (MCC) method applied to identify key hub genes. Hub genes were ranked based on node degree (≥30), and centralities (Closeness and Betweenness) were calculated for further validation.

2.4. Expression Validation of miRNAs from GSE Datasets

miRNAs associated with survival and progression were used to validate their expression regulation in gene expression omnibus (GSE) datasets. For this, we searched the HNC GSE datasets and performed a differential expression analysis of the GSE datasets GSE98463 and GSE33299.

2.5. Regulatory miRNA–mRNA Correlation and Immune Cell Infiltration Analysis in HNC

A list of selected miRNA target genes from immune evasion signaling pathways were subjected to miRNA–mRNA regulatory analysis. For this, co-expression analysis, with the statistical criteria of a Pearson correlation coefficient (r) < −0.2 and p-value < 0.05, was performed for each gene with its regulatory miRNA from the TCGA-HNC dataset using the ENCORI Pan-Cancer Analysis Platform in order to study the negative regulation of target genes. Further, a subset of negatively regulated target genes were used to investigate immune cell infiltration patterns in the tumor immune microenvironment in HNC (n = 526) using several dynamics algorithms like CIBERSORT, QUANTISEQ, and XCELL via the TIMER V.3.0.platform.

2.6. Statistical Analysis

The Benjamini–Hochberg algorithm was used to identify the false discovery rate in miRNA expression data. GraphPad prism 5.0 software was used for statistical analysis. p < 0.05 was used as the statistical significance cutoff across the data.

3. Results

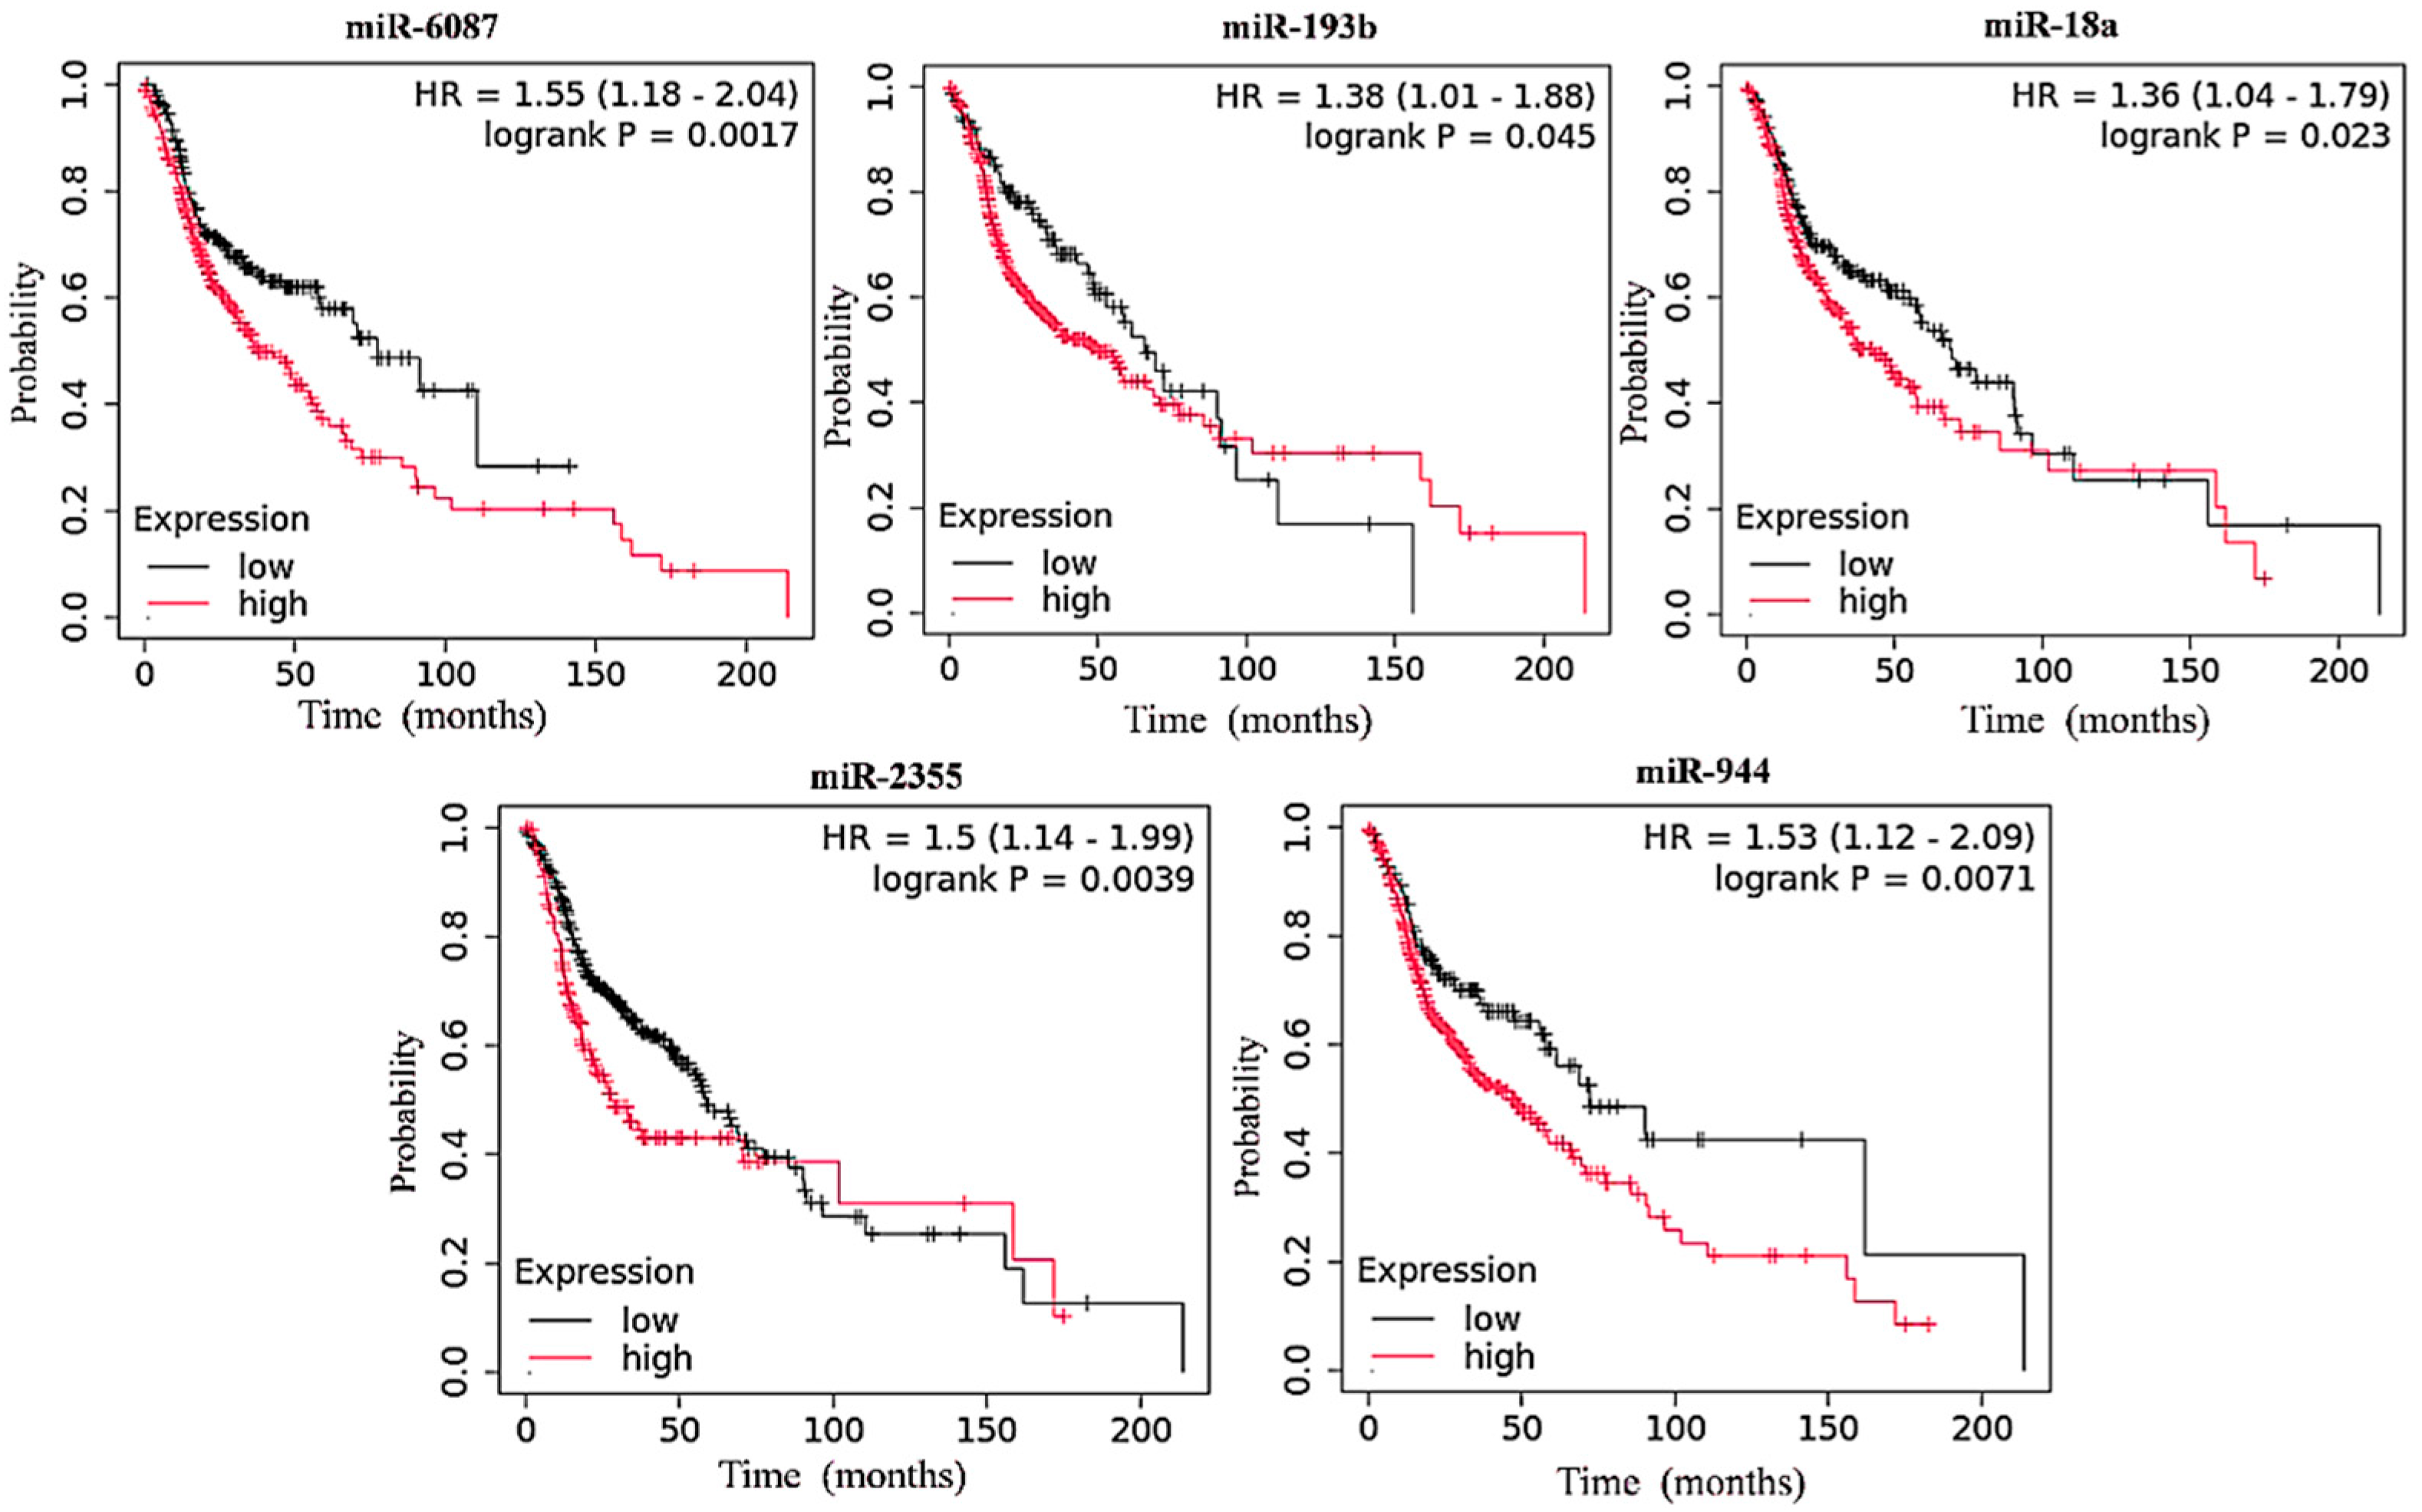
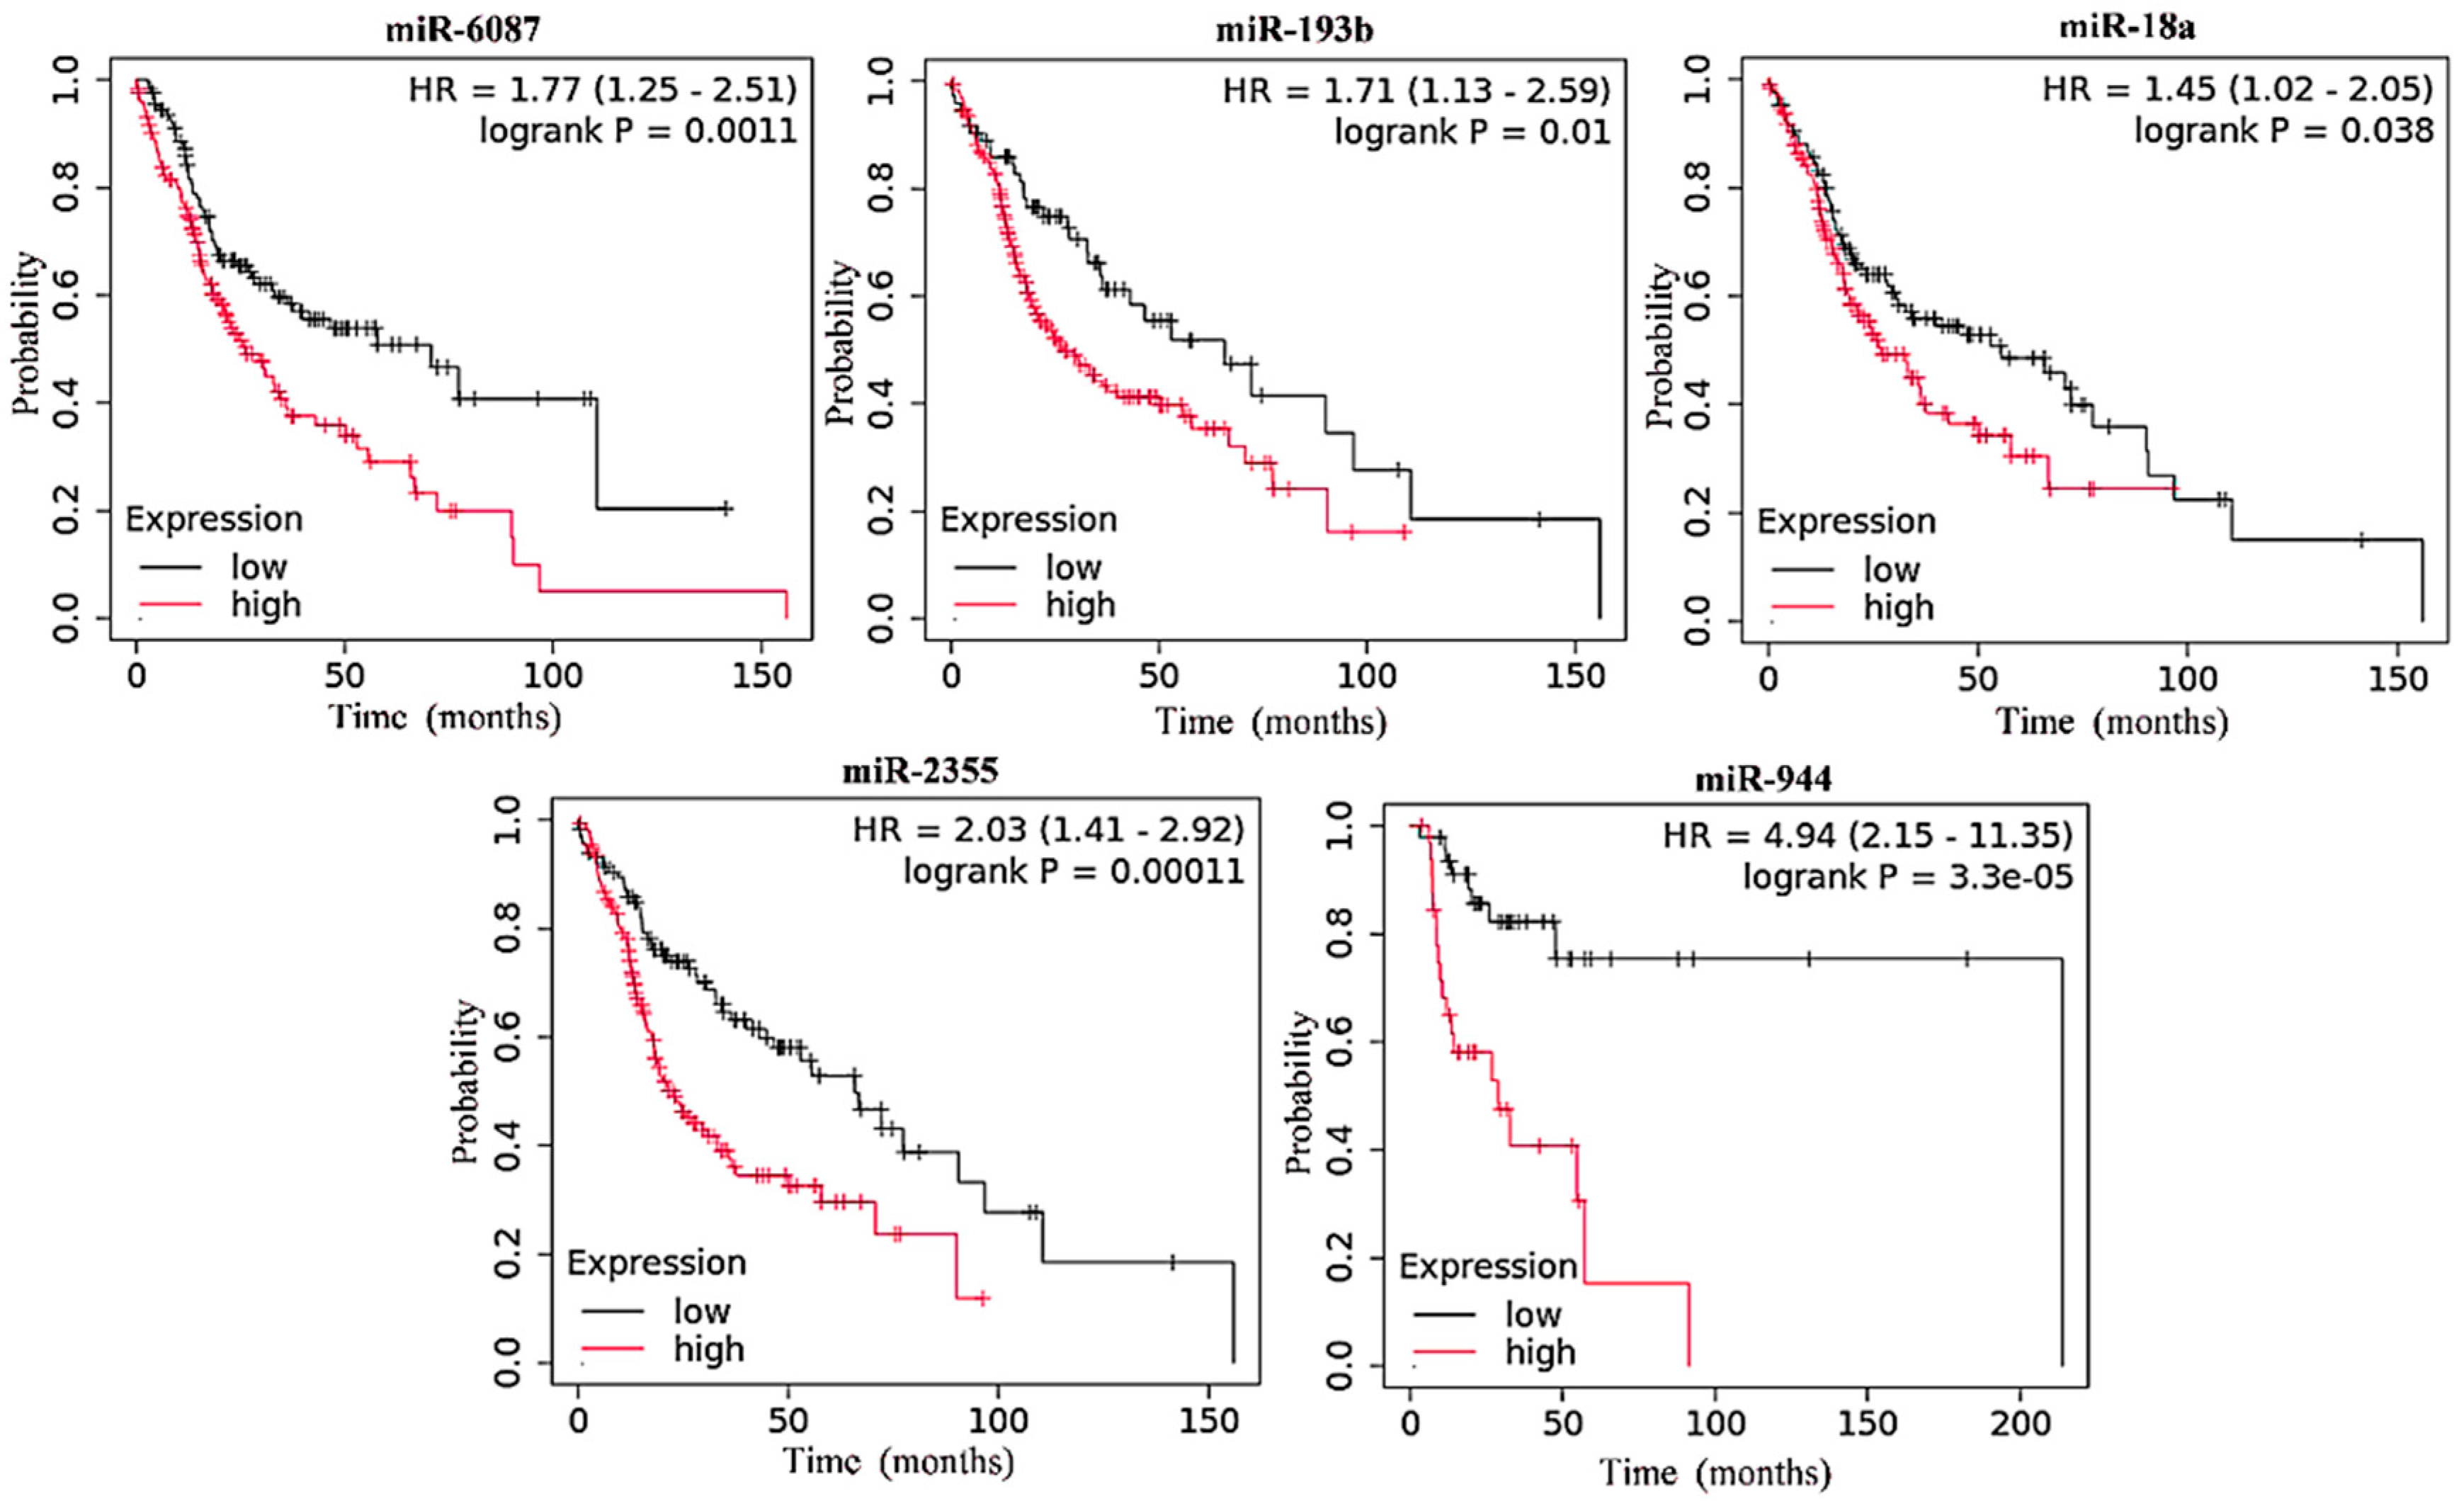
3.1. Upregulated miRNA Expression and Its Inverse Correlation with Survival in HNC

A total of 40 miRNAs (the top 20 upregulated and the top 20 downregulated miRNAs) were selected from the HNC dataset in the TCGA database (Supplementary Figure S1). The top 20 upregulated miRNAs were analyzed for their association with overall survival across all stages of HNC, including advanced stages, and for their differential expression in the primary stages and various other stages of the disease. The results showed that a high expression of hsa-miR-6087, hsa-miR-193b, hsa-miR-18a, hsa-miR-2355, and hsa-miR-944 was significantly associated with poor survival in all stages of HNC (Figure 1). Notably, the overexpression of these miRNAs was even more strongly associated with reduced survival in advanced stages of HNC (Figure 2).
The differential expression of these miRNAs was notably higher in advanced stages of HNC compared to primary tumors (Figure 3). In the low-expression cohort, the median survival time ranged from 58.7 to 77.3 months across all stages (Table 1), while the high-expression cohort had a median survival time ranging from 27.8 to 50.1 months (Table 1). In advanced stages, the high-expression cohort showed a survival time range of 22.67 to 32.67 months, while the low-expression cohort had a median survival time ranging from 55.70 to 70.67 months (Table 1). In addition, data for the best cutoff values and expression ranges for each miRNA in combined stages across HNC is provided in Supplementary Table S3.

3.2. Top Downregulated miRNAs and Their Prognostic Potential in HNC

The top 20 downregulated miRNAs were analyzed for their prognostic value in HNC progression. These miRNAs were examined for their association with overall survival and their expression pattern in primary- and advanced-stage HNC samples. The results showed that the downregulation of hsa-miR-99a, hsa-miR-29c, hsa-let-7c, and hsa-miR-6510 was significantly associated with poor survival across all stages, particularly advanced stages of HNC (Figure 4). Additionally, the downregulation of these miRNAs was observed across different stages of HNC (Figure 5). In the low-expression cohort, the median survival times ranged from 36.03 to 50.13 months (Table 1), while in the high-expression cohort, the median survival times were inversely correlated, ranging from 58.7 to 69.4 months (Table 1). In the advanced stages, the low-expression cohort had median survival times between 18.20 and 27.97 months, whereas the high-expression cohort showed a median survival range of 53.03 to 65.73 months. (Table 1). The data for the best cutoff values and expression ranges for each miRNA in advanced stages of HNC is provided in Supplementary Table S3.

3.3. Enrichment of Candidate miRNAs in Immune Evasion

To investigate the role of key upregulated miRNAs (hsa-miR-6087, hsa-miR-193b, hsa-miR-18a, hsa-miR-2355, and hsa-miR-944) and downregulated miRNAs (hsa-miR-99a, hsa-miR-29c, hsa-let-7c, and hsa-miR-6510) in immune evasion in HNC, we performed functional enrichment analysis. Target genes for each miRNA were predicted using TargetScan, identifying 13,817 target genes for upregulated miRNAs (Supplementary Table S1) and 8676 for downregulated miRNAs (Supplementary Table S2). The predicted target genes of hsa-miR-18a and hsa-miR-2355 (upregulated) and hsa-let-7c and hsa-miR-6510 (downregulated) were significantly enriched (p < 0.05) in key immune evasion pathways, including T cell receptor signaling, PD-L1 expression, and PD-1 checkpoint, JAK-STAT, TGF-beta, B cell receptor, NF-kappa B, and TNF signaling pathways (Table 2).

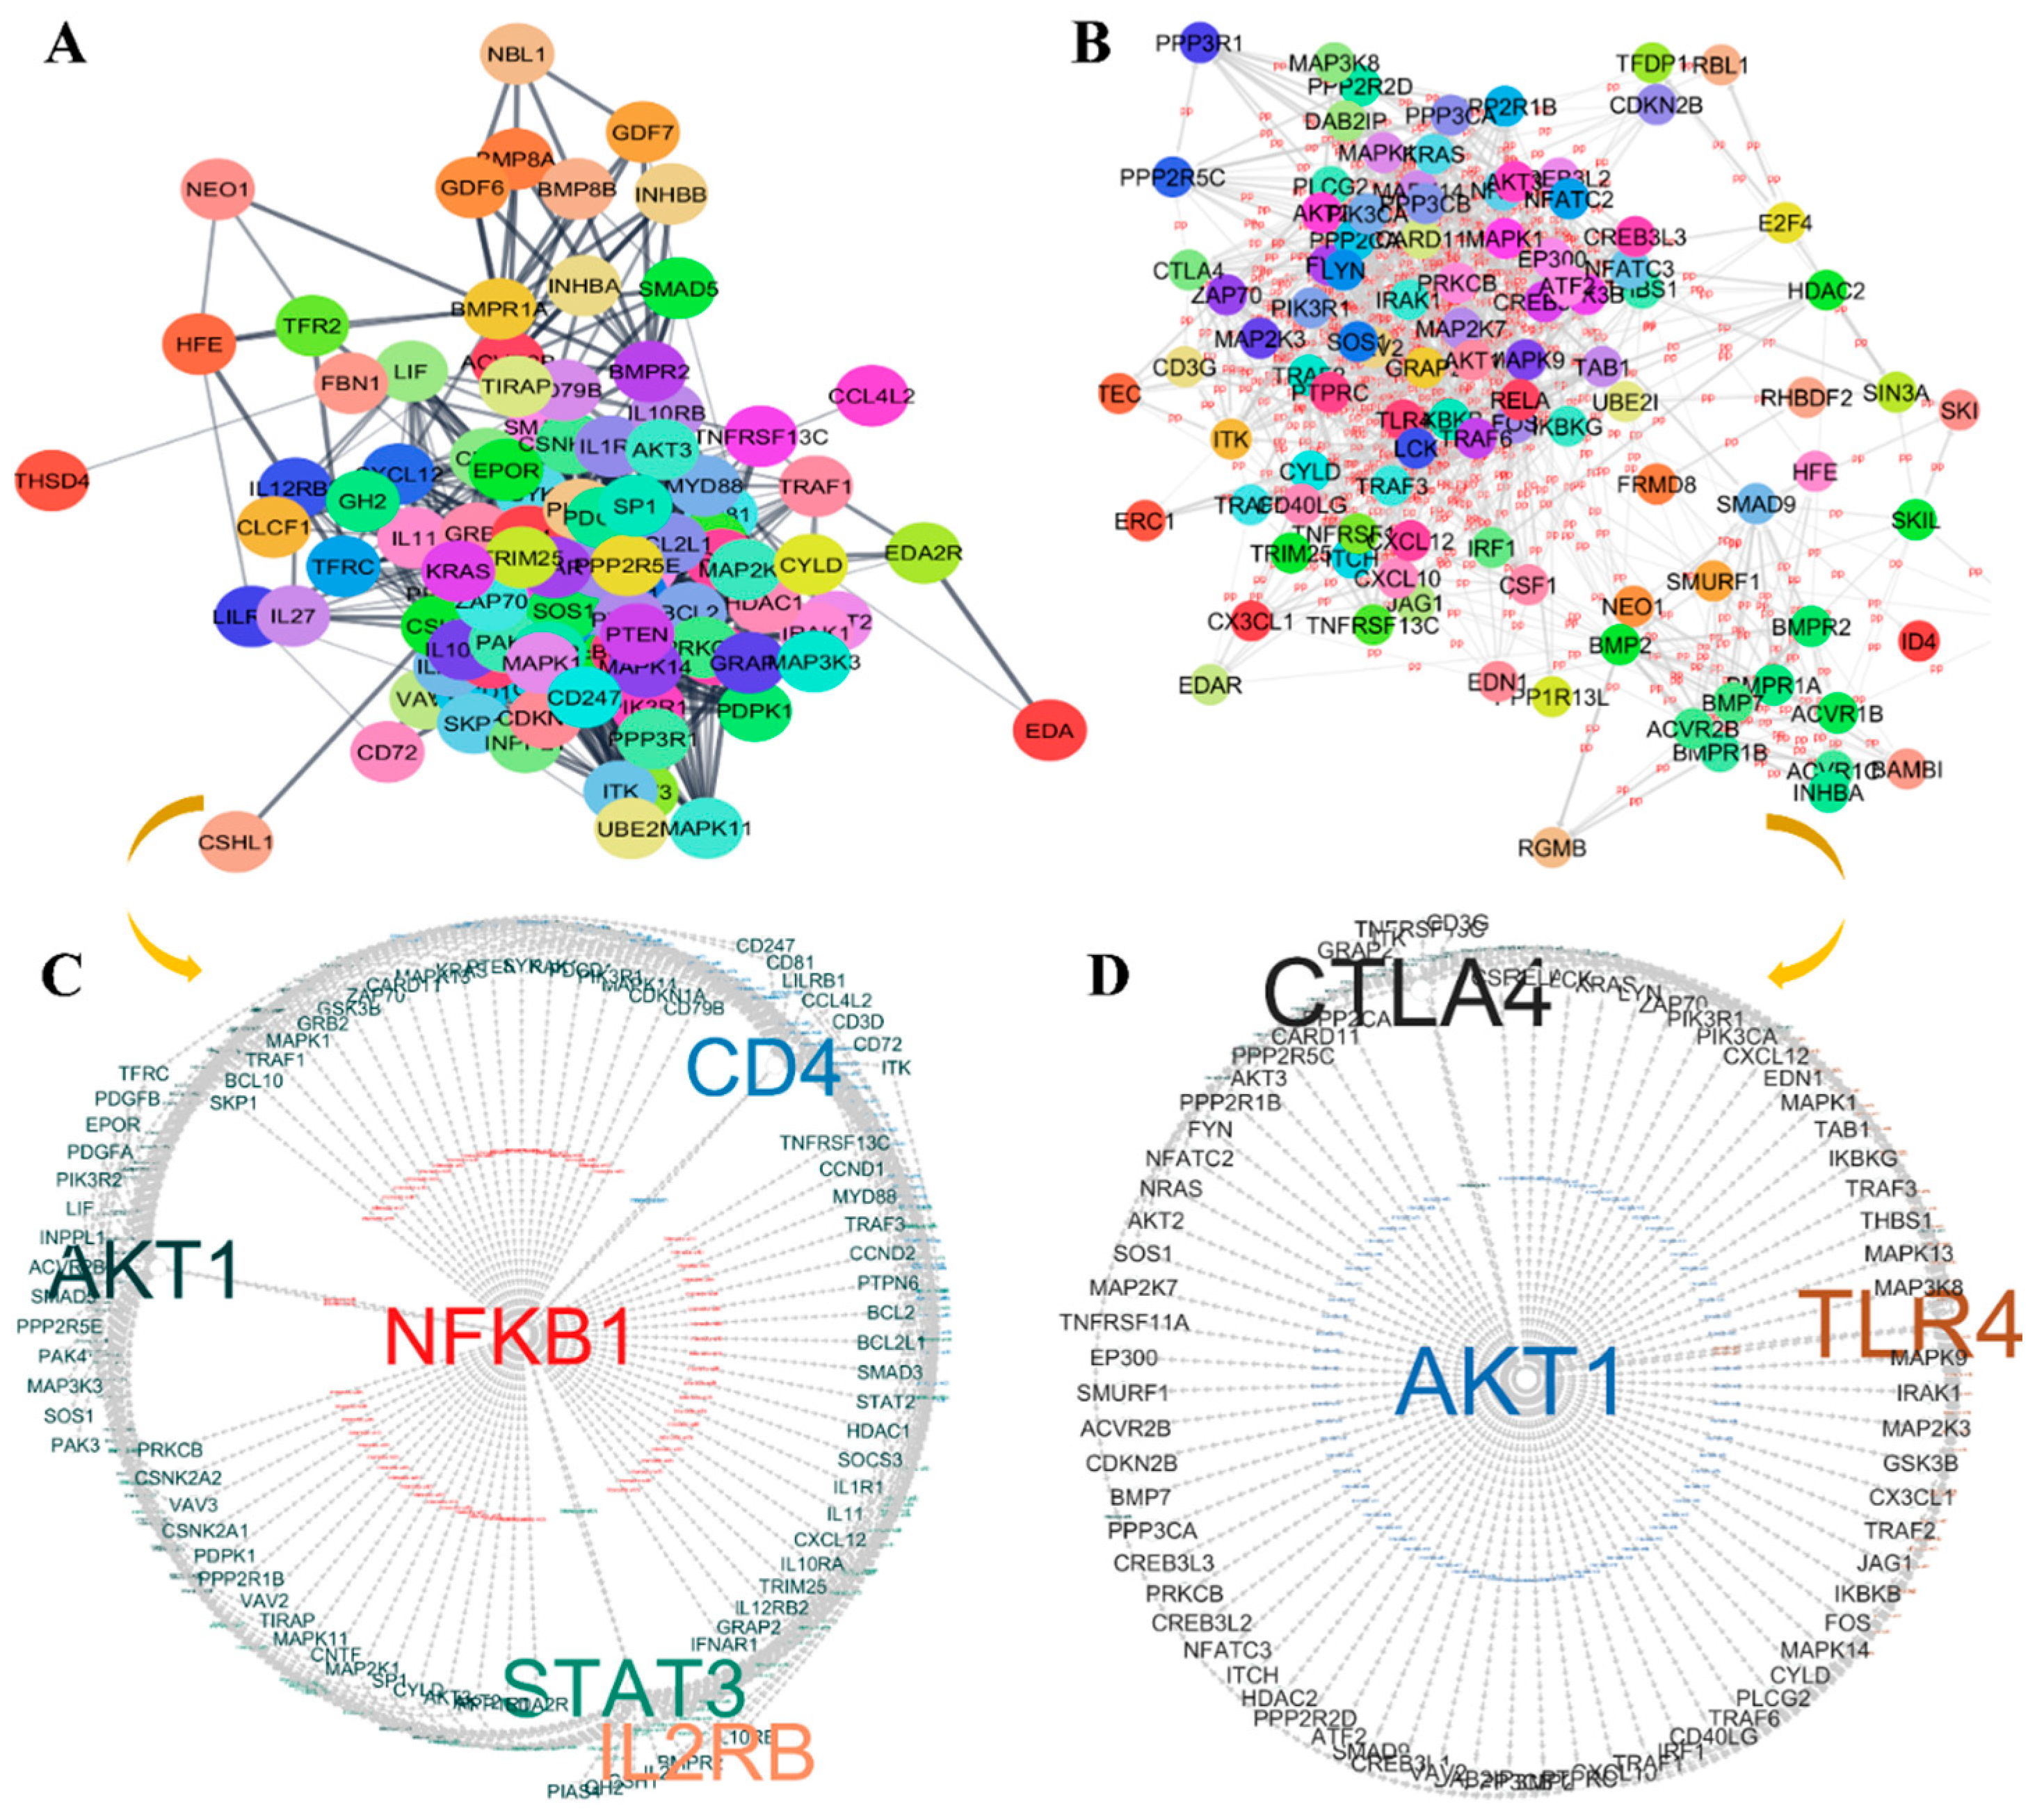
3.4. Protein–Protein Interaction (PPI) Analysis and Hub Gene Identification in Immune Evasion

The upregulated and downregulated miRNAs’ predicted genes were enriched in key immune evasion pathways and analyzed for their PPI information using the STRING database. The PPI network of upregulated miRNAs contained 105 nodes, with an average node degree of 18.70, enriched in 980 edges at a statistically significant p-value < 1.0 × 10⁻¹⁶ (Figure 6A). Similarly, the downregulated miRNAs’ PPI network had 101 nodes, with an average node degree of 18.20, significantly enriched in 921 edges (p < 1.0 × 10⁻¹⁶) (Figure 6B). Cytoscape software was used to analyze both networks and identify hub genes. Genes with the highest degree score (≥30), along with closeness and betweenness centralities, were selected as potential hub genes using the cytoHubba plugin’s MCC method (Table 3). The protein–protein associations of these hub genes were visualized in Cytoscape (Figure 6C,D). AKT1, STAT3, NFKB1, CD4, and IL2RB were identified as key immune signature hub genes for upregulated miRNAs (Figure 6C and Table 3), while AKT1, TLR4, and CTLA-4 were identified as signature hub genes for downregulated miRNAs (Figure 6D and Table 3).

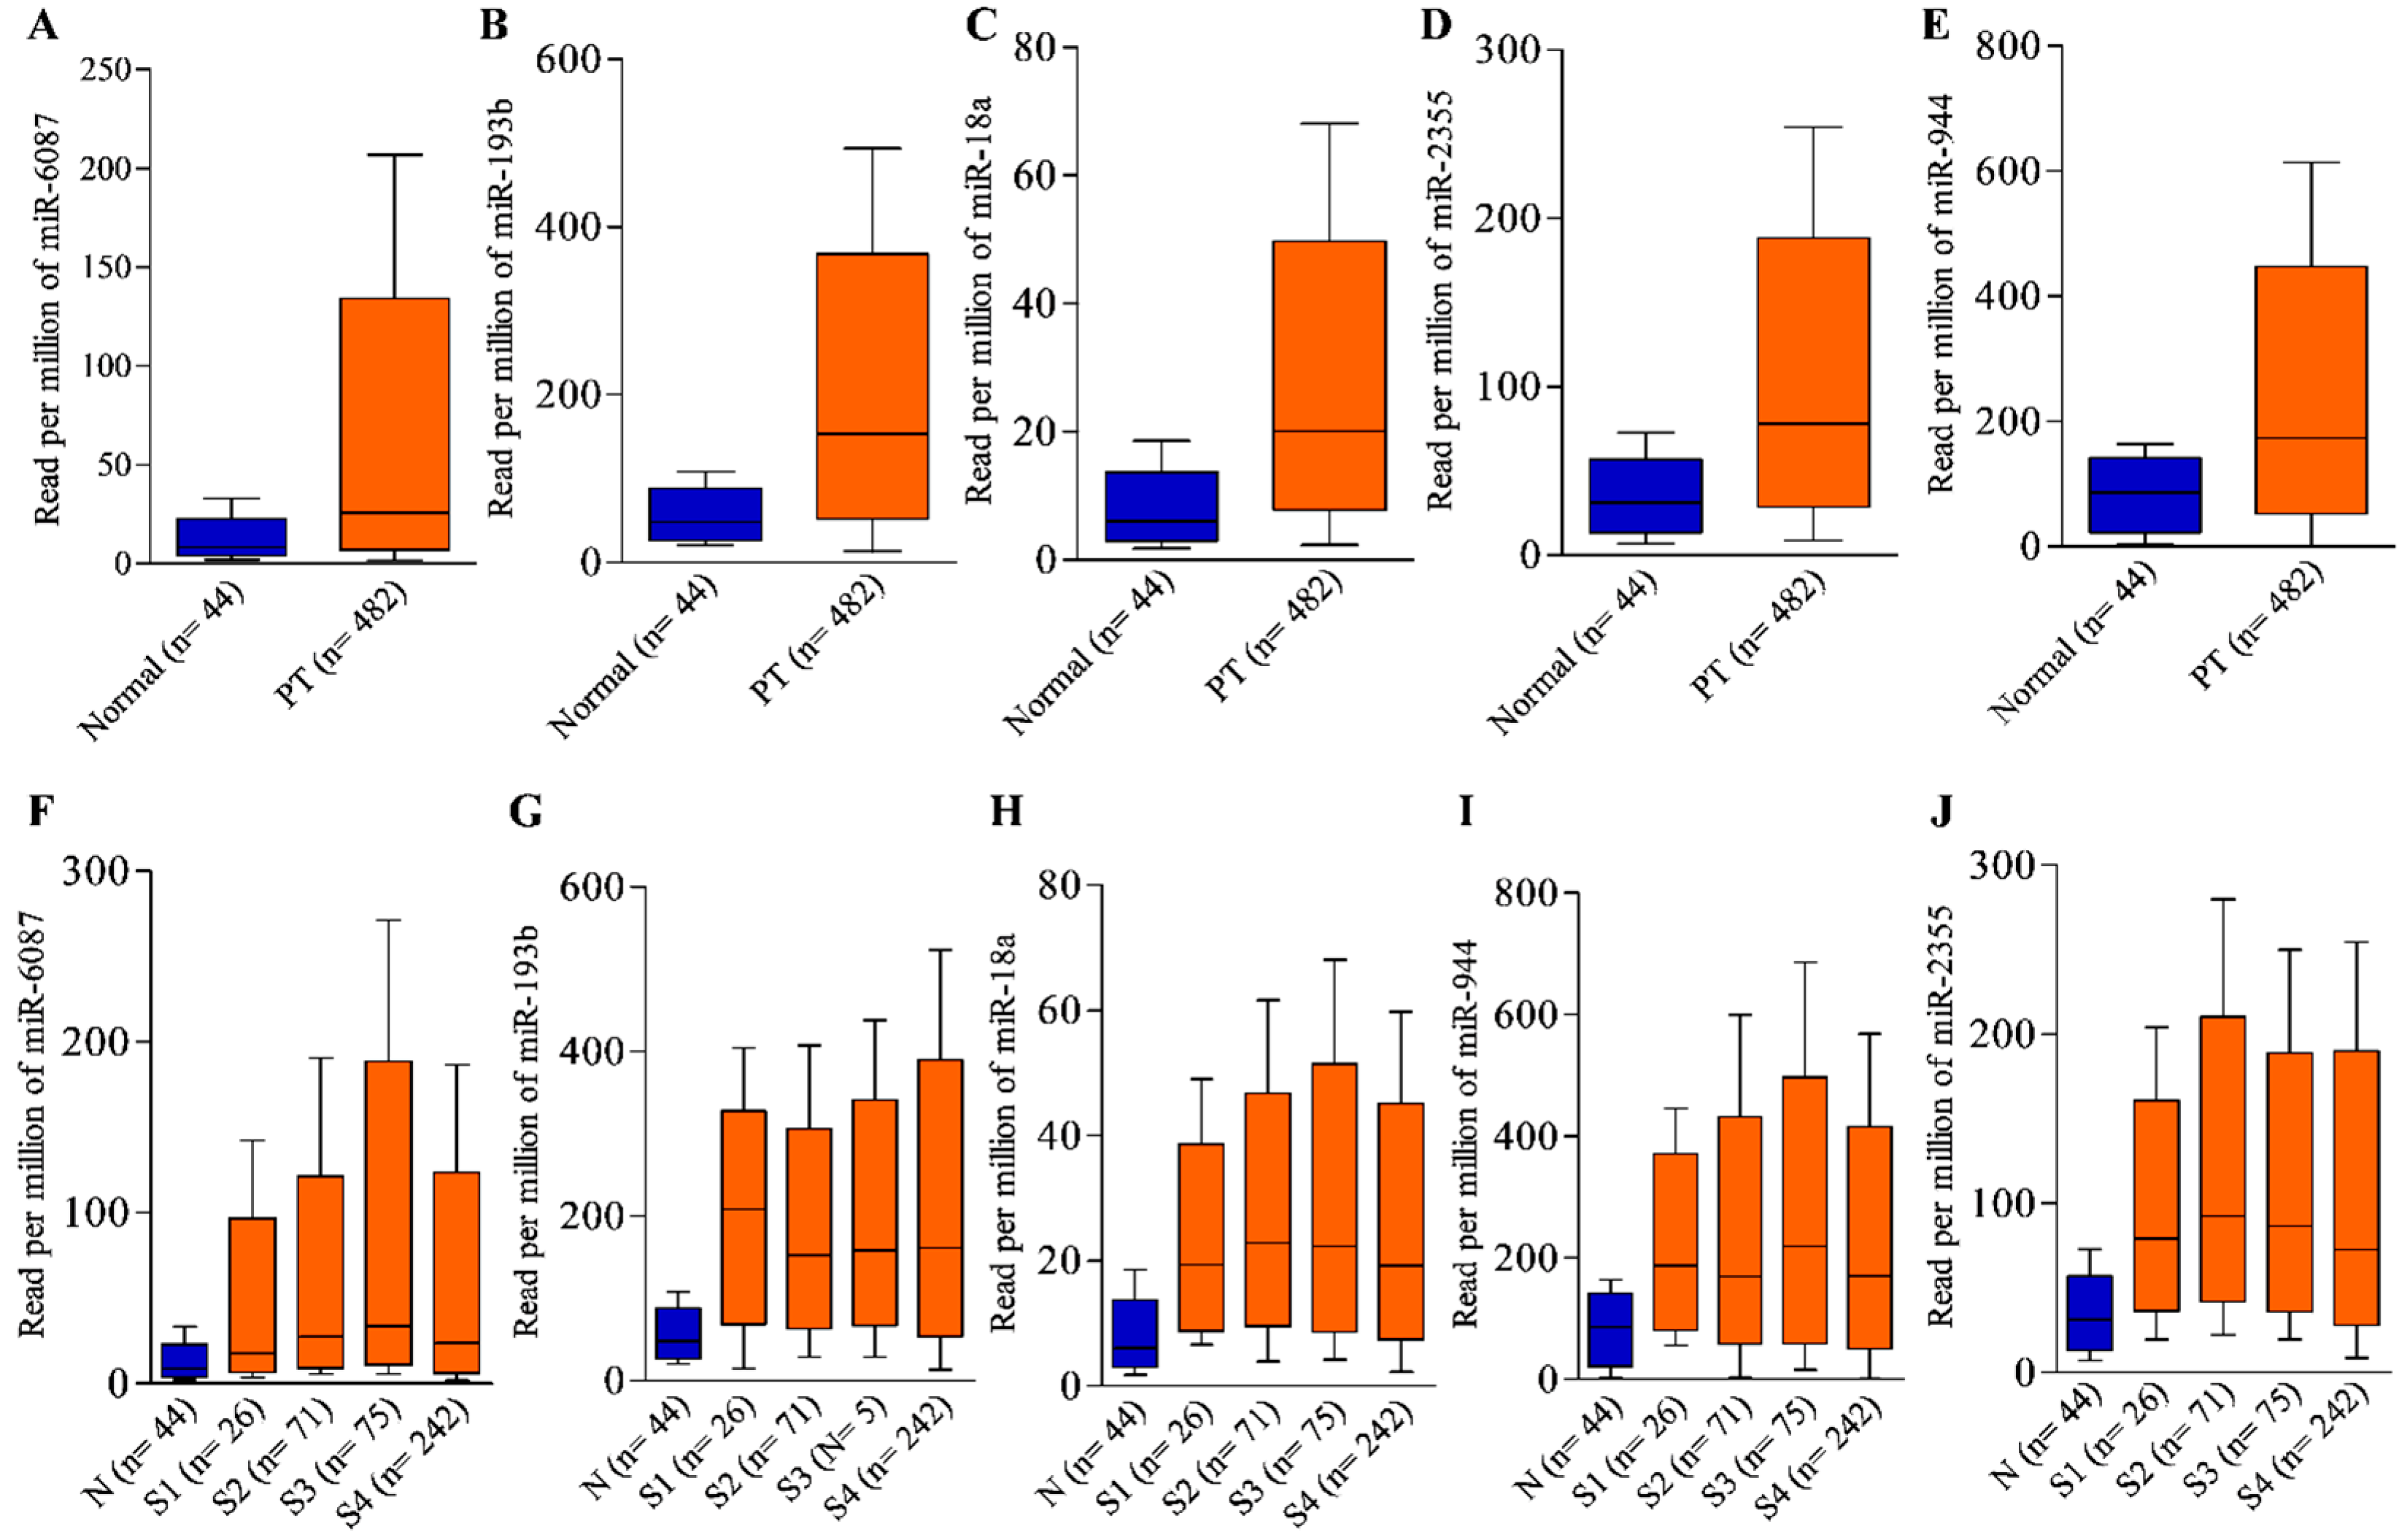
3.5. Expression Validation of Leading miRNAs Using GSE Dataset

The present study identified miR-18a, miR-2355, miR-let-7c, and miR-6510 as leading miRNAs. The expression of miR-18a and miR-2355 was upregulated (Figure 3C,D), while miR-let-7c and miR-6510 were downregulated in HNC (Figure 5C,D). More interestingly, in the expression validation analysis of these miRNAs, this study found similar expression regulation of miR-18a, miR-2355, miR-let-7c, and miR-6510 in the GSE datasets GSE98463 and GSE33299 for HNC. The expression of miR-18a (Log2FC = +0.48) and miR-2355 (Log2FC = +0.15) was upregulated in GSE33299 and GSE98463, respectively. Similarly, the expression of miR-let-7c (Log2FC = −0.35) and miR-6510 (Log2FC = −3.57) was downregulated in the GSE33299 and GSE98463 datasets for HNC, respectively.

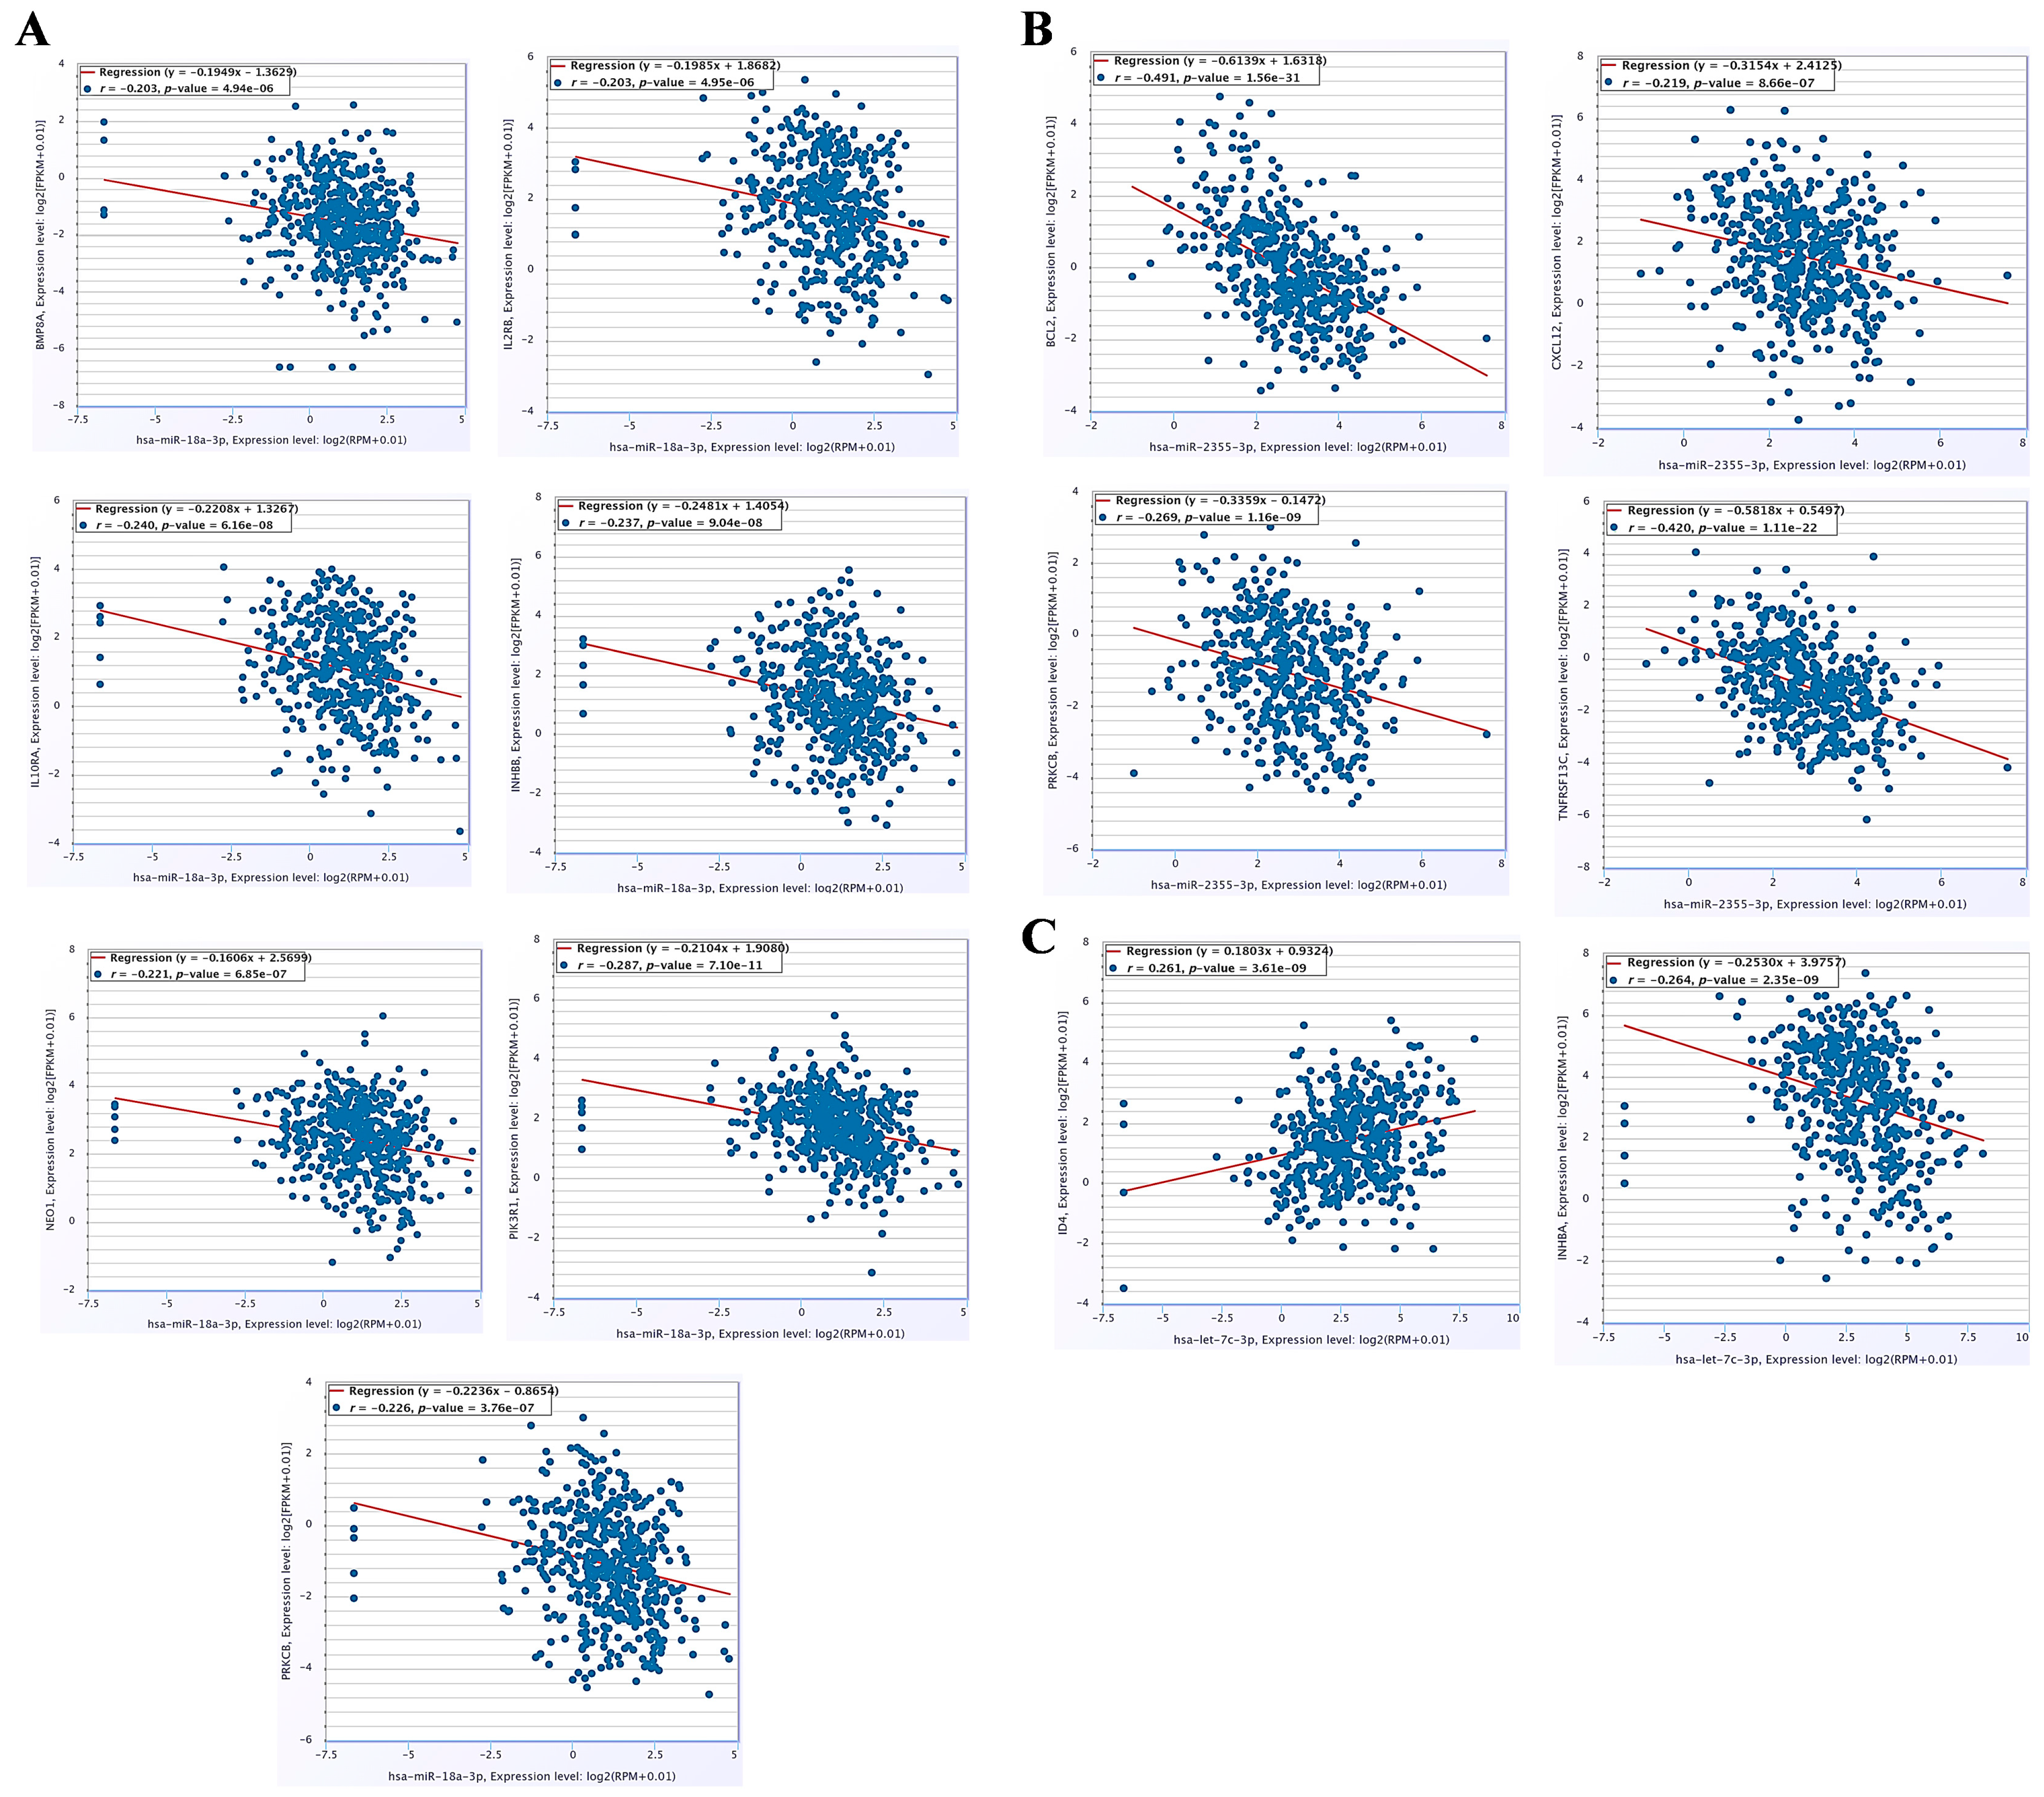
3.6. The miRNA–mRNA Co-Expression Analysis and Immune Cell Infiltration Patterns in HNC

The co-expression analysis of the target genes of miR-18a-3p, miR-2355, let-7c-3p, and miR-6510-5p significantly involved in immune evasion signaling pathways was utilized to understand their regulation in HNC. As a result, statistically significant negative regulation was found in HNC between miR-18a-3p and BMP8A, IL2RB, IL10RB, INHBB, NEO1, PIK3R1, and PRKCB. (Figure 7A); miR-2355-3p and BCL2, CXCL12, PRKCB, and TNFRSF13C (Figure 7B); and let-7c-3p and ID4 and INHBA (Figure 7C). However, the present study did not find any statistically significant negative correlations between miR-6510-5p and its target genes. Furthermore, these leading target genes were subjected to immune cell infiltration analysis in order to determine their potential involvement in shaping tumor immune microenvironments in HNC. The results showed the strong association of target gene expression with the significant infiltration of tumor-targeting immune cells such as macrophages, CD8+ T cells, CD4+ T cells, and myeloid dendritic cells. A Spearman correlation coefficient (ρ) greater than 0.4 with a statistically significant p-value less than 0.05 represents a strong correlation between gene expression and immune cell infiltration in HNC (Supplementary Table S4).

4. Discussion

The management of HNC continues to be a major challenge due to its aggressive nature, high rates of metastasis, resistance to treatment, and recurrence. Immune evasion plays a pivotal role in treatment resistance and disease recurrence. Dysregulated miRNAs are increasingly recognized as key players in immune evasion by modulating pathways such as PD-1/PD-L1 expression and the activity of immune cells like T cells, macrophages, and dendritic cells [11,12], which are essential for antitumor immune responses. When these cells are manipulated by tumor cells, immune evasion ensues, contributing significantly to tumor progression.
In this study, we identified miR-18a, miR-2355, let-7c, and miR-6510 as important regulators of immune evasion signaling pathways in HNC progression. The differential expression analysis of the TCGA HNC dataset revealed that miR-18a and miR-2355 were upregulated while let-7c and miR-6510 were downregulated in primary tumor samples compared to adjacent normal tissues. These dysregulated miRNAs exhibited increased expression across all stages of HNC, suggesting a close association with disease progression. The survival analysis further indicated that the overexpression of miR-18a and miR-2355 correlates with poor survival across all stages, with the worst survival outcomes in advanced stages. These findings align with previous studies, which also reported that elevated levels of miR-18a are linked to poor survival and enhanced tumor progression in HNC [3,20,21,22,23]. Similarly, miR-2355 has been shown to promote cell proliferation, invasion, and metastasis in other cancers, underscoring its potential as an oncogenic miRNA in HNC [24,25]. In contrast, let-7c and miR-6510 were downregulated in primary tumors and across all stages of HNC. The reduced expression of these miRNAs was inversely correlated with survival, with further decreases in their expression during advanced stages of HNC, resulting in significantly worse survival outcomes. This supports findings from previous studies, which have shown that let-7c acts as a tumor suppressor and its downregulation contributes to HNC progression [25,26,27]. Moreover, restoring let-7c expression has been proposed as a potential therapeutic strategy to enhance the efficacy of chemotherapy [26,27]. The downregulation of miR-6510, whose functional role in HNC is largely unexplored, presents an opportunity for further investigation to uncover its role in HNC progression and treatment resistance.
While the role of miR-18a, miR-2355, let-7c, and miR-6510 in immune modulation and HNC progression has been suggested, their precise immunomodulatory roles in HNC and their involvement in immune evasion mechanisms have not been fully explored. To address this, we conducted a functional enrichment analysis and found that the target genes of these dysregulated miRNAs were significantly enriched in several key immune evasion signaling pathways, including the JAK-STAT, T cell receptor signaling, PD-L1 expression, PD-1 checkpoint, TGF-beta signaling, NF-kappa B, and TNF signaling pathways. These pathways are well-established in HNC progression and immune evasion, with many studies highlighting their role in inhibiting immune responses, promoting tumor growth, and contributing to immune checkpoint blockade (ICB) therapy resistance.
For example, the hyperactivation of the JAK-STAT and TGF-beta signaling pathways has been implicated in immune suppression [28,29], while the PD-1/PD-L1 pathway is known to impair T cell activity and promote immune evasion in HNC [30]. Similarly, the dysregulation of NF-kappa B and TNF signaling contributes to the inflammatory tumor microenvironment, further inhibiting antitumor immune responses [31,32]. These findings support the hypothesis that modulating these signaling pathways via their respective miRNAs could potentially overcome immune evasion and enhance the efficacy of ICB therapies in HNC.
In addition, we identified key hub genes such as AKT1, STAT3, NFKB1, CD4, IL2RB, TLR4, and CTLA-4, which were central to the immune-related pathways enriched by the dysregulated miRNAs. These hub genes play critical roles in immune evasion and are involved in resistance to ICB therapies in HNC [33,34,35,36,37]. For instance, the overexpression of AKT1 has been shown to upregulate PD-L1 expression, contributing to resistance to anti-PD-L1 therapy [38,39]. The oncogenic activation of STAT3, NFKB1, and TLR4, along with altered expression of CD4 and IL2RB, further supports immune evasion by enhancing proinflammatory cytokine production and inhibiting cytotoxic T cell activity [36,40,41,42,43]. These findings suggest that targeting these hub genes through their respective miRNAs may serve as a novel therapeutic strategy to mitigate immune evasion and improve the efficacy of ICB therapies in HNC. IC-mediated T cell exhaustion is involved in inhibiting TCR and PI3K–AKT signaling.
A strong correlation was observed between the selected miRNAs (miR-18a-3p, miR-2355, let-7c-3p, and miR-6510-5p) and their target genes (BMP8A, IL2RB, IL10RB, INHBB, NEO1, PIK3R1, PRKCB BCL2, CXCL12, PRKCB, TNFRSF13C, ID4, and INHBA), which were significantly enriched in immune evasion signaling pathways. Therefore, such an miRNA–mRNA correlation analysis revealed that the expression regulation of these genes via their respective miRNAs can modulate immune evasion in HNC. Furthermore, the present study found a strong correlation between the expression of target genes (IL10RB, INHBB, NEO1, PIK3R1, BCL2, ID4, and INHBA) and the infiltration of tumor-killing cells into the tumor immune microenvironment in HNC. The immune infiltration analyses revealed the infiltration of immune cells, particularly CD8+ T cells, CD4+ T cells, dendritic cells, and natural killer cells, in HNC. CD8+ is activated in CTLs and mediates the effector function through killing tumor cells in the TME. However, the mechanisms involved in maintaining an immune-suppressive TME and one of the important underlying mechanisms in the overexpression of the negative regulation of ICs, including PD1/CTLA-4, dampen the immune response. Despite immune infiltration, other mechanisms such as DC conditioning, M1-to-M2 macrophage polarization, and the overexpression of ICs in immune effector cells dampen the antitumoral efficacy, which leads to the progression of HNC. Moreover, several studies have reported that the overexpression of these genes is significantly involved in immune escape mechanisms by generating an immunosuppressive tumor microenvironment and proinflammatory cytokines, reducing T cell activation, and favoring Treg maintenance in several cancers [44,45,46,47]. Our results are in line with previous findings and indicate that the modulation of these genes’ expression via their respective miRNAs may enhance the immune response and modulate the immune escape mechanism via the infiltration of tumor-killing cells into the HNC tumor microenvironment.

5. Conclusions

In conclusion, the dysregulated expression of miR-18a, miR-2355, let-7c, and miR-6510 in HNC plays a significant role in immune evasion and tumor progression. Targeting these miRNAs and their associated immune signaling pathways offers promising avenues for therapeutic intervention. Moreover, the identification of key genes in the tumor immune microenvironment (TIMR), such as IL10RB, INHBB, NEO1, PIK3R1, BCL2, ID4, and INHBA, further underscores the potential of miRNA-based therapies to enhance the efficacy of ICB treatments in HNC, providing a new direction for improving clinical outcomes in patients with this challenging cancer.

Supplementary Materials

The following supporting information can be downloaded at https://www.mdpi.com/article/10.3390/cancers17132169/s1, Figure S1: Top 20 up- and downregulated miRNAs in HNC; Table S1: Target genes for upregulated miRNAs; Table S2: Target genes for downregulated miRNAs; Table S3: Cutoff values and expression ranges of miRNAs in patients with combined and advanced stages of HNC; Table S4: Correlation between gene expression and immune cell infiltrations in the tumor microenvironment for HNC.

Author Contributions

M.S. performed the in silico analysis, visualized, interpreted and acquired the data, and wrote the first draft of the manuscript; P.K. designed the study and edited the final version of the manuscript; S.G., I.S. and S.K. edited the manuscript; D.S. and G.S. carried out the editing and formatting of the manuscript. All authors have read and agreed to the published version of the manuscript.

Funding

The Indian Council of Medical Research under an ignition grant (intramural research grant), New Delhi, India, funded this research, grant number: “INTR-IG/NICPR/06/2023”.

Institutional Review Board Statement

Not applicable.

Informed Consent Statement

Not applicable.

Data Availability Statement

The other data that support the findings of this study are available in the Supplementary Materials of this article.

Acknowledgments

S.K. acknowledges the Anusandhan National Research Foundation, India, for providing the JNU-CUPB ANRF HUB University grant. P.K. acknowledges The Indian Council of Medical Research under an ignition grant (intramural research grant), New Delhi, India, funded this research, grant number: “INTR-IG/NICPR/06/2023”.

Conflicts of Interest

The authors declare no conflicts of interest.

References

  1. Cohen, N.; Fedewa, S.; Chen, A.Y. Epidemiology and Demographics of the Head and Neck Cancer Population. Oral Maxillofac. Surg. Clin. N. Am. 2018, 30, 381–395. [Google Scholar] [CrossRef] [PubMed]
  2. Xiang, Y.; Gong, M.; Deng, Y.; Wang, H.; Ye, D. T cell effects and mechanisms in immunotherapy of head and neck tumors. Cell Commun. Signal. 2023, 21, 49. [Google Scholar] [CrossRef]
  3. Vakili, S.; Behrooz, A.B.; Whichelo, R.; Fernandes, A.; Emwas, A.H.; Jaremko, M.; Markowski, J.; Los, M.J.; Ghavami, S.; Vitorino, R. Progress in Precision Medicine for Head and Neck Cancer. Cancers 2024, 16, 3716. [Google Scholar] [CrossRef]
  4. Seidel, J.A.; Otsuka, A.; Kabashima, K. Anti-PD-1 and Anti-CTLA-4 Therapies in Cancer: Mechanisms of Action, Efficacy, and Limitations. Front. Oncol. 2018, 8, 86. [Google Scholar] [CrossRef]
  5. Hobday, S.B.; Brody, R.M.; Kriegsman, B.; Basu, D.; Newman, J.; Cohen, R.B.; Lukens, J.N.; Singh, A.; D’Avella, C.A.; Sun, L. Outcomes Among Patients with Mucosal Head and Neck Squamous Cell Carcinoma Treated with Checkpoint Inhibitors. JAMA Otolaryngol. Head Neck Surg. 2022, 148, 918–926. [Google Scholar] [CrossRef] [PubMed]
  6. Ali Syeda, Z.; Langden, S.S.S.; Munkhzul, C.; Lee, M.; Song, S.J. Regulatory Mechanism of MicroRNA Expression in Cancer. Int. J. Mol. Sci. 2020, 21, 1723. [Google Scholar] [CrossRef]
  7. Shuaib, M.; Kumar, S. Induced expression of miR-1250-5p exerts tumor suppressive role in triple-negative breast cancer cells. J. Cell. Biochem. 2023, 124, 282–293. [Google Scholar] [CrossRef] [PubMed]
  8. Doghish, A.S.; El-Husseiny, A.A.; Khidr, E.G.; Elrebehy, M.A.; Elballal, M.S.; Abdel-Reheim, M.A.; Abdel Mageed, S.S.; Zaki, M.B.; Mohammed, O.A.; Khaled, R.; et al. Decoding the role of miRNAs in oral cancer pathogenesis: A focus on signaling pathways. Pathol. Res. Pract. 2023, 252, 154949. [Google Scholar] [CrossRef]
  9. El-Mahdy, H.A.; Mohamadin, A.M.; Abulsoud, A.I.; Khidr, E.G.; El-Husseiny, A.A.; Ismail, A.; Elsakka, E.G.E.; Mokhlis, H.A.; El-Husseiny, H.M.; Doghish, A.S. miRNAs as potential game-changers in head and neck cancer: Future clinical and medicinal uses. Pathol. Res. Pract. 2023, 245, 154457. [Google Scholar] [CrossRef]
  10. Hsieh, C.H.; Tai, S.K.; Yang, M.H. Snail-overexpressing Cancer Cells Promote M2-Like Polarization of Tumor-Associated Macrophages by Delivering MiR-21-Abundant Exosomes. Neoplasia 2018, 20, 775–788. [Google Scholar] [CrossRef]
  11. Ha, J.Y.; Choi, S.Y.; Kim, S.J.; Seog, K.J.; Hong, S.H.; Lee, H.J. Transcriptome Analysis of HNSCC by Aggregatibacter actinomycetemcomitans Extracellular Vesicles. Oral Dis. 2024, 13, 1165–1177. [Google Scholar] [CrossRef] [PubMed]
  12. Chen, Y.; Chen, J.; Wang, H.; Shi, J.; Wu, K.; Liu, S.; Liu, Y.; Wu, J. HCV-induced miR-21 contributes to evasion of host immune system by targeting MyD88 and IRAK1. PLoS Pathog. 2013, 9, e1003248. [Google Scholar] [CrossRef]
  13. Wang, S.; Gao, Y. Pancreatic cancer cell-derived microRNA-155-5p-containing extracellular vesicles promote immune evasion by triggering EHF-dependent activation of Akt/NF-κB signaling pathway. Int. Immunopharmacol. 2021, 100, 107990. [Google Scholar] [CrossRef]
  14. Wu, X.; Cheng, Y.; Matthen, M.; Yoon, A.; Schwartz, G.K.; Bala, S.; Taylor, A.M.; Momen-Heravi, F. Down-regulation of the tumor suppressor miR-34a contributes to head and neck cancer by up-regulating the MET oncogene and modulating tumor immune evasion. J. Exp. Clin. Cancer Res. 2021, 40, 70. [Google Scholar] [CrossRef]
  15. Chandrashekar, D.S.; Karthikeyan, S.K.; Korla, P.K.; Patel, H.; Shovon, A.R.; Athar, M.; Netto, G.J.; Qin, Z.S.; Kumar, S.; Manne, U.; et al. UALCAN: An update to the integrated cancer data analysis platform. Neoplasia 2022, 25, 18–27. [Google Scholar] [CrossRef]
  16. Győrffy, B. Integrated analysis of public datasets for the discovery and validation of survival-associated genes in solid tumors. Innovation 2024, 5, 100625. [Google Scholar] [CrossRef] [PubMed]
  17. Agarwal, V.; Bell, G.W.; Nam, J.W.; Bartel, D.P. Predicting effective microRNA target sites in mammalian mRNAs. Elife 2015, 4, e05005. [Google Scholar] [CrossRef] [PubMed]
  18. Sherman, B.T.; Hao, M.; Qiu, J.; Jiao, X.; Baseler, M.W.; Lane, H.C.; Imamichi, T.; Chang, W. DAVID: A web server for functional enrichment analysis and functional annotation of gene lists (2021 update). Nucleic Acids Res. 2022, 50, W216–W221. [Google Scholar] [CrossRef]
  19. Jamali, Z.; Asl Aminabadi, N.; Attaran, R.; Pournagiazar, F.; Ghertasi Oskouei, S.; Ahmadpour, F. MicroRNAs as prognostic molecular signatures in human head and neck squamous cell carcinoma: A systematic review and meta-analysis. Oral. Oncol. 2015, 51, 321–331. [Google Scholar] [CrossRef]
  20. Xu, X.L.; Jiang, Y.H.; Feng, J.G.; Su, D.; Chen, P.C.; Mao, W.M. MicroRNA-17, microRNA-18a, and microRNA-19a are prognostic indicators in esophageal squamous cell carcinoma. Ann. Thorac. Surg. 2014, 97, 1037–1045. [Google Scholar] [CrossRef]
  21. Mai, S.; Xiao, R.; Shi, L.; Zhou, X.; Yang, T.; Zhang, M.; Weng, N.; Zhao, X.; Wang, R.; Liu, J.; et al. MicroRNA-18a promotes cancer progression through SMG1 suppression and mTOR pathway activation in nasopharyngeal carcinoma. Cell Death Dis. 2019, 10, 819. [Google Scholar] [CrossRef] [PubMed]
  22. Zhong, Q.; Nie, Q.; Wu, R.; Huang, Y. Exosomal miR-18a-5p promotes EMT and metastasis of NPC cells via targeting BTG3 and activating the Wnt/β-catenin signaling pathway. Cell Cycle 2023, 22, 1544–1562. [Google Scholar] [CrossRef] [PubMed]
  23. Zhang, Q.; Guan, F.; Fan, T.; Li, S.; Ma, S.; Zhang, Y.; Guo, W.; Liu, H. LncRNA WDFY3-AS2 suppresses proliferation and invasion in oesophageal squamous cell carcinoma by regulating miR-2355-5p/SOCS2 axis. J. Cell. Mol. Med. 2020, 24, 8206–8220. [Google Scholar] [CrossRef] [PubMed]
  24. Li, Y.; Liu, F.; Cai, Q.; Deng, L.; Ouyang, Q.; Zhang, X.H.; Zheng, J. Invasion and metastasis in cancer: Molecular insights and therapeutic targets. Signal. Transduct. Target. Ther. 2025, 10, 57. [Google Scholar] [CrossRef]
  25. Liu, Z.; Long, X.; Chao, C.; Yan, C.; Wu, Q.; Hua, S.; Zhang, Y.; Wu, A.; Fang, W. Knocking down CDK4 mediates the elevation of let-7c suppressing cell growth in nasopharyngeal carcinoma. BMC Cancer 2014, 14, 274. [Google Scholar] [CrossRef]
  26. Wu, Y.; Zhang, Y.; Zheng, X.; Dai, F.; Lu, Y.; Dai, L.; Niu, M.; Guo, H.; Li, W.; Xue, X.; et al. Circular RNA circCORO1C promotes laryngeal squamous cell carcinoma progression by modulating the let-7c-5p/PBX3 axis. Mol. Cancer 2020, 19, 99. [Google Scholar] [CrossRef]
  27. Pang, X.; Tang, Y.L.; Liang, X.H. Transforming growth factor-β signaling in head and neck squamous cell carcinoma: Insights into cellular responses. Oncol. Lett. 2018, 16, 4799–4806. [Google Scholar] [CrossRef]
  28. Lai, S.Y.; Johnson, F.M. Defining the role of the JAK-STAT pathway in head and neck and thoracic malignancies: Implications for future therapeutic approaches. Drug Resist. Updat. 2010, 13, 67–78. [Google Scholar] [CrossRef]
  29. Mei, Z.; Huang, J.; Qiao, B.; Lam, A.K. Immune checkpoint pathways in immunotherapy for head and neck squamous cell carcinoma. Int. J. Oral. Sci. 2020, 12, 16. [Google Scholar] [CrossRef]
  30. Yang, X.; Cheng, H.; Chen, J.; Wang, R.; Saleh, A.; Si, H.; Lee, S.; Guven-Maiorov, E.; Keskin, O.; Gursoy, A.; et al. Head and Neck Cancers Promote an Inflammatory Transcriptome through Coactivation of Classic and Alternative NF-κB Pathways. Cancer Immunol. Res. 2019, 7, 1760–1774. [Google Scholar] [CrossRef]
  31. Selimovic, D.; Wahl, R.U.; Ruiz, E.; Aslam, R.; Flanagan, T.W.; Hassan, S.Y.; Santourlidis, S.; Haikel, Y.; Friedlander, P.; Megahed, M.; et al. Tumor necrosis factor-α triggers opposing signals in head and neck squamous cell carcinoma and induces apoptosis via mitochondrial- and non-mitochondrial-dependent pathways. Int. J. Oncol. 2019, 55, 1324–1338. [Google Scholar] [CrossRef] [PubMed]
  32. Chen, M.; Wang, S. Preclinical development and clinical studies of targeted JAK/STAT combined Anti-PD-1/PD-L1 therapy. Int. Immunopharmacol. 2024, 130, 111717. [Google Scholar] [CrossRef]
  33. Damasio, M.P.S.; Nascimento, C.S.; Andrade, L.M.; de Oliveira, V.L.; Calzavara-Silva, C.E. The role of T-cells in head and neck squamous cell carcinoma: From immunity to immunotherapy. Front. Oncol. 2022, 12, 1021609. [Google Scholar] [CrossRef]
  34. Ni, Y.; Soliman, A.; Joehlin-Price, A.; Rose, P.G.; Vlad, A.; Edwards, R.P.; Mahdi, H. High TGF-β signature predicts immunotherapy resistance in gynecologic cancer patients treated with immune checkpoint inhibition. NPJ Precis. Oncol. 2021, 5, 101. [Google Scholar] [CrossRef] [PubMed]
  35. Forster, M.D.; Devlin, M.J. Immune Checkpoint Inhibition in Head and Neck Cancer. Front. Oncol. 2018, 8, 310. [Google Scholar] [CrossRef] [PubMed]
  36. Betzler, A.C.; Theodoraki, M.N.; Schuler, P.J.; Döscher, J.; Laban, S.; Hoffmann, T.K.; Brunner, C. NF-κB and Its Role in Checkpoint Control. Int. J. Mol. Sci. 2020, 21, 3949. [Google Scholar] [CrossRef]
  37. Zheng, A.; Li, F.; Chen, F.; Zuo, J.; Wang, L.; Wang, Y.; Chen, S.; Xiao, B.; Tao, Z. PD-L1 promotes head and neck squamous cell carcinoma cell growth through mTOR signaling. Oncol. Rep. 2019, 41, 2833–2843. [Google Scholar] [CrossRef]
  38. Lastwika, K.J.; Wilson, W., 3rd; Li, Q.K.; Norris, J.; Xu, H.; Ghazarian, S.R.; Kitagawa, H.; Kawabata, S.; Taube, J.M.; Yao, S.; et al. Control of PD-L1 Expression by Oncogenic Activation of the AKT-mTOR Pathway in Non-Small Cell Lung Cancer. Cancer Res. 2016, 76, 227–238. [Google Scholar] [CrossRef]
  39. Bu, L.L.; Yu, G.T.; Deng, W.W.; Mao, L.; Liu, J.F.; Ma, S.R.; Fan, T.F.; Hall, B.; Kulkarni, A.B.; Zhang, W.F.; et al. Targeting STAT3 signaling reduces immunosuppressive myeloid cells in head and neck squamous cell carcinoma. Oncoimmunology 2016, 5, e1130206. [Google Scholar] [CrossRef]
  40. Zou, S.; Tong, Q.; Liu, B.; Huang, W.; Tian, Y.; Fu, X. Targeting STAT3 in Cancer Immunotherapy. Mol. Cancer 2020, 19, 145. [Google Scholar] [CrossRef]
  41. Szczepanski, M.J.; Czystowska, M.; Szajnik, M.; Harasymczuk, M.; Boyiadzis, M.; Kruk-Zagajewska, A.; Szyfter, W.; Zeromski, J.; Whiteside, T.L. Triggering of Toll-like receptor 4 expressed on human head and neck squamous cell carcinoma promotes tumor development and protects the tumor from immune attack. Cancer Res. 2009, 69, 3105–3113. [Google Scholar] [CrossRef] [PubMed]
  42. Veigas, F.; Mahmoud, Y.D.; Merlo, J.; Rinflerch, A.; Rabinovich, G.A.; Girotti, M.R. Immune Checkpoints Pathways in Head and Neck Squamous Cell Carcinoma. Cancers 2021, 13, 1018. [Google Scholar] [CrossRef]
  43. Jie, H.B.; Schuler, P.J.; Lee, S.C.; Srivastava, R.M.; Argiris, A.; Ferrone, S.; Whiteside, T.L.; Ferris, R.L. CTLA-4+ Regulatory T Cells Increased in Cetuximab-Treated Head and Neck Cancer Patients Suppress NK Cell Cytotoxicity and Correlate with Poor Prognosis. Cancer Res. 2015, 75, 2200–2210. [Google Scholar] [CrossRef] [PubMed]
  44. Hess, A.K.; Müer, A.; Mairinger, F.D.; Weichert, W.; Stenzinger, A.; Hummel, M.; Budach, V.; Tinhofer, I. MiR-200b and miR-155 as predictive biomarkers for the efficacy of chemoradiation in locally advanced head and neck squamous cell carcinoma. Eur. J. Cancer 2017, 77, 3–12. [Google Scholar] [CrossRef] [PubMed]
  45. Okkenhaug, K.; Vanhaesebroeck, B. PI3K in Lymphocyte Development, Differentiation and Activation. Nat. Rev. Immunol. 2003, 3, 317–330. [Google Scholar] [CrossRef]
  46. Liu, L.; Cheng, X.; Yang, H.; Lian, S.; Jiang, Y.; Liang, J.; Chen, X.; Mo, S.; Shi, Y.; Zhao, S.; et al. BCL-2 Expression Promotes Immunosuppression in Chronic Lymphocytic Leukemia by Enhancing Regulatory T Cell Differentiation and Cytotoxic T Cell Exhaustion. Mol. Cancer 2022, 21, 59. [Google Scholar] [CrossRef]
  47. Chang, C.M.; Lam, H.Y.P.; Hsu, H.J.; Jiang, S.J. Interleukin-10: A Double-Edged Sword in Breast Cancer. Tzu Chi Med. J. 2021, 33, 203–211. [Google Scholar] [CrossRef]
Figure 1. Kaplan–Meier survival analyses of upregulated miRNAs in HNC patient samples over 200 months. A statistically significant log-rank p-value > 0.05 and Hazard Ratio (HR) < 1.0 were considered statistically significant factors.
Cancers 17 02169 g001
Figure 2. Kaplan–Meier survival analyses of upregulated miRNAs in HNC patient samples over 200 months. The overall survival analysis was performed for advanced stages of HNC. A statistically significant log-rank p-value > 0.05 and Hazard Ratio (HR) < 1.0 were considered statistically significant factors.
Cancers 17 02169 g002
Figure 3. Differential expression of upregulated miRNAs in HNC samples from TCGA database. The expression of (A) hsa-miR-6087, (B) hsa-miR-193b, (C) hsa-miR-18a, (D) hsa-miR-2355, and (E) hsa-miR-944 in the primary tumor of HNC is shown. Similarly, the differential expression of (F) hsa-miR-6087, (G) hsa-miR-193b, (H) hsa-miR-18a, (I) hsa-miR-944, and (J) hsa-miR-2355 across the different stages of HNC is shown. The statistically significant p-values for each comparison involving hsa-miR-6087 are given [p = 1.94 × 10⁻¹² (N vs. PT), p = 1.52 × 10⁻¹ (N vs. S1), p = 8.95 × 10⁻⁴ (N vs. S2), p = 1.37 × 10⁻³ (N vs. S3), p = 8.36 × 10⁻⁸ (N vs. S4)], hsa-miR-193b [p = 1.62 × 10⁻¹² (N vs. PT), p = 2.78 × 10⁻⁷ (N vs. S1), p = 5.09 × 10⁻¹² (N vs. S2), p = 4.68 × 10⁻¹⁴ (N vs. S3), p = 1.62 × 10⁻¹² (N vs. S4)], hsa-miR-18a [p = 1.62 × 10⁻¹² (N vs. PT), p = 2.21 × 1003 (N vs. S1), p = 4.99 × 10⁻¹⁰, (N vs. S2) p = 8.34 × 10⁻¹¹ (N vs. S3), p < 1 × 10⁻¹² (N vs. S4)], hsa-miR-2355 [p < 1 × 10⁻¹² (N vs. PT), p = 5.02 × 10⁻⁴ (N vs. S1), p = 5.54 × 10⁻¹⁴ (N vs. S2), p = 9.67 × 10⁻¹² (N vs. S3), p = 1.11 × 10⁻¹⁶ (N vs. S4)], hsa-miR-944 [p = 1.62 × 10⁻¹² (N vs. PT), p = 1.75 × 10⁻⁵ (N vs. S1), p = 2.49 × 10⁻¹⁰ (N vs. S2), p = 9.92 × 10⁻¹⁰ (N vs. S3), p = 1 × 10⁻¹² (N vs. S4)]. N: normal; PT: primary tumor; S1: stage 1; S2: stage 2; S3: stage 3; and S4: stage 4.
Cancers 17 02169 g003
Figure 4. Kaplan–Meier survival analyses of downregulated miRNAs in all samples of combined and advanced stages of HNC from TCGA database over 200 months. A statistically significant log-rank p-value > 0.05 and Hazard Ratio (HR) < 1.0 were considered statistically significant factors.
Cancers 17 02169 g004
Figure 5. Differential expression of downregulated miRNAs in HNC samples from TCGA database. The expression of (A) hsa-miR-99a, (B) hsa-miR-29c, (C) hsa-let-7c, and (D) hsa-miR-6510 in the primary tumor of HNC is shown. Similarly, the differential expression of (E) hsa-miR-99a, (F) hsa-miR-29c, (G) hsa-let-7c, and (H) hsa-miR-6510 across the different stages of HNC is shown. The statistically significant p-values are hsa-miR-6510: p = 5.96 × 10⁻⁵ (N vs. PT), p = 4.86 × 10⁻⁶ (N vs. S1), p = 2.18 × 10⁻⁴ (N vs. S2), p = 1.81 × 10⁻⁴ (N vs. S3), and p = 6.00 × 10⁻⁷ (N vs. S4); hsa-let-7c p = 1.11 × 10⁻¹⁶ (N vs. PT), p = 3.65 × 10⁻¹² (N vs. S1), p = 1.65 × 10⁻¹² (N vs. S2), p = 2.70 × 10⁻¹² (N vs. S3), and p = 1.13 × 10⁻¹⁴ (N vs. S4); hsa-mir-29c: p = 1.59 × 10⁻⁹ (N vs. PT), p = 4.65 × 10⁻⁹ (N vs. S1), p = 1.47 × 10⁻⁷ (N vs. S2), p = 2.66 × 10⁻¹⁰ (N vs. S3), and p = 4.19 × 10⁻¹⁰ (N vs. S4); and hsa-mir-99a: p < 1 × 10⁻¹² (N vs. PT), p = 2.86 × 10⁻¹² (N vs. S1), p = 6.66 × 10⁻¹⁶ (N vs. S2), p = 2.57 × 10⁻¹¹ (N vs. S3), and p = 1.62 × 10⁻¹². N: normal; PT: primary tumor; S1: stage 1; S2: stage 2; S3: stage 3; and S4: stage 4.
Cancers 17 02169 g005
Figure 6. Protein–protein interaction (PPI) and hub gene analysis across immune-related genes in HNC. (A) PPI network of upregulated and (B) downregulated miRNA target genes involved in key immune evasion signaling pathways. (C) Visualization of protein–protein associations of hub genes belong to upregulated miRNAs. (D) Visualization of protein–protein associations of hub genes belong to downregulated miRNAs.
Cancers 17 02169 g006
Figure 7. The miRNA–mRNA co-expression analysis in HNC. (A) Co-expression between miR-181a-5p and its target genes BMP8A, IL2RB, IL10RB, INHBB, NEO1, PIK3R1, and PRKCB. (B) Co-expression between miR-2355-3p and its target genes BCL2, CXCL12, PRKCB, and TNFRSF13C. (C) Co-expression between let-7c-3p and its target genes ID4 and INHBA.
Cancers 17 02169 g007
Table 1. Median survival of HNC patients in cohorts with low and high expression of miRNAs.
miRNALow-Expression Cohort (Months)High-Expression Cohort (Months)
All Combined StagesAdvance StagesAll Combined StagesAdvance Stages
Overexpressed
hsa-miR-608777.3070.6737.7726.30
hsa-miR-193b65.7365.7350.1326.87
hsa-miR-18a69.4355.7042.9726.87
hsa-miR-235558.7365.7327.8722.67
hsa-miR-94472.2057.7346.6032.67
Underexpressed
hsa-miR-99a36.0318.2069.4353.03
hsa-miR-29c47.6727.9758.7357.73
hsa-let-7c40.0719.2365.7353.03
hsa-miR-651050.1326.8765.7365.73
Table 2. MiRNAs’ functional involvement in key immune signaling pathways in HNC.
Regulatory miRNAImmune Signaling PathwaysGene Countp-ValueGenes Involved
Upregulated miRNAs’ signaling pathways
miR-18a-3phsa04630:JAK-STAT signaling pathway330.023954886CDKN1A, CNTF, CSH1, PDGFB, PDGFA, PIK3R2, IL27, PIK3R1, SOCS3, CCND2, CCND1, AKT2, AKT3, AKT1, IL12RB2, PIAS4, IL11, IL10RB, IL10RA, STAT2, STAT3, LIF, CSHL1, EPOR, GH2, CLCF1, IL2RB, BCL2, GRB2, PTPN6, SOS1, BCL2L1, IFNAR1
hsa04660:T cell receptor signaling pathway300.001266955GSK3B, ITK, PIK3R2, PIK3R1, CD3D, PPP3R1, PPP2R1B, PPP2R5E, AKT2, GRAP2, AKT3, AKT1, MAPK1, PAK3, PAK4, VAV3, MAP2K1, PDPK1, MAPK14, MAPK13, VAV2, MAPK11, CD4, GRB2, KRAS, PTPN6, PDCD1, CD247, SOS1, CARD11
hsa04350:TGF-beta signaling pathway230.0279178BMPR2, SMAD3, TFRC, HDAC1, HFE, BMP8A, BMP8B, INHBB, INHBA, GDF6, SMAD5, ACVR2B, THSD4, GDF7, PPP2R1B, SP1, TFR2, MAPK1, NBL1, NEO1, SKP1, BMPR1A, FBN1
hsa05235:PD-L1 expression and PD-1 checkpoint pathway in cancer220.008014647MAP3K3, MAP2K1, CSNK2A2, STAT3, PTEN, PIK3R2, PIK3R1, MAPK14, CD3D, MAPK13, MAPK11, CD4, PPP3R1, AKT2, AKT3, AKT1, MAPK1, KRAS, PTPN6, PDCD1, CD247, MYD88
hsa04662:B cell receptor signaling pathway220.007028352VAV3, GSK3B, MAP2K1, CD72, PRKCB, CD81, INPPL1, LILRB1, PIK3R2, PIK3R1, VAV2, CD79B, PPP3R1, AKT2, AKT3, AKT1, MAPK1, GRB2, KRAS, PTPN6, SOS1, CARD11
miR-2335-3phsa04064:NF-kappa B signaling pathway250.014080501EDA, CCL4L1, TNFRSF13C, BCL10, EDA2R, IRAK1, PPP1R13L, TRIM25, PIAS4, EDA, RADD, UBE2I, SYK, CSNK2A1, PRKCB, IL1R1, TRAF1, TIRAP, NFKB1, CYLD, ZAP70, CXCL12, TRAF3, BCL2, MYD88, CARD11
Downregulated miRNAs’ signaling pathways
Let-7chsa04350:TGF-beta signaling pathway291.37E-04HDAC2, BMPR2, ZFYVE9, HFE, ACVR1B, THBS1, PPP2CA, ACVR1C, PPP2R1B, SIN3A, EP300, E2F4, NEO1, SKIL, CDKN2B, SMURF1, SMAD9, INHBA, RGMB, BMP7, ACVR2B, SKI, BMP2, RBL1, TFDP1, BAMBI, ID4, BMPR1B, BMPR1A
hsa04660:T cell receptor signaling pathway290.001149086GSK3B, ITK, CD3G, PIK3R1, PPP2CA, PPP3CA, MAPK9, PPP3CB, NRAS, PPP3R1, PPP2R1B, GRAP2, AKT3, CTLA4, FYN, MAP3K8, NFATC3, NFATC2, PPP2R5C, FOS, MAPK14, VAV2, PTPRC, TEC, PIK3CA, LCK, PPP2R2D, KRAS, SOS1
miR-6510hsa04668:TNF signaling pathway280.02621548ATF2, CSF1, RELA, CX3CL1, IKBKB, CREB3L3, AKT2, CREB3L1, CREB3L2, AKT1, MAPK1, IKBKG, MAP2K7, MAP2K3, EDN1, JAG1, RHBDF2, DAB2IP, TRAF2, TRAF1, MAPK13, CYLD, CXCL10, ITCH, FRMD8, TRAF3, IRF1, TAB1
hsa04064:NF-kappaB signaling pathway250.031971598TNFRSF13C, TNFRSF11A, RELA, IKBKB, IRAK1, PPP1R13L, PLCG2, TRIM25, IKBKG, ERC1, LYN, UBE2I, PRKCB, TRAF2, TRAF1, EDAR, CYLD, ZAP70, CXCL12, CD40LG, TRAF3, TRAF6, TAB1, TLR4, CARD11
Table 3. Identified hub genes with highest node degree for up- and downregulated miRNAs involved in immune evasion signaling pathways.
Gene NodeIdentifierNode DegreeBetweennessCloseness
Upregulated miRNAs hub genes in immune evasion
AKT19606.ENSP00000451828651151.23383.83333
STAT39606.ENSP0000026465760970.717081.50000
NFKB19606.ENSP0000022657458777.049679.25000
CD49606.ENSP00000011653531003.50277.66667
BCL29606.ENSP0000038118545473.087273.50000
PIK3R19606.ENSP0000042805643622.360273.00000
PTEN9606.ENSP0000036102143229.441971.58333
KRAS9606.ENSP0000025607839228.937269.83333
MAPK19606.ENSP0000021583239176.792669.75000
MYD889606.ENSP0000049832138224.458368.91667
SYK9606.ENSP0000036489838151.379469.08333
GRB29606.ENSP0000037634537130.790668.58333
GSK3B9606.ENSP0000032480635143.018767.58333
MAPK149606.ENSP0000022979534117.363066.91667
PTPN69606.ENSP0000039159232155.297366.08333
BCL2L19606.ENSP0000036523031140.804465.16667
CCND19606.ENSP000002275073145.6903565.41667
IL2RB9606.ENSP000002162233163.5194965.58333
ZAP709606.ENSP000002649723096.1302364.66667
Downregulated miRNAs hub genes in immune evasion
AKT19606.ENSP000004518286983.500001719.840
RELA9606.ENSP000003842734571.00000620.9879
TRAF69606.ENSP000004336234370.00000383.0736
GSK3B9606.ENSP000003248064269.33333395.8324
MAPK19606.ENSP000002158324068.50000324.4336
FOS9606.ENSP000003062453867.00000235.4975
LCK9606.ENSP000004777133766.00000164.1376
TLR49606.ENSP000003630893766.00000144.1318
FYN9606.ENSP000003466713666.33333248.3050
EP3009606.ENSP000002632533565.83333292.4875
KRAS9606.ENSP000002560783564.66667155.6484
LYN9606.ENSP000004289243564.83333139.4930
PIK3CA9606.ENSP000002639673566.16667498.1811
IKBKB9606.ENSP000004306843263.66667127.1822
PTPRC9606.ENSP000004113553163.50000139.3552
CTLA49606.ENSP000004971023062.5000093.57661
IKBKG9606.ENSP000004838253061.83333127.4694
Genes in bold are key immune signaling pathway genes.
Disclaimer/Publisher’s Note: The statements, opinions and data contained in all publications are solely those of the individual author(s) and contributor(s) and not of MDPI and/or the editor(s). MDPI and/or the editor(s) disclaim responsibility for any injury to people or property resulting from any ideas, methods, instructions or products referred to in the content.

