
Bridging the Gap Between Accuracy and Efficiency in AI-Based Breast Cancer Diagnosis from Histopathological Data
 , , and
Simple Summary
Abstract
1. Introduction
2. Related Works
3. Materials and Methods
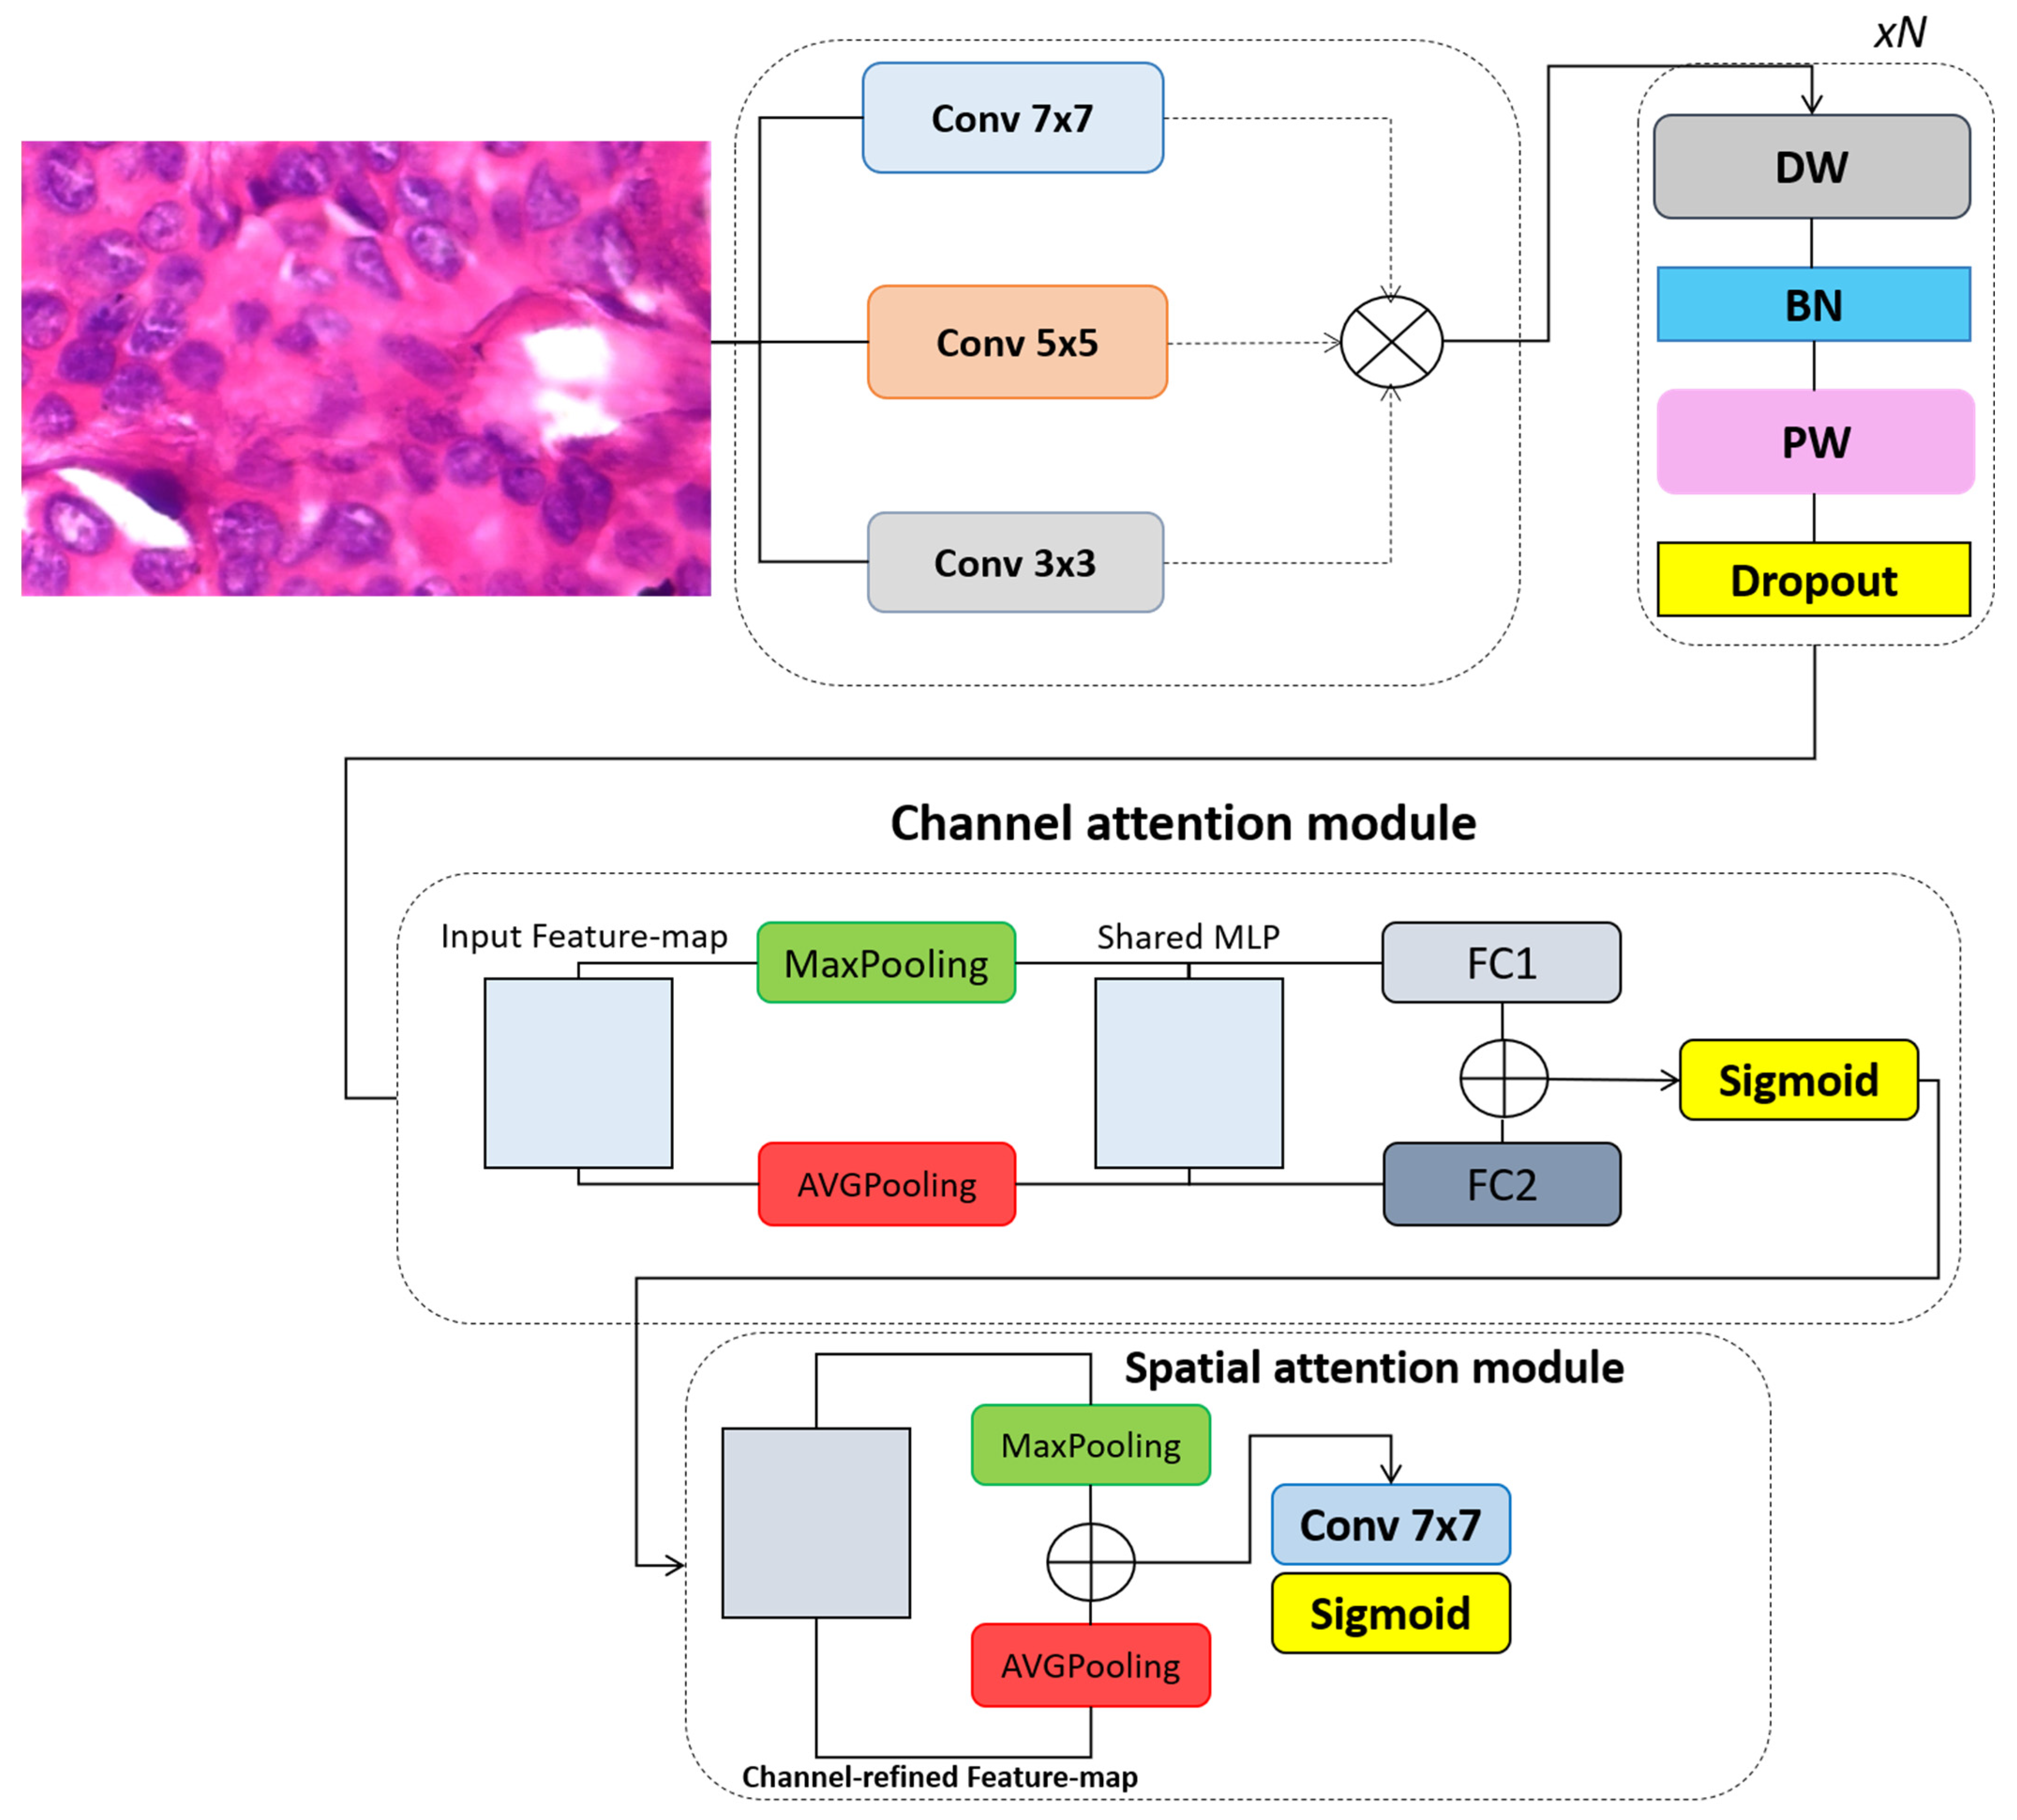
3.1. Convolutional Block Attention Module
3.2. The Proposed Model
4. Experiments and Results
4.1. The Dataset
4.2. Comparative Analysis of Segmentation Models
5. Conclusions
Author Contributions
Funding
Institutional Review Board Statement
Informed Consent Statement
Data Availability Statement
Conflicts of Interest
References
- García-Sancha, N.; Corchado-Cobos, R.; Pérez-Losada, J. Understanding Susceptibility to Breast Cancer: From Risk Factors to Prevention Strategies. Int. J. Mol. Sci. 2025, 26, 2993. [Google Scholar] [CrossRef] [PubMed]
- Qian, X.; Pei, J.; Han, C.; Liang, Z.; Zhang, G.; Chen, N.; Zheng, W.; Meng, F.; Yu, D.; Chen, Y.; et al. A multimodal machine learning model for the stratification of breast cancer risk. Nat. Biomed. Eng. 2025, 9, 356–370. [Google Scholar] [CrossRef]
- Jassam, I.F.; Mukhlif, A.A.; Nafea, A.A.; Tharthar, M.A.; Khudhair, A.I. A Review of Breast Cancer Histological Image Classification: Challenges and Limitations. Iraqi J. Comput. Sci. Math. 2025, 6, 1. [Google Scholar] [CrossRef]
- Gordon, A.B.; Sheeka, A.; Cleator, S.; Leff, D.; Lim, A. Tumour volume analysis applied to imaging and histological examinations in breast cancer. Eur. J. Surg. Oncol. 2025, 51, 109578. [Google Scholar] [CrossRef] [PubMed]
- Barkur, S.; Notingher, I.; Rakha, E. Intra-operative assessment of sentinel lymph nodes for breast cancer surgery: An update. Surg. Oncol. 2022, 40, 101678. [Google Scholar] [CrossRef]
- Challa, B.; Tahir, M.; Hu, Y.; Kellough, D.; Lujan, G.; Sun, S.; Parwani, A.V.; Li, Z. Artificial intelligence–aided diagnosis of breast cancer lymph node metastasis on histologic slides in a digital workflow. Mod. Pathol. 2023, 36, 100216. [Google Scholar] [CrossRef] [PubMed]
- Avazov, K.; Mirzakhalilov, S.; Umirzakova, S.; Abdusalomov, A.; Cho, Y.I. Dynamic Focus on Tumor Boundaries: A Lightweight U-Net for MRI Brain Tumor Segmentation. Bioengineering 2024, 11, 1302. [Google Scholar] [CrossRef]
- Amgad, M.; Hodge, J.M.; Elsebaie, M.A.; Bodelon, C.; Puvanesarajah, S.; Gutman, D.A.; Siziopikou, K.P.; Goldstein, J.A.; Gaudet, M.M.; Teras, L.R.; et al. A population-level digital histologic biomarker for enhanced prognosis of invasive breast cancer. Nat. Med. 2024, 30, 85–97. [Google Scholar] [CrossRef]
- Gonçalves, C.B.; Souza, J.R.; Fernandes, H. CNN architecture optimization using bio-inspired algorithms for breast cancer detection in infrared images. Comput. Biol. Med. 2022, 142, 105205. [Google Scholar] [CrossRef]
- Bouzar-Benlabiod, L.; Harrar, K.; Yamoun, L.; Khodja, M.Y.; Akhloufi, M.A. A novel breast cancer detection architecture based on a CNN-CBR system for mammogram classification. Comput. Biol. Med. 2023, 163, 107133. [Google Scholar] [CrossRef]
- Jafari, Z.; Karami, E. Breast cancer detection in mammography images: A CNN-based approach with feature selection. Information 2023, 14, 410. [Google Scholar] [CrossRef]
- Wahed, M.A.; Alqaraleh, M.; Alzboon, M.S.; Al-Batah, M.S. Evaluating AI and Machine Learning Models in Breast Cancer Detection: A Review of Convolutional Neural Networks (CNN) and Global Research Trends. LatIA 2025, 3, 117. [Google Scholar] [CrossRef]
- Spanhol, F.A.; Oliveira, L.S.; Petitjean, C.; Heutte, L. A dataset for breast cancer histopathological image classification. IEEE Trans. Biomed. Eng. 2015, 63, 1455–1462. [Google Scholar] [CrossRef]
- Kukadiya, H.; Meva, D. An Experimental Investigation of Classifying Breast Cancer using Different CNN Models. Int. J. Comput. Appl. 2025, 975, 8887. [Google Scholar] [CrossRef]
- Chaieb, M.; Azzouz, M.; Refifa, M.B.; Fraj, M. Deep learning-driven prediction in healthcare systems: Applying advanced CNNs for enhanced breast cancer detection. Comput. Biol. Med. 2025, 189, 109858. [Google Scholar] [CrossRef]
- Joshi, V.M.; Dandavate, P.P.; Ramamurthy, R.; Mirajkar, R.; Thune, N.N.; Shinde, G.R. Empower BreastNet: Breast cancer detection with transfer learning VGG Net-19. Indones. J. Electr. Eng. Comput. Sci. 2025, 37, 1927–1935. [Google Scholar] [CrossRef]
- Patil, R.A.; Dixit, V.V. Detection and classification of mammogram using ResNet-50. Multimed. Tools Appl. 2025, 1–24. [Google Scholar] [CrossRef]
- Kwatra, C.V.; Kaur, H.; Mangla, M.; Singh, A.; Tambe, S.N.; Potharaju, S. Early Detection of Gynecological Malignancies Using Ensemble Deep Learning Models: ResNet50 and Inception V3. Inform. Med. Unlocked 2025, 53, 101620. [Google Scholar] [CrossRef]
- Voncilă, M.L.; Tarbă, N.; Oblesniuc, Ș.; Boiangiu, C.A.; Nimineț, V. Classification of Breast Cancer Tumors from Histopathological Images through a Modified ResNet-50 Architecture. BRAIN. Broad Res. Artif. Intell. Neurosci. 2024, 15, 197–207. [Google Scholar] [CrossRef]
- Nissar, I.; Alam, S.; Masood, S. Mod-ViT: A Vision Transformer-Based Framework for Breast Cancer Detection from Multiple Imaging Modalities. In Proceedings of the 2025 3rd International Conference on Device Intelligence, Computing and Communication Technologies (DICCT), Dehradun, India, 21–22 March 2025; IEEE: New York, NY, USA, 2025; pp. 541–546. [Google Scholar]
- Anari, S.; Sadeghi, S.; Sheikhi, G.; Ranjbarzadeh, R.; Bendechache, M. Explainable attention based breast tumor segmentation using a combination of UNet, ResNet, DenseNet, and EfficientNet models. Sci. Rep. 2025, 15, 1027. [Google Scholar] [CrossRef]
- Jenefa, A.; Lincy, A.; Naveen, V.E. A framework for breast cancer diagnostics based on MobileNetV2 and LSTM-based deep learning. In Computational Intelligence and Modelling Techniques for Disease Detection in Mammogram Images; Academic Press: Cambridge, MA, USA, 2024; pp. 91–110. [Google Scholar]
- Bilal, A.; Alkhathlan, A.; Kateb, F.A.; Tahir, A.; Shafiq, M.; Long, H. A quantum-optimized approach for breast cancer detection using SqueezeNet-SVM. Sci. Rep. 2025, 15, 3254. [Google Scholar] [CrossRef]
- Ma, X.; Sun, L.; Gao, J.; Dong, Y. LMCNet: A lightweight and efficient model for multi-classification of breast cancer images. Signal Image Video Process. 2025, 19, 175. [Google Scholar] [CrossRef]
- Toa, C.K.; Elsayed, M.; Sim, K.S. Deep residual learning with attention mechanism for breast cancer classification. Soft Comput. 2024, 28, 9025–9035. [Google Scholar] [CrossRef]
- Woo, S.; Park, J.; Lee, J.Y.; Kweon, I.S. Cbam: Convolutional block attention module. In Proceedings of the 2018 European Conference on Computer Vision (ECCV), Munich, Germany, 8–14 September 2018; pp. 3–19. [Google Scholar]
- Alashban, Y. Breast cancer detection and classification with digital breast tomosynthesis: A two-stage deep learning approach. Diagn. Interv. Radiol. 2025, 31, 206. [Google Scholar] [CrossRef] [PubMed]
- Omega Boro, L.; Nandi, G. CBAM-RIUnet: Breast Tumor Segmentation with Enhanced Breast Ultrasound and Test-Time Augmentation. Ultrason. Imaging 2025, 47, 24–36. [Google Scholar] [CrossRef]
- Sureshkumar, V.; Prasad, R.S.N.; Balasubramaniam, S.; Jagannathan, D.; Daniel, J.; Dhanasekaran, S. Breast cancer detection and analytics using hybrid cnn and extreme learning machine. J. Pers. Med. 2024, 14, 792. [Google Scholar] [CrossRef]
- Maurya, R.; Pandey, N.N.; Mahapatra, S. BMEA-ViT: Breast Cancer Classification using Lightweight Customised Vision Transformer Architecture with Multi-Head External Attention. IEEE Access 2025, 13, 44317–44329. [Google Scholar] [CrossRef]
- Abd Elaziz, M.; Dahou, A.; Aseeri, A.O.; Ewees, A.A.; Al-Qaness, M.A.; Ibrahim, R.A. Cross vision transformer with enhanced Growth Optimizer for breast cancer detection in IoMT environment. Comput. Biol. Chem. 2024, 111, 108110. [Google Scholar] [CrossRef]
- Hüseyin, Ü.; Firat, H.; Atila, O.; Şengür, A. Swin transformer-based fork architecture for automated breast tumor classification. Expert Syst. Appl. 2024, 256, 125009. [Google Scholar]
- Parshionikar, S.; Bhattacharyya, D. An enhanced multi-scale deep convolutional orchard capsule neural network for multi-modal breast cancer detection. Healthc. Anal. 2024, 5, 100298. [Google Scholar] [CrossRef]
- Rossi, M.; Radisky, D.C. Multiplex digital spatial profiling in breast cancer research: State-of-the-art technologies and applications across the translational science spectrum. Cancers 2024, 16, 1615. [Google Scholar] [CrossRef] [PubMed]

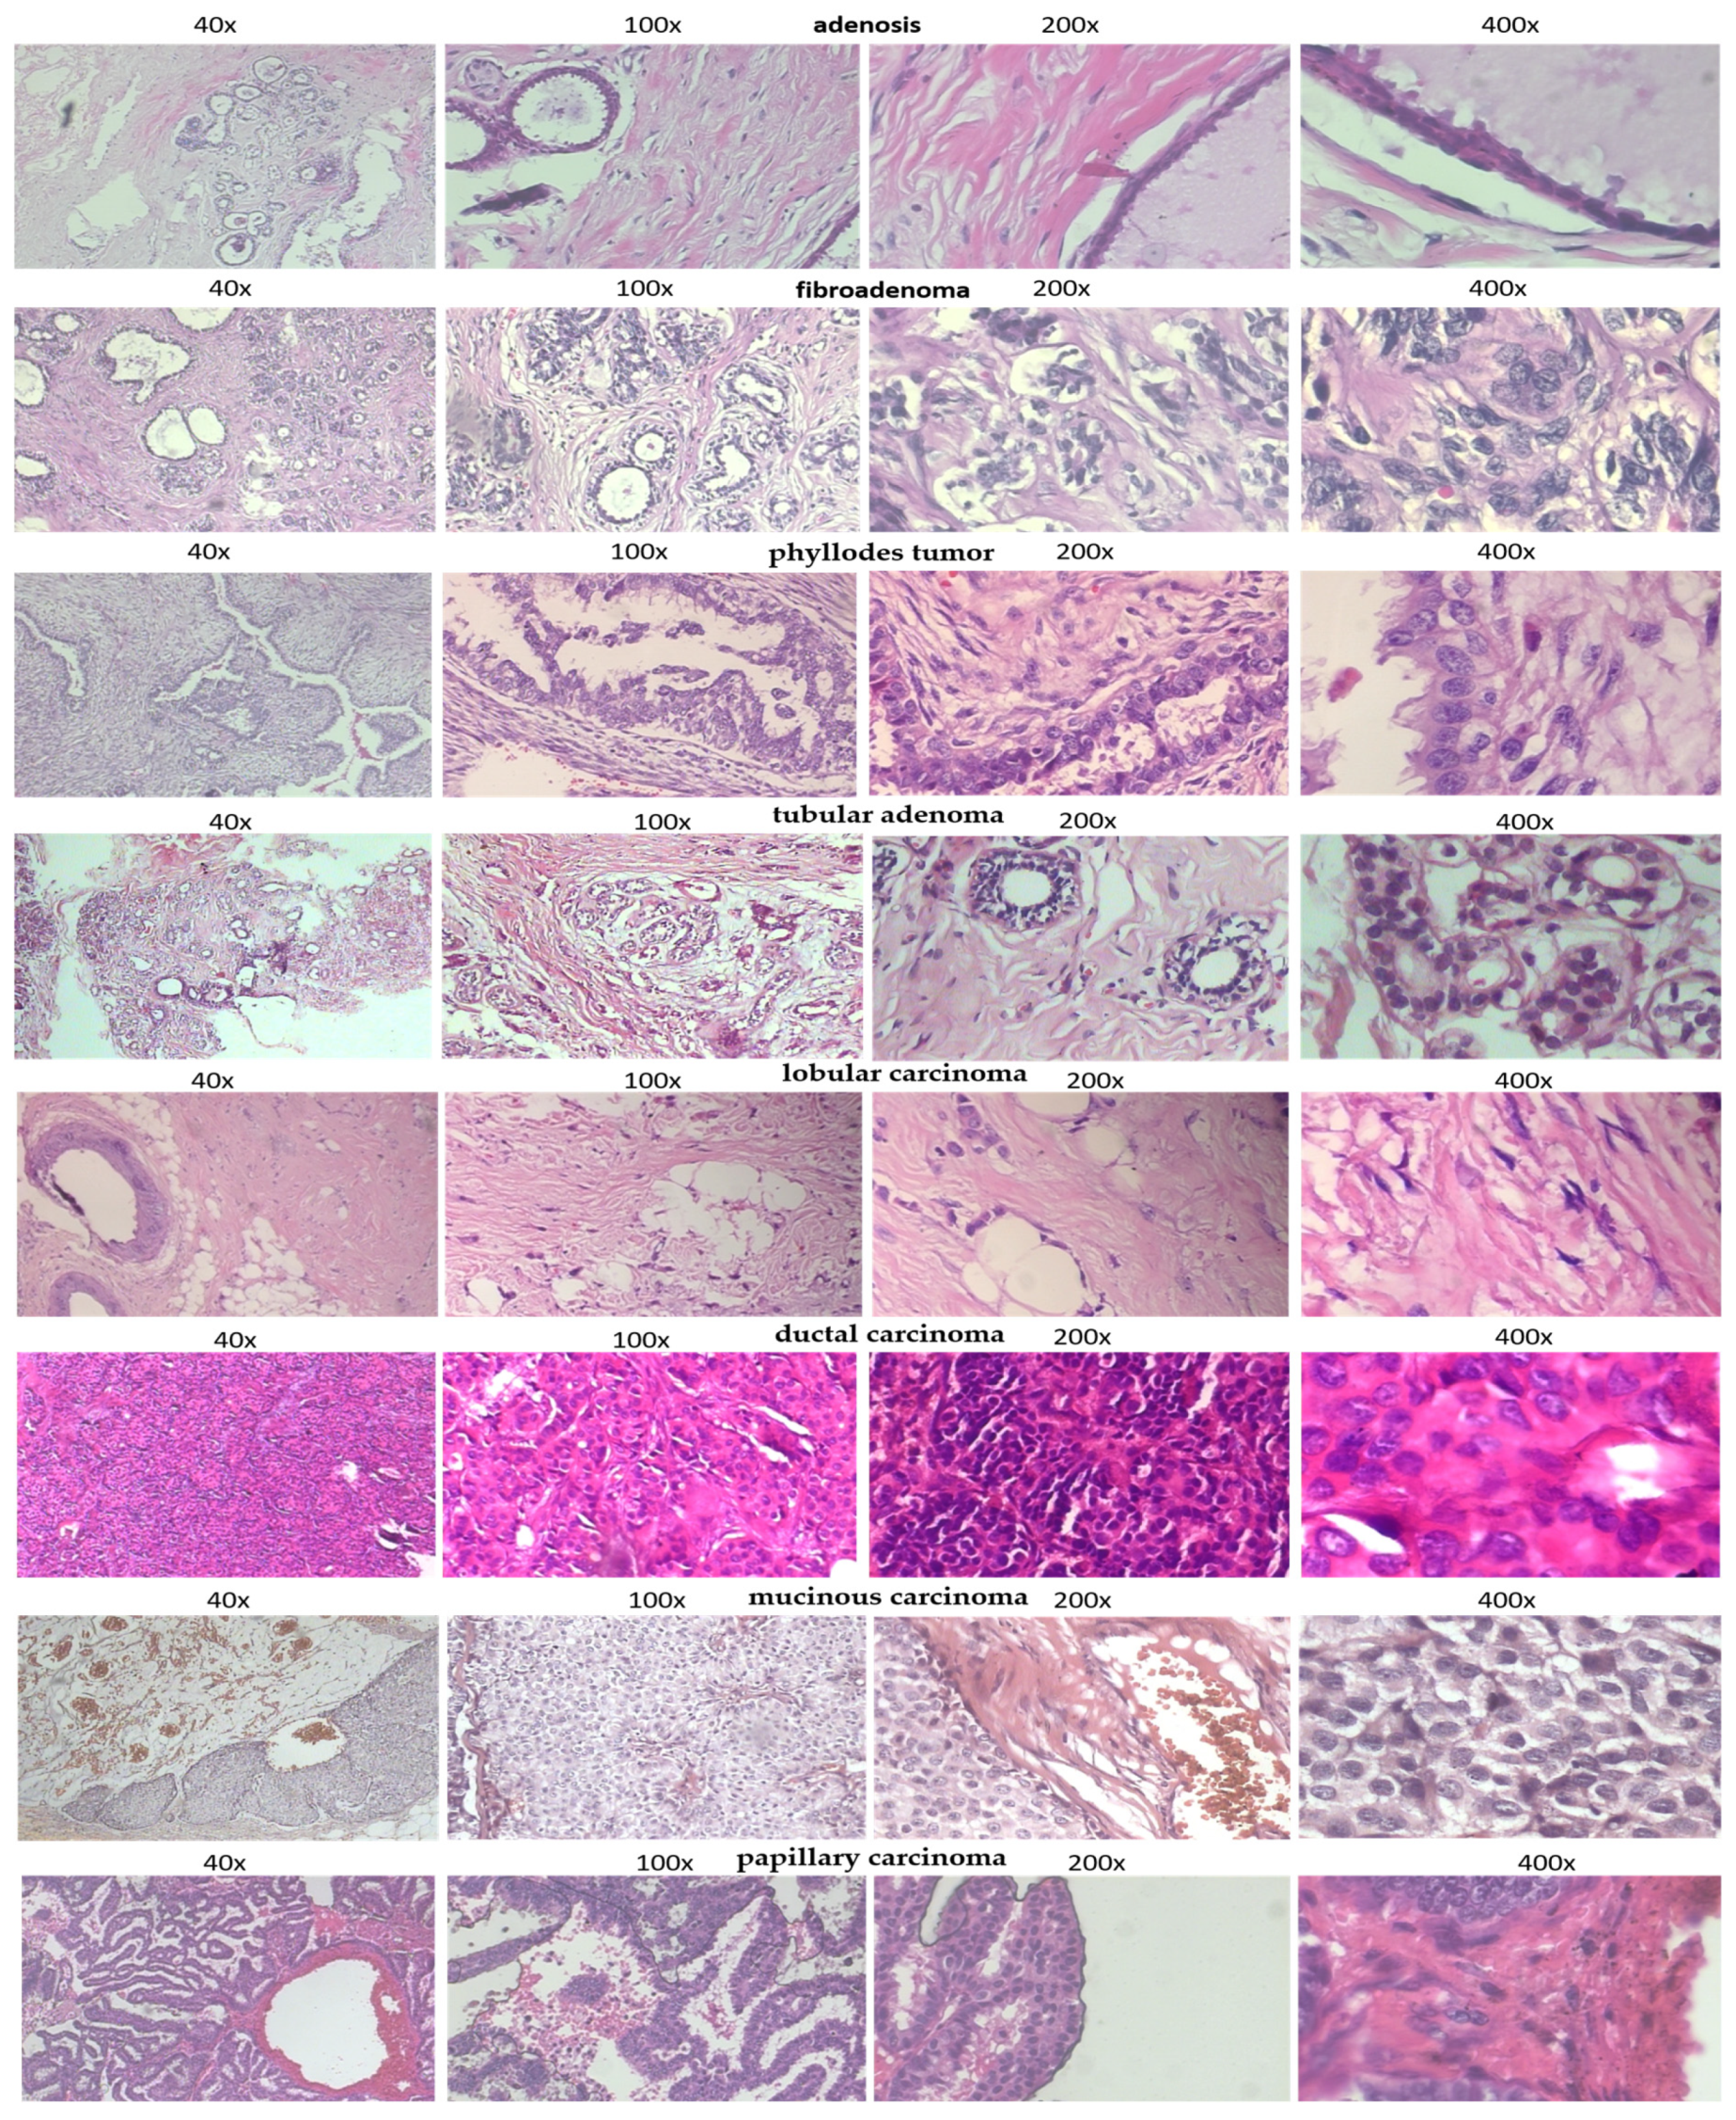
| Benign: | |
| adenosis | Overgrowth of glands in the breast lobules |
| fibroadenoma | Common benign breast tumor made of glandular and fibrous tissues |
| phyllodes tumor | Rare fibroepithelial tumor, usually benign |
| tubular adenoma | Rare, benign glandular tumor |
| Malignant: | |
| ductal carcinoma | Most common invasive breast cancer, begins in ducts |
| lobular carcinoma | Starts in the lobules (milk-producing glands) |
| mucinous carcinoma | Tumor made mostly of mucus-producing cancer cells |
| papillary carcinoma | Rare subtype, finger-like projections under microscope |
| Model Variant | Accuracy (%) | F1 Score | AUC |
|---|---|---|---|
| CellSage w/o CBAM | 92.1 | 0.90 | 0.94 |
| CellSage w/o Multi-Scale Conv | 91.4 | 0.89 | 0.93 |
| CellSage Full (Ours) | 94.8 | 0.93 | 0.96 |
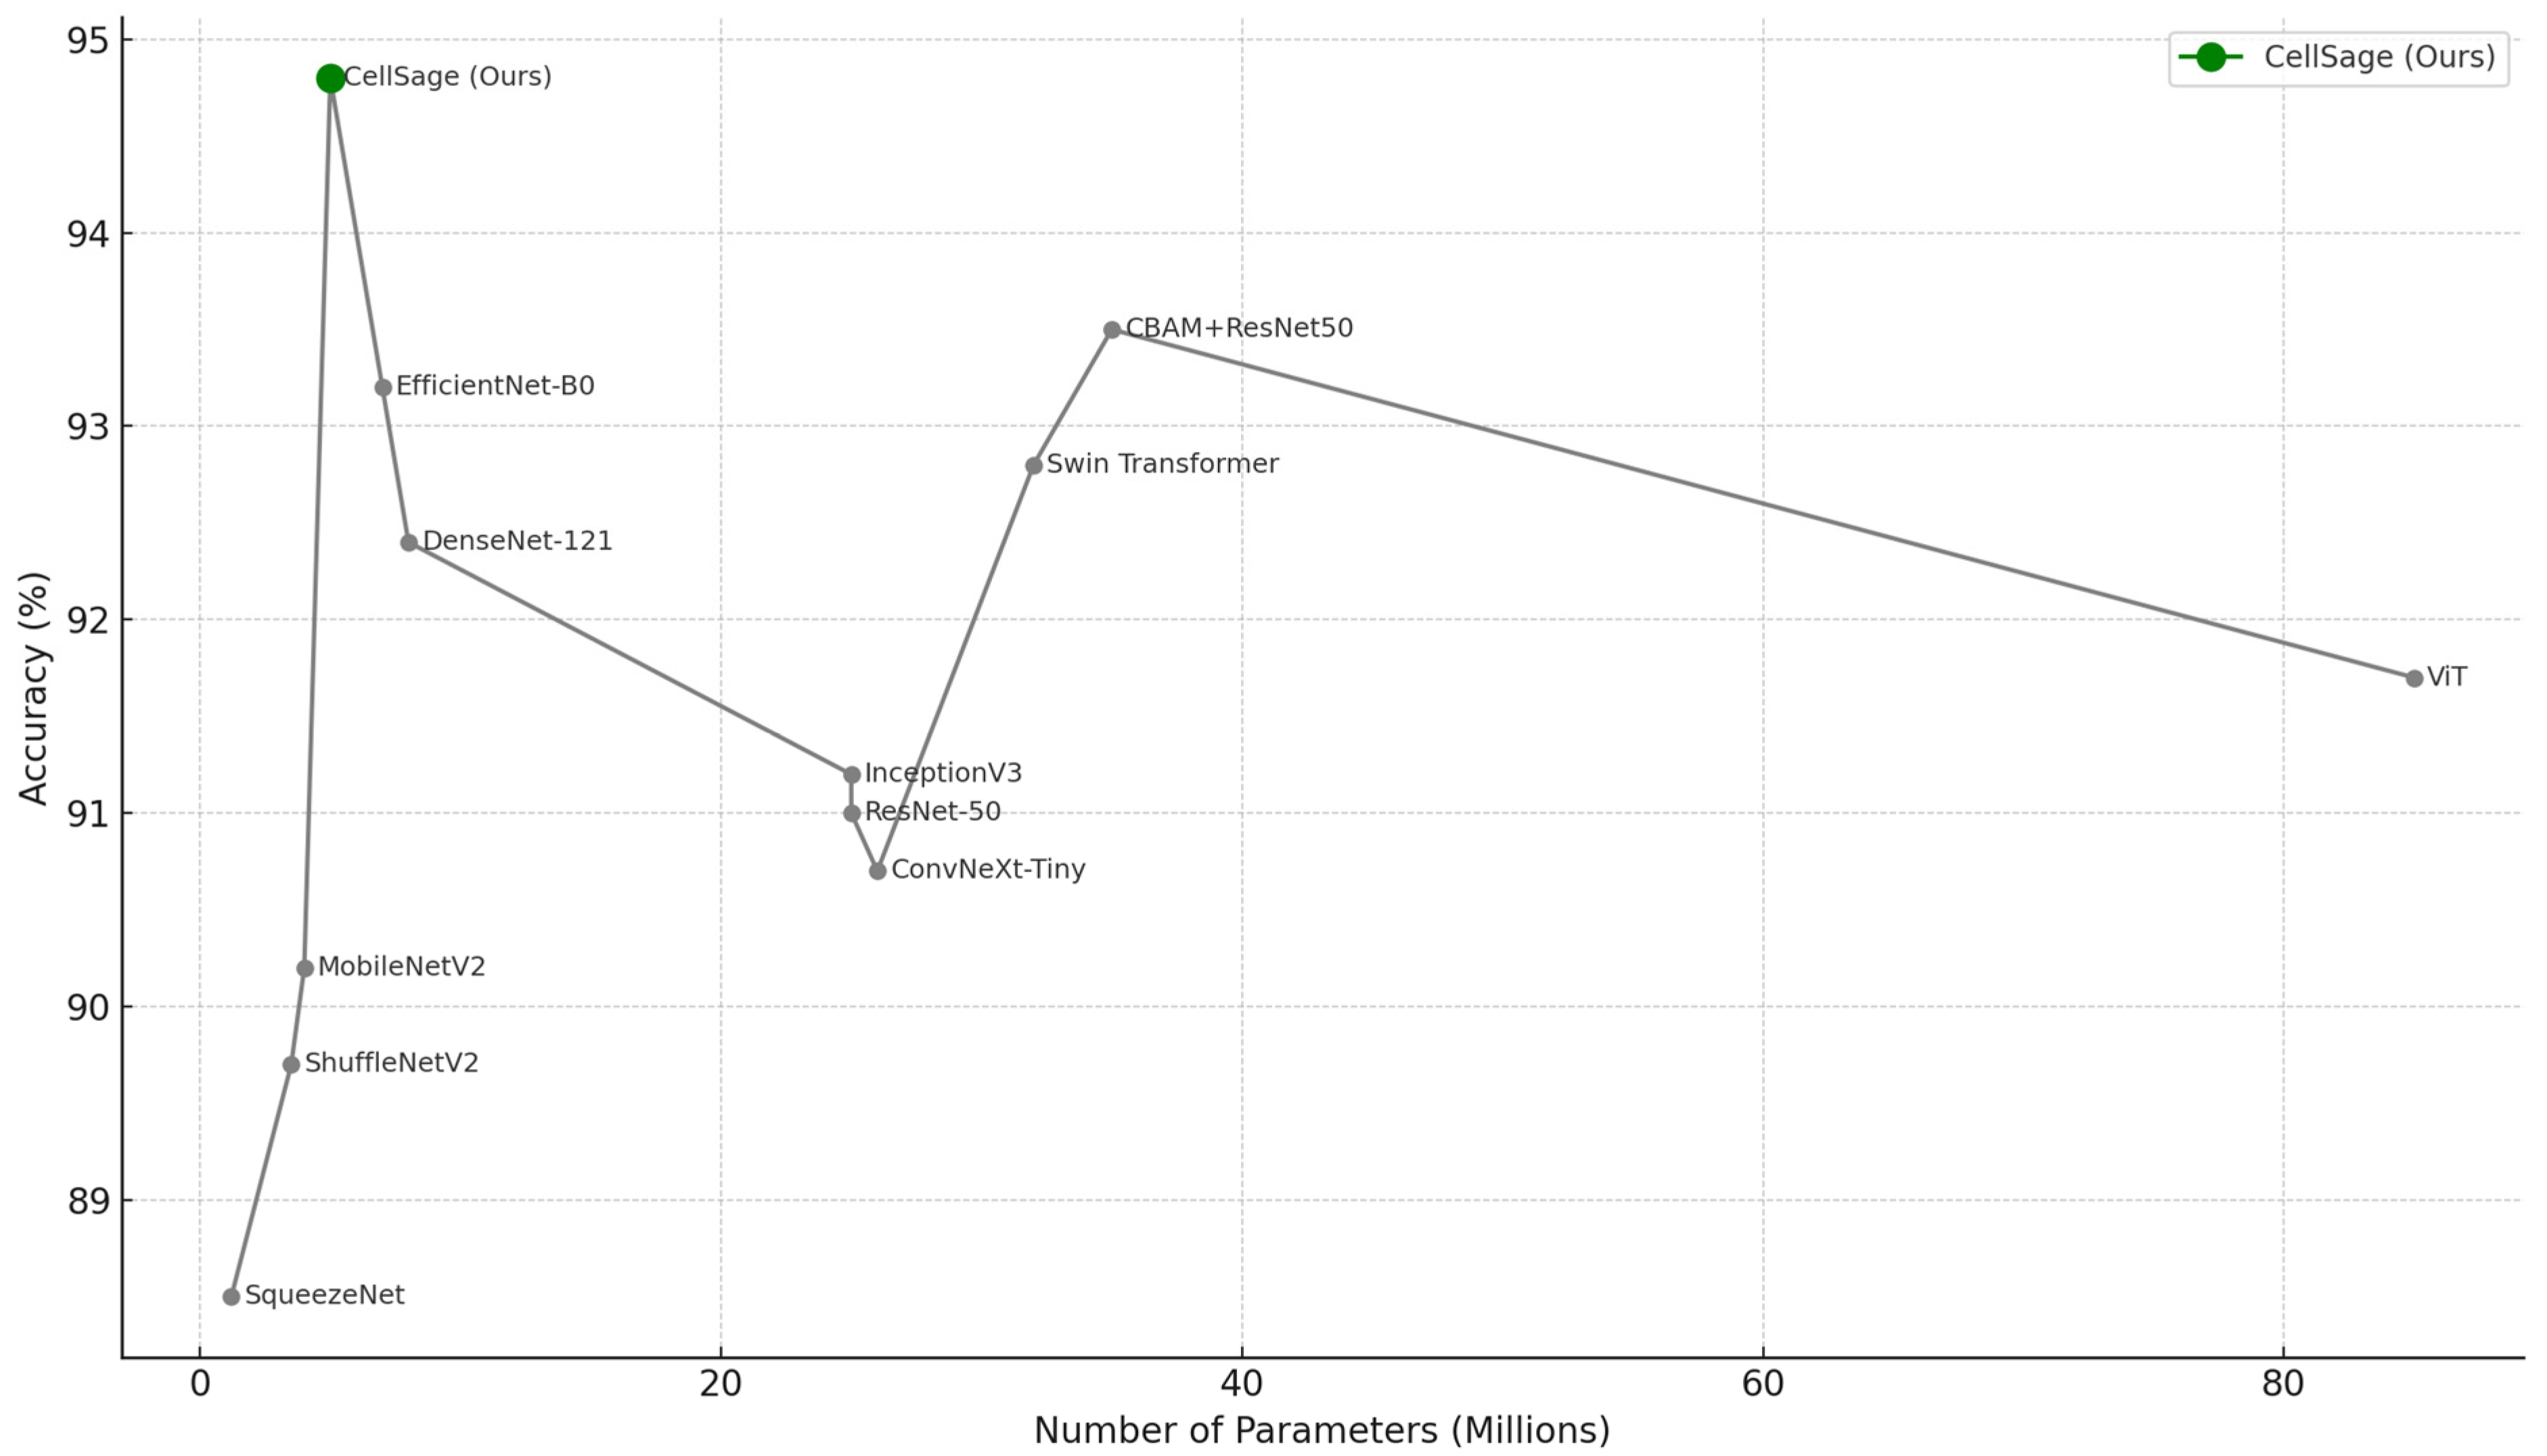
| Model | Accuracy (%) | F1 Score | AUC | Params (M) | FLOPs (G) | Inference Time (ms) | Training Time/Epoch (s) |
|---|---|---|---|---|---|---|---|
| ResNet-50 | 91.2 | 0.89 | 0.93 | 23.5 | 4.1 | 15.8 | 36 |
| CBAM + ResNet-50 | 93.7 | 0.92 | 0.95 | 24.1 | 4.3 | 18.2 | 39 |
| DenseNet-121 | 92.4 | 0.91 | 0.94 | 7.9 | 2.9 | 13.1 | 33 |
| MobileNetV2 | 90.1 | 0.88 | 0.91 | 3.4 | 0.31 | 9.3 | 17 |
| EfficientNet-B0 | 93.3 | 0.92 | 0.95 | 5.3 | 0.39 | 10.2 | 22 |
| ViT | 91.8 | 0.89 | 0.92 | 86.0 | 16.8 | 39.5 | 65 |
| InceptionV3 | 91.5 | 0.90 | 0.94 | 23.9 | 5.7 | 16.4 | 38 |
| ShuffleNetV2 | 89.7 | 0.87 | 0.90 | 2.3 | 0.28 | 8.8 | 16 |
| SqueezeNet | 88.5 | 0.85 | 0.89 | 1.2 | 0.26 | 8.1 | 15 |
| ConvNeXt-Tiny | 90.7 | 0.89 | 0.91 | 24.6 | 4.8 | 20.1 | 40 |
| Swin Transformer | 92.9 | 0.91 | 0.94 | 28.0 | 6.2 | 22.7 | 45 |
| CellSage (Ours) | 94.8 | 0.93 | 0.96 | 3.8 | 0.49 | 8.5 | 21 |
Disclaimer/Publisher’s Note: The statements, opinions and data contained in all publications are solely those of the individual author(s) and contributor(s) and not of MDPI and/or the editor(s). MDPI and/or the editor(s) disclaim responsibility for any injury to people or property resulting from any ideas, methods, instructions or products referred to in the content. |
© 2025 by the authors. Licensee MDPI, Basel, Switzerland. This article is an open access article distributed under the terms and conditions of the Creative Commons Attribution (CC BY) license (https://creativecommons.org/licenses/by/4.0/).
Share and Cite
Avazov, K.; Umirzakova, S.; Abdusalomov, A.; Temirov, Z.; Nasimov, R.; Buriboev, A.; Safarova Ulmasovna, L.; Lee, C.; Jeon, H.S. Bridging the Gap Between Accuracy and Efficiency in AI-Based Breast Cancer Diagnosis from Histopathological Data. Cancers 2025, 17, 2159. https://doi.org/10.3390/cancers17132159
Avazov K, Umirzakova S, Abdusalomov A, Temirov Z, Nasimov R, Buriboev A, Safarova Ulmasovna L, Lee C, Jeon HS. Bridging the Gap Between Accuracy and Efficiency in AI-Based Breast Cancer Diagnosis from Histopathological Data. Cancers. 2025; 17(13):2159. https://doi.org/10.3390/cancers17132159
Chicago/Turabian StyleAvazov, Kuldashbay, Sabina Umirzakova, Akmalbek Abdusalomov, Zavqiddin Temirov, Rashid Nasimov, Abror Buriboev, Lola Safarova Ulmasovna, Cheolwon Lee, and Heung Seok Jeon. 2025. "Bridging the Gap Between Accuracy and Efficiency in AI-Based Breast Cancer Diagnosis from Histopathological Data" Cancers 17, no. 13: 2159. https://doi.org/10.3390/cancers17132159
APA StyleAvazov, K., Umirzakova, S., Abdusalomov, A., Temirov, Z., Nasimov, R., Buriboev, A., Safarova Ulmasovna, L., Lee, C., & Jeon, H. S. (2025). Bridging the Gap Between Accuracy and Efficiency in AI-Based Breast Cancer Diagnosis from Histopathological Data. Cancers, 17(13), 2159. https://doi.org/10.3390/cancers17132159