
Genome-Wide cfDNA Methylation Profiling Reveals Robust Hypermethylation Signatures in Ovarian Cancer
 ,
,  , , ,
, , ,  and
and
Simple Summary
Abstract
1. Introduction
2. Methods
2.1. Patient Cohort and Sample Collection
2.2. cfDNA Extraction
2.3. cfDNA Quality Control
2.4. cfMeDIP-Seq
2.5. cfMeDIP-Seq Data Processing
3. Data Analysis
3.1. Filtering Process
3.2. Singular Value Decomposition Analysis
3.3. K-Means Clustering Analysis
3.4. Differentially Methylated Region Analysis
3.5. Annotation of DMRs
3.6. Permutation Analysis and Genomic Feature Enrichment
3.7. Heatmap
3.8. Pathway and Gene Ontology Enrichment Analysis
3.9. Statistical Analysis
4. Results
5. Discussion
6. Conclusions
Supplementary Materials
Author Contributions
Funding
Institutional Review Board Statement
Informed Consent Statement
Data Availability Statement
Acknowledgments
Conflicts of Interest
Abbreviations
| ANOVA | Analysis of variance |
| PBLs | Peripheral blood leukocytes |
| BMI | Body mass index |
| bp | Base pair |
| CA125 | Cancer antigen 125 |
| cfDNA | Cell-free DNA |
| cfMeDIP-seq | Cell-free methylated DNA immunoprecipitation sequencing |
| CpG | Cytosine–phosphate–guanine |
| ctDNA | Circulating tumor DNA |
| ddPCR | Droplet digital PCR |
| DMR | Differentially methylated region |
| FIGO | Federation of Gynecology and Obstetrics |
| GO | Gene ontology |
| HGSC | High-grade serous carcinoma |
| HMW | High molecular weight |
| KEGG | Kyoto Encyclopedia of Genes and Genomes |
| LINEs | Long interspersed nuclear elements |
| LTRs | Long terminal repeat elements |
| NA | Not applicable |
| OC | Ovarian cancer |
| RMI | Risk of malignancy index |
| SINEs | Short interspersed nuclear elements |
| SVD | Singular value decomposition |
| UMIs | Unique molecular identifiers |
| UTR | Untranslated region |
| VST | Variance-stabilizing transformation |
References
- Lumish, M.A.; Kohn, E.C.; Tew, W.P. Top advances of the year: Ovarian cancer. Cancer 2024, 130, 837–845. [Google Scholar] [CrossRef] [PubMed]
- Reid, F.; Bajwa, A. The World Ovarian Cancer Coalition Atlas 2023. Available online: https://worldovariancancercoalition.org/wp-content/uploads/2023/04/World-Ovarian-Cancer-Coalition-Atlas-2023-FINAL.pdf (accessed on 21 May 2025).
- Bankhead, C.R.; Kehoe, S.T.; Austoker, J. Symptoms associated with diagnosis of ovarian cancer: A systematic review. BJOG Int. J. Obstet. Gynaecol. 2005, 112, 857–865. [Google Scholar] [CrossRef]
- Maringe, C.; Walters, S.; Butler, J.; Coleman, M.P.; Hacker, N.; Hanna, L.; Mosgaard, B.J.; Nordin, A.; Rosen, B.; Engholm, G.; et al. Stage at diagnosis and ovarian cancer survival: Evidence from the International Cancer Benchmarking Partnership. Gynecol. Oncol. 2012, 127, 75–82. [Google Scholar] [CrossRef] [PubMed]
- American Cancer Society. Cancer Facts & Figures. 2025. Available online: https://cancerstatisticscenter.cancer.org/ (accessed on 20 March 2025).
- Bell, R.; Petticrew, M.; Luengo, S.; Sheldon, T.A. Screening for ovarian cancer: A systematic review. Health Technol. Assess. 1998, 2, 1–4. [Google Scholar] [CrossRef]
- Buys, S.S.; Partridge, E.; Black, A.; Johnson, C.C.; Lamerato, L.; Isaacs, C.; Reding, D.J.; Greenlee, R.T.; Yokochi, L.A.; Kessel, B.; et al. Effect of screening on ovarian cancer mortality: The Prostate, Lung, Colorectal and Ovarian (PLCO) cancer screening randomized controlled trial. J. Am. Med. Assoc. 2011, 305, 2295–2302. [Google Scholar] [CrossRef]
- Ibrahim, J.; Peeters, M.; Van Camp, G.; de Beeck, K.O. Methylation biomarkers for early cancer detection and diagnosis: Current and future perspectives. Eur. J. Cancer 2023, 178, 91–113. [Google Scholar] [CrossRef]
- Terp, S.K.; Stoico, M.P.; Dybkær, K.; Pedersen, I.S. Early diagnosis of ovarian cancer based on methylation profiles in peripheral blood cell-free DNA: A systematic review. Clin. Epigenetics 2023, 15, 24. [Google Scholar] [CrossRef]
- Paluszczak, J.; Baer-Dubowska, W. Epigenetic diagnostics of cancer—The application of DNA methylation markers. J. Appl. Genet. 2006, 47, 365–375. [Google Scholar] [CrossRef] [PubMed]
- Hanahan, D. Hallmarks of Cancer: New Dimensions. Cancer Discov. 2022, 12, 31–46. [Google Scholar] [CrossRef]
- Nishiyama, A.; Nakanishi, M. Navigating the DNA methylation landscape of cancer. Trends Genet. 2021, 37, 1012–1027. [Google Scholar] [CrossRef]
- Lu, H.; Liu, Y.; Wang, J.; Fu, S.; Wang, L.; Huang, C.; Li, J.; Xie, L.; Wang, D.; Li, D.; et al. Detection of ovarian cancer using plasma cell-free DNA methylomes. Clin. Epigenetics 2022, 14, 74. [Google Scholar] [CrossRef] [PubMed]
- Liu, M.C.; Oxnard, G.R.; Klein, E.A.; Swanton, C.; Seiden, M.V.; CCGA Consortium. Sensitive and specific multi-cancer detection and localization using methylation signatures in cell-free DNA. Ann. Oncol. 2020, 31, 745–759. [Google Scholar] [CrossRef]
- Shen, S.Y.; Singhania, R.; Fehringer, G.; Chakravarthy, A.; Roehrl, M.H.A.; Chadwick, D.; Zuzarte, P.C.; Borgida, A.; Wang, T.T.; Li, T.; et al. Sensitive tumour detection and classification using plasma cell-free DNA methylomes. Nature 2018, 563, 579–583. [Google Scholar] [CrossRef]
- Grisolia, P.; Tufano, R.; Iannarone, C.; De Falco, A.; Carlino, F.; Graziano, C.; Addeo, R.; Scrima, M.; Caraglia, F.; Ceccarelli, A.; et al. Differential methylation of circulating free DNA assessed through cfMeDiP as a new tool for breast cancer diagnosis and detection of BRCA1/2 mutation. J. Transl. Med. 2024, 22, 938. [Google Scholar] [CrossRef]
- Nuzzo, P.V.; Berchuck, J.E.; Korthauer, K.; Spisak, S.; Nassar, A.H.; Abou Alaiwi, S.; Chakravarthy, A.; Shen, S.Y.; Bakouny, Z.; Boccardo, F.; et al. Detection of renal cell carcinoma using plasma and urine cell-free DNA methylomes. Nat. Med. 2020, 26, 1041–1043. [Google Scholar] [CrossRef]
- Qi, J.; Hong, B.; Wang, S.; Wang, J.; Fang, J.; Sun, R.; Nie, J.; Wang, H. Plasma cell-free DNA methylome-based liquid biopsy for accurate gastric cancer detection. Cancer Sci. 2024, 115, 3426–3438. [Google Scholar] [CrossRef]
- Terp, S.K.; Pedersen, I.S.; Stoico, M.P. Extraction of Cell-Free DNA: Evaluation of Efficiency, Quantity, and Quality. J. Mol. Diagn. 2024, 26, 310–319. [Google Scholar] [CrossRef] [PubMed]
- Ito, T.; Kawashima, Y.; Fujikawa, T.; Honda, K.; Makabe, A.; Kitamura, K.; Tsutsumi, T. Rapid screening of copy number variations in STRC by droplet digital PCR in patients with mild-to-moderate hearing loss. Hum. Genome Var. 2019, 6, 41. [Google Scholar] [CrossRef] [PubMed]
- Pallisgaard, N.; Spindler, K.L.G.; Andersen, R.F.; Brandslund, I.; Jakobsen, A. Controls to validate plasma samples for cell free DNA quantification. Clin. Chim. Acta 2015, 446, 141–146. [Google Scholar] [CrossRef]
- Lefèvre, A.C.; Pallisgaard, N.; Kronborg, C.; Wind, K.L.; Krag, S.R.P.; Spindler, K.L.G. The clinical value of measuring circulating hpv dna during chemo-radiotherapy in squamous cell carcinoma of the anus. Cancers 2021, 13, 2451. [Google Scholar] [CrossRef]
- Shen, S.Y.; Burgener, J.M.; Bratman, S.V.; De Carvalho, D.D. Preparation of cfMeDIP-seq libraries for methylome profiling of plasma cell-free DNA. Nat. Protoc. 2019, 14, 2749–2780. [Google Scholar] [CrossRef] [PubMed]
- Zeng, Y.; Ye, W.; Stutheit-Zhao, E.Y.; Han, M.; Bratman, S.V.; Pugh, T.J.; He, H.H. MEDIPIPE: An automated and comprehensive pipeline for cfMeDIP-seq data quality control and analysis. Bioinformatics 2023, 39, btad423. [Google Scholar] [CrossRef] [PubMed]
- Lienhard, M.; Grimm, C.; Morkel, M.; Herwig, R.; Chavez, L. MEDIPS: Genome-wide differential coverage analysis of sequencing data derived from DNA enrichment experiments. Bioinformatics 2014, 30, 284–286. [Google Scholar] [CrossRef] [PubMed]
- Birney, E. ENCODE Portal-ENCSR636HFF. 2020. Available online: https://www.encodeproject.org/ (accessed on 20 April 2025).
- Amemiya, H.M.; Kundaje, A.; Boyle, A.P. The ENCODE Blacklist: Identification of Problematic Regions of the Genome. Sci. Rep. 2019, 9, 9354. [Google Scholar] [CrossRef]
- Ul Haq, S.; Schmid, S.; Aparnathi, M.K.; Hueniken, K.; Zhan, L.J.; Sacdalan, D.; Li, J.J.N.; Meti, N.; Patel, D.; Cheng, D.; et al. Cell-free DNA methylation-defined prognostic subgroups in small-cell lung cancer identified by leukocyte methylation subtraction. Iscience 2022, 25, 105487. [Google Scholar] [CrossRef]
- Leek, J.T.; Scharpf, R.B.; Bravo, H.C.; Simcha, D.; Langmead, B.; Johnson, W.E.; Geman, D.; Baggerly, K.; Irizarry, R.A. Tackling the widespread and critical impact of batch effects in high-throughput data. Nat. Rev. Genet. 2010, 11, 733–739. [Google Scholar] [CrossRef]
- Reese, S.E.; Archer, K.J.; Therneau, T.M.; Atkinson, E.J.; Vachon, C.M.; de Andrade, M.; Kocher, J.P.; Eckel-Passow, J.E. A new statistic for identifying batch effects in high-throughput genomic data that uses guided principal component analysis. Bioinformatics 2013, 29, 2877–2883. [Google Scholar] [CrossRef]
- Kuznetsov, V.A.; Tang, Z.; Ivshina, A.V. Identification of common oncogenic and early developmental pathways in the ovarian carcinomas controlling by distinct prognostically significant microRNA subsets. BMC Genom. 2017, 18, 692. [Google Scholar] [CrossRef]
- Zhang, Q.; Madden, N.E.; Wong, A.S.T.; Chow, B.K.C.; Lee, L.T.O. The Role of Endocrine G Protein-Coupled Receptors in Ovarian Cancer Progression. Front. Endocrinol. 2017, 8, 66. [Google Scholar] [CrossRef]
- Ashrafizadeh, M.; Taeb, S.; Hushmandi, K.; Orouei, S.; Shahinozzaman, M.; Zabolian, A.; Moghadam, E.R.; Raei, M.; Zarrabi, A.; Khan, H.; et al. Cancer and SOX proteins: New insight into their role in ovarian cancer progression/inhibition. Pharmacol. Res. 2020, 161, 105159. [Google Scholar] [CrossRef]
- Jones, P.A. Functions of DNA methylation: Islands, start sites, gene bodies and beyond. Nat. Rev. Genet. 2012, 13, 484–492. [Google Scholar] [CrossRef]
- Yang, X.; Han, H.; De Carvalho, D.D.; Lay, F.D.; Jones, P.A.; Liang, G. Gene Body Methylation Can Alter Gene Expression and Is a Therapeutic Target in Cancer. Cancer Cell 2014, 26, 577–590. [Google Scholar] [CrossRef] [PubMed]
- Baylin, S.B.; Jones, P.A. Epigenetic Determinants of Cancer. Cold Spring Harb Perspect Biol. 2016, 8, a019505. [Google Scholar] [CrossRef]
- Lu, J.; Li, X.P.; Dong, Q.; Kung, F.; He, M.L. TBX2 and TBX3: The special value for anticancer drug targets. Biochim. Biophys. Acta Rev. Cancer 2010, 1806, 268–274. [Google Scholar] [CrossRef] [PubMed]
- Kandimalla, R.; van Tilborg, A.A.G.; Kompier, L.C.; Stumpel, D.J.P.M.; Stam, R.W.; Bangma, C.H.; Zwarthoff, E.C. Genome-wide Analysis of CpG Island Methylation in Bladder Cancer Identified TBX2, TBX3, GATA2, and ZIC4 as pTa-Specific Prognostic Markers. Eur. Urol. 2012, 61, 1245–1256. [Google Scholar] [CrossRef]
- Jones, R.; Wijesinghe, S.; Wilson, C.; Halsall, J.; Liloglou, T.; Kanhere, A. A long intergenic non-coding RNA regulates nuclear localization of DNA methyl transferase-1. iScience 2021, 24, 102273. [Google Scholar] [CrossRef]
- Duployez, N.; Boudry-Labis, E.; Roumier, C.; Boissel, N.; Petit, A.; Geffroy, S.; Helevaut, N.; Celli-Lebras, K.; Terré, C.; Fenneteau, O.; et al. SNP-array lesions in core binding factor acute myeloid leukemia. Oncotarget 2018, 9, 6478–6489. [Google Scholar] [CrossRef] [PubMed]
- Peng, W.; Jiang, A. Long noncoding RNA CCDC26 as a potential predictor biomarker contributes to tumorigenesis in pancreatic cancer. Biomed. Pharmacother. 2016, 83, 712–717. [Google Scholar] [CrossRef] [PubMed]
- Kitchen, M.O.; Bryan, R.T.; Emes, R.D.; Glossop, J.R.; Luscombe, C.; Cheng, K.K.; Zeegers, M.P.; James, N.D.; Devall, A.J.; Mein, C.A.; et al. Quantitative genome-wide methylation analysis of high-grade non-muscle invasive bladder cancer. Epigenetics 2016, 11, 237–246. [Google Scholar] [CrossRef]
- Hong, L.; Yang, P.; Zhang, L.; Liu, X.; Wei, X.; Xiao, W.; Yu, Z.; Zhang, J.; Peng, Y.; Wu, X.; et al. The VAX2-LINC01189-hnRNPF signaling axis regulates cell invasion and migration in gastric cancer. Cell Death Discov. 2023, 9, 387. [Google Scholar] [CrossRef]
- Yang, S.; Ji, J.; Wang, M.; Nie, J.; Wang, S. Construction of Ovarian Cancer Prognostic Model Based on the Investigation of Ferroptosis-Related lncRNA. Biomolecules 2023, 13, 306. [Google Scholar] [CrossRef]
- Si, L.; Chen, J.; Yang, S.; Liu, Z.; Chen, Y.; Peng, M.; Jia, Y. lncRNA HEIH accelerates cell proliferation and inhibits cell senescence by targeting miR-3619-5p/CTTNBP2 axis in ovarian cancer. Menopause 2020, 27, 1302–1314. [Google Scholar] [CrossRef] [PubMed]
- Wang, W.; Li, W.; Pan, L.; Li, L.; Xu, Y.; Wang, Y.; Zhang, X.; Zhang, S. Dynamic Regulation Genes at Microtubule Plus Ends: A Novel Class of Glioma Biomarkers. Biology 2023, 12, 488. [Google Scholar] [CrossRef] [PubMed]
- Wang, J.L.; Wang, Y.; Ren, G.P. Identification of PTPRR and JAG1 as key genes in castration-resistant prostate cancer by integrated bioinformatics methods. J. Zhejiang Univ. Sci. B 2020, 21, 246–255. [Google Scholar] [CrossRef]
- Kumari, N.; Saxena, S.; Agrawal, U. Exosomal protein interactors as emerging therapeutic targets in urothelial bladder cancer. J. Egypt. Natl. Cancer Inst. 2015, 27, 51–58. [Google Scholar] [CrossRef]
- Chen, B.; Gao, C.; Wang, H.; Sun, J.; Han, Z. Molecular Analysis of Prognosis and Immune Infiltration of Ovarian Cancer Based on Homeobox D Genes. Comput. Math. Methods Med. 2022, 2022, 3268386. [Google Scholar] [CrossRef]
- Wang, J.; Zhao, H.; Dong, H.; Zhu, L.; Wang, S.; Wang, P.; Ren, Q.; Zhu, H.; Chen, J.; Lin, Z.; et al. LAT, HOXD3 and NFE2L3 identified as novel DNA methylation-driven genes and prognostic markers in human clear cell renal cell carcinoma by integrative bioinformatics approaches. J. Cancer 2019, 10, 6726–6737. [Google Scholar] [CrossRef]
- Constâncio, V.; Nunes, S.P.; Moreira-Barbosa, C.; Freitas, R.; Oliveira, J.; Pousa, I.; Oliveira, J.; Soares, M.; Dias, C.G.; Dias, T.; et al. Early detection of the major male cancer types in blood-based liquid biopsies using a DNA methylation panel. Clin. Epigenetics 2019, 11, 175. [Google Scholar] [CrossRef] [PubMed]
- Tang, B.L. Vesicle transport through interaction with t-SNAREs 1a (Vti1a)’s roles in neurons. Heliyon 2020, 6, e04600. [Google Scholar] [CrossRef]
- Fujimoto, T.; Doi, K.; Koyanagi, M.; Tsunoda, T.; Takashima, Y.; Yoshida, Y.; Sasazuki, T.; Shirasawa, S. ZFAT is an antiapoptotic molecule and critical for cell survival in MOLT-4 cells. FEBS Lett. 2009, 583, 568–572. [Google Scholar] [CrossRef]
- Ramakrishna, M.; Williams, L.H.; Boyle, S.E.; Bearfoot, J.L.; Sridhar, A.; Speed, T.P.; Gorringe, K.L.; Campbell, I.G. Identification of candidate growth promoting genes in ovarian cancer through integrated copy number and expression analysis. PLoS ONE 2010, 5, e9983. [Google Scholar] [CrossRef] [PubMed]
- Kong, W.; Chen, Y.; Zhao, Z.; Zhang, L.; Lin, X.; Luo, X.; Wang, S.; Song, Z.; Lin, X.; Lai, G.; et al. EXT1 methylation promotes proliferation and migration and predicts the clinical outcome of non-small cell lung carcinoma via WNT signalling pathway. J. Cell. Mol. Med. 2021, 25, 2609–2620. [Google Scholar] [CrossRef]
- Chen, H.; Han, C.; Ha, C. EXT1 and Its Methylation Involved in the Progression of Uterine Corpus Endometrial Carcinoma Pathogenesis. Appl. Biochem. Biotechnol. 2025, 197, 2133–2150. [Google Scholar] [CrossRef] [PubMed]
- Lyu, M.; Yi, X.; Huang, Z.; Chen, Y.; Ai, Z.; Liang, Y.; Feng, Q.; Xiang, Z. A transcriptomic analysis based on aberrant methylation levels revealed potential novel therapeutic targets for nasopharyngeal carcinoma. Ann. Transl. Med. 2022, 10, 47. [Google Scholar] [CrossRef]
- Chen, J.; Sun, W.; Mo, N.; Chen, X.; Yang, L.; Tu, S.; Zhang, S.; Liu, J. Identification of key genes involved in the pathogenesis of cutaneous melanoma using bioinformatics analysis. J. Int. Med. Res. 2020, 48, 300060519895867. [Google Scholar] [CrossRef]
- Xu, H.; Wang, L.; Jiang, X. Silencing of lncRNA DLEU1 inhibits tumorigenesis of ovarian cancer via regulating miR-429/TFAP2A axis. Mol. Cell Biochem. 2021, 476, 1051–1061. [Google Scholar] [CrossRef]
- Hwang, S.H.; Yang, Y.; Woo, S.H.; Jung, J.H.; Seo, D.; Kim, D.Y.; Kim, Y. Thyroglobulin as a negative marker for malignancy in canine and human breast tumors. Mol. Carcinog. 2021, 60, 455–468. [Google Scholar] [CrossRef] [PubMed]
- Buckley, M.A.; Woods, N.T.; Tyrer, J.P.; Mendoza-Fandiño, G.; Lawrenson, K.; Hazelett, D.J.; Najafabadi, H.S.; Gjyshi, A.; Carvalho, R.S.; Lyra, P.C., Jr.; et al. Functional Analysis and Fine Mapping of the 9p22.2 Ovarian Cancer Susceptibility Locus. Cancer Res. 2019, 79, 467–481. [Google Scholar] [CrossRef] [PubMed]
- Li, X.F.; Sun, H.Y.; Hua, T.; Zhang, H.B.; Tian, Y.J.; Li, Y.; Kang, S. Promoter Methylation of the MGRN1 Gene Predicts Prognosis and Response to Chemotherapy of High-Grade Serous Ovarian Cancer Patients. Front. Oncol. 2021, 11, 659254. [Google Scholar] [CrossRef]
- Ma, Y.; Zhang, P.; Wang, F.; Yang, J.; Yang, Z.; Qin, H. The relationship between early embryo development and tumourigenesis. J. Cell. Mol. Med. 2010, 14, 2697–2701. [Google Scholar] [CrossRef]
- Harding, M.; Cowan, S.; Hole, D.; Cassidy, L.; Kitchener, H.; Davis, J.; Leake, R. Estrogen and progesterone receptors in ovarian cancer. Cancer 1990, 65, 486–491. [Google Scholar] [CrossRef] [PubMed]
- Modugno, F.; Laskey, R.; Smith, A.L.; Andersen, C.L.; Haluska, P.; Oesterreich, S. Hormone response in ovarian cancer: Time to reconsider as a clinical target? Endocr. Relat. Cancer 2012, 19, R255–R279. [Google Scholar] [CrossRef] [PubMed]
- Borella, F.; Fucina, S.; Mangherini, L.; Cosma, S.; Carosso, A.R.; Cusato, J.; Cassoni, P.; Bertero, L.; Katsaros, D.; Benedetto, C. Hormone Receptors and Epithelial Ovarian Cancer: Recent Advances in Biology and Treatment Options. Biomedicines 2023, 11, 2157. [Google Scholar] [CrossRef]
- Krashin, E.; Piekiełko-Witkowska, A.; Ellis, M.; Ashur-Fabian, O. Thyroid Hormones and Cancer: A Comprehensive Review of Preclinical and Clinical Studies. Front Endocrinol. 2019, 10, 59. [Google Scholar] [CrossRef]
- Lu, A.T.; Fei, Z.; Haghani, A.; Robeck, T.R.; Zoller, J.A.; Li, C.Z.; Lowe, R.; Yan, Q.; Zhang, J.; Vu, H.; et al. Universal DNA methylation age across mammalian tissues. Nat. Aging 2023, 3, 1144–1166. [Google Scholar] [CrossRef] [PubMed]


| OC Cohort (n = 40) | Benign Cohort (n = 38) | Healthy Cohort (n = 38) | |
|---|---|---|---|
| Age, median [range] | 67.5 [48–85] | 62.5 [19–91] | 62 [53–73] |
| BMI, median [range] | 24.3 [18.1–48.2] | 25.9 [13.1–35.1] | 25.7 [19.6–35] |
| Postmenopausal | 37 (92.5%) | 29 (76.3%) | 38 (100%) |
| FIGO 2013 stage at diagnosis | NA | NA | |
| II | 12 (30%) | ||
| III | 28 (70%) | ||
| Histology, malignant | NA | NA | |
| High-grade serous carcinoma | 40 (100%) | ||
| Histology, benign | NA | NA | |
| Serous cystadenoma/adenofibroma | 17 (44.7%) | ||
| Mucinous cystadenoma/adenofibroma | 5 (13.2%) | ||
| Benign Brenner tumor | 2 (5.3%) | ||
| Cyst not otherwise specified | 1 (2.6%) | ||
| Mature teratoma/struma ovarii | 3 (7.9%) | ||
| Endometriosis | 4 (10.5%) | ||
| Fibroma/thecoma | 3 (7.9%) | ||
| Inflammation/abscess | 2 (5.3%) | ||
| Other reactive changes | 1 (2.6%) | ||
| RMI, median [range] | 2164 [75–75,474] | 231 [48–3807] | NA |
| RMI ≥ 200 | 37 (92.5%) | 22 (57.9%) | NA |
| CA125 (kU/L), median [range] | 391 [20–8386] | 50 [13–513] | NA |
| Tobacco use | NA | ||
| Current | 6 (15%) | 3 (7.9%) | |
| Previous | 12 (30%) | 14 (36.8%) | |
| Never | 21 (52.5%) | 21 (55.3%) | |
| Unknown | 1 (2.5%) | 0 (0%) | |
| Parity | NA | ||
| 0 | 4 (10%) | 4 (10.5%) | |
| 1 | 4 (10%) | 5 (13.2%) | |
| ≥2 | 32 (80%) | 29 (76.3%) | |
| BRCA1/2 mutation | NA | NA | |
| Yes | 12 (30%) | ||
| No | 27 (67.5%) | ||
| Unknown | 1 (2.5%) |
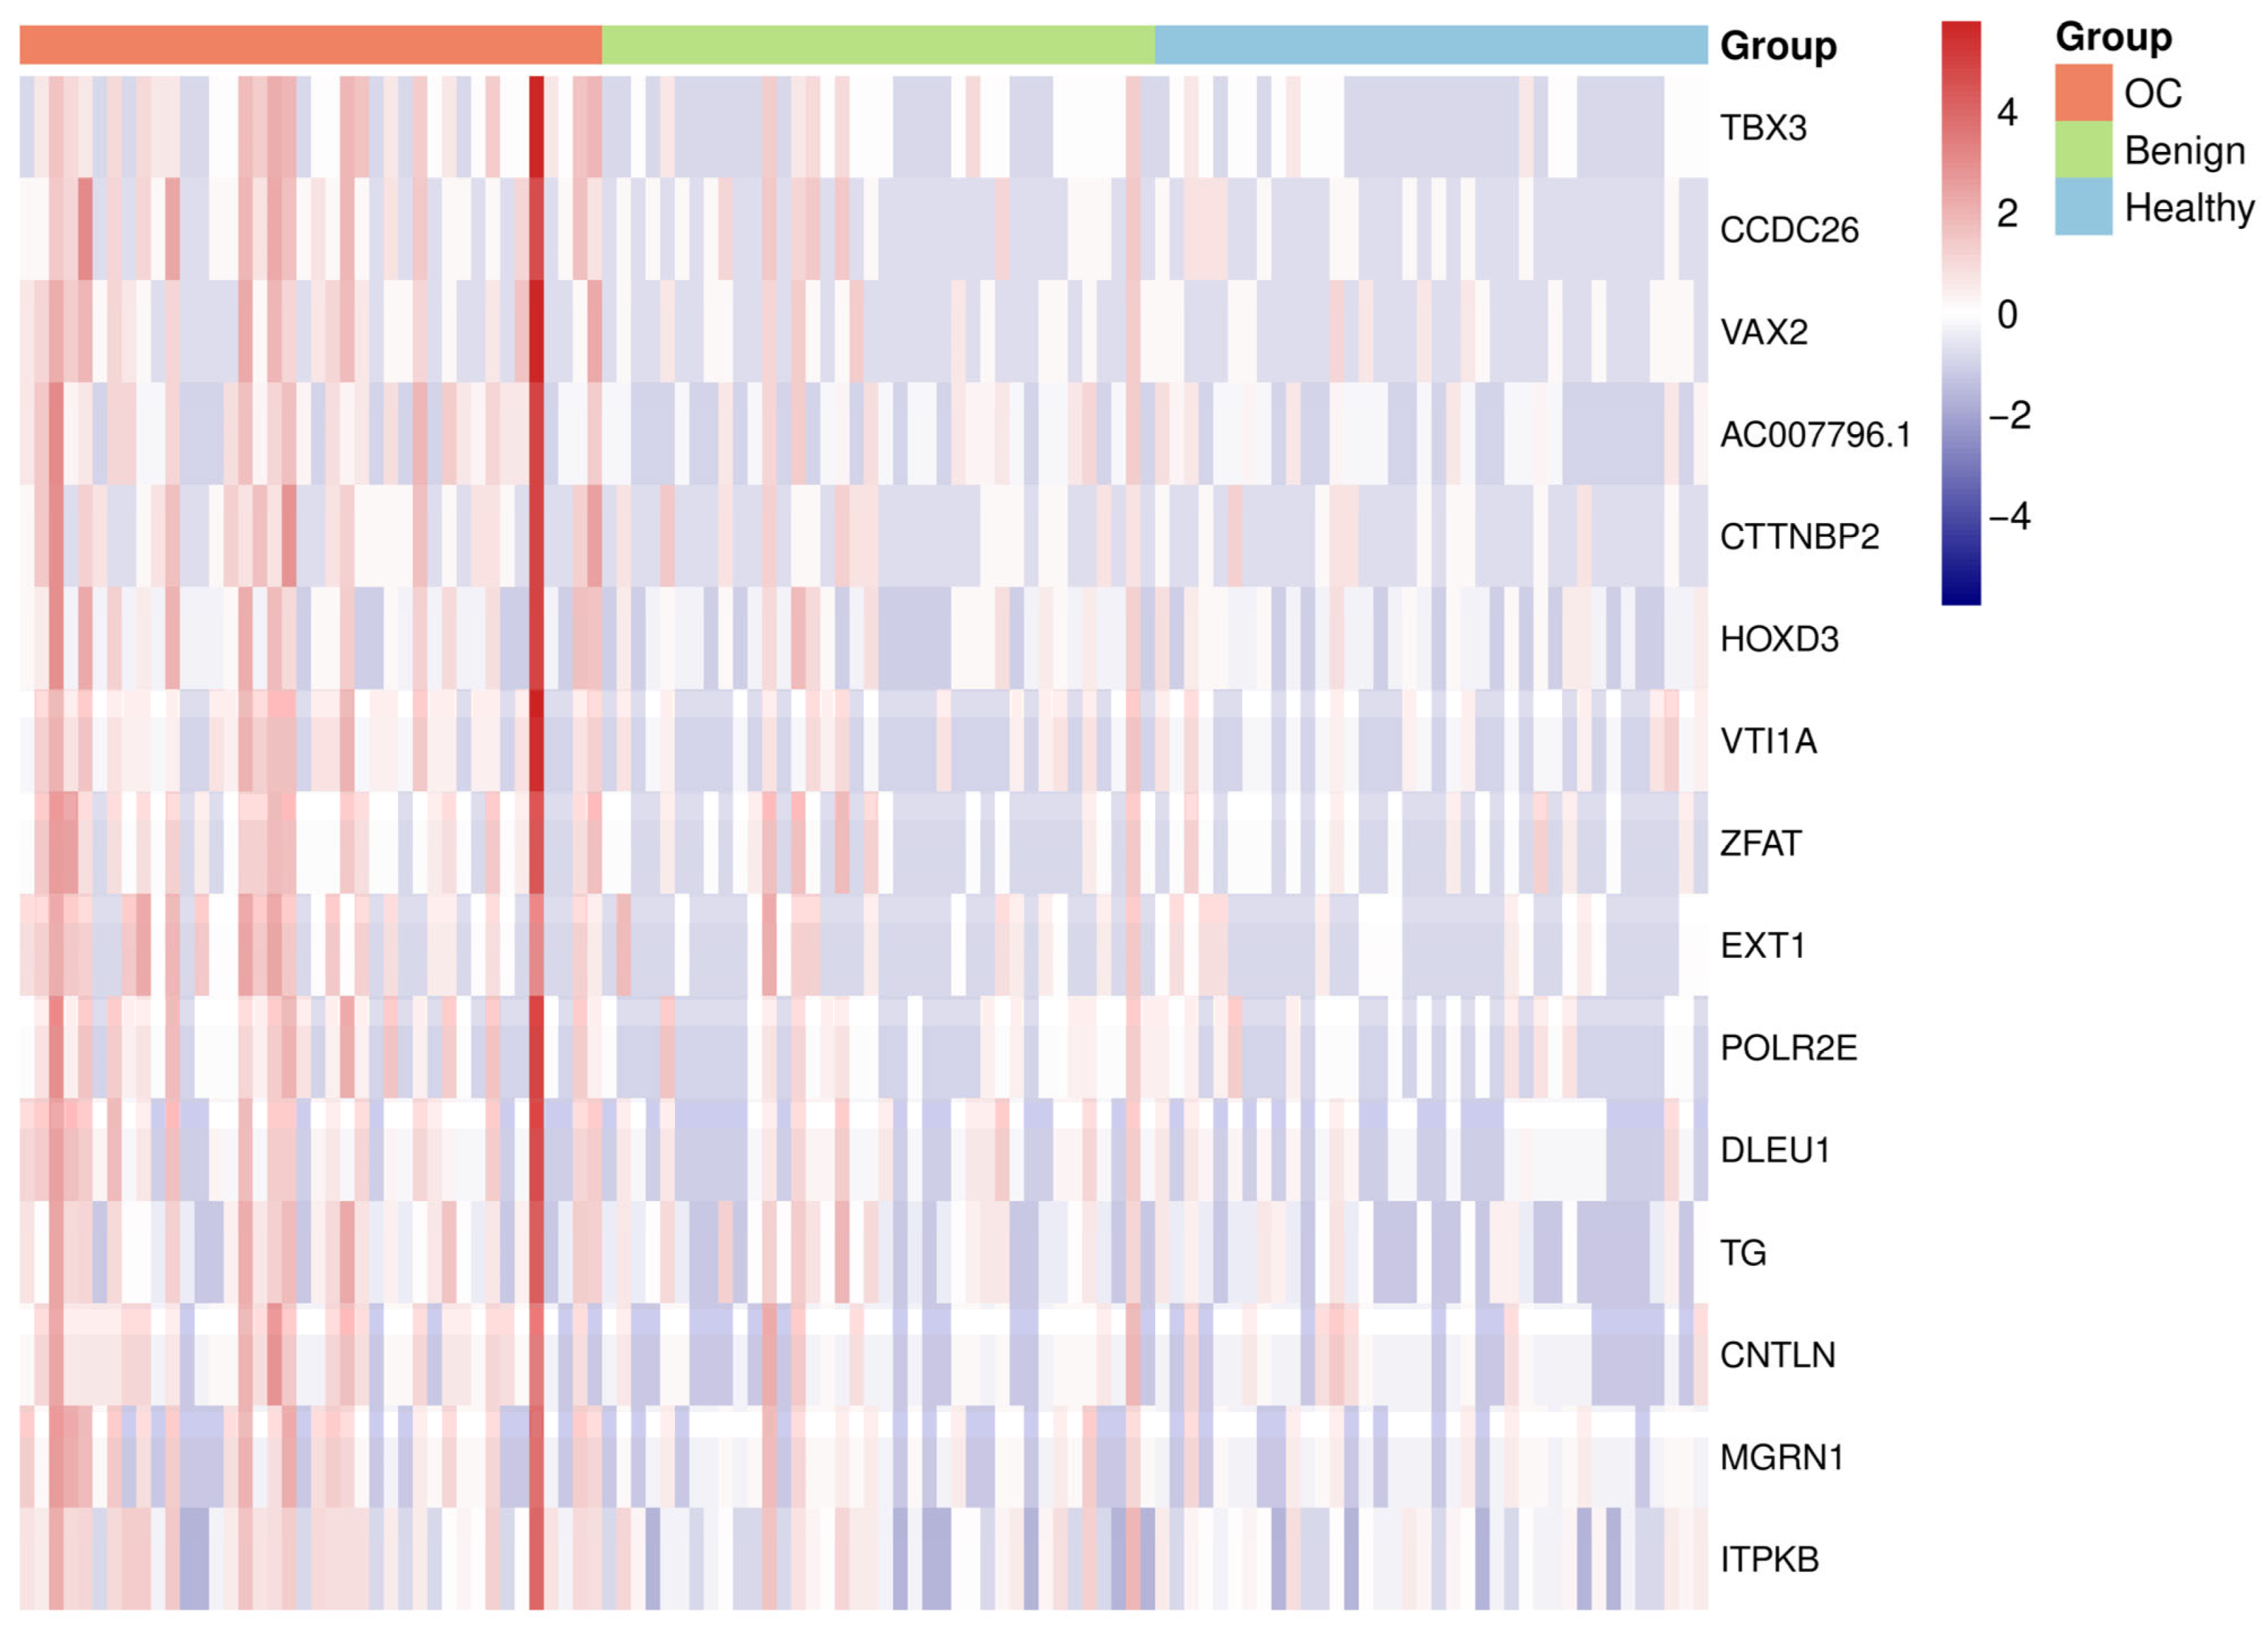
| Gene Name | Chr | Start Site | Stop Site | Log2FC | Adjusted p-Value |
|---|---|---|---|---|---|
| TBX3 | Chr 12 | 114,671,701 | 114,672,000 | 1.9 | 0.0006 |
| CCDC26 | Chr 8 | 129,582,001 | 129,582,300 | 1.8 | 0.0074 |
| VAX2 | Chr 2 | 70,907,401 | 70,907,700 | 1.9 | 0.0128 |
| AC007796.1 | Chr 19 | 31,352,701 | 31,353,000 | 1.5 | 0.0044 |
| CTTNBP2 | Chr 7 | 117,792,601 | 117,792,900 | 1.7 | 0.0128 |
| HOXD3 | Chr 2 | 176,163,601 | 176,163,900 | 1.7 | 0.0128 |
| VTI1A | Chr 10 | 112,815,601 | 112,815,900 | 1.6 | 0.0116 |
| ZFAT | Chr 8 | 134,687,701 | 134,688,000 | 1.5 | 0.0116 |
| EXT1 | Chr 8 | 117,931,801 | 117,932,100 | 1.4 | 0.0116 |
| POLR2E | Chr 19 | 1,087,801 | 1,088,100 | 1.5 | 0.0128 |
| DLEU1 | Chr 13 | 50,133,001 | 50,133,300 | 1.4 | 0.0116 |
| TG | Chr 8 | 132,882,901 | 132,883,200 | 1.3 | 0.0208 |
| CNTLN | Chr 9 | 17,444,101 | 17,444,400 | 1.1 | 0.0128 |
| MGRN1 | Chr 16 | 4,664,101 | 4,664,400 | 1.1 | 0.0150 |
| ITPKB | Chr 1 | 226,680,901 | 226,681,200 | 0.9 | 0.0128 |
Disclaimer/Publisher’s Note: The statements, opinions and data contained in all publications are solely those of the individual author(s) and contributor(s) and not of MDPI and/or the editor(s). MDPI and/or the editor(s) disclaim responsibility for any injury to people or property resulting from any ideas, methods, instructions or products referred to in the content. |
© 2025 by the authors. Licensee MDPI, Basel, Switzerland. This article is an open access article distributed under the terms and conditions of the Creative Commons Attribution (CC BY) license (https://creativecommons.org/licenses/by/4.0/).
Share and Cite
Terp, S.K.; Guldbrandsen, K.; Stoico, M.P.; Mark, L.R.; Frandsen, A.P.; Dybkær, K.; Pedersen, I.S. Genome-Wide cfDNA Methylation Profiling Reveals Robust Hypermethylation Signatures in Ovarian Cancer. Cancers 2025, 17, 2026. https://doi.org/10.3390/cancers17122026
Terp SK, Guldbrandsen K, Stoico MP, Mark LR, Frandsen AP, Dybkær K, Pedersen IS. Genome-Wide cfDNA Methylation Profiling Reveals Robust Hypermethylation Signatures in Ovarian Cancer. Cancers. 2025; 17(12):2026. https://doi.org/10.3390/cancers17122026
Chicago/Turabian StyleTerp, Simone Karlsson, Karen Guldbrandsen, Malene Pontoppidan Stoico, Lasse Ringsted Mark, Anna Poulsgaard Frandsen, Karen Dybkær, and Inge Søkilde Pedersen. 2025. "Genome-Wide cfDNA Methylation Profiling Reveals Robust Hypermethylation Signatures in Ovarian Cancer" Cancers 17, no. 12: 2026. https://doi.org/10.3390/cancers17122026
APA StyleTerp, S. K., Guldbrandsen, K., Stoico, M. P., Mark, L. R., Frandsen, A. P., Dybkær, K., & Pedersen, I. S. (2025). Genome-Wide cfDNA Methylation Profiling Reveals Robust Hypermethylation Signatures in Ovarian Cancer. Cancers, 17(12), 2026. https://doi.org/10.3390/cancers17122026