Review

Potential of Metabolic MRI to Address Unmet Clinical Needs in Localised Kidney Cancer

by
Ines Horvat-Menih
1,
Grant D. Stewart
2 and
Ferdia A. Gallagher
1,*
1
Department of Radiology, University of Cambridge, Cambridge CB2 0QQ, UK
2
Department of Surgery, University of Cambridge, Cambridge CB2 0QQ, UK
*
Author to whom correspondence should be addressed.
Cancers 2025, 17(11), 1773; https://doi.org/10.3390/cancers17111773
Submission received: 2 April 2025 / Revised: 8 May 2025 / Accepted: 12 May 2025 / Published: 26 May 2025
(This article belongs to the Special Issue Magnetic Resonance in Cancer Research)

Simple Summary

Renal cell carcinoma (RCC) is the most common kidney cancer with an increasing incidence and mortality. Current diagnostic methods are limited, leading to delayed treatment and suboptimal patient outcomes. RCC subtypes have distinct metabolic phenotypes which have the potential to be used for better diagnosis and treatment. A number of emerging metabolic MRI techniques offer promising non-invasive alternatives to conventional imaging for assessing these differences across tumours, including hyperpolarised [1-13C]pyruvate MRI and deuterium metabolic imaging. These techniques provide potentially valuable information about tumour metabolism, which could be used for earlier detection, more accurate diagnosis, and improving treatment response monitoring. This review explores the potential of metabolic MRI in the clinical management of RCC and outlines future research directions.

Abstract

Renal cell carcinoma (RCC) is a major global health issue with an increasing incidence and mortality rate. Current diagnostic methods are either invasive or limited in their ability to accurately differentiate between benign and malignant tumours and to predict early treatment response. This can lead to incorrect diagnosis, delayed treatment, patient anxiety, and suboptimal outcomes. RCC subtypes are known to exhibit distinct metabolic alterations, for example in glucose metabolism. These metabolic phenotypes offer potential targets for non-invasive imaging techniques to improve diagnosis and treatment, but current clinically available metabolic imaging tools such as 18F-FDG-PET and 99mTc-sestamibi SPECT have limitations. Therefore, new approaches are required to assess this metabolism, and novel metabolic MRI techniques including hyperpolarised [1-13C]pyruvate MRI and deuterium metabolic imaging offer promising alternatives. These techniques are non-radioactive, demonstrate spatial metabolic heterogeneity, and can probe metabolic flux beyond tracer uptake. This review aims to explore the potential of metabolic MRI in the clinical management of RCC by (1) summarising current clinical guidelines; (2) reviewing metabolic heterogeneity across RCC subtypes; (3) discussing the potential of metabolic MRI to advance the understanding of in vivo metabolism; (4) and finally suggesting future directions for research in this field.

Graphical Abstract

1. Introduction

Renal cell carcinoma (RCC) is the most common kidney malignancy, with a steadily increasing incidence globally but with mortality rates that are not declining despite improvements in clinical management [1,2]. However, current diagnostic methods have limitations, including challenges in differentiating benign from malignant localised renal tumours and an inability to accurately detect early and successful response to treatment [3,4]. This can result in the delayed treatment of aggressive cases [5] and unnecessary anxiety for patients who ultimately are found to have benign lesions [6]. Biopsies are commonly used to assess tumour histology and aggressiveness but are invasive, not possible in all patients, and provide only a limited and potentially unrepresentative sample of the entire tumour mass [7]. Moreover, even after curative surgery, the disease may recur in up to 30% of patients, highlighting the need for the development of neoadjuvant and adjuvant treatment strategies, as well as better tools for surveillance and treatment response monitoring [8,9].
Different histological subtypes of renal cell tumours are known to manifest distinct metabolic alterations, particularly involving glucose metabolism, due to characteristic driver mutations. The most well-known example is the shift to glycolysis, also termed the Warburg effect [10]: in clear cell renal cell carcinoma (ccRCC), this effect occurs due to the loss of the von Hippel–Lindau (VHL) tumour suppressor gene, stabilising hypoxia-inducible factors (HIFs) and thereby activating expression of glycolytic genes [11,12]. Similarly, upregulated glycolysis is also found in the other two most common subtypes of RCC: papillary RCC (pRCC) and chromophobe RCC (chRCC) [13,14]. Changes in metabolism are also characteristic of the histological subtypes occurring due to loss-of-function in some tricyclic acid (TCA) cycle enzymes: succinate dehydrogenase-deficient (SDHd) RCC [15] and fumarate hydratase-deficient (FHd) RCC [16]. Suppressed metabolism is also present in the most common benign kidney tumour, renal oncocytoma (RO), due to a loss of mitochondrial complex I, leading to an accumulation of defective mitochondria and HIF destabilisation [17,18]. Considering these characteristic metabolic changes, an unanswered question is whether non-invasive metabolic imaging techniques can be used to better characterise kidney tumours and therefore improve clinical management and outcomes, including differentiating subtypes, probing intratumoural metabolic heterogeneity, and detecting successful treatment response earlier.
Clinically available tools for the assessment of tumour metabolism include the use of the radiolabelled glucose analogue fluorine-18-labelled fluorodeoxyglucose in conjunction with positron emission tomography (18F-FDG-PET), but this is limited in the kidney due to renal excretion of the tracer and has not been successfully used to characterise kidney tumours [19]. An alternative radionuclide is 99mTc-sestamibi which accumulates in tissues with abundant mitochondria and can be detected using Single-Photon Emission Computed Tomography (SPECT); this has shown promise in differentiating benign and malignant masses, but still fails to accurately differentiate a benign renal oncocytoma from chRCC (with a sensitivity of 89% and specificity of 67%, based on a recent systematic review [20]). Therefore, identifying small malignant renal tumours with high sensitivity and specificity remains an unmet clinical need [21]. In addition, both PET and SPECT expose patients to ionising radiation and cannot discriminate individual downstream metabolites [19,20].
In comparison, metabolic MRI methods are powerful non-radioactive and non-invasive methods used to detect individual metabolite levels in vivo and intratumoural metabolic heterogeneity [22,23]. Proton MR spectroscopy (1H-MRS) is the most widely used approach but this largely assesses only steady-state metabolism rather than metabolic flux and can be susceptible to magnetic field inhomogeneity and motion artifacts [24,25,26,27]. In this review, we provide a rationale for how emerging metabolic MRI techniques, including hyperpolarised [1-13C]pyruvate MRI (HP 13C-MRI) and deuterium metabolic imaging (DMI), can be harnessed to guide clinical decisions in kidney cancer. State-of-the-art clinical guidelines will be summarised followed by evidence for metabolic heterogeneity in kidney tumours. Finally, perspectives for the use of metabolic MRI to advance the understanding of in vivo metabolism will be provided, as well as for its potential integration into the clinical management of localised kidney cancer, suggesting directions for future research.

2. Epidemiology, Pathology, and Current Clinical Guidelines

2.1. Epidemiology and Aetiology

Renal cell carcinoma (RCC) accounts for approximately 4% of all malignancies globally, representing the sixth and tenth most frequent cancer in women and men, respectively [28]. The incidence of RCC has increased significantly during the last two decades and currently accounts for >400,000 new cases per year globally [1]. While most lesions are localised renal masses, metastatic disease is detected in up to 17% of patients at diagnosis [29]. Detection of RCC at an advanced stage significantly reduces the 5-year cancer-specific survival (CSS), which ranges from 91% for low-risk localised tumours to 0–32% in late-stage disease [30]. Mortality rates therefore remain high, with 179,368 deaths globally in 2022, resulting in RCC being one of the most lethal urological malignancies [1,28]. RCC occurs more frequently in older and male patients, with risk factors including smoking, obesity, hypertension, end-stage renal failure, and acquired cystic kidney disease [28].

2.2. Histopathology

Tumours originating from renal tubular epithelium represent 75–80% of all kidney cancers [31] and encompass a heterogeneous group of histopathological types described by the 2022 World Health Organisation (WHO) classification under ICD-O-3.2 as “Renal cell tumours” [32]. The most common malignant subtypes are clear cell, papillary, and chromophobe (ccRCC, pRCC, chRCC), and the most common benign subtype is the oncocytoma (RO), with an incidence of up to 18% in tumours of <4 cm at presentation [33]. The metabolic nature of the driver mutations in SDHd-RCC and fumarate hydratase-deficient FHd-RCC results in these subtypes being of particular interest for the exploration of metabolic heterogeneity. RCC subtypes arise from distinct cells of origin along the nephron and are distinguished based on their histological morphology and molecular staining profile, which give rise to their nomenclature, as summarised in Table 1.
In addition to tumour subtype, histological evaluation includes tumour grading based on the World Health Organisation and International Society of Urological Pathology systems (WHO/ISUPs; for ccRCC and pRCC), sarcomatoid or rhabdoid differentiation, the presence of necrosis, microscopic lymphovascular invasion, surgical margins, and conventional pathological staging of the tumour, nodes, and metastases (pTNM) [30].

2.3. Diagnostic Evaluation

In the majority of patients (60%), RCCs are detected incidentally [42]. The classic triad of flank pain, macroscopic haematuria, and a palpable abdominal mass is rare and a sign of advanced disease [43]. Physical examination and laboratory investigations only play a limited role in diagnosis, although they have prognostic value for treatment stratification [43].
Imaging is central to clinical decision-making including detection, diagnosis, and characterisation of lesions at staging and follow-up. The Royal College of Radiologists in the UK [44] recommends imaging with CT of the chest, abdomen, and pelvis following contrast-medium imaging as the imaging of choice to evaluate the primary tumour and metastatic disease. However, standard-of-care imaging does not differentiate RCC from RO [4]. MRI is indicated for the evaluation of renal masses with indeterminate CT findings, typically small solid renal masses. The protocol of the Society of Abdominal Radiology is outlined in Table 2 [45,46].
However, characterisation of renal mass subtypes on MRI remains a clinical challenge, particularly for the overlapping features of RO and chRCC, and requires further development [47]. Recently, a five-tier Likert scoring algorithm for the likelihood of a renal mass being ccRCC on MRI was proposed which showed good sensitivity (75%) and specificity (78%) with a score of 4 or 5 [48,49].
Imaging assesses primary tumour staging based on the TNM system, which influences treatment decisions [50]. This includes assessment of tumour size, invasion of lymph nodes and adjacent structures (liver, spleen, muscles), extension into the venous system, and spreading into the lungs and adrenal glands.
Renal mass biopsy (RMB) is currently the gold-standard for determining the histology of radiologically indeterminate renal masses in patients who are candidates for active surveillance or ablative therapy, as well as for choosing the most appropriate targeted therapy in metastatic disease [31,43]. However, RMB is an invasive procedure which is not appropriate for some tumours due to their location, the biopsy results take time to process and may be non-diagnostic in up to 20% of first attempts, and the sample may be unrepresentative of the whole tumour due to heterogeneity, resulting in undergrading of the lesion in up to 16% of cases [5,7].

2.4. Treatment Strategies

Surgical excision with curative intent is the gold-standard treatment for localised and locally advanced tumours which are suspected to be RCC, while ablative techniques and active surveillance (AS) are recommended for histological subtypes with a lower risk of progression such as oncocytic renal neoplasms [2,43].
Partial nephrectomy is the surgical treatment of choice for organ-confined T1a tumours in patients with RCC of any tumour size with compromised kidney function, solitary kidneys, or bilateral tumours. Equally, ablative techniques can be applied as an alternative and preferred option in patients with cortical tumours ≤ 3 cm, in frail/comorbid patients, and in hereditary RCCs. Minimally invasive (laparoscopic or robot-assisted) radical nephrectomy is a recommended option for T2 tumours, while locally advanced tumours (T3 and T4) should be treated with an open radical nephrectomy approach (other than in selected patients in centres with high levels of robotic surgery expertise) with excision of the thrombus in cases of venous involvement, as well as any lymph node dissection of clinically enlarged lymph nodes for the purpose of staging, prognosis, and follow-up [2,43].
After surgery with curative intent, approximately 30% of patients experience recurrence [8,43]. Therefore, neoadjuvant and adjuvant treatment strategies for localised and locally advanced RCC are being currently investigated in clinical trials [30,43]. To date, no significant survival benefit has been identified for adjuvant therapy in randomised clinical trials, including using tyrosine kinase inhibitors (TKIs) [51,52,53], mTOR inhibitors [54], or the CAIX inhibitor girentuximab [55]. Although sunitinib improved disease-free survival (DFS) in a single randomised controlled trial, it has not been approved by the European Medicines Agency (EMA) due to high-grade toxicities [30]. Immune checkpoint inhibitors have shown a survival benefit in the metastatic setting, and although there is conflicting evidence from several adjuvant checkpoint inhibitor clinical trials, the Keynote 564 study demonstrated a DFS and an overall survival (OS) advantage of 1 year with adjuvant pembrolizumab therapy [56].
Optimal clinical trial designs for neoadjuvant studies are an area of high priority within the field currently, as these strategies have the potential to treat high-risk patients at the earliest possible opportunity [57]. Although prolonged surgical waiting times decrease patient survival, they may present an opportunity for the development of neoadjuvant treatment strategies [58,59]. To date, only a small number of phase II trials have reported results for TKIs and immune checkpoint inhibitors in the neoadjuvant setting [60], and further clinical trials are ongoing [61,62].

2.5. Follow-Up

Prognostic models can be used to assist with follow-up planning and predicting long-term outcomes. The Leibovich model is frequently used to predict the progression-free survival (PFS) and cancer-specific survival (CSS) of ccRCC, the most common histologic subtype [63,64]. A higher score denotes a greater progression risk, demanding more frequent follow-up investigations [63]. In addition, the histological subtypes also affect prognosis, with ccRCC showing the worst 10-year CSS compared to pRCC and chRCC after correction for tumour stage [34,43].
Follow-up imaging after surgery is used to identify postoperative complications, local/contralateral recurrence, the appearance of distant metastases, and related cardiovascular events. Postsurgical CT imaging of the thorax, abdomen, and pelvis every 3–6 months is recommended, with a higher frequency of imaging for high-risk RCCs. Objective response to systemic therapy in metastatic disease, as well as in the context of adjuvant and neoadjuvant treatment strategies, can be evaluated using the Response Evaluation Criteria in Solid Tumours (RECIST) determined on imaging. RECIST 1.1 is widely used to assess response in clinical studies [65]; however, these size changes do not necessarily correspond to a clinically validated endpoint [30], and measuring size alone may be insufficient to capture the response to some novel targeted therapies. Given the time interval required to elicit a significant size change, the RECIST are limited in the evaluation of short-term neoadjuvant therapies [9,65].

3. Metabolic Heterogeneity in Kidney Cancer

Kidney cancer is characterised by a high degree of heterogeneity on many different spatial scales including macroscopically, histologically, functionally, metabolically, and at the cellular level [66]. This heterogeneity may lead to problems in clinical management, such as sampling errors on RMB, requirements for combinational drug therapies, and a lack of accurate biomarkers to monitor the response to this treatment [43,67]. Not only is there significant variation in imaging between histological subtypes, but there is also heterogeneity within an individual tumour (intratumoural), between tumours in a single patient, and between patients with the same tumour subtype (intertumoural). Imaging is a key technology used to capture this spatial heterogeneity and how it changes over time and with treatment [68]. Kidney cancer is an exemplar of metabolic reprogramming, which describes the shift to alternative energy-yielding pathways to fuel tumour progression [69]. The best known example of such metabolic shifts is the Warburg effect, also termed aerobic glycolysis, whereby cancer cells preferably convert pyruvate to lactate rather than import it into mitochondria for oxidative phosphorylation [70]. Across different histological subtypes, specific genetic mutations underlie the occurrence of characteristic metabolic phenotypes, and this knowledge could be harnessed to aid in the differentiation of benign and malignant renal masses based on metabolism. In addition, kidney tumours exhibit high intratumoural heterogeneity, on both genetic and metabolic levels [71,72]. Understanding the biology of this intratumoural variation could enhance image-guided biopsies to the region with the highest chance of a diagnostic yield and with the most aggressive phenotype, as suggested by perfusion/metabolism mismatch studies in other cancer types [73,74,75]. The current status of research on the metabolic heterogeneity of glucose metabolism in kidney cancer is summarised below [76].

3.1. Intertumuoral Heterogeneity

The genetic alterations underpinning RCC are involved in many essential metabolic pathways, and these result in metabolic dysregulation including the Warburg effect [13]. The preferred use of glycolysis for energy generation in RCC, instead of the energetically more efficient oxidative phosphorylation pathway, supports the rapid proliferative demands of tumour growth and replenishes the NAD+ pool for lactate production [77]. In comparison, renal oncocytoma is a benign renal cell tumour and exhibits a downregulation of metabolism due to lower energetic demands for proliferation [18].

3.1.1. Clear Cell RCC

In 90% of sporadic ccRCCs, there is loss of the VHL tumour suppressor gene, which controls cellular oxygen sensing via regulating the stability of HIFs. Loss of the VHL protein leads to the stabilisation and accumulation of HIFs and consequent activation of their transcriptional targets, causing a metabolic shift towards aerobic glycolysis, increased angiogenesis, and suppressed oxidative phosphorylation [13]. The utilisation of glucose in these tumours can be identified using isotopomer analysis in postoperative human ccRCC tissue samples following intraoperative infusion of ubiquitously labelled [U-13C6] glucose, and these approaches have demonstrated reduced labelling of TCA intermediates compared to the normal kidney [78].

3.1.2. Papillary RCC

In pRCC, the most frequent mutation is near-universal activation of the MET oncogene; MET is a receptor tyrosine kinase which stimulates downstream pathways, inducing glycolysis, and reduces the expression of enzymes involved in gluconeogenesis, the TCA cycle, and oxidative phosphorylation [79].

3.1.3. SDHd-RCC and FHd-RCC

Loss-of-function of TCA cycle enzymes is characteristic of SDHd-RCC and FHd-RCC, resulting in the accumulation of the oncometabolites succinate and fumarate, respectively [15], which in turn promotes tumorigenesis. Both metabolites stabilise HIFs which subsequently upregulate glycolysis and angiogenesis to meet the high energetic and biosynthetic demands of these aggressive tumour types [16].

3.1.4. Chromophobe RCC and Renal Oncocytoma

In contrast to other RCCs, the somatic mutation rate in chRCC is low, and most cases present with a loss of heterozygosity (LOH) in chromosomes Y, 1, 2, 6, 10, 13, 17, and 21 [43]. Less consistently, activating mutations of the mTOR pathway are found which are known to promote biosynthesis and tumour survival [13]. The lack of a specific driver mutation suggests that tumorigenesis in this subtype may be due to other mechanisms, and indeed alterations in mitochondrial DNA (mtDNA) have been reported previously [17]. As with the benign RO, a characteristic feature of both tumour types is an abundance of mitochondria. However, the main difference between them is differential mtDNA mutations. chRCC shows a general mtDNA reduction rather than selective complex I mutations, which are the hallmark of RO [17]. Ablation of complex I destabilises HIF1a, causing overall downregulation of metabolic pathways in RO [18], and leads to an accumulation of defective mitochondria with impaired autophagy, limiting progression to malignancy [80,81]. On the other hand, it is less clear to what extent the mitochondria preserve functionality in chRCC, as reports so far have been contradictory: reduced expression of genes and metabolite concentrations involved in the TCA cycle and OXPHOS were reported in some studies [13,82], while n increased labelling of TCA cycle metabolites was observed in postoperative chRCC tissues after intraoperative infusion with [U-13C] glucose [83]. In contrast to RO, the glycolytic pathways in chRCC are upregulated, but not to the same extent as in ccRCC [82].

3.2. Intratumoural Heterogeneity

Studies assessing the intratumoural heterogeneity of RCC metabolism are only beginning to emerge and are largely limited to the most common subtype, ccRCC. The upregulation of glycolytic enzymes and metabolites increases with ccRCC tumour grade at the expense of TCA cycle intermediaries [84,85,86]. However, many of these studies analysed a single sample per patient and therefore cannot report on intratumoural heterogeneity. Okegawa et al. [71] have reported different metabolic phenotypes from spatially separated regions within the same primary tumour. By applying global metabolomic analysis on multiple regions from 18 patients and performing isotope tracer experiments on ex vivo tissue slices from 2 patients, they were able to identify two distinct metabolic clusters, differing in their abundance of glycolytic metabolites. Isotope tracer experiments with [U-13C]glucose indicated differential fractional enrichments of pyruvate and citrate across regions. Importantly, they identified altered pyruvate metabolism across all tumour sites, which could be exploited as a therapeutic vulnerability in the future. Further evidence for the role of pyruvate has been shown using a mitochondrial pyruvate carrier (MPC) inhibitor which supresses the growth of tumour cells in vitro and in vivo in patient-derived xenograft tumours in mice [71]. Insights from the immune microenvironment of ccRCC demonstrate that high glucose consumption and lactate production promote immunosuppression [87], and recent reports assessing the intratumoural heterogeneity of the immune landscape suggest a role of immunometabolism in driving the emergence of these intratumoural habitats [88,89]. Similarly, a study investigating intratumoural regions in ccRCC separated by high and low perfusion on contrast-enhanced MRI correlated these with varying immune transcriptomic signatures on biopsy, although they did not assess the role of metabolism [90].
Metabolic heterogeneity of kidney tumours has been studied extensively in vitro, as well as using ex vivo tissue samples and in preclinical RCC models [69]. However, in vitro and ex vivo metabolomic analyses cannot assess the dynamics of metabolism in vivo, while preclinical models cannot capture the tumour clonality which occurs in patients. In addition, due to the lack of preclinical models for rarer RCCs and for benign subtypes, these tumours remain understudied [69]. Clinical imaging tools which can detect metabolic alterations directly in patients circumvent the dependence on tissue extraction for analysis and therefore mitigate against the potential of perturbing the highly delicate metabolic networks during the sampling process.

4. Clinical Imaging of Metabolism in Kidney Cancer

4.1. Nuclear Imaging Techniques

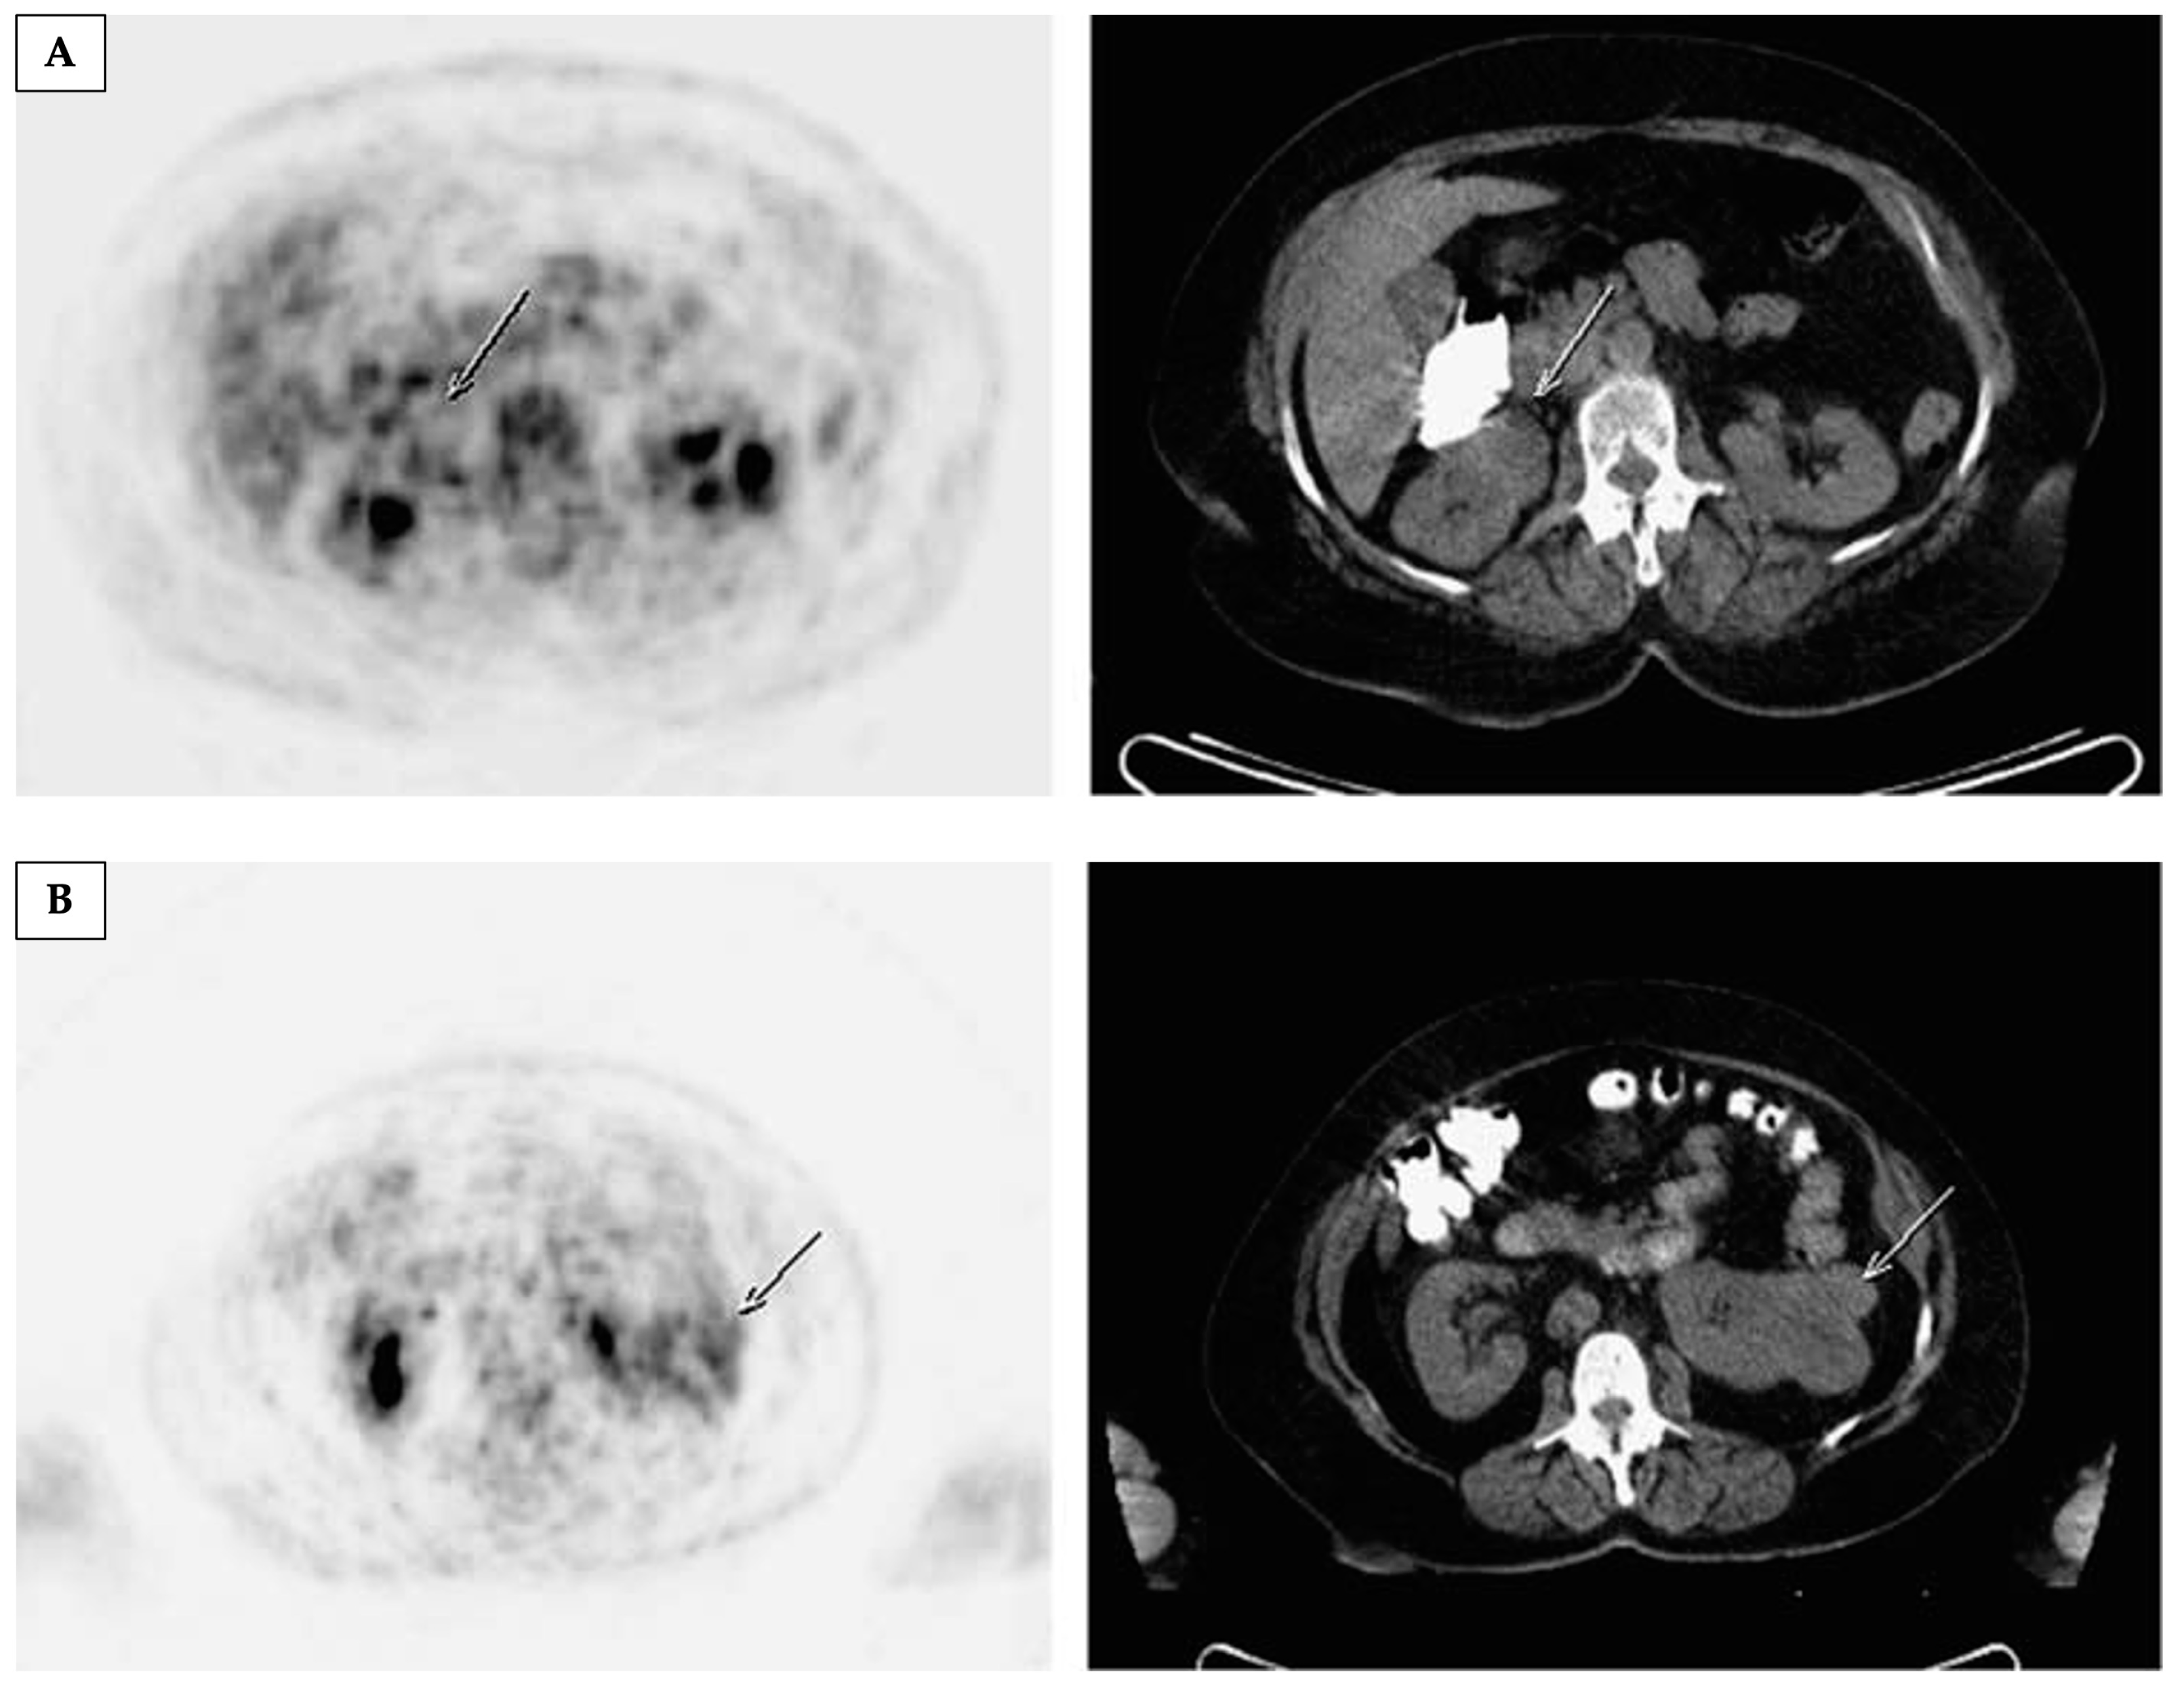
4.1.1. Positron Emission Tomography with [18F]Fluorodeoxyglucose ([18F]FDG-PET)

Currently, the only routine clinical tool for the assessment of tumour metabolism uses a radiolabelled glucose analogue, 2-[18F]fluoro-2-deoxy-D-glucose ([18F]fluorodeoxyglucose, [18F]FDG), in conjunction with positron emission tomography (PET). While it enables imaging of glucose uptake and has a long history of clinical success in oncology [91], it is constrained by renal excretion of the tracer which can prevent an accurate assessment of uptake in the adjacent tumour, and thus has a limited role in characterising localised kidney tumours [19]. Nevertheless, the technique has been explored as a non-invasive imaging tool of metabolic dysregulation across different RCC subtypes. In a retrospective study of 147 patients, [18F]FDG uptake was significantly lower in chRCC compared to ccRCC and pRCC, as well as in low- compared to high-grade ccRCCs and pRCCs [92]. However, [18F]FDG-PET was unreliable in differentiating between RCC and RO, where more than half of malignant lesions were falsely negative on PET, and a single RO was a false positive [93], as shown in Figure 1.
A systematic review of the literature determined that [18F]FDG-PET may be a viable option for recurrent and metastatic RCC, where it can be used to monitor treatment response and predict survival [19]. A reduction in [18F]FDG uptake in metastatic lesions after a course of systemic therapy has been shown to correlate with longer survival rates [94,95,96,97] and can outperform the RECIST in early response evaluation of skeletal lesions after sorafenib in metastatic RCC [98].

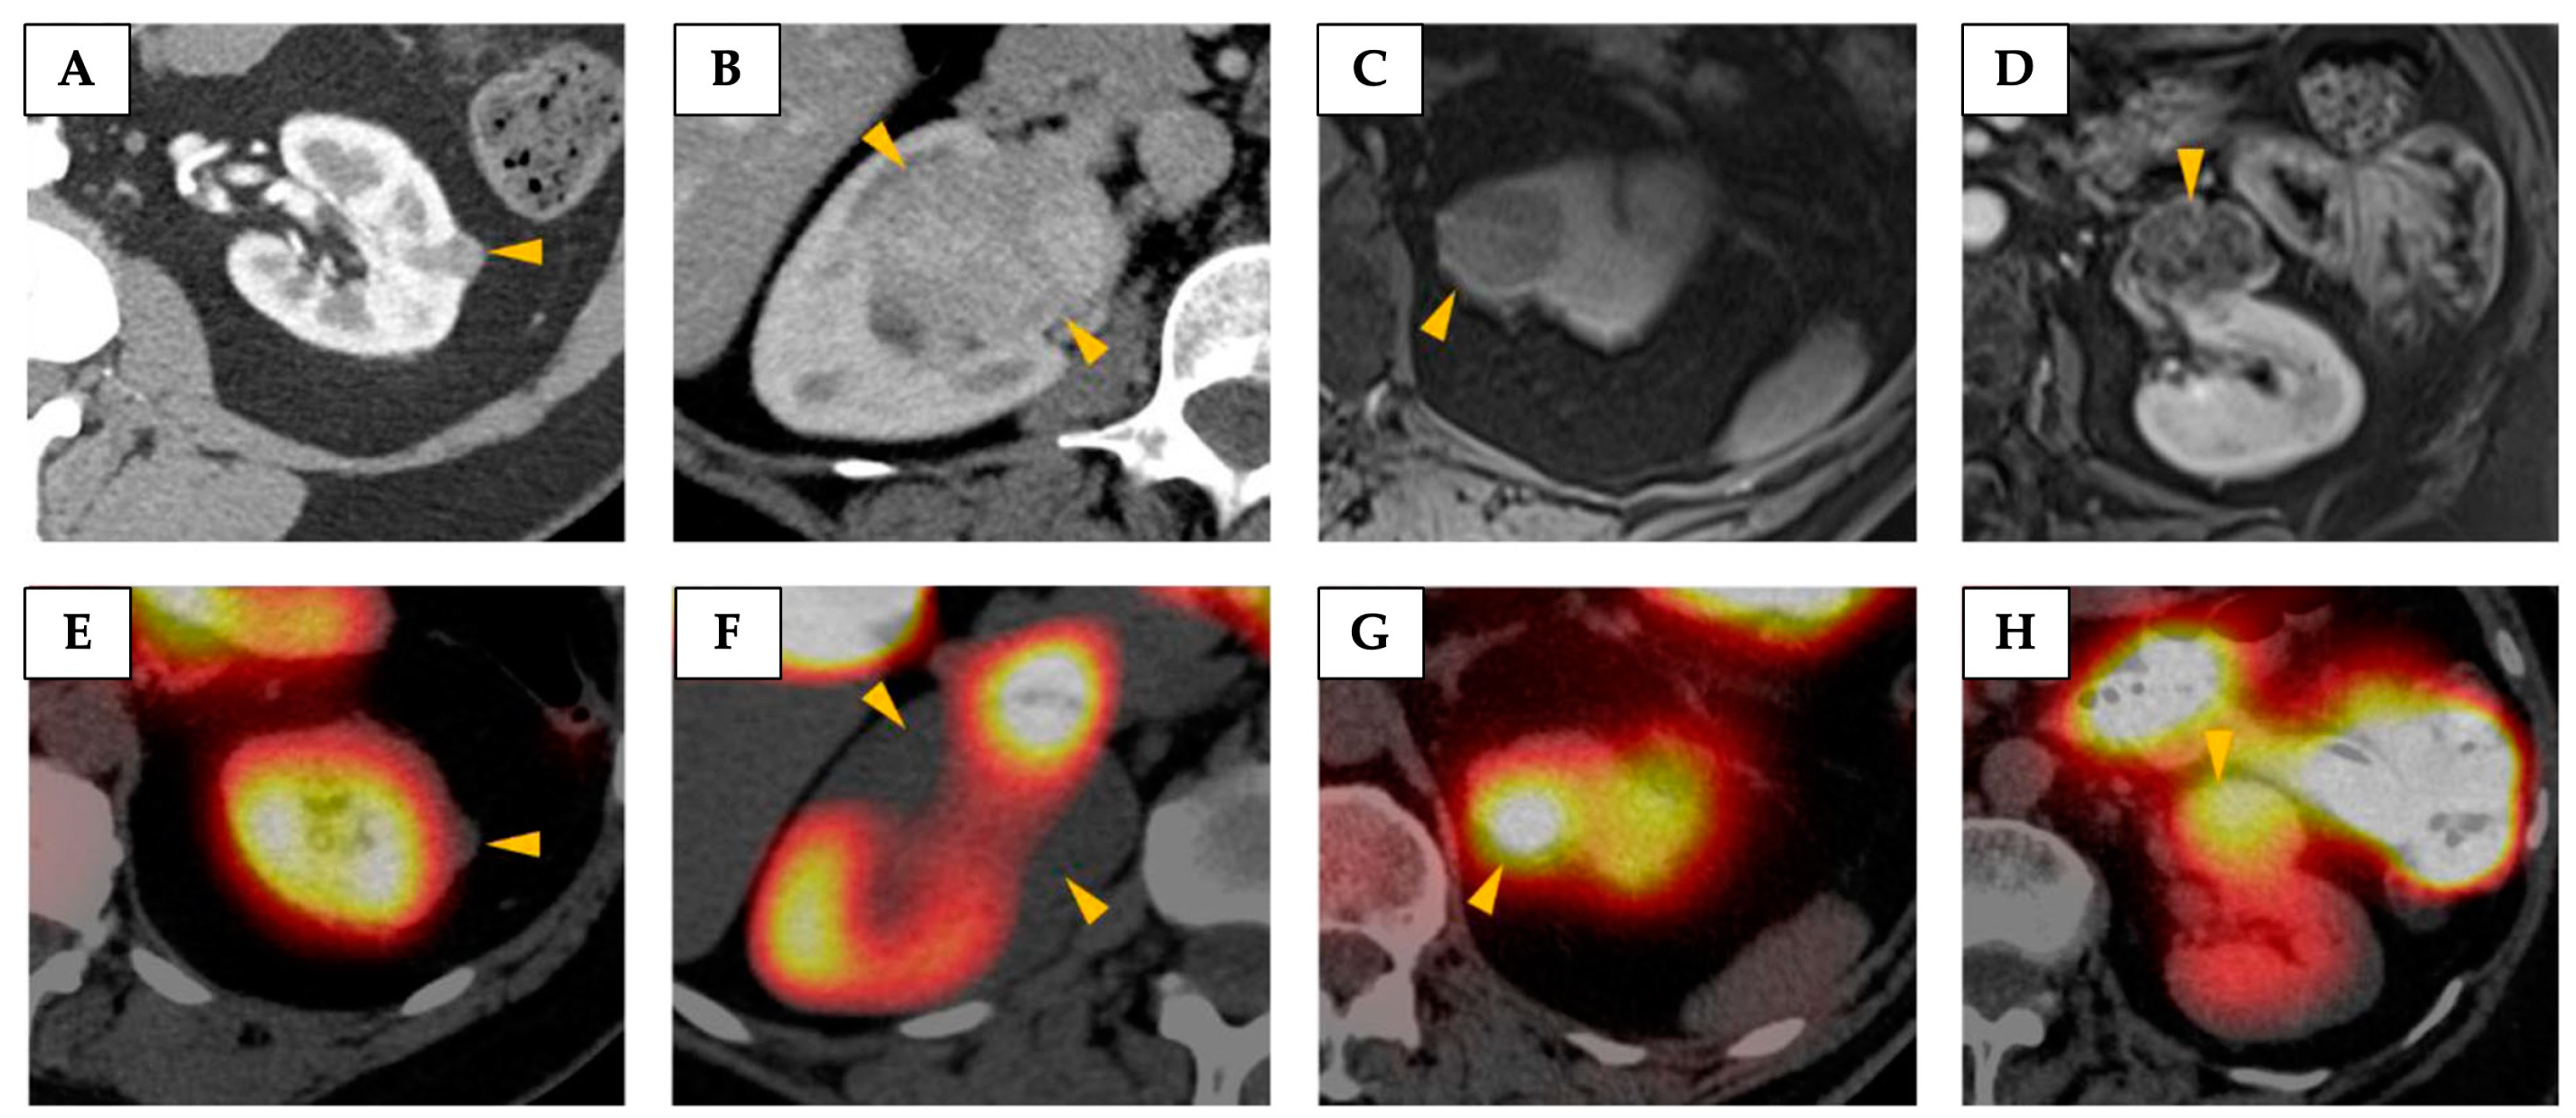
4.1.2. 99Tc-Sestamibi SPECT

Another emerging clinical imaging technique that can exploit metabolic alterations in renal masses is 99mTc-sestamibi Single-Photon Emission Computed Tomography (SPECT) [21]. 99mTc-sestamibi accumulates in tissues with high mitochondrial content, which is a characteristic of oncocytic tumours [99]. While still under investigation as a diagnostic tool to evaluate indeterminate renal masses, the results showed promise in discriminating between oncocytic renal tumours and malignant masses [21]. However, chRCC is also characterised by mitochondrial proliferation, and a meta-analysis has revealed a low specificity of 99mTc-sestamibi SPECT in differentiating between oncocytic renal tumours and chRCC [21]. Figure 2 demonstrates the high variability of 99mTc-sestamibi uptake in chRCCs.
In summary, the role of [18F]FDG-PET and 99mTc-sestamibi SPECT as potential routine clinical tools in kidney cancer management remains limited. In addition, both techniques have several other drawbacks, including radiation exposure, long scanning times of up to two hours, and an inability to probe metabolism beyond glucose uptake and mitochondrial accumulation [27,99], and therefore do not directly report on the balance between the Warburg effect and oxidative phosphorylation in the tissue of interest.
Figure 1. [18F]FDG-PET cannot accurately differentiate between malignant and benign renal masses. (A) Axial PET and CT images from a [18F]FDG-PET/CT study showing low-grade tracer uptake in a right renal mass (arrowed), which was later confirmed to be renal cell cancer. (B) Axial slices of PET and CT from a second patient showing some [18F]FDG uptake in a left renal mass (arrowed), which was later shown to be an oncocytoma. Reprinted, under a CC BY license (license number: 5962670886654) as mediated by the Copyright Clearance Center (Chicago, IL, USA), from reference [93].
Cancers 17 01773 g001
Figure 2. A demonstration of the high variability of 99mTc-sestamibi uptake in chromophobe renal cell carcinomas (chRCCs). Axial images from contrast-enhanced CT (A,B) and post-contrast T1-weighted fat-saturated MRI (C,D) showing representative images of the four chRCCs included in the study performed by Rowe et al. [99]. (EH) Corresponding 99mTc-sestamibi SPECT/CT images of the same tumours demonstrating the highly variable uptake seen in this tumour type. Tumours are denoted by yellow arrowheads. The tumours in (A/E) and (B/F) were qualitatively considered cold, whereas the tumours in (C/G) and (D/H) were qualitatively considered hot. Reprinted, under a CC BY 4.0 license, from reference [99].
Cancers 17 01773 g002

4.2. Imaging Metabolism Using Magnetic Resonance

4.2.1. Magnetic Resonance Spectroscopy (MRS)

Proton MR spectroscopy (1H-MRS) is based on the principles of nuclear magnetic resonance and offers a non-radioactive alternative to detect tissue metabolic signatures in vivo. The method probes metabolites at a high concentration due to the low sensitivity compared to PET, is highly susceptible to magnetic field inhomogeneity and motion artifacts, and has a low spatial resolution, which limits its role in evaluating metabolic heterogeneity [26]. Studies investigating the role of this technique in characterising renal masses have observed an increase in both choline and lipid concentrations in malignant compared to benign lesions and with increasing RCC grade [100,101,102]. However, metabolites involved in oxidative metabolism are largely below the limit of detection, with the exception of elevated fumarate in HLRCC syndrome-associated renal tumours [24] and in FHd-RCC [25,103]. However, metabolic MRI approaches could provide important tools to study intratumoural heterogeneity in the absence of ionising radiation. New complementary spectroscopic approaches are being developed which are robust to magnetic field disruptions and motion artifacts, detect metabolic conversions beyond glucose uptake, and provide increased spatial resolution [27,104]. Below, we describe two techniques which have been introduced into the clinical setting and have recently been applied to assess metabolism in renal tumours.

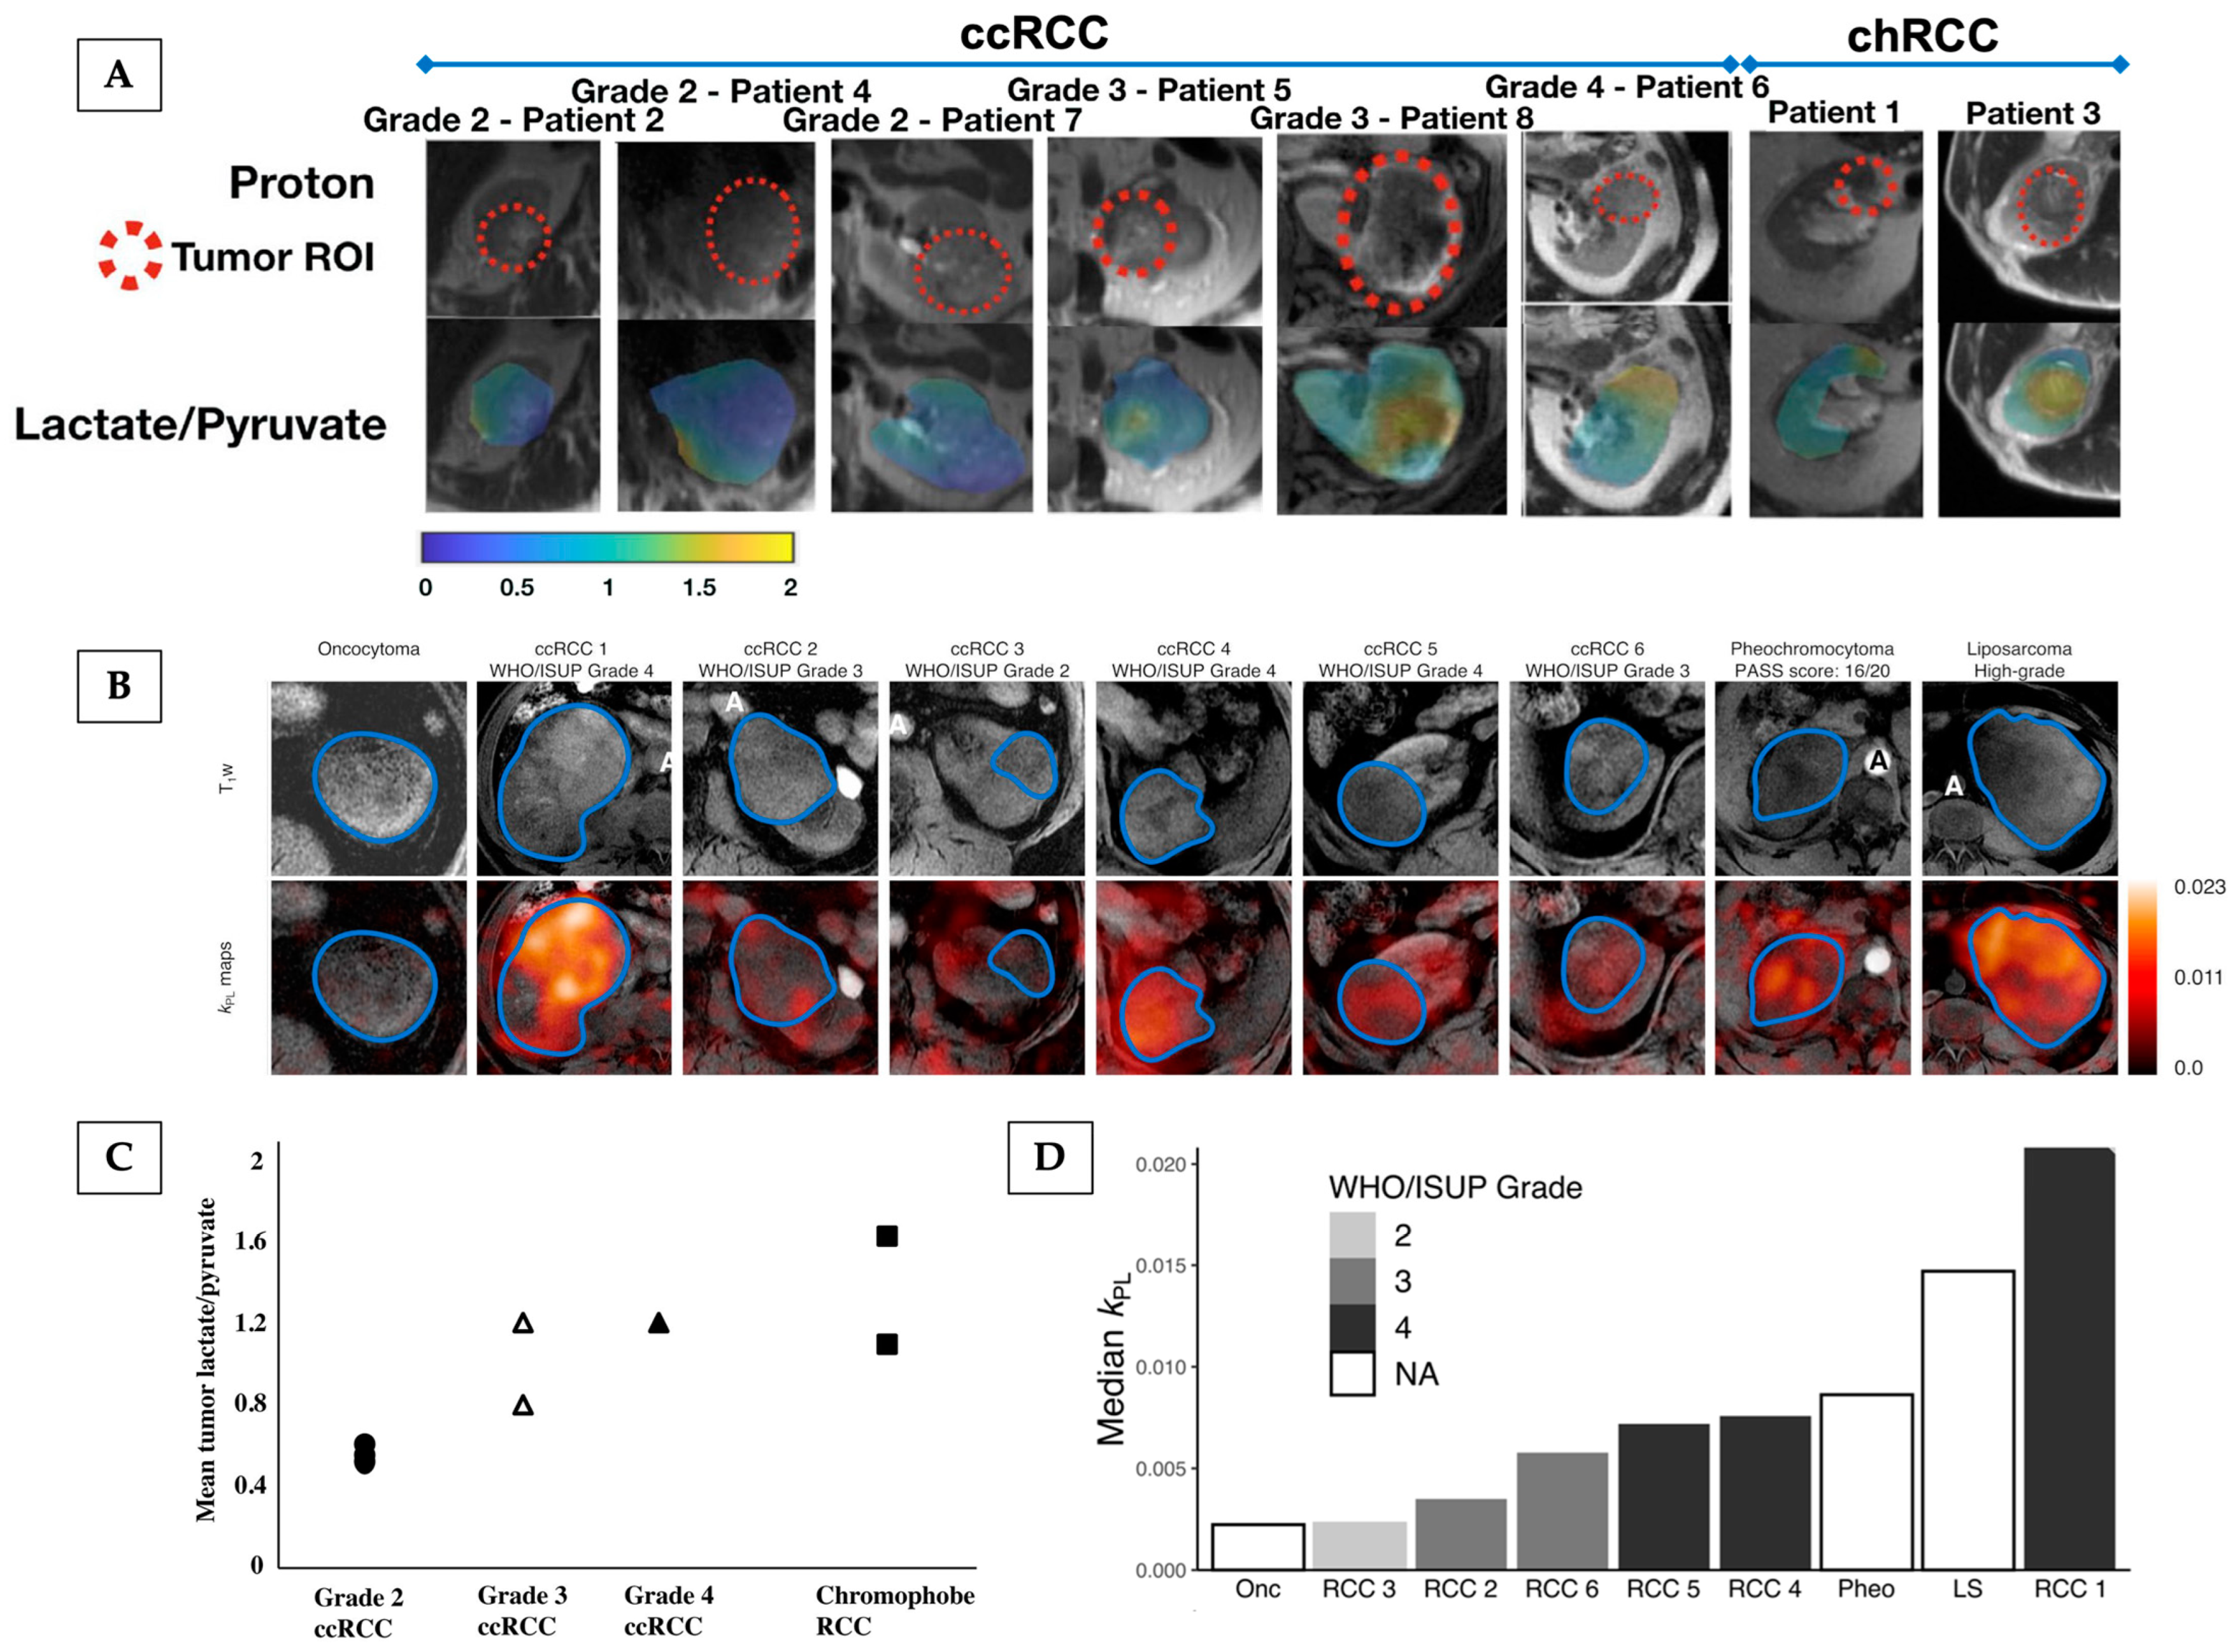
4.2.2. Hyperpolarised [1-13C]Pyruvate MRI

Hyperpolarised [1-13C]pyruvate MRI is an emerging clinical imaging technique based on the intravenous injection of non-radioactive carbon-13 (13C)-labelled pyruvate after it has undergone a process termed hyperpolarisation; this process significantly increases the sensitivity for detection, therefore facilitating tissue metabolism to be detected in real time and non-invasively. Hyperpolarisation refers to a transient increase in nuclear spins aligned with the main magnetic field, which can be achieved via several methods. Dynamic nuclear polarisation (DNP) is the current leading approach for clinical applications and involves mixing 13C-pyruvate with an electron-rich compound or free radical before placing this sample into the extreme physical conditions of a strong magnetic field (3–7 T) close to absolute zero (1 K) while irradiating with microwaves for 1–2 h. The resulting effect is the transfer of electron polarisation to the 13C-nuclei in pyruvate, which significantly amplifies the signal-to-noise ratio (SNR) of the hyperpolarised 13C-pyruvate on MR spectroscopy and imaging more than 10,000-fold, thus facilitating the detection of metabolism [27]. This offers a non-invasive way to detect dynamic metabolism through the conversion of hyperpolarised 13C-pyruvate into other metabolites, including 13C-lactate as a measure of the Warburg effect and 13C-bicarbonate as a biomarker of entry into the TCA cycle [105]. The enhanced signal from hyperpolarisation is sufficient to image for several minutes but this decreases rapidly over time due to relaxation effects and the irretrievable loss of signal as the images are acquired, and therefore, an on-site hyperpolariser is required. However, the short acquisition times that this necessitates are beneficial for clinical translation and are enabled by rapid imaging sequences [106,22].
The first clinical study was published in 2013, showing that prostate cancer exhibited a higher pyruvate-to-lactate conversion compared to surrounding normal tissue [107]. In imaging of kidney cancer, HP 13C-MRI has shown promise preclinically, where lactate production has been identified as a biomarker for tumour aggressiveness in RCC cell lines and orthotopic murine tumours [108,109] and is increased in patient-derived ccRCCs compared to benign kidney tumours (two ROs and one angiomyolipoma), incubated in a tissue culture bioreactor [110]. This difference was shown to be due to an increase in a subunit of the enzyme lactate dehydrogenase (LDHA), which catalyses the exchange reaction between pyruvate and lactate, and the lactate exporter or monocarboxylate transporter 4 (MCT4) [110]. Both LDHA and MCT4 are targets for HIF transcriptional programs and have prognostic value in RCC, where upregulation predicts worse survival outcomes [111,112].
Clinical kidney cancer imaging using HP 13C-MRI has reported intratumoural metabolic heterogeneity in a single case of ccRCC [113]. The region with the highest 13C-lactate signal corresponded to the highest lactate as determined via mass spectrometry (MS) on postoperative tissue sample analysis, as shown in Figure 3.
Figure 3. HP 13C-MRI detected intratumoural metabolic heterogeneity in a patient with ccRCC. (A) The post-nephrectomy kidney axially sliced at the level of the renal hilum from where 15 tissue samples were collected (1–10 tumour samples and 11–15 non-tumour samples). (BD) Images from HP 13C-MRI acquisition: (B) the corresponding spectra of the arrowed region “5” on (A) image. The spectrum shows peaks corresponding to lactate and pyruvate. (C) An interpolated HP 13C-pyruvate map overlaid on a T2w image. (D) An interpolated HP 13C-lactate map overlaid on a T2w image. (E) A bar chart of liquid chromatography–mass spectrometry analysis of the multiregional samples from the tumour. The highest level of lactate accumulation was found in region “5” (red bar), consistence with the findings of the HP 13C-lactate map in (D). Other coloured bars correspond to coloured circles in (A). Reprinted, under a CC BY 4.0 license, from reference [113].
Cancers 17 01773 g003
Tang et al. [114] imaged 11 patients with kidney tumours, in which a trend towards a higher lactate/pyruvate ratio in high-grade compared to low-grade ccRCCs was demonstrated, as well as the highest lactate/pyruvate ratio being present in the aggressive type of chRCC. Ursprung et al. [115] showed that 13C-lactate labelling could be used to distinguish high-grade ccRCC from lower-grade tumours, and that lactate labelling correlated with the pyruvate transporter (MCT1), which was shown to be a predictor of overall and disease-free survival. Furthermore, a case of a renal oncocytoma displayed the lowest pyruvate-to-lactate conversion compared to a range of malignant masses, including ccRCCs, suggesting that HP 13C-MRI may be a potential clinical imaging tool for discriminating benign from malignant kidney tumours [115]as demonstrated in Figure 4.
The technique has also shown promise in treatment response monitoring. While this has been unexplored in RCC so far, 13C-lactate generation was identified as a potential biomarker of treatment response in other cancers. In prostate and breast cancer, a decrease in tumour 13C-lactate labelling was demonstrated after several weeks of treatment [116,117]. Furthermore, the technique detected responses to neoadjuvant therapy in breast cancer only 7–11 days after treatment and has outperformed conventional proton MRI in distinguishing responders from non-responders [118].
Figure 4. HP 13C-MRI demonstrating intertumoural heterogeneity in kidney cancer, showing the potential to probe kidney tumour aggressiveness. (A,B) depict anatomical and HP 13C-MRI images from patients bearing renal masses, outlined with a dashed red line in (A) and blue line in (B), who were recruited to studies performed by Tang et al. [114] (A) and Ursprung et al. [115] (B). Tang et al. [114] measured the HP 13C-lactate/pyruvate ratio, while Ursprung et al. [115] calculated the kPL as measures of pyruvate-to-lactate metabolism. (C) A dot plot representing the mean tumour lactate/pyruvate ratio in the 8 patients stratified by tumour histology and grade, as illustrated in (A). There is a trend toward higher lactate/pyruvate ratios in high-grade (grades 3 and 4) ccRCCs compared with low-grade (grade 2) ccRCCs. Both chRCCs demonstrate a relatively high mean tumour lactate/pyruvate ratio; the chRCC with the highest lactate/pyruvate ratio had a pathologic finding of microscopic necrosis associated with aggressive biology. (D) Bar plots representing the median kPL across WHO/ISUP grades, where increasing tumour grade was associated with increased metabolic activity in ccRCC. The phaeochromocytoma and liposarcoma showed metabolic activity comparable to grade 4 ccRCC. The benign renal oncocytoma showed the lowest metabolic activity. ccRCC = clear cell renal cell carcinoma; chRCC = chromophobe renal cell carcinoma; kPL = apparent exchange rate constant for pyruvate-to-lactate conversion; LS = liposarcoma; Onc = oncocytoma; Pheo = phaeochromocytoma; RCC = renal cell carcinoma; WHO/ISUP = World Health Organisation/International Society of Urological Pathology. Reprinted, under a CC BY 4.0 license from reference [115], and under a CC BY license (License number: 5961980546793) as mediated by Copyright Clearance Center, from reference [114].
Cancers 17 01773 g004
While findings from initial clinical studies on HP 13C-MRI are highly promising, several challenges need to be addressed before it can be used as a routine clinical imaging tool. Currently, the technique requires a dedicated pharmacy facility, bespoke consumables (termed pharmacy kits), and a team of trained professionals with a broad range of skills, and overall remains expensive. However, there are currently ongoing efforts to address these technical challenges, such as the development of new polarisation methods with improved ease of use and reliability, centralisation of consumable filling, and the development of standardised acquisition and analysis methods. Finally, clinical studies which enrol larger patient cohorts and compare the technique to standard clinical imaging could provide the evidence required for the potential use of HP 13C-MRI as a routine clinical tool [119].

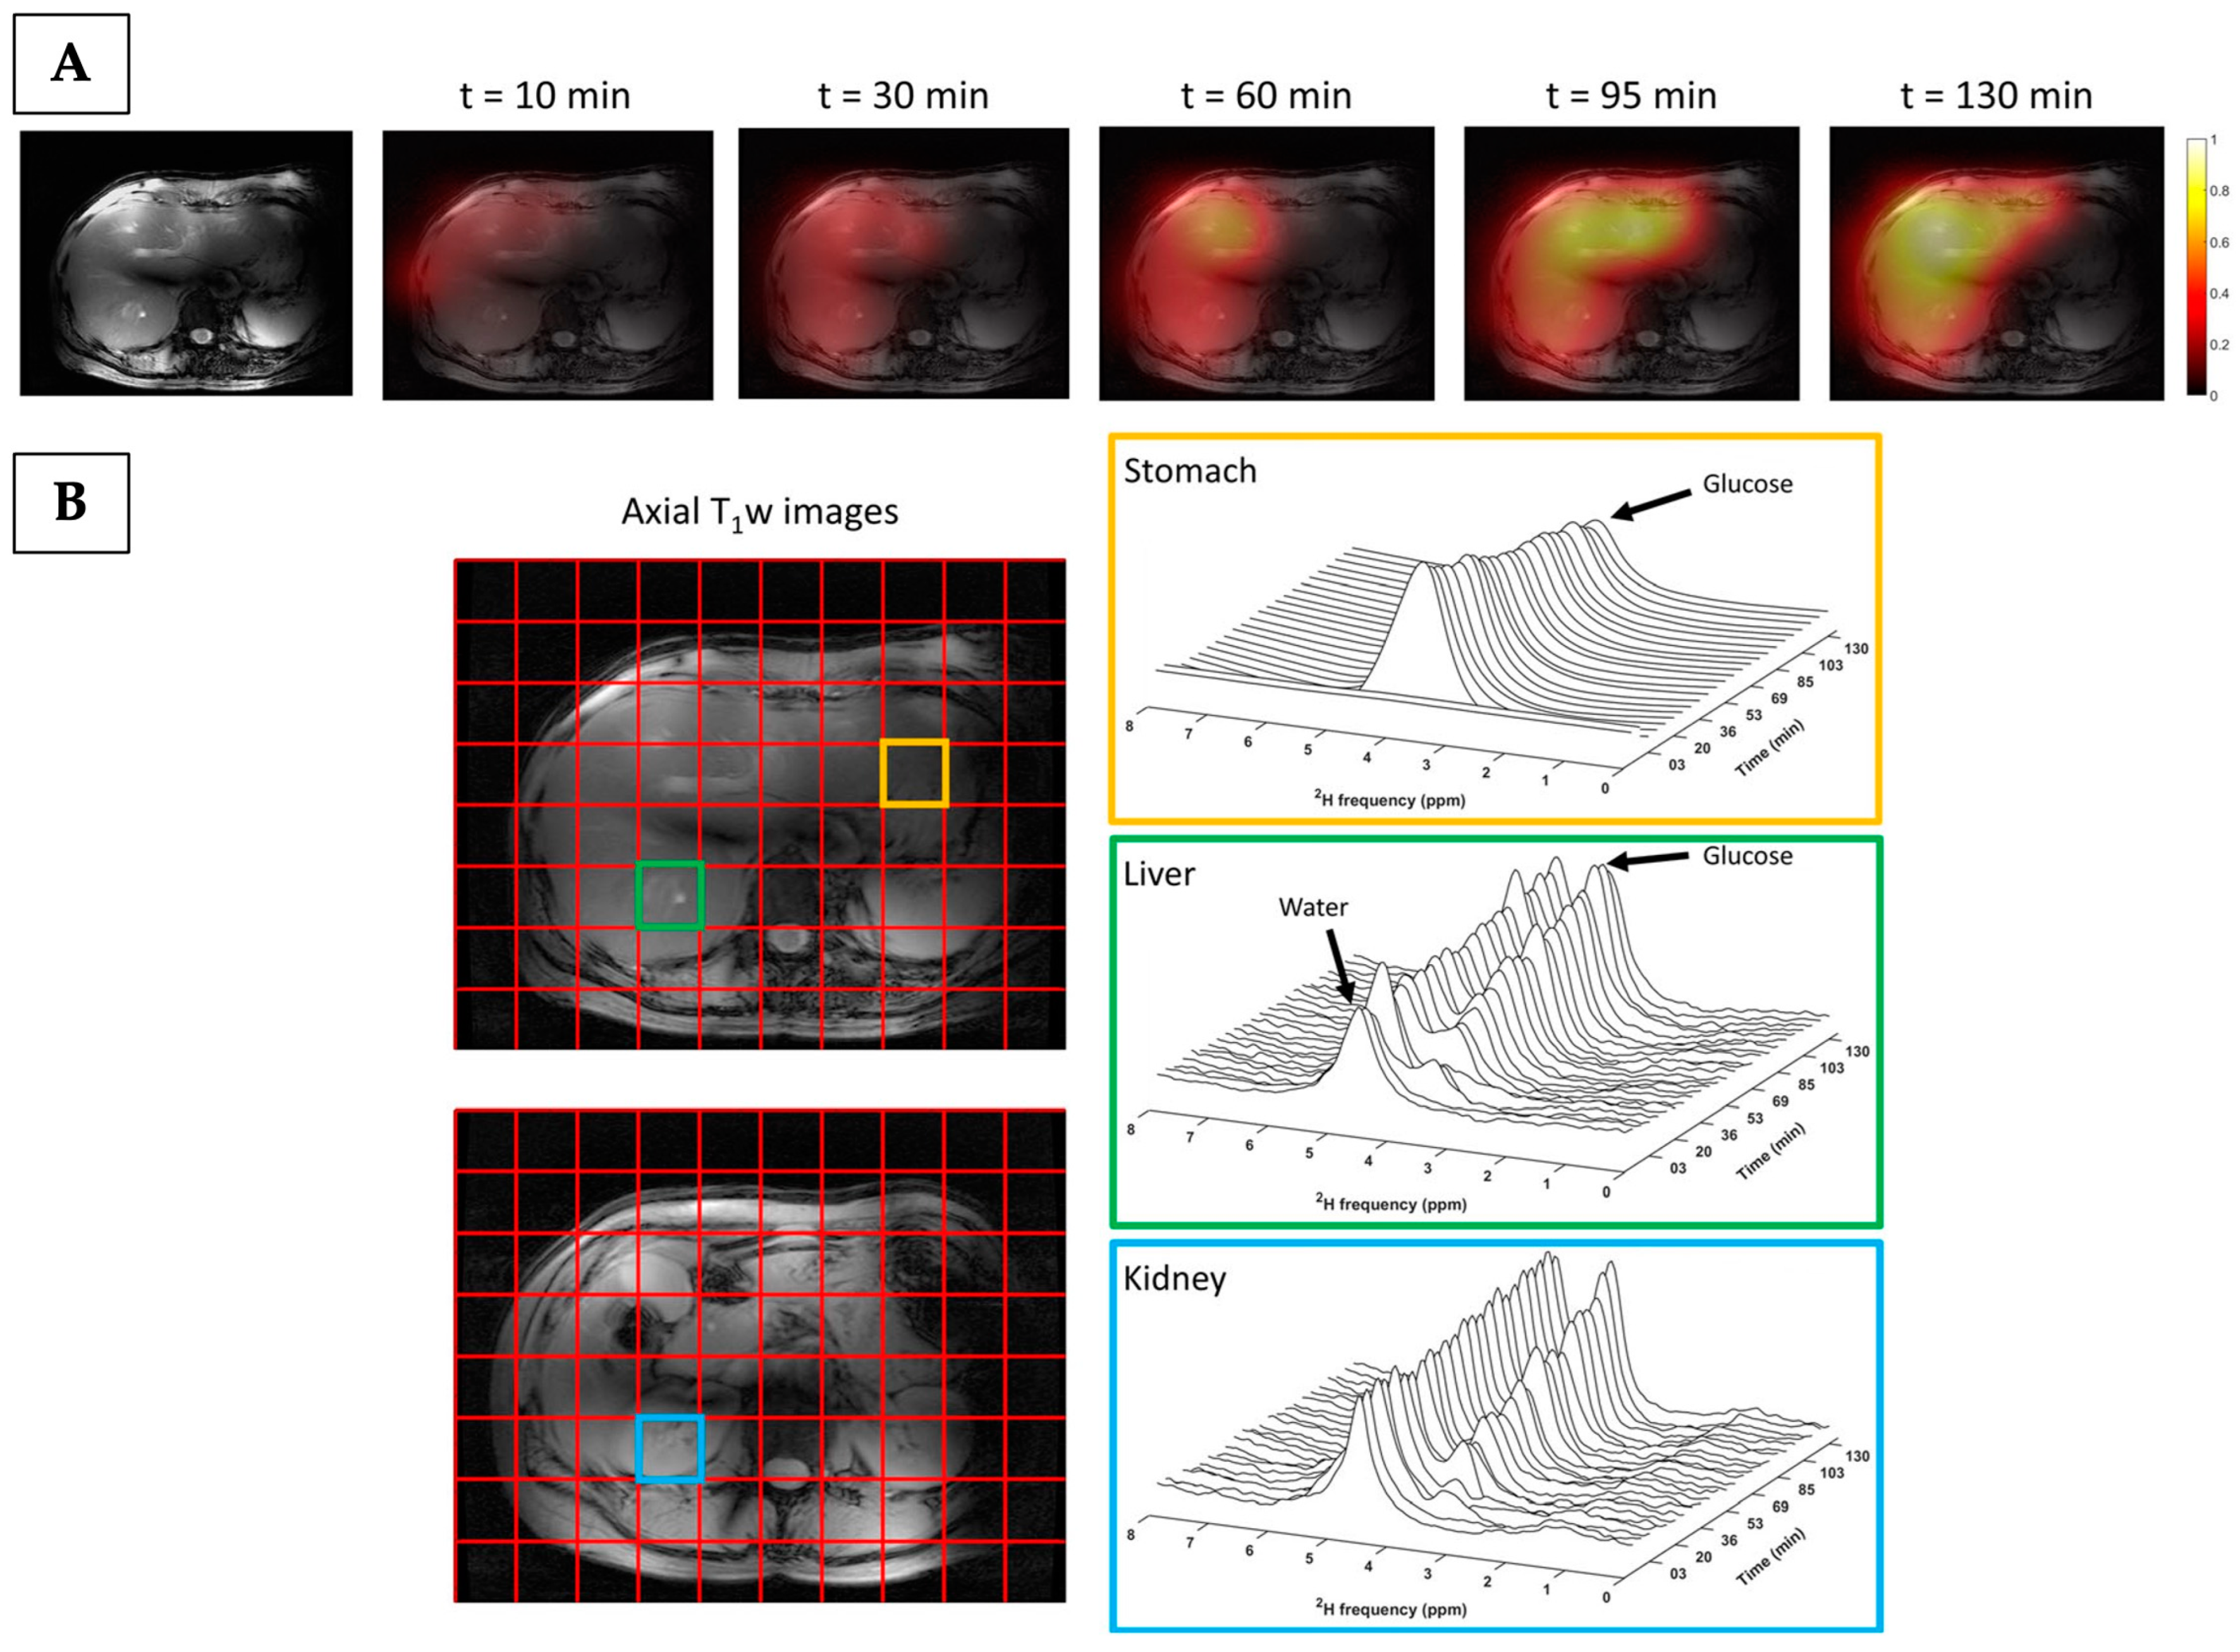
4.2.3. Deuterium Metabolic Imaging

More recently, deuterium (2H) MRS imaging (also termed deuterium metabolic imaging or DMI) has been introduced as a novel metabolic imaging technique, with the first-in-human study published in 2018 [120]. The technique uses endogenous 2H-labelled probes such as [6,6′-2H2]glucose to non-invasively detect tissue metabolism using spectroscopic imaging. The first study was performed at a high field strength (7 T) by De Feyter et al., who imaged a patient with glioblastoma after oral administration of [6,6′-2H2]glucose, detecting increased labelling of lactate and decreased labelling of the combined glutamate/glutamine peak (Glx as a surrogate measure for TCA flux) in the tumour compared to the adjacent normal-appearing brain parenchyma [120]. This finding was confirmed in a small cohort of patients with brain tumours of varying aggressiveness [121], and subsequent studies have shown the feasibility of the technique at clinical field strength (3 T) for neurological imaging [122,123]. It has recently been translated to abdominal imaging to assess 2H-glucose uptake and metabolism in the liver and kidney [124,125,126], as depicted in Figure 5.
Figure 5. Deuterium metabolic imaging of the stomach, liver, and kidney in a healthy volunteer, acquired between 0 and 130 min after oral administration of [6,6′-2H2]glucose. (A) Axial T1-weighted images and maps of deuterated glucose signal overlaid on anatomical MRI images across the time course. The deuterated glucose signal increases over time. (B) The DMI grid overlaid on axial T1-weighted images, with annotated voxels of interest located in the stomach (orange), liver (green), and right kidney (blue). The corresponding deuterium spectra acquired over time and extracted from each of the voxels are shown. In the stomach, the glucose signal was observed immediately after intake and slowly decayed thereafter. In comparison, the deuterated glucose signal (and to a lesser extent water signal) increased over time in voxels located within the liver and kidney. Reprinted, under a CC BY 4.0 license, from reference [124].
Cancers 17 01773 g005
Deuterium metabolic imaging offers several advantages as a potential clinical imaging tool compared to other spectroscopic methods: the probes can be administered orally which is preferential for patients, deuterium has a low natural abundance which alleviates the need for the water and lipid suppression that is often required in 1H-MRS, deuterium has a short relaxation time which allows for signal averaging that enhances sensitivity and facilitates imaging over longer timescales [127,128], and DMI has lower technology costs compared to hyperpolarisation methods. However, the presence of the dominant signal from oral 2H-glucose within the stomach can restrict the abdominal field-of-view and affect quantification [126,129], and this will need to be addressed if DMI is to be applied more widely for non-invasive imaging of glucose metabolism in renal cancer.

5. Conclusion and Future Direction

Management of patients with localised kidney tumours has several unmet clinical challenges, including the low specificity of standard-of-care clinical imaging for assessing the aggressiveness of an incidental renal mass, the sampling error and limitations of renal mass biopsy, the lack of predictive clinical biomarkers, and the availability of methods to monitor early treatment response accurately. The metabolic reprogramming that is characteristic of different renal tumour subtypes, which in turn correlates with aggressiveness, offers an opportunity to better stratify patients. In addition, the marked intertumoural and intratumoural heterogeneity of kidney tumours is ideally probed using non-invasive clinical imaging methods. Therefore, metabolic MRI techniques provide an opportunity to probe both metabolic dysregulation and its heterogeneity, with the possibility of improving patient morbidity and mortality, as well as reducing the economic burdens of surgery and anticancer therapeutics [130]. While the current high costs prevent widespread adoption of this technology into clinical workflow today, these costs are likely to reduce with the introduction of new approaches for hyperpolarisation. In time, these costs may become similar to those incurred for utilising PET and can be offset by the potential savings of using imaging to replace expensive therapeutics that are ineffective, which represents a significant burden on healthcare systems [130]. Therefore, metabolic MRI techniques have a promising future in renal cancer research and could address some of the unmet clinical needs in this field (Table 3).

Author Contributions

Conceptualization, I.H.-M., G.D.S. and F.A.G.; investigation, I.H.-M.; resources, G.D.S. and F.A.G.; writing—original draft preparation, I.H.-M.; writing—review and editing, I.H.-M., G.D.S. and F.A.G.; supervision, G.D.S. and F.A.G.; project administration, I.H.-M.; funding acquisition, G.D.S. and F.A.G. All authors have read and agreed to the published version of the manuscript.

Funding

This research was funded by Cancer Research UK (EDDPMA-May22/100068, C19212/A27150) and is supported by the NIHR Cambridge Biomedical Centre (BRC 1215 20014) and the Cancer Research UK Cambridge Centre (RQAG/119).

Institutional Review Board Statement

Not applicable.

Informed Consent Statement

Not applicable.

Data Availability Statement

Not applicable.

Acknowledgments

We acknowledge administrative and technical support from the Advanced Cancer Imaging and Urological Malignancies programmes, the Cancer Research UK Cambridge Centre, and radiographers of the Magnetic Resonance Spectroscopy Unit, Addenbrooke’s Hospital, Cambridge. The researchers are funded by Cancer Research UK and the NIHR Cambridge Biomedical Research Centre.

Conflicts of Interest

GDS has received educational grants from Pfizer, AstraZeneca, and Intuitive Surgical; consultancy fees from Pfizer, MSD, EUSA Pharma, and CMR Surgical; travel expenses from MSD and Pfizer; speaker fees from Pfizer; and is Clinical Lead (urology) of the National Kidney Cancer Audit and Topic Advisor for the NICE kidney cancer guideline. FAG has received research grants from GlaxoSmithKline, AstraZeneca, and NVision, and research support and conference support from GE Healthcare.

Abbreviations

ASactive surveillance
BHDBirt–Hogg–Dubé
CAcarbonic anhydrase
CAIXcarbonic anhydrase 9
chRCCchromophobe renal cell carcinoma
CSScancer-specific survival
DFSdisease-free survival
DMIdeuterium metabolic imaging
DNPdynamic nuclear polarisation
DWIdiffusion-weighted imaging
EMAEuropean Medicines Agency
FDG-PETfluorine-18-labelled fluorodeoxyglucose in conjunction with positron emission tomography
FHd-RCCfumarate hydratase-deficient renal cell carcinoma
FSEfast spin echo
Glxglutamine/glutamate
GREgradient echo
HIFhypoxia-inducible factor
HLRCChereditary leiomyomatosis and renal cell cancer
HP 13C-MRIhyperpolarised [1-13C]pyruvate MRI
IHCimmunohistochemistry
LDHAlactate dehydrogenase A
MCT1monocarboxylate transporter 1
MPCmitochondrial pyruvate carrier
MRSmagnetic resonance spectroscopy
mtDNAmitochondrial DNA
OSoverall survival
OXPHOSoxidative phosphorylation
PDHpyruvate dehydrogenase
PFSprogression-free survival
pRCCpapillary renal cell carcinoma
pTNMpathological tumour node metastasis staging
RCCrenal cell carcinoma
RECISTResponse Evaluation Criteria in Solid Tumours
RMBrenal mass biopsy
ROrenal oncocytoma
SDHd-RCCsuccinate dehydrogenase-deficient renal cell carcinoma
SNRsignal-to-noise ratio
SPECTSingle-Photon Emission Computed Tomography
SPGRspoiled gradient
SSFSEsingle-shot fast spin echo
TCAtricarboxylic acid
TKItyrosine kinase
TSCtuberous sclerosis complex
VHLvon Hippel–Lindau
WHOWorld Health Organisation

References

  1. Bukavina, L.; Bensalah, K.; Bray, F.; Carlo, M.; Challacombe, B.; Karam, J.A.; Kassouf, W.; Mitchell, T.; Montironi, R.; O’Brien, T.; et al. Epidemiology of Renal Cell Carcinoma: 2022 Update. Eur. Urol. 2022, 82, 529–542. [Google Scholar] [CrossRef] [PubMed]
  2. Stewart, G.D.; Klatte, T.; Cosmai, L.; Bex, A.; Lamb, B.W.; Moch, H.; Sala, E.; Siva, S.; Porta, C.; Gallieni, M. The Multispeciality Approach to the Management of Localised Kidney Cancer. Lancet 2022, 400, 523–534. [Google Scholar] [CrossRef]
  3. Gordetsky, J.; Zarzour, J. Correlating Preoperative Imaging with Histologic Subtypes of Renal Cell Carcinoma and Common Mimickers. Curr. Urol. Rep. 2016, 17, 52. [Google Scholar] [CrossRef] [PubMed]
  4. Rossi, S.H.; Blick, C.; Handforth, C.; Brown, J.E.; Stewart, G.D. Essential Research Priorities in Renal Cancer: A Modified Delphi Consensus Statement. Eur. Urol. Focus. 2020, 6, 991–998. [Google Scholar] [CrossRef] [PubMed]
  5. Harris, C.R.; Whitson, J.M.; Meng, M.V. Under-Grading of <4 cm Renal Masses on Renal Biopsy. BJU Int. 2012, 110, 794–797. [Google Scholar] [CrossRef]
  6. Patel, H.D.; Druskin, S.C.; Rowe, S.P.; Pierorazio, P.M.; Gorin, M.A.; Allaf, M.E. Surgical Histopathology for Suspected Oncocytoma on Renal Mass Biopsy: A Systematic Review and Meta-Analysis. BJU Int. 2017, 119, 661–666. [Google Scholar] [CrossRef]
  7. Patel, H.D.; Johnson, M.H.; Pierorazio, P.M.; Sozio, S.M.; Sharma, R.; Iyoha, E.; Bass, E.B.; Allaf, M.E. Diagnostic Accuracy and Risks of Biopsy in the Diagnosis of a Renal Mass Suspicious for Localized Renal Cell Carcinoma: Systematic Review of the Literature. J. Urol. 2016, 195, 1340–1347. [Google Scholar] [CrossRef]
  8. Fallara, G.; Larcher, A.; Dabestani, S.; Fossati, N.; Järvinen, P.; Nisen, H.; Gudmundsson, E.; Lam, T.B.; Marconi, L.; Fernandéz-Pello, S.; et al. Recurrence Pattern in Localized RCC: Results from a European Multicenter Database (RECUR). Urol. Oncol. Semin. Orig. Investig. 2022, 40, e11–e494. [Google Scholar] [CrossRef]
  9. Ko, C.-C.; Yeh, L.-R.; Kuo, Y.-T.; Chen, J.-H. Imaging Biomarkers for Evaluating Tumor Response: RECIST and Beyond. Biomark. Res. 2021, 9, 52. [Google Scholar] [CrossRef]
  10. Hanahan, D. Hallmarks of Cancer: New Dimensions. Cancer Discov. 2022, 12, 31–46. [Google Scholar] [CrossRef]
  11. Rathmell, W.K.; Rathmell, J.C.; Linehan, W.M. Metabolic Pathways in Kidney Cancer: Current Therapies and Future Directions. JCO 2018, 36, 3540–3546. [Google Scholar] [CrossRef] [PubMed]
  12. Ricketts, C.J.; De Cubas, A.A.; Fan, H.; Smith, C.C.; Lang, M.; Reznik, E.; Bowlby, R.; Gibb, E.A.; Akbani, R.; Beroukhim, R.; et al. The Cancer Genome Atlas Comprehensive Molecular Characterization of Renal Cell Carcinoma. Cell Rep. 2018, 23, 313–326.e5. [Google Scholar] [CrossRef] [PubMed]
  13. Linehan, W.M.; Ricketts, C.J. The Cancer Genome Atlas of Renal Cell Carcinoma: Findings and Clinical Implications. Nat. Rev. Urol. 2019, 16, 539–552. [Google Scholar] [CrossRef]
  14. Le, A. (Ed.) The Heterogeneity of Cancer Metabolism; Advances in Experimental Medicine and Biology; Springer International Publishing: Cham, Switzerland, 2021; Volume 1311, ISBN 978-3-030-65767-3. [Google Scholar]
  15. Yong, C.; Stewart, G.D.; Frezza, C. Oncometabolites in Renal Cancer. Nat. Rev. Nephrol. 2020, 16, 156–172. [Google Scholar] [CrossRef]
  16. Linehan, W.M.; Rouault, T.A. Molecular Pathways: Fumarate Hydratase -Deficient Kidney Cancer—Targeting the Warburg Effect in Cancer. Clin. Cancer Res. 2013, 19, 3345–3352. [Google Scholar] [CrossRef]
  17. Xiao, Y.; Clima, R.; Busch, J.; Rabien, A.; Kilic, E.; Villegas, S.L.; Timmermann, B.; Attimonelli, M.; Jung, K.; Meierhofer, D. Decreased Mitochondrial DNA Content Drives OXPHOS Dysregulation in Chromophobe Renal Cell Carcinoma. Cancer Res. 2020, 80, 3830–3840. [Google Scholar] [CrossRef]
  18. Kürschner, G.; Zhang, Q.; Clima, R.; Xiao, Y.; Busch, J.F.; Kilic, E.; Jung, K.; Berndt, N.; Bulik, S.; Holzhütter, H.G.; et al. Renal oncocytoma characterized by the defective complex I of the respiratory chain boosts the synthesis of the ROS scavenger glutathione. Oncotarget 2017, 8, 105882–105904. [Google Scholar] [CrossRef]
  19. Karivedu, V.; Jain, A.L.; Eluvathingal, T.J.; Sidana, A. Role of Positron Emission Tomography Imaging in Metabolically Active Renal Cell Carcinoma. Curr. Urol. Rep. 2019, 20, 56. [Google Scholar] [CrossRef] [PubMed]
  20. Wilson, M.P.; Katlariwala, P.; Murad, M.H.; Abele, J.; McInnes, M.D.F.; Low, G. Diagnostic Accuracy of 99mTc-Sestamibi SPECT/CT for Detecting Renal Oncocytomas and Other Benign Renal Lesions: A Systematic Review and Meta-Analysis. Abdom. Radiol. 2020, 45, 2532–2541. [Google Scholar] [CrossRef]
  21. Basile, G.; Fallara, G.; Verri, P.; Uleri, A.; Chiti, A.; Gianolli, L.; Pepe, G.; Tedde, A.; Algaba, F.; Territo, A.; et al. The Role of 99mTc-Sestamibi Single-Photon Emission Computed Tomography/Computed Tomography in the Diagnostic Pathway for Renal Masses: A Systematic Review and Meta-analysis. Eur. Urol. 2024, 85, 63–71. [Google Scholar] [CrossRef]
  22. Zaccagna, F.; Grist, J.T.; Deen, S.S.; Woitek, R.; Lechermann, L.M.; McLean, M.A.; Basu, B.; Gallagher, F.A. Hyperpolarized Carbon-13 Magnetic Resonance Spectroscopic Imaging: A Clinical Tool for Studying Tumour Metabolism. BJR 2018, 91, 20170688. [Google Scholar] [CrossRef]
  23. Miller, J.J.; Grist, J.T.; Serres, S.; Larkin, J.R.; Lau, A.Z.; Ray, K.; Fisher, K.R.; Hansen, E.; Tougaard, R.S.; Nielsen, P.M.; et al. 13C Pyruvate Transport Across the Blood-Brain Barrier in Preclinical Hyperpolarised MRI. Sci. Rep. 2018, 8, 15082. [Google Scholar] [CrossRef] [PubMed]
  24. Wu, G.; Liu, G.; Wang, J.; Pan, S.; Luo, Y.; Xu, Y.; Kong, W.; Sun, P.; Xu, J.; Xue, W.; et al. MR Spectroscopy for Detecting Fumarate Hydratase Deficiency in Hereditary Leiomyomatosis and Renal Cell Carcinoma Syndrome. Radiology 2022, 305, 631–639. [Google Scholar] [CrossRef] [PubMed]
  25. Pan, S.; Wang, J.; Liu, G.; Zhang, J.; Song, Y.; Kong, W.; Zhou, Y.; Wu, G. Factors Influencing the Detection Rate of Fumarate Peak in 1H MR Spectroscopy of Fumarate Hydratase-Deficient Renal Cell Carcinoma at 3 T MRI. Clin. Clin. Radiol. Radiol. 2024, 79, e80–e88. [Google Scholar] [CrossRef] [PubMed]
  26. Tognarelli, J.M.; Dawood, M.; Shariff, M.I.F.; Grover, V.P.B.; Crossey, M.M.E.; Cox, I.J.; Taylor-Robinson, S.D.; McPhail, M.J.W. Magnetic Resonance Spectroscopy: Principles and Techniques: Lessons for Clinicians. J. Clin. Exp. Hepatol. 2015, 5, 320–328. [Google Scholar] [CrossRef]
  27. Deen, S.S.; Rooney, C.; Shinozaki, A.; McGing, J.; Grist, J.T.; Tyler, D.J.; Serrão, E.; Gallagher, F.A. Hyperpolarized Carbon 13 MRI: Clinical Applications and Future Directions in Oncology. Radiol. Imaging Cancer 2023, 5, e230005. [Google Scholar] [CrossRef]
  28. Capitanio, U.; Bensalah, K.; Bex, A.; Boorjian, S.A.; Bray, F.; Coleman, J.; Gore, J.L.; Sun, M.; Wood, C.; Russo, P. Epidemiology of Renal Cell Carcinoma. Eur. Urol. 2019, 75, 74–84. [Google Scholar] [CrossRef]
  29. Capitanio, U.; Montorsi, F. Renal Cancer. Lancet 2016, 387, 894–906. [Google Scholar] [CrossRef]
  30. Escudier, B.; Porta, C.; Schmidinger, M.; Rioux-Leclercq, N.; Bex, A.; Khoo, V.; Grünwald, V.; Gillessen, S.; Horwich, A. Renal Cell Carcinoma: ESMO Clinical Practice Guidelines for Diagnosis, Treatment and Follow-Up. Ann. Oncol. 2019, 30, 706–720. [Google Scholar] [CrossRef]
  31. Athanazio, D.A.; Amorim, L.S.; da Cunha, I.W.; Leite, K.R.M.; da Paz, A.R.; de Paula Xavier Gomes, R.; Tavora, F.R.F.; Faraj, S.F.; Cavalcanti, M.S.; Bezerra, S.M. Classification of Renal Cell Tumors—Current Concepts and Use of Ancillary Tests: Recommendations of the Brazilian Society of Pathology. Surg. Exp. Pathol. 2021, 4, 4. [Google Scholar] [CrossRef]
  32. Moch, H.; Amin, M.B.; Berney, D.M.; Compérat, E.M.; Gill, A.J.; Hartmann, A.; Menon, S.; Raspollini, M.R.; Rubin, M.A.; Srigley, J.R.; et al. The 2022 World Health Organization Classification of Tumours of the Urinary System and Male Genital Organs—Part A: Renal, Penile, and Testicular Tumours. Eur. Urol. 2022, 82, 458–468. [Google Scholar] [CrossRef]
  33. Bhatt, N.R.; Davis, N.F.; Flynn, R.; McDermott, T.; Thornhill, J.A.; Manecksha, R.P. Dilemmas in Diagnosis and Natural History of Renal Oncocytoma and Implications for Management. Can. Urol. Assoc. J. 2015, 9, E709–E712. [Google Scholar] [CrossRef]
  34. Warren, A.Y.; Harrison, D. WHO/ISUP Classification, Grading and Pathological Staging of Renal Cell Carcinoma: Standards and Controversies. World J. Urol. 2018, 36, 1913–1926. [Google Scholar] [CrossRef]
  35. Stillebroer, A.B.; Mulders, P.F.A.; Boerman, O.C.; Oyen, W.J.G.; Oosterwijk, E. Carbonic Anhydrase IX in Renal Cell Carcinoma: Implications for Prognosis, Diagnosis, and Therapy. Eur. Urol. 2010, 58, 75–83. [Google Scholar] [CrossRef]
  36. Angori, S.; Lobo, J.; Moch, H. Papillary Renal Cell Carcinoma: Current and Controversial Issues. Curr. Opin. Urol. 2022, 32, 344–351. [Google Scholar] [CrossRef]
  37. Lindgren, D.; Sjölund, J.; Axelson, H. Tracing Renal Cell Carcinomas Back to the Nephron. Trends Cancer 2018, 4, 472–484. [Google Scholar] [CrossRef]
  38. Saleeb, R.M.; Brimo, F.; Farag, M.; Rompré-Brodeur, A.; Rotondo, F.; Beharry, V.; Wala, S.; Plant, P.; Downes, M.R.; Pace, K.; et al. Toward Biological Subtyping of Papillary Renal Cell Carcinoma With Clinical Implications Through Histologic, Immunohistochemical, and Molecular Analysis. Am. J. Surg. Pathol. 2017, 41, 1618–1629. [Google Scholar] [CrossRef]
  39. Moch, H.; Ohashi, R. Chromophobe Renal Cell Carcinoma: Current and Controversial Issues. Pathology 2021, 53, 101–108. [Google Scholar] [CrossRef]
  40. Wobker, S.E.; Williamson, S.R. Modern Pathologic Diagnosis of Renal Oncocytoma. J. Kidney Cancer VHL 2017, 4, 1–12. [Google Scholar] [CrossRef]
  41. Lobo, J.; Ohashi, R.; Amin, M.B.; Berney, D.M.; Compérat, E.M.; Cree, I.A.; Gill, A.J.; Hartmann, A.; Menon, S.; Netto, G.J.; et al. WHO 2022 Landscape of Papillary and Chromophobe Renal Cell Carcinoma. Histopathology 2022, 81, 426–438. [Google Scholar] [CrossRef]
  42. Vasudev, N.S.; Wilson, M.; Stewart, G.D.; Adeyoju, A.; Cartledge, J.; Kimuli, M.; Datta, S.; Hanbury, D.; Hrouda, D.; Oades, G.; et al. Challenges of Early Renal Cancer Detection: Symptom Patterns and Incidental Diagnosis Rate in a Multicentre Prospective UK Cohort of Patients Presenting with Suspected Renal Cancer. BMJ Open 2020, 10, e035938. [Google Scholar] [CrossRef]
  43. Powles, T.; Albiges, L.; Bex, A.; Comperat, E.; Grünwald, V.; Kanesvaran, R.; Kitamura, H.; McKay, R.; Porta, C.; Procopio, G.; et al. Renal Cell Carcinoma: ESMO Clinical Practice Guideline for Diagnosis, Treatment and Follow-Up. Ann. Oncol. 2024, 35, 692–706. [Google Scholar] [CrossRef]
  44. Sohaib, A.; Cook, P. Renal and adrenal tumours. In Recommendations for Cross-Sectional Imaging in Cancer Management, 2nd ed.; The Royal College of Radiologists: London, UK, 2014. [Google Scholar]
  45. Wang, Z.J.; Davenport, M.S.; Silverman, S.G.; Chandarana, H.; Doshi, A.; Israel, G.M.; Leyendecker, J.R.; Pedrosa, I.; Raman, S.; Remer, E.M. MRI Renal Mass Protocol v1.0. Society of Abdominal Radiology Disease Focused Panel on Renal Cell Carcinoma. Available online: https://abdominalradiology.org/wp-content/uploads/2020/11/RCC.MRIprotocolfinal-7-15-17.pdf (accessed on 21 May 2025).
  46. Davenport, M.S.; Chandarana, H.; Curci, N.E.; Doshi, A.; Kaffenberger, S.D.; Pedrosa, I.; Remer, E.M.; Schieda, N.; Shinagare, A.B.; Smith, A.D.; et al. Society of Abdominal Radiology Disease-Focused Panel on Renal Cell Carcinoma: Update on Past, Current, and Future Goals. Abdom. Radiol. 2018, 43, 2213–2220. [Google Scholar] [CrossRef]
  47. Tsili, A.C.; Moulopoulos, L.-A.; Varakarakis, I.M.; Argyropoulou, M.I. Cross-Sectional Imaging Assessment of Renal Masses with Emphasis on MRI. Acta Radiol. 2022, 63, 1570–1587. [Google Scholar] [CrossRef]
  48. Pedrosa, I.; Cadeddu, J.A. How We Do It: Managing the Indeterminate Renal Mass with the MRI Clear Cell Likelihood Score. Radiology 2022, 302, 256–269. [Google Scholar] [CrossRef]
  49. Schieda, N.; Davenport, M.S.; Silverman, S.G.; Bagga, B.; Barkmeier, D.; Blank, Z.; Curci, N.E.; Doshi, A.M.; Downey, R.T.; Edney, E.; et al. Multicenter Evaluation of Multiparametric MRI Clear Cell Likelihood Scores in Solid Indeterminate Small Renal Masses. Radiology 2022, 303, 590–599. [Google Scholar] [CrossRef]
  50. Brierley, J.D.; Gospodarowicz, M.K.; Wittekind, C. (Eds.) BTNM Classification of Malignant Tumours, 8th ed.; Wiley-Blackwell: Hoboken, NJ, USA, 2017; ISBN 978-1-119-26354-8. [Google Scholar]
  51. Haas, N.B.; Manola, J.; Dutcher, J.P.; Flaherty, K.T.; Uzzo, R.G.; Atkins, M.B.; DiPaola, R.S.; Choueiri, T.K. Adjuvant Treatment for High-Risk Clear Cell Renal Cancer: Updated Results of a High-Risk Subset of the ASSURE Randomized Trial. JAMA Oncol. 2017, 3, 1249. [Google Scholar] [CrossRef]
  52. Motzer, R.J.; Haas, N.B.; Donskov, F.; Gross-Goupil, M.; Varlamov, S.; Kopyltsov, E.; Lee, J.L.; Melichar, B.; Rini, B.I.; Choueiri, T.K.; et al. Randomized Phase III Trial of Adjuvant Pazopanib Versus Placebo After Nephrectomy in Patients With Localized or Locally Advanced Renal Cell Carcinoma. J. Clin. Oncol. 2017, 35, 3916–3923. [Google Scholar] [CrossRef]
  53. Gross-Goupil, M.; Kwon, T.G.; Eto, M.; Ye, D.; Miyake, H.; Seo, S.I.; Byun, S.-S.; Lee, J.L.; Master, V.; Jin, J.; et al. Axitinib versus Placebo as an Adjuvant Treatment of Renal Cell Carcinoma: Results from the Phase III, Randomized ATLAS Trial. Ann. Oncol. 2018, 29, 2371–2378. [Google Scholar] [CrossRef]
  54. Synold, T.W.; Plets, M.; Tangen, C.M.; Heath, E.I.; Palapattu, G.S.; Mack, P.C.; Stein, M.N.; Meng, M.V.; Lara, P.; Vogelzang, N.J.; et al. Everolimus Exposure as a Predictor of Toxicity in Renal Cell Cancer Patients in the Adjuvant Setting: Results of a Pharmacokinetic Analysis for SWOG S0931 (EVEREST), a Phase III Study (NCT01120249). Kidney Cancer 2019, 3, 111–118. [Google Scholar] [CrossRef] [PubMed]
  55. Chamie, K.; Klöpfer, P.; Bevan, P.; Störkel, S.; Said, J.; Fall, B.; Belldegrun, A.S.; Pantuck, A.J. Carbonic Anhydrase-IX Score Is a Novel Biomarker That Predicts Recurrence and Survival for High-Risk, Nonmetastatic Renal Cell Carcinoma: Data from the Phase III ARISER Clinical Trial. Urol. Oncol. Semin. Orig. Investig. 2015, 33, e25–e204. [Google Scholar] [CrossRef] [PubMed]
  56. Choueiri, T.K.; Tomczak, P.; Park, S.H.; Venugopal, B.; Ferguson, T.; Symeonides, S.N.; Hajek, J.; Chang, Y.-H.; Lee, J.-L.; Sarwar, N.; et al. Overall Survival with Adjuvant Pembrolizumab in Renal-Cell Carcinoma. N. Engl. J. Med. 2024, 390, 1359–1371. [Google Scholar] [CrossRef]
  57. Bex, A.; Jewett, M.; Lewis, B.; Abel, E.J.; Albiges, L.; Berg, S.A.; Bratslavsky, G.; Braun, D.; Brugarolas, J.; Choueiri, T.K.; et al. A Call for a Neoadjuvant Kidney Cancer Consortium: Lessons Learned from Other Cancer Types. Eur. Urol. 2025, 87, 385–389. [Google Scholar] [CrossRef]
  58. Karlsson Rosenblad, A.; Sundqvist, P.; Harmenberg, U.; Hellström, M.; Hofmann, F.; Kjellman, A.; Kröger Dahlin, B.-I.; Lindblad, P.; Lindskog, M.; Lundstam, S.; et al. Surgical Waiting Times and All-Cause Mortality in Patients with Non-Metastatic Renal Cell Carcinoma. Scand. J. Urol. 2022, 56, 383–390. [Google Scholar] [CrossRef]
  59. Kuusk, T.; Cullen, D.; Neves, J.B.; Campain, N.; Barod, R.; Boleti, E.; El-Sheihk, S.; Grant, L.; Kelly, J.; Marchetti, M.; et al. Impact of the First Surge of the COVID-19 Pandemic on a Tertiary Referral Centre for Kidney Cancer. BJU Int. 2021, 128, 752–758. [Google Scholar] [CrossRef] [PubMed]
  60. Khaleel, S.; Jiang, S.; Kotecha, R.R.; Hakimi, A.A. Neoadjuvant Systemic Therapy in Localized and Locally Advanced Renal Cell Carcinoma. Front. Urol. 2022, 2, 864778. [Google Scholar] [CrossRef]
  61. Stewart, G.; Jones, J.; Warren, A.; Gallagher, F.; Horvat Menih, I.; Mossop, H.; Wason, J.; Easita, F.; Thomas, M.; Welsh, S. 75 WIRE: Window of Opportunity ClinicalTrials Platform for Evaluation of NovelTreatments Strategies in Renal Cell Cancer. Oncologist 2024, 29 (Suppl. 1), S15–S16. [Google Scholar] [CrossRef]
  62. Marandino, L.; Raggi, D.; Necchi, A.; Capitanio, U. Neoadjuvant Treatment in Renal Cell Carcinoma: Transforming Challenges into Opportunities. Eur. Urol. 2022, 81, 574–575. [Google Scholar] [CrossRef]
  63. Leibovich, B.C.; Lohse, C.M.; Cheville, J.C.; Zaid, H.B.; Boorjian, S.A.; Frank, I.; Thompson, R.H.; Parker, W.P. Predicting Oncologic Outcomes in Renal Cell Carcinoma After Surgery. Eur. Urol. 2018, 73, 772–780. [Google Scholar] [CrossRef]
  64. Usher-Smith, J.A.; Li, L.; Roberts, L.; Harrison, H.; Rossi, S.H.; Sharp, S.J.; Coupland, C.; Hippisley-Cox, J.; Griffin, S.J.; Klatte, T.; et al. Risk Models for Recurrence and Survival after Kidney Cancer: A Systematic Review. BJU Int. 2022, 130, 562–579. [Google Scholar] [CrossRef]
  65. Aykan, N.F.; Özatlı, T. Objective Response Rate Assessment in Oncology: Current Situation and Future Expectations. WJCO 2020, 11, 53–73. [Google Scholar] [CrossRef]
  66. Beksac, A.T.; Paulucci, D.J.; Blum, K.A.; Yadav, S.S.; Sfakianos, J.P.; Badani, K.K. Heterogeneity in Renal Cell Carcinoma. Urol. Oncol. Semin. Orig. Investig. 2017, 35, 507–515. [Google Scholar] [CrossRef] [PubMed]
  67. Lehuédé, C.; Dupuy, F.; Rabinovitch, R.; Jones, R.G.; Siegel, P.M. Metabolic Plasticity as a Determinant of Tumor Growth and Metastasis. Cancer Res. 2016, 76, 5201–5208. [Google Scholar] [CrossRef] [PubMed]
  68. Lau, D.; McLean, M.A.; Priest, A.N.; Gill, A.B.; Scott, F.; Patterson, I.; Carmo, B.; Riemer, F.; Kaggie, J.D.; Frary, A.; et al. Multiparametric MRI of Early Tumor Response to Immune Checkpoint Blockade in Metastatic Melanoma. J. Immunother. Cancer 2021, 9, e003125. [Google Scholar] [CrossRef]
  69. Coffey, N.J.; Simon, M.C. Metabolic Alterations in Hereditary and Sporadic Renal Cell Carcinoma. Nat. Rev. Nephrol. 2024, 20, 233–250. [Google Scholar] [CrossRef] [PubMed]
  70. Pavlova, N.N.; Zhu, J.; Thompson, C.B. The Hallmarks of Cancer Metabolism: Still Emerging. Cell Metab. 2022, 34, 355–377. [Google Scholar] [CrossRef]
  71. Okegawa, T.; Morimoto, M.; Nishizawa, S.; Kitazawa, S.; Honda, K.; Araki, H.; Tamura, T.; Ando, A.; Satomi, Y.; Nutahara, K.; et al. Intratumor Heterogeneity in Primary Kidney Cancer Revealed by Metabolic Profiling of Multiple Spatially Separated Samples within Tumors. EBioMedicine 2017, 19, 31–38. [Google Scholar] [CrossRef]
  72. Turajlic, S.; Xu, H.; Litchfield, K.; Rowan, A.; Chambers, T.; Lopez, J.I.; Nicol, D.; O’Brien, T.; Larkin, J.; Horswell, S.; et al. Tracking Cancer Evolution Reveals Constrained Routes to Metastases: TRACERx Renal. Cell 2018, 173, 581–594.e12. [Google Scholar] [CrossRef]
  73. Mankoff, D.A.; Dunnwald, L.K.; Partridge, S.C.; Specht, J.M. Blood Flow-Metabolism Mismatch: Good for the Tumor, Bad for the Patient. Clin. Cancer Res. 2009, 15, 5294–5296. [Google Scholar] [CrossRef]
  74. Specht, J.M.; Kurland, B.F.; Montgomery, S.K.; Dunnwald, L.K.; Doot, R.K.; Gralow, J.R.; Ellis, G.K.; Linden, H.M.; Livingston, R.B.; Allison, K.H.; et al. Tumor Metabolism and Blood Flow as Assessed by Positron Emission Tomography Varies by Tumor Subtype in Locally Advanced Breast Cancer. Clin. Cancer Res. 2010, 16, 2803–2810. [Google Scholar] [CrossRef] [PubMed]
  75. Apostolova, I.; Hofheinz, F.; Buchert, R.; Steffen, I.G.; Michel, R.; Rosner, C.; Prasad, V.; Köhler, C.; Derlin, T.; Brenner, W.; et al. Combined Measurement of Tumor Perfusion and Glucose Metabolism for Improved Tumor Characterization in Advanced Cervical Carcinoma: A PET/CT Pilot Study Using [15O]Water and [18F]Fluorodeoxyglucose. Strahlenther. Onkol. 2014, 190, 575–581. [Google Scholar] [CrossRef]
  76. Saltveit, M.E. Respiratory Metabolism. In Postharvest Physiology and Biochemistry of Fruits and Vegetables; Elsevier: Amsterdam, The Netherlands, 2019; pp. 73–91. ISBN 978-0-12-813278-4. [Google Scholar]
  77. Wang, Y.; Stancliffe, E.; Fowle-Grider, R.; Wang, R.; Wang, C.; Schwaiger-Haber, M.; Shriver, L.P.; Patti, G.J. Saturation of the Mitochondrial NADH Shuttles Drives Aerobic Glycolysis in Proliferating Cells. Mol. Cell 2022, 82, 3270–3283.e9. [Google Scholar] [CrossRef] [PubMed]
  78. Courtney, K.D.; Bezwada, D.; Mashimo, T.; Pichumani, K.; Vemireddy, V.; Funk, A.M.; Wimberly, J.; McNeil, S.S.; Kapur, P.; Lotan, Y.; et al. Isotope Tracing of Human Clear Cell Renal Cell Carcinomas Demonstrates Suppressed Glucose Oxidation In Vivo. Cell Metab. 2018, 28, 793–800.e2. [Google Scholar] [CrossRef]
  79. Ahmad, A.A.; Paffrath, V.; Clima, R.; Busch, J.F.; Rabien, A.; Kilic, E.; Villegas, S.; Timmermann, B.; Attimonelli, M.; Jung, K.; et al. Papillary Renal Cell Carcinomas Rewire Glutathione Metabolism and Are Deficient in Both Anabolic Glucose Synthesis and Oxidative Phosphorylation. Cancers 2019, 11, 1298. [Google Scholar] [CrossRef] [PubMed]
  80. Kurelac, I.; Iommarini, L.; Vatrinet, R.; Amato, L.B.; De Luise, M.; Leone, G.; Girolimetti, G.; Umesh Ganesh, N.; Bridgeman, V.L.; Ombrato, L.; et al. Inducing Cancer Indolence by Targeting Mitochondrial Complex I Is Potentiated by Blocking Macrophage-Mediated Adaptive Responses. Nat. Commun. 2019, 10, 903. [Google Scholar] [CrossRef]
  81. Joshi, S.; Tolkunov, D.; Aviv, H.; Hakimi, A.A.; Yao, M.; Hsieh, J.J.; Ganesan, S.; Chan, C.S.; White, E. The Genomic Landscape of Renal Oncocytoma Identifies a Metabolic Barrier to Tumorigenesis. Cell Rep. 2015, 13, 1895–1908. [Google Scholar] [CrossRef]
  82. Schaeffeler, E.; Büttner, F.; Reustle, A.; Klumpp, V.; Winter, S.; Rausch, S.; Fisel, P.; Hennenlotter, J.; Kruck, S.; Stenzl, A.; et al. Metabolic and Lipidomic Reprogramming in Renal Cell Carcinoma Subtypes Reflects Regions of Tumor Origin. Eur. Urol. Focus 2019, 5, 608–618. [Google Scholar] [CrossRef]
  83. Bezwada, D.; Lesner, N.P.; Brooks, B.; Vu, H.S.; Wu, Z.; Cai, L.; Kasitinon, S.; Kelekar, S.; Cai, F.; Aurora, A.B.; et al. Mitochondrial Metabolism in Primary and Metastatic Human Kidney Cancers; Cancer Biology: Hong Kong, China, 2023. [Google Scholar]
  84. Wettersten, H.I.; Hakimi, A.A.; Morin, D.; Bianchi, C.; Johnstone, M.E.; Donohoe, D.R.; Trott, J.F.; Aboud, O.A.; Stirdivant, S.; Neri, B.; et al. Grade-Dependent Metabolic Reprogramming in Kidney Cancer Revealed by Combined Proteomics and Metabolomics Analysis. Cancer Res. 2015, 75, 2541–2552. [Google Scholar] [CrossRef]
  85. Clark, D.J.; Dhanasekaran, S.M.; Petralia, F.; Pan, J.; Song, X.; Hu, Y.; Da Veiga Leprevost, F.; Reva, B.; Lih, T.-S.M.; Chang, H.-Y.; et al. Integrated Proteogenomic Characterization of Clear Cell Renal Cell Carcinoma. Cell 2019, 179, 964–983.e31. [Google Scholar] [CrossRef] [PubMed]
  86. Hakimi, A.A.; Reznik, E.; Lee, C.-H.; Creighton, C.J.; Brannon, A.R.; Luna, A.; Aksoy, B.A.; Liu, E.M.; Shen, R.; Lee, W.; et al. An Integrated Metabolic Atlas of Clear Cell Renal Cell Carcinoma. Cancer Cell 2016, 29, 104–116. [Google Scholar] [CrossRef]
  87. Reinfeld, B.I.; Madden, M.Z.; Wolf, M.M.; Chytil, A.; Bader, J.E.; Patterson, A.R.; Sugiura, A.; Cohen, A.S.; Ali, A.; Do, B.T.; et al. Cell-Programmed Nutrient Partitioning in the Tumour Microenvironment. Nature 2021, 593, 282–288. [Google Scholar] [CrossRef]
  88. Golkaram, M.; Kuo, F.; Gupta, S.; Carlo, M.I.; Salmans, M.L.; Vijayaraghavan, R.; Tang, C.; Makarov, V.; Rappold, P.; Blum, K.A.; et al. Spatiotemporal Evolution of the Clear Cell Renal Cell Carcinoma Microenvironment Links Intra-Tumoral Heterogeneity to Immune Escape. Genome Med. 2022, 14, 143. [Google Scholar] [CrossRef] [PubMed]
  89. Li, R.; Ferdinand, J.R.; Loudon, K.W.; Bowyer, G.S.; Laidlaw, S.; Muyas, F.; Mamanova, L.; Neves, J.B.; Bolt, L.; Fasouli, E.S.; et al. Mapping Single-Cell Transcriptomes in the Intra-Tumoral and Associated Territories of Kidney Cancer. Cancer Cell 2022, 40, 1583–1599. [Google Scholar] [CrossRef] [PubMed]
  90. Udayakumar, D.; Zhang, Z.; Xi, Y.; Dwivedi, D.K.; Fulkerson, M.; Haldeman, S.; McKenzie, T.; Yousuf, Q.; Joyce, A.; Hajibeigi, A.; et al. Deciphering Intratumoral Molecular Heterogeneity in Clear Cell Renal Cell Carcinoma with a Radiogenomics Platform. Clin. Cancer Res. 2021, 27, 4794–4806. [Google Scholar] [CrossRef]
  91. Fletcher, J.W.; Djulbegovic, B.; Soares, H.P.; Siegel, B.A.; Lowe, V.J.; Lyman, G.H.; Coleman, R.E.; Wahl, R.; Paschold, J.C.; Avril, N.; et al. Recommendations on the Use of 18F-FDG PET in Oncology. J. Nucl. Med. 2008, 49, 480–508. [Google Scholar] [CrossRef]
  92. Nakajima, R.; Nozaki, S.; Kondo, T.; Nagashima, Y.; Abe, K.; Sakai, S. Evaluation of Renal Cell Carcinoma Histological Subtype and Fuhrman Grade Using 18F-Fluorodeoxyglucose-Positron Emission Tomography/Computed Tomography. Eur. Radiol. 2017, 27, 4866–4873. [Google Scholar] [CrossRef]
  93. Özülker, T.; Özülker, F.; Özbek, E.; Özpaçaci, T. A Prospective Diagnostic Accuracy Study of F-18 Fluorodeoxyglucose-Positron Emission Tomography/Computed Tomography in the Evaluation of Indeterminate Renal Masses. Nucl. Med. Commun. 2011, 32, 265–272. [Google Scholar] [CrossRef] [PubMed]
  94. Caldarella, C.; Muoio, B.; Isgrò, M.A.; Porfiri, E.; Treglia, G.; Giovanella, L. The Role of Fluorine-18-Fluorodeoxyglucose Positron Emission Tomography in Evaluating the Response to Tyrosine-Kinase Inhibitors in Patients with Metastatic Primary Renal Cell Carcinoma. Radiol. Oncol. 2014, 48, 219–227. [Google Scholar] [CrossRef] [PubMed]
  95. Chen, J.L.; Appelbaum, D.E.; Kocherginsky, M.; Cowey, C.L.; Kimryn Rathmell, W.; McDermott, D.F.; Stadler, W.M. FDGPET as a Predictive Biomarker for Therapy with Everolimus in Metastatic Renal Cell Cancer. Cancer Med. 2013, 2, 545–552. [Google Scholar] [CrossRef] [PubMed]
  96. Ueno, D.; Yao, M.; Tateishi, U.; Minamimoto, R.; Makiyama, K.; Hayashi, N.; Sano, F.; Murakami, T.; Kishida, T.; Miura, T.; et al. Early Assessment by FDG-PET/CT of Patients with Advanced Renal Cell Carcinoma Treated with Tyrosine Kinase Inhibitors Is Predictive of Disease Course. BMC Cancer 2012, 12, 162. [Google Scholar] [CrossRef]
  97. Nakaigawa, N.; Kondo, K.; Kaneta, T.; Tateishi, U.; Minamimoto, R.; Namura, K.; Ueno, D.; Kobayashi, K.; Kishida, T.; Ikeda, I.; et al. FDG PET/CT after First Molecular Targeted Therapy Predicts Survival of Patients with Renal Cell Carcinoma. Cancer Chemother. Pharmacol. 2018, 81, 739–744. [Google Scholar] [CrossRef]
  98. Lyrdal, D.; Boijsen, M.; Suurküla, M.; Lundstam, S.; Stierner, U. Evaluation of Sorafenib Treatment in Metastatic Renal Cell Carcinoma with 2-Fluoro-2-Deoxyglucose Positron Emission Tomography and Computed Tomography. Nucl. Med. Commun. 2009, 30, 519–524. [Google Scholar] [CrossRef]
  99. Rowe, S.P.; Gorin, M.A.; Solnes, L.B.; Ball, M.W.; Choudhary, A.; Pierorazio, P.M.; Epstein, J.I.; Javadi, M.S.; Allaf, M.E.; Baras, A.S. Correlation of 99mTc-Sestamibi Uptake in Renal Masses with Mitochondrial Content and Multi-Drug Resistance Pump Expression. EJNMMI Res. 2017, 7, 80. [Google Scholar] [CrossRef]
  100. Sevcenco, S.; Krssak, M.; Javor, D.; Ponhold, L.; Kuehhas, F.E.; Fajkovic, H.; Haitel, A.; Shariat, S.F.; Baltzer, P.A. Diagnosis of Renal Tumors by in Vivo Proton Magnetic Resonance Spectroscopy. World J. Urol. 2015, 33, 17–23. [Google Scholar] [CrossRef]
  101. Ali, H.A.; Couch, M.J.; Menezes, R.; Evans, A.J.; Finelli, A.; Jewett, M.A.; Jhaveri, K.S. Predictive Value of In Vivo MR Spectroscopy With Semilocalization by Adiabatic Selective Refocusing in Differentiating Clear Cell Renal Cell Carcinoma From Other Subtypes. Am. J. Roentgenol. 2020, 214, 817–824. [Google Scholar] [CrossRef]
  102. Nurenberg, P.; Sartoni-D’Ambrosia, G.; Szczepaniak, L.S. Magnetic Resonance Spectroscopy of Renal and Other Retroperitoneal Tumors. Curr. Opin. Urol. 2002, 12, 375–380. [Google Scholar] [CrossRef]
  103. Casey, R.T.; McLean, M.A.; Challis, B.G.; McVeigh, T.P.; Warren, A.Y.; Mendil, L.; Houghton, R.; De Sanctis, S.; Kosmoliaptsis, V.; Sandford, R.N.; et al. Fumarate Metabolic Signature for the Detection of Reed Syndrome in Humans. Clin. Cancer Res. 2020, 26, 391–396. [Google Scholar] [CrossRef] [PubMed]
  104. Kurhanewicz, J.; Vigneron, D.B.; Ardenkjaer-Larsen, J.H.; Bankson, J.A.; Brindle, K.; Cunningham, C.H.; Gallagher, F.A.; Keshari, K.R.; Kjaer, A.; Laustsen, C.; et al. Hyperpolarized 13C MRI: Path to Clinical Translation in Oncology. Neoplasia 2018, 21, 1–16. [Google Scholar] [CrossRef] [PubMed]
  105. Woitek, R.; Gallagher, F.A. The Use of Hyperpolarised 13C-MRI in Clinical Body Imaging to Probe Cancer Metabolism. Br. J. Cancer 2021, 124, 1187–1198. [Google Scholar] [CrossRef]
  106. Wang, Z.J.; Ohliger, M.A.; Larson, P.E.Z.; Gordon, J.W.; Bok, A.; Slater, J.; Villanueva-Meyer, J.E.; Hess, C.P.; Vigneron, D.B. Hyperpolarized 13C MRI: State of the Art and Future Directions. Radiology 2019, 291, 12. [Google Scholar] [CrossRef]
  107. Nelson, S.J.; Kurhanewicz, J.; Vigneron, D.B.; Larson, P.E.Z.; Harzstark, A.L.; Ferrone, M.; van Criekinge, M.; Chang, J.W.; Bok, R.; Park, I.; et al. Metabolic Imaging of Patients with Prostate Cancer Using Hyperpolarized [1-13C]Pyruvate. Sci. Transl. Med. 2013, 5, 198ra108. [Google Scholar] [CrossRef]
  108. Sriram, R.; Van Criekinge, M.; Hansen, A.; Wang, Z.J.; Vigneron, D.B.; Wilson, D.M.; Keshari, K.R.; Kurhanewicz, J. Real-Time Measurement of Hyperpolarized Lactate Production and Efflux as a Biomarker of Tumor Aggressiveness in an MR Compatible 3D Cell Culture Bioreactor: Real Time Measure of HP Lactate Production and Efflux. NMR Biomed. 2015, 28, 1141–1149. [Google Scholar] [CrossRef]
  109. Sriram, R.; Gordon, J.; Baligand, C.; Ahamed, F.; Delos Santos, J.; Qin, H.; Bok, R.; Vigneron, D.; Kurhanewicz, J.; Larson, P.; et al. Non-Invasive Assessment of Lactate Production and Compartmentalization in Renal Cell Carcinomas Using Hyperpolarized 13C Pyruvate MRI. Cancers 2018, 10, 313. [Google Scholar] [CrossRef]
  110. Sriram, R.; Van Criekinge, M.; DeLos Santos, J.; Keshari, K.R.; Wilson, D.M.; Peehl, D.; Kurhanewicz, J.; Wang, Z.J. Non-Invasive Differentiation of Benign Renal Tumors from Clear Cell Renal Cell Carcinomas Using Clinically Translatable Hyperpolarized 13C Pyruvate Magnetic Resonance. Tomography 2016, 2, 35–42. [Google Scholar] [CrossRef]
  111. Girgis, H.; Masui, O.; White, N.M.; Scorilas, A.; Rotondo, F.; Seivwright, A.; Gabril, M.; Filter, E.R.; Girgis, A.H.; Bjarnason, G.A.; et al. Lactate Dehydrogenase A Is a Potential Prognostic Marker in Clear Cell Renal Cell Carcinoma. Mol. Cancer 2014, 13, 101. [Google Scholar] [CrossRef]
  112. Cao, Y.-W.; Liu, Y.; Dong, Z.; Guo, L.; Kang, E.-H.; Wang, Y.-H.; Zhang, W.; Niu, H.-T. Monocarboxylate Transporters MCT1 and MCT4 Are Independent Prognostic Biomarkers for the Survival of Patients with Clear Cell Renal Cell Carcinoma and Those Receiving Therapy Targeting Angiogenesis. Urol. Oncol. Semin. Orig. Investig. 2018, 36, 311.e15–311.e25. [Google Scholar] [CrossRef]
  113. Tran, M.; Latifoltojar, A.; Neves, J.B.; Papoutsaki, M.-V.; Gong, F.; Comment, A.; Costa, A.S.H.; Glaser, M.; Tran-Dang, M.-A.; El Sheikh, S.; et al. First-in-Human in Vivo Non-Invasive Assessment of Intra-Tumoral Metabolic Heterogeneity in Renal Cell Carcinoma. BJR|Case Rep. 2019, 5, 20190003. [Google Scholar] [CrossRef]
  114. Tang, S.; Meng, M.V.; Slater, J.B.; Gordon, J.W.; Vigneron, D.B.; Stohr, B.A.; Larson, P.E.Z.; Wang, Z.J. Metabolic Imaging with Hyperpolarized 13C Pyruvate Magnetic Resonance Imaging in Patients with Renal Tumors—Initial Experience. Cancer 2021, 127, 2693–2704. [Google Scholar] [CrossRef]
  115. Ursprung, S.; Woitek, R.; McLean, M.A.; Priest, A.N.; Crispin-Ortuzar, M.; Brodie, C.R.; Gill, A.B.; Gehrung, M.; Beer, L.; Riddick, A.C.P.; et al. Hyperpolarized 13C-Pyruvate Metabolism as a Surrogate for Tumor Grade and Poor Outcome in Renal Cell Carcinoma—A Proof of Principle Study. Cancers 2022, 14, 335. [Google Scholar] [CrossRef]
  116. Woitek, R.; McLean, M.A.; Gill, A.B.; Grist, J.T.; Provenzano, E.; Patterson, A.J.; Ursprung, S.; Torheim, T.; Zaccagna, F.; Locke, M.; et al. Hyperpolarized 13C MRI of Tumor Metabolism Demonstrates Early Metabolic Response to Neoadjuvant Chemotherapy in Breast Cancer. Radiol. Imaging Cancer 2020, 2, e200017. [Google Scholar] [CrossRef]
  117. de Kouchkovsky, I.; Chen, H.-Y.; Ohliger, M.A.; Wang, Z.J.; Bok, R.A.; Gordon, J.W.; Larson, P.E.Z.; Frost, M.; Okamoto, K.; Cooperberg, M.R.; et al. Hyperpolarized 1-[13C]-Pyruvate Magnetic Resonance Imaging Detects an Early Metabolic Response to Immune Checkpoint Inhibitor Therapy in Prostate Cancer. Eur. Urol. 2021, 81, 219. [Google Scholar] [CrossRef]
  118. Woitek, R.; McLean, M.A.; Ursprung, S.; Rueda, O.M.; Manzano Garcia, R.; Locke, M.J.; Beer, L.; Baxter, G.; Rundo, L.; Provenzano, E.; et al. Hyperpolarized Carbon-13 MRI for Early Response Assessment of Neoadjuvant Chemotherapy in Breast Cancer Patients. Cancer Res. 2021, 81, 6004–6017. [Google Scholar] [CrossRef] [PubMed]
  119. Chaumeil, M.M.; Bankson, J.A.; Brindle, K.M.; Epstein, S.; Gallagher, F.A.; Grashei, M.; Guglielmetti, C.; Kaggie, J.D.; Keshari, K.R.; Knecht, S.; et al. New Horizons in Hyperpolarized 13C MRI. Mol. Imaging Biol. 2024, 26, 222–232. [Google Scholar] [CrossRef]
  120. De Feyter, H.M.; Behar, K.L.; Corbin, Z.A.; Fulbright, R.K.; Brown, P.B.; McIntyre, S.; Nixon, T.W.; Rothman, D.L.; de Graaf, R.A. Deuterium Metabolic Imaging (DMI) for MRI-Based 3D Mapping of Metabolism in Vivo. Sci. Adv. 2018, 4, eaat7314. [Google Scholar] [CrossRef] [PubMed]
  121. Adamson, P.M.; Datta, K.; Watkins, R.; Recht, L.D.; Hurd, R.E.; Spielman, D.M. Deuterium Metabolic Imaging for 3D Mapping of Glucose Metabolism in Humans with Central Nervous System Lesions at 3T. Magn. Reson. Med. 2024, 91, 39–50. [Google Scholar] [CrossRef] [PubMed]
  122. Kaggie, J.D.; Khan, A.S.; Matys, T.; Schulte, R.F.; Locke, M.J.; Grimmer, A.; Frary, A.; Menih, I.H.; Latimer, E.; Graves, M.J.; et al. Deuterium Metabolic Imaging and Hyperpolarized 13C-MRI of the Normal Human Brain at Clinical Field Strength Reveals Differential Cerebral Metabolism. NeuroImage 2022, 257, 119284. [Google Scholar] [CrossRef] [PubMed]
  123. Khan, A.S.; Peterson, K.A.; Vittay, O.I.; McLean, M.A.; Kaggie, J.D.; O’Brien, J.T.; Rowe, J.B.; Gallagher, F.A.; Matys, T.; Wolfe, S. Deuterium Metabolic Imaging of Alzheimer Disease at 3-T Magnetic Field Strength: A Pilot Case-Control Study. Radiology 2024, 312, e232407. [Google Scholar] [CrossRef]
  124. Gursan, A.; Hendriks, A.D.; Welting, D.; De Jong, P.A.; Klomp, D.W.J.; Prompers, J.J. Deuterium Body Array for the Simultaneous Measurement of Hepatic and Renal Glucose Metabolism and Gastric Emptying with Dynamic 3D Deuterium Metabolic Imaging at 7 T. NMR Biomed. 2023, 36, e4926. [Google Scholar] [CrossRef] [PubMed]
  125. Nam, K.M.; Gursan, A.; Bhogal, A.A.; Wijnen, J.P.; Klomp, D.W.J.; Prompers, J.J.; Hendriks, A.D. Deuterium echo-planar Spectroscopic Imaging (EPSI) in the Human Liver in Vivo at 7 T. Magn. Reson. Med. 2023, 90, 863–874. [Google Scholar] [CrossRef]
  126. Wodtke, P.; McLean, M.A.; Horvat-Menih, I.; Birchall, J.R.; Zamora-Morales, M.J.; Grimmer, A.; Latimer, E.; Wylot, M.; Schulte, R.F.; Gallagher, F.A. Deuterium Metabolic Imaging of the Human Abdomen at Clinical Field Strength. Investig. Radiol. 2025, in press. [Google Scholar] [CrossRef] [PubMed]
  127. De Feyter, H.M.; de Graaf, R.A. Deuterium Metabolic Imaging—Back to the Future. J. Magn. Reson. 2021, 326, 106932. [Google Scholar] [CrossRef]
  128. van Zijl, P.C.M.; Brindle, K.M. Spectroscopic Measurements of Metabolic Fluxes. Nat. Biomed. Eng. 2020, 4, 254–256. [Google Scholar] [CrossRef]
  129. McLean, M.A.; Menih, I.H.; Wodtke, P.; Kaggie, J.D.; Birchall, J.R.; Schulte, R.F.; Grimmer, A.; Latimer, E.; Wylot, M.; Zamora Morales, M.J.; et al. Development and optimization of human deuterium MR spectroscopic imaging at 3 T in the abdomen. Magn. Reson. Med. 2024, 1–9. [Google Scholar] [CrossRef]
  130. Brindle, K.M. Imaging Cancer Metabolism Using Magnetic Resonance. NPJ Imaging 2024, 2, 1. [Google Scholar] [CrossRef]
  131. Horvat-Menih, I.; Casey, R.; Denholm, J.; Hamm, G.; Hulme, H.; Gallon, J.; Khan, A.S.; Kaggie, J.; Gill, A.B.; Priest, A.N.; et al. Probing Intratumoral Metabolic Compartmentalisation in Fumarate Hydratase-Deficient Renal Cancer Using Clinical Hyperpolarised13 C-MRI and Mass Spectrometry Imaging. medRxiv 2024. [Google Scholar] [CrossRef]
  132. Horvat-Menih, I.; Khan, A.S.; McLean, M.A.; Duarte, J.; Serrao, E.; Ursprung, S.; Kaggie, J.D.; Gill, A.B.; Priest, A.N.; Crispin-Ortuzar, M.; et al. K-Means Clustering of Hyperpolarised 13C-MRI Identifies Intratumoral Perfusion/Metabolism Mismatch in Renal Cell Carcinoma as the Best Predictor of the Highest Grade. Cancers 2025, 17, 569. [Google Scholar] [CrossRef] [PubMed]
  133. Ursprung, S.; Mossop, H.; Gallagher, F.A.; Sala, E.; Skells, R.; Sipple, J.A.N.; Mitchell, T.J.; Chhabra, A.; Fife, K.; Matakidou, A.; et al. The WIRE Study a Phase II, Multi-Arm, Multi-Centre, Non-Randomised Window-of-Opportunity Clinical Trial Platform Using a Bayesian Adaptive Design for Proof-of-Mechanism of Novel Treatment Strategies in Operable Renal Cell Cancer—A Study Protocol. BMC Cancer 2021, 21, 1238. [Google Scholar] [CrossRef] [PubMed]
Table 1. A summary of the main renal tumour subtypes and their characteristics.
Renal Tumour SubtypeCharacteristics
Clear cell RCC (ccRCC)
-
The most common subtype, representing 80% of renal cell tumours, arising from epithelial cells in the proximal convoluted tubule [31].
-
Often occurs sporadically but can be present as a part of hereditary syndromes, such as VHL, tuberous sclerosis complex (TSC), or BAP1 tumour predisposition [34].
-
Microscopically, cells typically present with lipid-rich (“clear”) cytoplasm, embedded in an intricate network of capillary vessels. Characteristic immunohistochemical staining is strongly positive for carbonic anhydrase 9 (CAIX) [35].
Papillary RCC (pRCC)
-
The second most common subtype (10–15% of RCCs) [36], arising from the S3 segment of the proximal convoluted tubule [37].
-
Most often occurs sporadically but can also be found as part of a genetic syndrome such as familial pRCC syndrome resulting from mutations in the MET gene.
-
Macroscopically appears solid, grey/brown in colour, and shows frequent necrosis and haemorrhage. Microscopically characterised by cells organised into papillary structures [32,38].
Chromophobe RCC (chRCC)
-
The third most common subtype (3–5% of all RCCs) [34], occurring sporadically or as part of the Birt–Hogg–Dubé (BHD) cancer syndrome, resulting from genetic aberrations in the FLCN gene.
-
Macroscopically appears mahogany brown in colour, hypovascular, and as a well-demarcated mass often with a central scar [34,39].
-
The cells of origin are the intercalated cells of the distal tubule and collecting duct [37]. Typically, chRCC presents with nuclear atypia in large cells with prominent cell membranes and either pale or eosinophilic (ballooned, oncocytoma-like cells) cytoplasm [34,39].
Renal Oncocytoma (RO)
-
It has an important differential diagnosis with chRCC due to their morphological and histological similarities, but they have different treatment pathways: RO is a benign entity, monitored by active surveillance, while chRCC is malignant and therefore prioritised for surgery [34,40].
-
Conventional immunohistochemistry (IHC) staining patterns can overlap between the two tumours, with the term oncocytic tumours being an emerging entity [32,41].
SDHd-RCC and FHd-RCC
-
Rare tumour subtypes which result from tumorigenesis secondary to inactivation of the SDH and FH enzymes, respectively, often due to germline mutational losses.
-
Both tumours can be identified on IHC by their characteristic negative staining for their respective enzymes and should be prioritised for treatment due to their highly aggressive behaviour [32,34].
Table 2. MRI renal mass protocol. Source: Society of Abdominal Radiology (2018) [45].
SequencePlaneSlice Thickness/GapComments
2D T2w SSFSEAxial/CoronalAxial: 4–5 mm/no gapCoronal: 5–6 mm/no gapAlternative: 2D axial T2w FSE
2D T1w GRE in/out phaseAxial5–6 mm/0.5–1 mmAlternative: 3D Dixon, 3–4 mm/no gap
3D T1w SPGR fat saturationAxial/Coronal3–4 mm/no gap 
3D dynamic T1w SPGR fat saturation, 0.1 mL/kg of 1M Gd contrastAxial/Coronal3–4 mm/no gap30, 90–100, and 180–210 s, subtraction imaging; after dynamic series, obtain the other plane at 240 s
Optional sequences   
3D T1w SPGR fat saturationAxial/Coronal3–4 mm/no gap5–7 min post-contrast, image in plane perpendicular to the dynamic acquisition
Diffusion-weighted imaging (DWI)Axial5–6 mm/no gapb-values: 0–50, 400–500, 800–1000 s/mm2
DWI = diffusion-weighted imaging; FSE = fast spin echo; GRE = gradient echo; SPGR = spoiled gradient; SSFSE = single-shot fast spin echo.
Table 3. Outlook: suggestions for future research directions.
Unmet Clinical NeedPossible Applications of Metabolic MRI and the Research Required to Assess These Applications
Sampling error of renal mass biopsy Apply HP 13C-MRI to assess intratumoural metabolic variation and to enable biopsies to be targeted to the most aggressive tumour subregions [131,132]
Differentiating benign and malignant renal tumour subtypesUndertake large multicentre HP 13C-MRI studies to assess metabolism in a range of renal tumour subtypes
Assess the role of DMI to characterise benign and malignant renal tumours
Validated biomarkers for treatment response monitoringApply HP 13C-MRI to characterise metabolic response to neoadjuvant treatment of RCC as well as in the metastatic setting [133]
Biological validation of metabolic MRIValidate metabolic MRI methods against tissue measures of metabolism to determine the biological mechanisms influencing metabolic imaging phenotypes
Clinical validation of metabolic MRIAssess the added value of metabolic MRI over current standard-of-care imaging methods for probing intratumoural heterogeneity, determining tumour aggressiveness, targeting biopsies, and assessing response to therapy
Disclaimer/Publisher’s Note: The statements, opinions and data contained in all publications are solely those of the individual author(s) and contributor(s) and not of MDPI and/or the editor(s). MDPI and/or the editor(s) disclaim responsibility for any injury to people or property resulting from any ideas, methods, instructions or products referred to in the content.

