


Improving Lung Cancer Risk Prediction Using Machine Learning: A Comparative Analysis of Stacking Models and Traditional Approaches

 ,
,  , and
, and
Simple Summary
Abstract
1. Introduction
2. Materials and Methods
2.1. Study Population and Epidemiological Data
2.2. Data Preprocessing and Imputation
2.3. Model Development and Evaluation
2.4. Statistical Analysis
3. Results
3.1. Baseline Characteristics
3.2. Model Performance
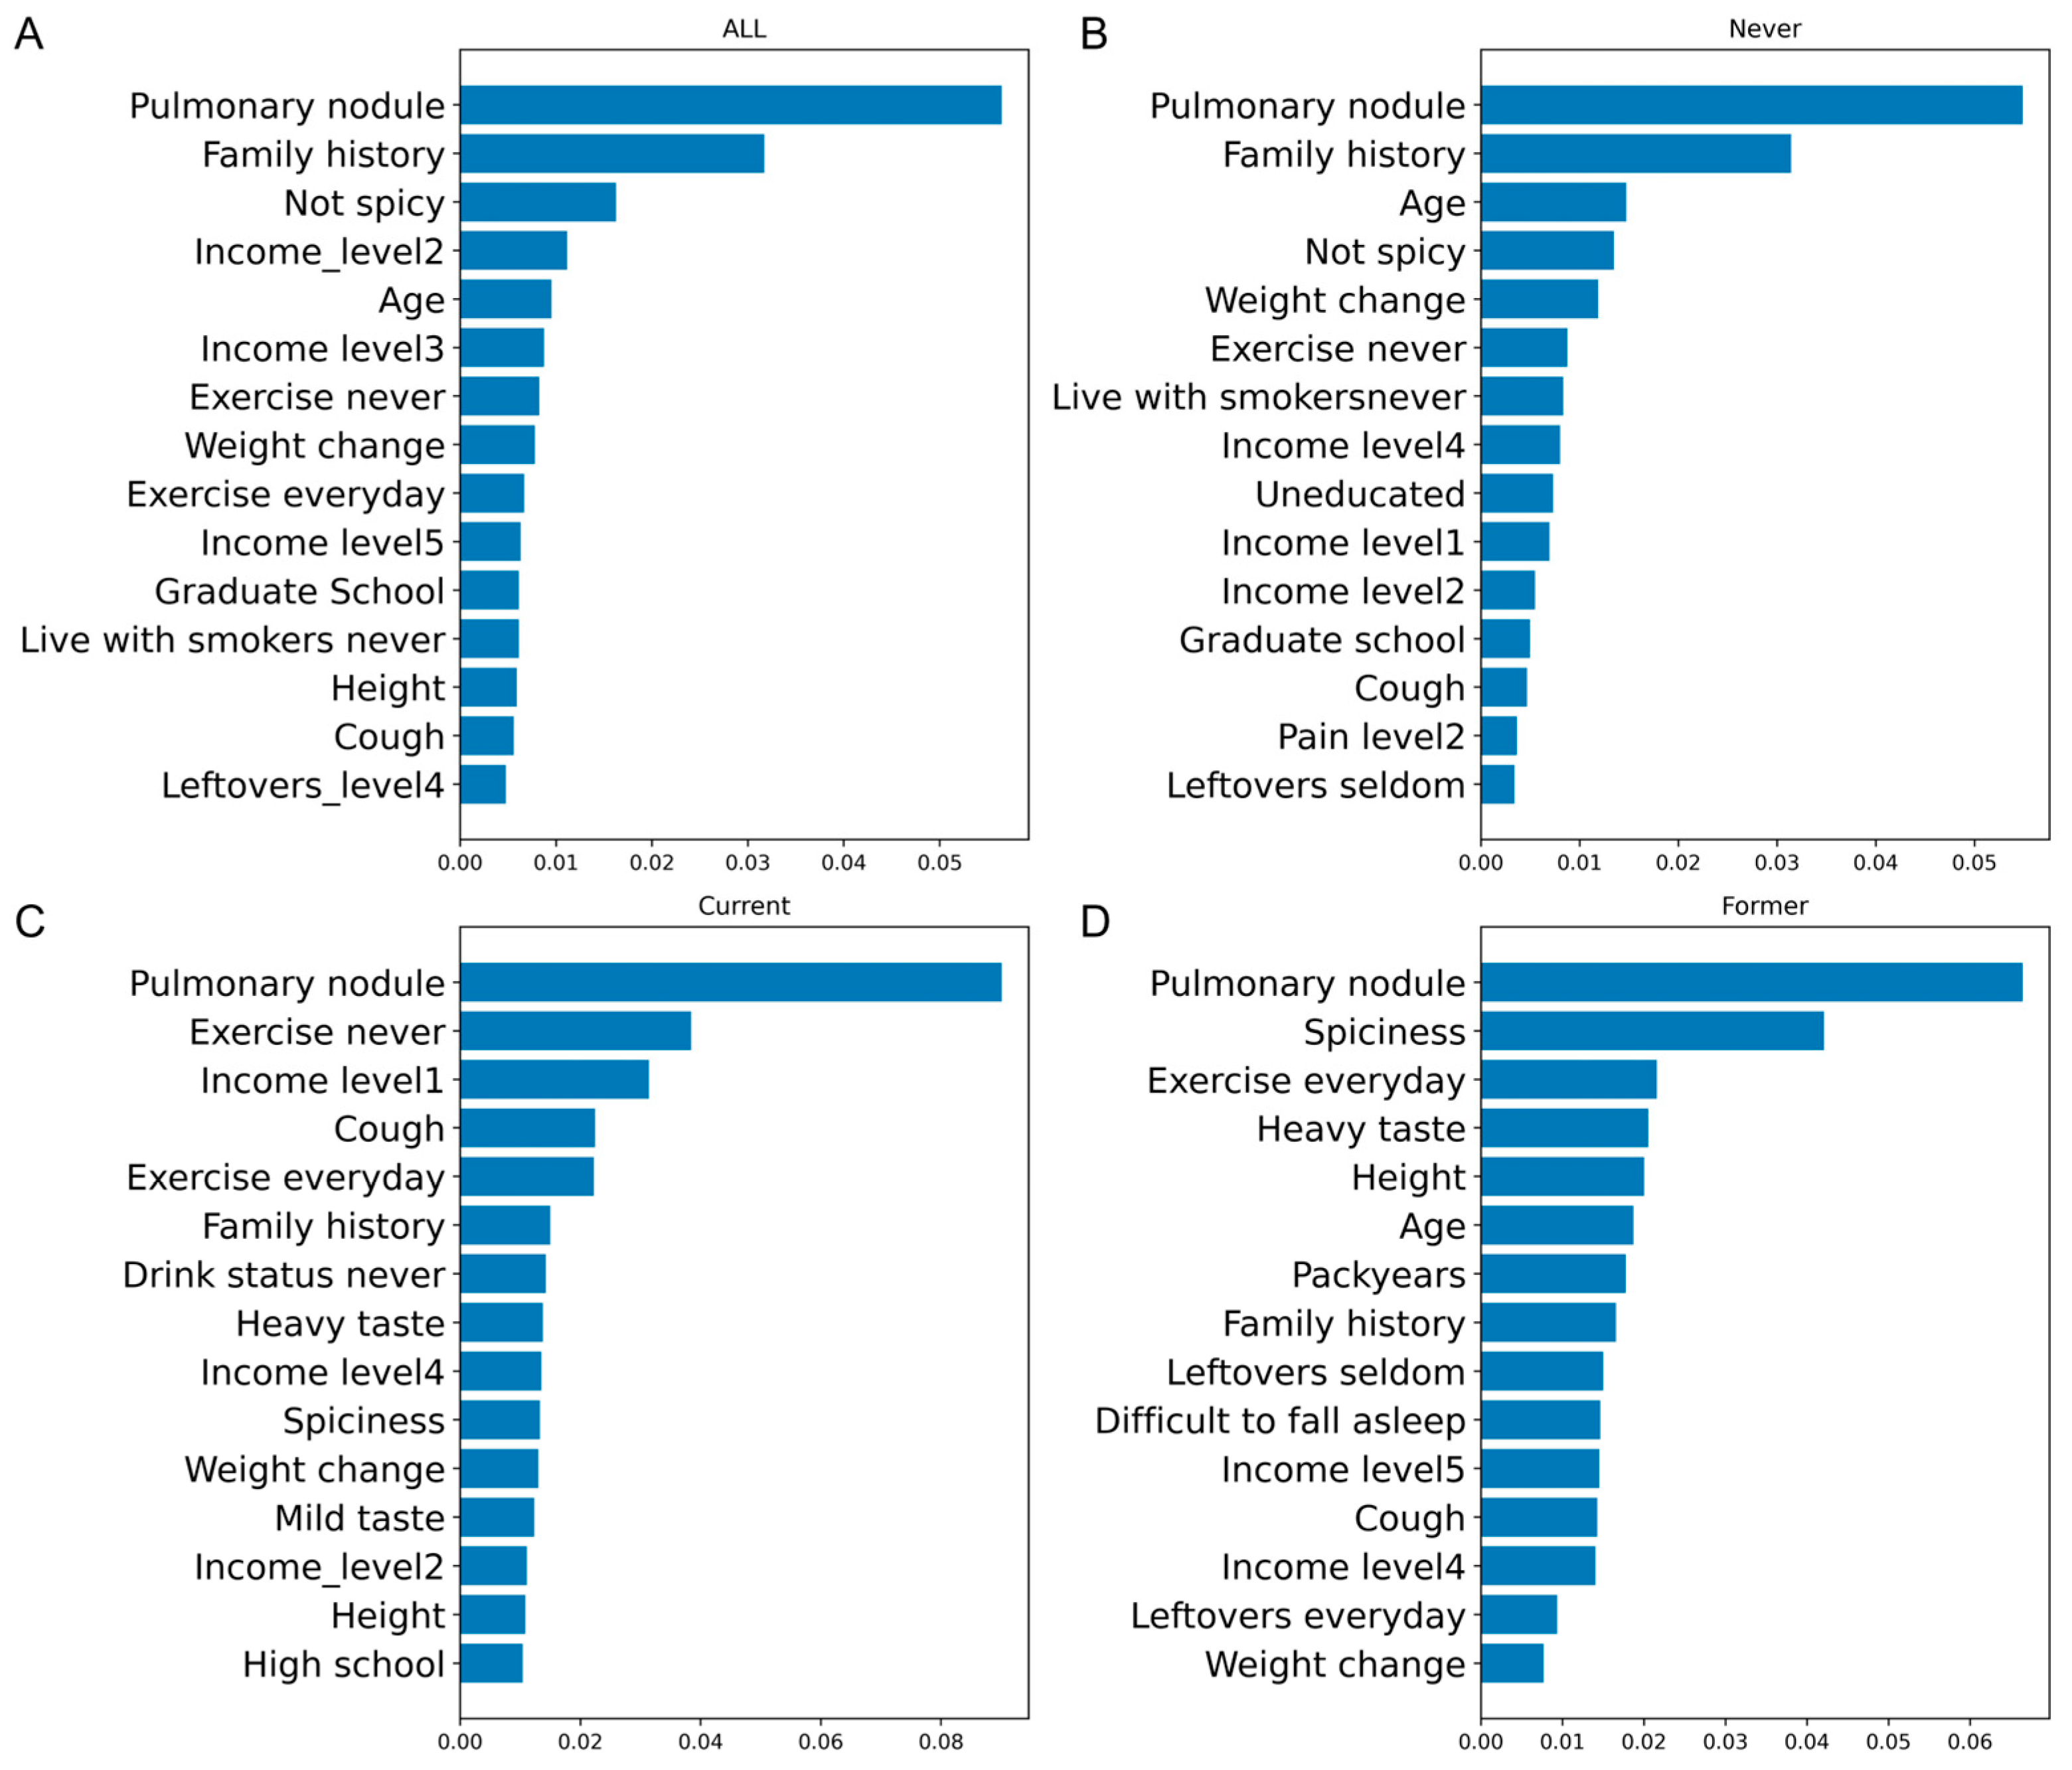
3.3. OR and Feature Importance
4. Discussion
5. Conclusions
Supplementary Materials
Author Contributions
Funding
Institutional Review Board Statement
Informed Consent Statement
Data Availability Statement
Conflicts of Interest
References
- Ferlay, J.; Ervik, M.; Lam, F.; Laversanne, M.; Colombet, M.; Mery, L.; Piñeros, M.; Znaor, A. Global Cancer Observatory: Cancer Today; Tech. Rep; International Agency for Research on Cancer: Lyon, France, 2024. [Google Scholar]
- Sung, H.; Ferlay, J.; Siegel, R.L.; Laversanne, M.; Soerjomataram, I.; Jemal, A.; Bray, F. Global Cancer Statistics 2020: GLOBOCAN Estimates of Incidence and Mortality Worldwide for 36 Cancers in 185 Countries. CA Cancer J. Clin. 2021, 71, 209–249. [Google Scholar] [CrossRef] [PubMed]
- Hoggart, C.; Brennan, P.; Tjonneland, A.; Vogel, U.; Overvad, K.; Østergaard, J.N.; Kaaks, R.; Canzian, F.; Boeing, H.; Steffen, A.; et al. A Risk Model for Lung Cancer Incidence. Cancer Prev. Res. 2012, 5, 834–846. [Google Scholar] [CrossRef]
- Guo, L.-W.; Lyu, Z.-Y.; Meng, Q.-C.; Zheng, L.-Y.; Chen, Q.; Liu, Y.; Xu, H.-F.; Kang, R.-H.; Zhang, L.-Y.; Cao, X.-Q.; et al. A Risk Prediction Model for Selecting High-Risk Population for Computed Tomography Lung Cancer Screening in China. Lung Cancer 2022, 163, 27–34. [Google Scholar] [CrossRef]
- Wilson, D.O.; Weissfeld, J. A Simple Model for Predicting Lung Cancer Occurrence in a Lung Cancer Screening Program: The Pittsburgh Predictor. Lung Cancer 2015, 89, 31–37. [Google Scholar] [CrossRef] [PubMed]
- Markaki, M.; Tsamardinos, I.; Langhammer, A.; Lagani, V.; Hveem, K.; Røe, O.D. A Validated Clinical Risk Prediction Model for Lung Cancer in Smokers of All Ages and Exposure Types: A HUNT Study. EBioMedicine 2018, 31, 36–46. [Google Scholar] [CrossRef]
- Meza, R.; Hazelton, W.D.; Colditz, G.A.; Moolgavkar, S.H. Analysis of Lung Cancer Incidence in the Nurses’ Health and the Health Professionals’ Follow-Up Studies Using a Multistage Carcinogenesis Model. Cancer Causes Control 2008, 19, 317–328. [Google Scholar] [CrossRef] [PubMed]
- Katki, H.A.; Kovalchik, S.A.; Berg, C.D.; Cheung, L.C.; Chaturvedi, A.K. Development and Validation of Risk Models to Select Ever-Smokers for CT Lung Cancer Screening. JAMA 2016, 315, 2300–2311. [Google Scholar] [CrossRef]
- Yeo, Y.; Shin, D.W.; Han, K.; Park, S.H.; Jeon, K.-H.; Lee, J.; Kim, J.; Shin, A. Individual 5-Year Lung Cancer Risk Prediction Model in Korea Using a Nationwide Representative Database. Cancers 2021, 13, 3496. [Google Scholar] [CrossRef]
- Warkentin, M.T.; Tammemägi, M.C.; Espin-Garcia, O.; Budhathoki, S.; Liu, G.; Hung, R.J. Lung Cancer Absolute Risk Models for Mortality in an Asian Population Using the China Kadoorie Biobank. J. Natl. Cancer Inst. 2022, 114, 1665–1673. [Google Scholar] [CrossRef]
- Pan, Z.; Zhang, R.; Shen, S.; Lin, Y.; Zhang, L.; Wang, X.; Ye, Q.; Wang, X.; Chen, J.; Zhao, Y.; et al. OWL: An Optimized and Independently Validated Machine Learning Prediction Model for Lung Cancer Screening Based on the UK Biobank, PLCO, and NLST Populations. EBioMedicine 2023, 88, 104443. [Google Scholar] [CrossRef]
- Liao, W.; Coupland, C.A.C.; Burchardt, J.; Baldwin, D.R.; DART initiative; Gleeson, F.V.; Hippisley-Cox, J. Predicting the Future Risk of Lung Cancer: Development, and Internal and External Validation of the CanPredict (Lung) Model in 19·67 Million People and Evaluation of Model Performance against Seven Other Risk Prediction Models. Lancet Respir. Med. 2023, 11, 685–697. [Google Scholar] [CrossRef] [PubMed]
- Huang, P.; Lin, C.T.; Li, Y.; Tammemagi, M.C.; Brock, M.V.; Atkar-Khattra, S.; Xu, Y.; Hu, P.; Mayo, J.R.; Schmidt, H.; et al. Prediction of Lung Cancer Risk at Follow-up Screening with Low-Dose CT: A Training and Validation Study of a Deep Learning Method. Lancet Digit. Health 2019, 1, e353–e362. [Google Scholar] [CrossRef] [PubMed]
- Tammemägi, M.C.; Katki, H.A.; Hocking, W.G.; Church, T.R.; Caporaso, N.; Kvale, P.A.; Chaturvedi, A.K.; Silvestri, G.A.; Riley, T.L.; Commins, J.; et al. Selection Criteria for Lung-Cancer Screening. N. Engl. J. Med. 2013, 368, 728–736. [Google Scholar] [CrossRef] [PubMed]
- Knoke, J.D.; Burns, D.M.; Thun, M.J. The Change in Excess Risk of Lung Cancer Attributable to Smoking Following Smoking Cessation: An Examination of Different Analytic Approaches Using CPS-I Data. Cancer Causes Control 2008, 19, 207–219. [Google Scholar] [CrossRef]
- Cassidy, A.; Myles, J.P.; van Tongeren, M.; Page, R.D.; Liloglou, T.; Duffy, S.W.; Field, J.K. The LLP Risk Model: An Individual Risk Prediction Model for Lung Cancer. Br. J. Cancer 2008, 98, 270–276. [Google Scholar] [CrossRef]
- Bach, P.B.; Kattan, M.W.; Thornquist, M.D.; Kris, M.G.; Tate, R.C.; Barnett, M.J.; Hsieh, L.J.; Begg, C.B. Variations in Lung Cancer Risk among Smokers. J. Natl. Cancer Inst. 2003, 95, 470–478. [Google Scholar] [CrossRef]
- Mishra, A.K.; Chong, B.; Arunachalam, S.P.; Oberg, A.L.; Majumder, S. Machine Learning Models for Pancreatic Cancer Risk Prediction Using Electronic Health Record Data-A Systematic Review and Assessment. Am. J. Gastroenterol. 2024, 119, 1466–1482. [Google Scholar] [CrossRef] [PubMed]
- Tran, T.T.; Lee, J.; Gunathilake, M.; Kim, J.; Kim, S.-Y.; Cho, H.; Kim, J. A Comparison of Machine Learning Models and Cox Proportional Hazards Models Regarding Their Ability to Predict the Risk of Gastrointestinal Cancer Based on Metabolic Syndrome and Its Components. Front. Oncol. 2023, 13, 1049787. [Google Scholar] [CrossRef]
- Qiu, B.; Shen, Z.; Yang, D.; Wang, Q. Applying Machine Learning Techniques to Predict the Risk of Lung Metastases from Rectal Cancer: A Real-World Retrospective Study. Front. Oncol. 2023, 13, 1183072. [Google Scholar] [CrossRef]
- Zhou, D.; Qiu, H.; Wang, L.; Shen, M. Risk Prediction of Heart Failure in Patients with Ischemic Heart Disease Using Network Analytics and Stacking Ensemble Learning. BMC Med. Inform. Decis. Mak. 2023, 23, 99. [Google Scholar] [CrossRef]
- Byeon, H. Developing a Predictive Model for Depressive Disorders Using Stacking Ensemble and Naive Bayesian Nomogram: Using Samples Representing South Korea. Front. Psychiatry 2021, 12, 773290. [Google Scholar] [CrossRef] [PubMed]
- Spitz, M.R.; Hong, W.K.; Amos, C.I.; Wu, X.; Schabath, M.B.; Dong, Q.; Shete, S.; Etzel, C.J. A Risk Model for Prediction of Lung Cancer. J. Natl. Cancer Inst. 2007, 99, 715–726. [Google Scholar] [CrossRef]
- Tu, H.; Wen, C.P.; Tsai, S.P.; Chow, W.-H.; Wen, C.; Ye, Y.; Zhao, H.; Tsai, M.K.; Huang, M.; Dinney, C.P.; et al. Cancer Risk Associated with Chronic Diseases and Disease Markers: Prospective Cohort Study. BMJ 2018, 360, k134. [Google Scholar] [CrossRef]
- Stekhoven, D.J.; Bühlmann, P. MissForest—Non-Parametric Missing Value Imputation for Mixed-Type Data. Bioinformatics 2012, 28, 112–118. [Google Scholar] [CrossRef] [PubMed]
- Why One-Hot Encode Data in Machine Learning?—MachineLearningMastery.com. Available online: https://machinelearningmastery.com/why-one-hot-encode-data-in-machine-learning/ (accessed on 24 October 2024).
- Yun, J.; Kim, H. ZNorm: Z-Score Gradient Normalization for Deep Neural Networks. arXiv 2024, arXiv:2408.01215. [Google Scholar] [CrossRef]
- Chowdhury, M.Z.I.; Leung, A.A.; Walker, R.L.; Sikdar, K.C.; O’Beirne, M.; Quan, H.; Turin, T.C. A Comparison of Machine Learning Algorithms and Traditional Regression-Based Statistical Modeling for Predicting Hypertension Incidence in a Canadian Population. Sci. Rep. 2023, 13, 13. [Google Scholar] [CrossRef] [PubMed]
- Li, Y.; Sperrin, M.; Ashcroft, D.M.; van Staa, T.P. Consistency of Variety of Machine Learning and Statistical Models in Predicting Clinical Risks of Individual Patients: Longitudinal Cohort Study Using Cardiovascular Disease as Exemplar. BMJ 2020, 371, m3919. [Google Scholar] [CrossRef]
- Field, J.K.; Vulkan, D.; Davies, M.P.A.; Duffy, S.W.; Gabe, R. Liverpool Lung Project Lung Cancer Risk Stratification Model: Calibration and Prospective Validation. Thorax 2021, 76, 161–168. [Google Scholar] [CrossRef]
- Feng, X.; Goodley, P.; Alcala, K.; Guida, F.; Kaaks, R.; Vermeulen, R.; Downward, G.S.; Bonet, C.; Colorado-Yohar, S.M.; Albanes, D.; et al. Evaluation of Risk Prediction Models to Select Lung Cancer Screening Participants in Europe: A Prospective Cohort Consortium Analysis. Lancet Digit. Health 2024, 6, e614–e624. [Google Scholar] [CrossRef]
- Katki, H.A.; Kovalchik, S.A.; Petito, L.C.; Cheung, L.C.; Jacobs, E.; Jemal, A.; Berg, C.D.; Chaturvedi, A.K. Implications of Nine Risk Prediction Models for Selecting Ever-Smokers for Computed Tomography Lung Cancer Screening. Ann. Intern. Med. 2018, 169, 10–19. [Google Scholar] [CrossRef]
- Robbins, H.A.; Alcala, K.; Swerdlow, A.J.; Schoemaker, M.J.; Wareham, N.; Travis, R.C.; Crosbie, P.A.J.; Callister, M.; Baldwin, D.R.; Landy, R.; et al. Comparative Performance of Lung Cancer Risk Models to Define Lung Screening Eligibility in the United Kingdom. Br. J. Cancer 2021, 124, 2026–2034. [Google Scholar] [CrossRef] [PubMed]
- Lebrett, M.B.; Balata, H.; Evison, M.; Colligan, D.; Duerden, R.; Elton, P.; Greaves, M.; Howells, J.; Irion, K.; Karunaratne, D.; et al. Analysis of Lung Cancer Risk Model (PLCOM2012 and LLPv2) Performance in a Community-Based Lung Cancer Screening Programme. Thorax 2020, 75, 661–668. [Google Scholar] [CrossRef] [PubMed]
- Cellina, M.; Cacioppa, L.M.; Cè, M.; Chiarpenello, V.; Costa, M.; Vincenzo, Z.; Pais, D.; Bausano, M.V.; Rossini, N.; Bruno, A.; et al. Artificial Intelligence in Lung Cancer Screening: The Future Is Now. Cancers 2023, 15, 4344. [Google Scholar] [CrossRef]
- Kobylińska, K.; Orłowski, T.; Adamek, M.; Biecek, P. Explainable Machine Learning for Lung Cancer Screening Models. Appl. Sci. 2022, 12, 1926. [Google Scholar] [CrossRef]
- Xu, Y.; Liu, X.; Cao, X.; Huang, C.; Liu, E.; Qian, S.; Liu, X.; Wu, Y.; Dong, F.; Qiu, C.-W.; et al. Artificial Intelligence: A Powerful Paradigm for Scientific Research. Innovation 2021, 2, 100179. [Google Scholar] [CrossRef]
- Zhang, Z.; Li, C.; Wang, W.; Dong, Z.; Liu, G.; Dong, Y.; Zhang, Y. Towards Full-Stack Deep Learning-Empowered Data Processing Pipeline for Synchrotron Tomography Experiments. Innovation 2024, 5, 100539. [Google Scholar] [CrossRef]
- Zhu, T.; Huang, Y.-H.; Li, W.; Zhang, Y.-M.; Lin, Y.-Y.; Cheng, M.-Y.; Wu, Z.-Y.; Ye, G.-L.; Lin, Y.; Wang, K. Multifactor Artificial Intelligence Model Assists Axillary Lymph Node Surgery in Breast Cancer after Neoadjuvant Chemotherapy: Multicenter Retrospective Cohort Study. Int. J. Surg. 2023, 109, 3383–3394. [Google Scholar] [CrossRef]

| Characteristics | Case (N = 5421) | Control (N = 10,831) | p-Value |
|---|---|---|---|
| Age, median [IQR], years | 58.1 [48.3, 66.2] | 58.1 [48.4, 66.4] | 0.752 |
| Sex, No. (%) | 0.949 | ||
| Male | 1986 (36.6%) | 3975 (36.7%) | |
| Female | 3435 (63.4%) | 6856 (63.3%) | |
| Smoking status, No. (%) | 0.994 | ||
| Current | 420 (7.7%) | 838 (7.7%) | |
| Former | 925 (17.1%) | 1841 (17.0%) | |
| Never | 4076 (75.2%) | 8152 (75.3%) | |
| Education, No. (%) | <0.001 | ||
| Uneducated | 465 (8.6%) | 2218 (20.5%) | |
| Primary school | 1309 (24.2%) | 2891 (26.7%) | |
| Middle school | 1510 (27.9%) | 2926 (27.0%) | |
| High school | 873 (16.1%) | 1073 (9.9%) | |
| Technical school | 567 (10.5%) | 438 (4.0%) | |
| College | 595 (11.0%) | 866 (8.0%) | |
| Graduate school | 88 (1.6%) | 379 (3.5%) | |
| Other | 6 (0.1%) | 36 (0.3%) | |
| Income, No. (%) | <0.001 | ||
| <50,000 | 898 (17.8%) | 2374 (29.8%) | |
| 50,000–100,000 | 1457 (28.9%) | 2947 (37.0%) | |
| 110,000–200,000 | 1280 (25.4%) | 1514 (19.0%) | |
| 210,000–300,000 | 672 (13.3%) | 399 (5.0%) | |
| >300,000 | 730 (14.5%) | 730 (9.2%) | |
| Second-hand smoke, No. (%) | <0.001 | ||
| No | 2891 (55.3%) | 7629 (71.9%) | |
| Yes | 2337 (44.7%) | 2985 (28.1%) | |
| Live with smokers, No. (%) | <0.001 | ||
| Never | 3183 (60.0%) | 8341 (77.9%) | |
| Former | 841 (15.9%) | 993 (9.3%) | |
| Current | 1279 (24.1%) | 1372 (12.8%) | |
| Taste, No. (%) | <0.001 | ||
| Heavy | 1131 (21.0%) | 1692 (15.7%) | |
| Moderate | 2645 (49.2%) | 6367 (59.1%) | |
| Light | 1600 (29.8%) | 2720 (25.2%) | |
| Spiciness, No. (%) | <0.001 | ||
| Hot | 69 (1.3%) | 150 (1.4%) | |
| Medium | 393 (7.3%) | 1185 (11.1%) | |
| Mild | 2025 (37.7%) | 5532 (51.7%) | |
| Not spicy | 2879 (53.7%) | 3829 (35.8%) | |
| Leftovers, No. (%) | <0.001 | ||
| Everyday | 595 (11.1%) | 706 (7.1%) | |
| 3–5 times per week | 1099 (20.5%) | 1260 (12.6%) | |
| 1–2 times per week | 1395 (26.1%) | 3412 (34.2%) | |
| Seldom | 2259 (42.2%) | 4603 (46.1%) | |
| Dietary preference, No. (%) | <0.001 | ||
| Meat | 631 (12.1%) | 1133 (10.6%) | |
| Balance | 3725 (71.2%) | 8295 (77.4%) | |
| Vegetarian | 879 (16.8%) | 1294 (12.1%) | |
| Difficult to fall asleep, No. (%) | <0.001 | ||
| Never | 3558 (75.5%) | 8027 (75.2%) | |
| <1 times per week | 543 (11.5%) | 1252 (11.7%) | |
| 1–2 times per week | 541 (11.5%) | 944 (8.8%) | |
| ≥3 times per week | 70 (1.5%) | 453 (4.2%) | |
| Difficult to breathe, No. (%) | <0.001 | ||
| Never | 4471 (91.5%) | 9875 (92.5%) | |
| <1 times per week | 192 (3.9%) | 448 (4.2%) | |
| 1–2 times per week | 190 (3.9%) | 268 (2.5%) | |
| ≥3 times per week | 33 (0.7%) | 84 (0.8%) | |
| Cough, No. (%) | <0.001 | ||
| Never | 2491 (67.9%) | 7397 (72.6%) | |
| <1 times per week | 441 (12.0%) | 957 (9.4%) | |
| 1–2 times per week | 613 (16.7%) | 1088 (10.7%) | |
| ≥3 times per week | 123 (3.4%) | 747 (7.3%) | |
| Pain, No. (%) | <0.001 | ||
| Never | 4712 (93.8%) | 9257 (87.0%) | |
| <1 times per week | 163 (3.2%) | 640 (6.0%) | |
| 1–2 times per week | 127 (2.5%) | 501 (4.7%) | |
| ≥3 times per week | 19 (0.4%) | 245 (2.3%) | |
| Exercise frequency, No. (%) | <0.001 | ||
| Never | 2543 (47.6%) | 7628 (70.8%) | |
| 1–3 times per month | 320 (6.0%) | 514 (4.8%) | |
| 1–2 times per week | 458 (8.6%) | 752 (7.0%) | |
| 3–5 times per week | 366 (6.9%) | 501 (4.7%) | |
| Everyday | 1650 (30.9%) | 1375 (12.8%) | |
| Chronic bronchitis, No. (%) | 0.05 | ||
| No | 5370 (99.1%) | 10,761 (99.4%) | |
| Yes | 51 (0.9%) | 70 (0.6%) | |
| Asthma, No. (%) | <0.001 | ||
| No | 5385 (99.3%) | 10,803 (99.7%) | |
| Yes | 36 (0.7%) | 28 (0.3%) | |
| Chronic obstructive pulmonary disease, No. (%) | 0.003 | ||
| No | 5412 (99.8%) | 10,779 (99.5%) | |
| Yes | 9 (0.2%) | 52 (0.5%) | |
| Tuberculosis, No. (%) | <0.001 | ||
| No | 5361 (98.9%) | 10,790 (99.6%) | |
| Yes | 60 (1.1%) | 41 (0.4%) | |
| Pulmonary nodule, No. (%) | <0.001 | ||
| No | 4433 (81.8%) | 10,765 (99.4%) | |
| Yes | 988 (18.2%) | 66 (0.6%) | |
| Family history *, No. (%) | <0.001 | ||
| No | 4163 (76.8%) | 10,368 (95.7%) | |
| Yes | 1258 (23.2%) | 463 (4.3%) | |
| Heavy metal, No. (%) | <0.001 | ||
| No | 5335 (98.4%) | 10,762 (99.4%) | |
| Yes | 86 (1.6%) | 69 (0.6%) | |
| Diesel, No. (%) | <0.001 | ||
| No | 5360 (98.9%) | 10,794 (99.7%) | |
| Yes | 61 (1.1%) | 37 (0.3%) | |
| Coal dust, No. (%) | <0.001 | ||
| No | 5360 (98.9%) | 10,796 (99.7%) | |
| Yes | 61 (1.1%) | 35 (0.3%) | |
| Asbestos, No. (%) | 0.662 | ||
| No | 5405 (99.7%) | 10,793 (99.6%) | |
| Yes | 16 (0.3%) | 38 (0.4%) | |
| Physical activity, No. (%) | <0.001 | ||
| Inactive | 2810 (52.3%) | 7873 (75.1%) | |
| Low active | 501 (9.3%) | 545 (5.2%) | |
| Moderate active | 1311 (24.4%) | 1270 (12.1%) | |
| High active | 747 (13.9%) | 802 (7.6%) | |
| Drinking status, No. (%) | <0.001 | ||
| Never | 3928 (72.7%) | 7959 (73.6%) | |
| Current | 1091 (20.2%) | 2390 (22.1%) | |
| Former | 385 (7.1%) | 461 (4.3%) | |
| Height, median [IQR], cm | 161.0 [156.5, 168.0] | 160.0 [155.0, 166.0] | <0.001 |
| Weight, median [IQR], kg | 60.0 [53.0, 67.3] | 60.0 [53.0, 66.4] | 0.002 |
| Weight change †, median [IQR] | 0.00 [−0.5, 0.5] | 0.0 [0.0, 2.0] | <0.001 |
| Pack year ‡, median [IQR], years | 30.0 [15.0, 46.0] | 29.3 [12.5, 45.0] | 0.03 |
| Model | All | Never | Current | Former |
|---|---|---|---|---|
| LLP * | ||||
| Training | 0.636 (0.627–0.645) | 0.635 (0.627–0.643) | 0.656 (0.620–0.692) | 0.634 (0.610–0.659) |
| Validation | 0.631 (0.605–0.657) | 0.623 (0.601–0.645) | 0.604 (0.494–0.713) | 0.639 (0.563–0.716) |
| Test | 0.647 (0.620–0.673) | 0.636 (0.613–0.659) | 0.635 (0.508–0.762) | 0.653 (0.585–0.721) |
| PLCO † | ||||
| Training | 0.678 (0.668–0.687) | 0.692 (0.681–0.703) | 0.690 (0.656–0.725) | 0.687 (0.664–0.710) |
| Validation | 0.661 (0.633–0.690) | 0.677 (0.645–0.709) | 0.603 (0.492–0.713) | 0.673 (0.597–0.748) |
| Test | 0.662 (0.633–0.691) | 0.676 (0.643–0.709) | 0.606 (0.486–0.726) | 0.683 (0.614–0.752) |
| LightGBM | ||||
| Training | 0.922 (0.918–0.927) | 0.935 (0.930–0.939) | 0.995 (0.992–0.998) | 0.873 (0.858–0.889) |
| Validation | 0.880 (0.863–0.897) | 0.877 (0.858–0.897) | 0.864 (0.802–0.926) | 0.856 (0.808–0.903) |
| Test | 0.884 (0.867–0.901) | 0.897 (0.879–0.915) | 0.800 (0.719–0.880) | 0.809 (0.757–0.861) |
| MLP | ||||
| Training | 0.904 (0.898–0.909) | 0.894 (0.888–0.900) | 0.858 (0.831–0.885) | 0.894 (0.881–0.908) |
| Validation | 0.864 (0.845–0.883) | 0.872 (0.852–0.893) | 0.889 (0.826–0.952) | 0.817 (0.764–0.869) |
| Test | 0.877 (0.860–0.894) | 0.893 (0.875–0.912) | 0.822 (0.749–0.895) | 0.799 (0.745–0.852) |
| Stacking * | ||||
| Training | 0.915 (0.910–0.920) | 0.920 (0.915–0.926) | 0.900 (0.879–0.921) | 0.928 (0.917–0.939) |
| Validation | 0.881 (0.864–0.899) | 0.881 (0.862–0.900) | 0.900 (0.842–0.959) | 0.850 (0.801–0.898) |
| Test | 0.887 (0.870–0.903) | 0.901 (0.883–0.918) | 0.837 (0.769–0.906) | 0.814 (0.763–0.864) |
| All | Never | Current | Former | |
|---|---|---|---|---|
| Risk Factor | OR (95% CI) | OR (95% CI) | OR (95% CI) | OR (95% CI) |
| Education, No. (%) | ||||
| Uneducated | 1.00 (reference) | 1.00 (reference) | 1.00 (reference) | 1.00 (reference) |
| Primary school | 1.94 (1.68–2.26) | 1.98 (1.67–2.35) | 2.94 (1.45–5.99) | 1.52 (1.02–2.26) |
| Middle school | 2.32 (1.98–2.71) | 2.47 (2.06–2.96) | 3.25 (1.58–6.69) | 1.50 (0.99–2.26) |
| High school | 3.25 (2.71–3.90) | 3.87 (3.13–4.79) | 4.59 (2.08–10.14) | 1.49 (0.93–2.38) |
| Technical school | 4.63 (3.70–5.80) | 6.45 (4.95–8.40) | 8.14 (2.94–22.54) | 1.08 (0.62–1.89) |
| College | 2.12 (1.68–2.67) | 2.85 (2.18–3.72) | 2.41 (0.83–6.95) | 0.35 (0.18–0.68) |
| Graduate school | 0.60 (0.42–0.86) | 0.72 (0.48–1.07) | 1.63 (0.22–12.33) | 0.14 (0.04–0.47) |
| Other | 1.13 (0.43–2.92) | 1.13 (0.39–3.28) | NA | NA |
| p for interaction | <0.001 | |||
| Income, No. (%) | ||||
| <50,000 | 1.00 (reference) | 1.00 (reference) | 1.00 (reference) | 1.00 (reference) |
| 50,000–100,000 | 1.38 (1.23–1.55) | 1.29 (1.12–1.48) | 1.56 (1.01–2.42) | 1.65 (1.26–2.16) |
| 110,000–200,000 | 2.17 (1.89–2.48) | 2.11 (1.80–2.48) | 2.04 (1.22–3.40) | 2.48 (1.80–3.41) |
| 210,000–300,000 | 4.83 (4.02–5.80) | 4.51 (3.64–5.60) | 5.60 (2.65–11.85) | 6.40 (4.06–10.11) |
| >300,000 | 2.83 (2.37–3.39) | 2.61 (2.11–3.23) | 3.60 (1.70–7.62) | 3.85 (2.54–5.84) |
| p for interaction | 0.256 | |||
| Second-hand smoke, No. (%) | ||||
| No | 1.00 (reference) | 1.00 (reference) | 1.00 (reference) | 1.00 (reference) |
| Yes | 1.30 (1.18–1.44) | 1.50 (1.32–1.69) | 1.26 (0.90–1.78) | 0.89 (0.71–1.10) |
| p for interaction | <0.001 | |||
| Live with smokers, No. (%) | ||||
| Never | 1.00 (reference) | 1.00 (reference) | 1.00 (reference) | 1.00 (reference) |
| Former | 1.55 (1.35–1.78) | 1.97 (1.67–2.33) | 0.73 (0.39–1.36) | 0.70 (0.50–0.97) |
| Current | 2.06 (1.82–2.34) | 2.04 (1.77–2.36) | 2.57 (1.50–4.41) | 2.10 (1.39–3.17) |
| p for interaction | <0.001 | |||
| Taste, No. (%) | ||||
| Heavy | 1.00 (reference) | 1.00 (reference) | 1.00 (reference) | 1.00 (reference) |
| Moderate | 0.57 (0.50–0.63) | 0.61 (0.53–0.70) | 0.57 (0.40–0.82) | 0.46 (0.36–0.59) |
| Light | 0.68 (0.59–0.77) | 0.71 (0.60–0.83) | 0.54 (0.33–0.88) | 0.60 (0.45–0.80) |
| p for interaction | 0.042 | |||
| Spiciness, No. (%) | ||||
| Hot | 1.00 (reference) | 1.00 (reference) | 1.00 (reference) | 1.00 (reference) |
| Medium | 0.67 (0.46–0.99) | 0.57 (0.35–0.93) | 0.59 (0.20–1.72) | 0.94 (0.43–2.02) |
| Mild | 0.84 (0.59–1.21) | 0.71 (0.44–1.13) | 0.77 (0.28–2.08) | 1.11 (0.53–2.30) |
| Not spicy | 2.13 (1.49–3.06) | 1.93 (1.21–3.08) | 1.72 (0.62–4.74) | 2.23 (1.07–4.65) |
| p for interaction | 0.25 | |||
| Leftovers, No. (%) | ||||
| Everyday | 1.00 (reference) | 1.00 (reference) | 1.00 (reference) | 1.00 (reference) |
| 3–5 times per week | 1.00 (0.84–1.19) | 1.06 (0.86–1.31) | 1.18 (0.58–2.38) | 0.86 (0.59–1.25) |
| 1–2 times per week | 0.43 (0.36–0.50) | 0.41 (0.34–0.51) | 0.55 (0.28–1.08) | 0.47 (0.33–0.67) |
| Seldom | 0.40 (0.34–0.47) | 0.43 (0.35–0.52) | 0.44 (0.23–0.85) | 0.33 (0.24–0.47) |
| p for interaction | 0.086 | |||
| Dietary preference, No. (%) | ||||
| Meat | 1.00 (reference) | 1.00 (reference) | 1.00 (reference) | 1.00 (reference) |
| Balance | 1.05 (0.91–1.20) | 1.12 (0.93–1.35) | 0.87 (0.57–1.34) | 0.98 (0.75–1.27) |
| Vegetarian | 1.27 (1.07–1.51) | 1.42 (1.14–1.76) | 0.73 (0.36–1.48) | 1.02 (0.70–1.50) |
| p for interaction | 0.079 | |||
| Difficult to fall asleep, No. (%) | ||||
| Never | 1.00 (reference) | 1.00 (reference) | 1.00 (reference) | 1.00 (reference) |
| <1 times per week | 0.87 (0.76–1.00) | 0.90 (0.77–1.06) | 0.72 (0.40–1.29) | 0.84 (0.60–1.18) |
| 1–2 times per week | 1.06 (0.92–1.23) | 1.17 (0.99–1.38) | 0.46 (0.23–0.94) | 0.73 (0.49–1.10) |
| ≥3 times per week | 0.21 (0.15–0.29) | 0.22 (0.15–0.32) | 0.49 (0.14–1.67) | 0.07 (0.02–0.22) |
| p for interaction | <0.001 | |||
| Difficult to breathe, No. (%) | ||||
| Never | 1.00 (reference) | 1.00 (reference) | 1.00 (reference) | 1.00 (reference) |
| <1 times per week | 0.96 (0.76–1.23) | 0.88 (0.66–1.17) | 1.90 (0.81–4.45) | 1.05 (0.60–1.81) |
| 1–2 times per week | 1.99 (1.54–2.57) | 2.32 (1.70–3.16) | 1.39 (0.51–3.84) | 1.36 (0.76–2.45) |
| ≥3 times per week | 0.95 (0.52–1.75) | 1.51 (0.71–3.24) | 0.25 (0.02–2.90) | 0.73 (0.22–2.43) |
| p for interaction | 0.048 | |||
| Cough, No. (%) | ||||
| Never | 1.00 (reference) | 1.00 (reference) | 1.00 (reference) | 1.00 (reference) |
| <1 times per week | 1.11 (0.95–1.29) | 1.16 (0.97–1.39) | 0.93 (0.50–1.72) | 0.98 (0.70–1.37) |
| 1–2 times per week | 1.15 (1.01–1.32) | 1.26 (1.07–1.48) | 0.88 (0.55–1.40) | 0.97 (0.73–1.29) |
| ≥3 times per week | 0.39 (0.32–0.49) | 0.26 (0.19–0.37) | 0.45 (0.25–0.82) | 0.45 (0.32–0.63) |
| p for interaction | 0.002 | |||
| Pain, No. (%) | ||||
| Never | 1.00 (reference) | 1.00 (reference) | 1.00 (reference) | 1.00 (reference) |
| <1 times per week | 0.46 (0.37–0.58) | 0.47 (0.36–0.62) | 0.79 (0.34–1.84) | 0.30 (0.17–0.53) |
| 1–2 times per week | 0.39 (0.31–0.51) | 0.40 (0.30–0.54) | 0.63 (0.23–1.72) | 0.31 (0.15–0.60) |
| ≥3 times per week | 0.15 (0.08–0.26) | 0.17 (0.09–0.33) | 0.14 (0.02–1.32) | 0.04 (0.01–0.25) |
| p for interaction | 0.087 | |||
| Exercise frequency, No. (%) | ||||
| Never | 1.00 (reference) | 1.00 (reference) | 1.00 (reference) | 1.00 (reference) |
| 1–3 times per month | 2.09 (1.65–2.65) | 2.08 (1.59–2.72) | 3.48 (1.09–11.08) | 1.80 (0.96–3.39) |
| 1–2 times per week | 2.31 (1.75–3.05) | 2.29 (1.67–3.15) | 6.48 (1.91–21.92) | 1.93 (0.88–4.22) |
| 3–5 times per week | 2.89 (2.13–3.93) | 3.06 (2.15–4.36) | 5.43 (1.39–21.21) | 2.15 (0.95–4.89) |
| Everyday | 5.76 (4.35–7.63) | 5.78 (4.18–7.98) | 24.21 (6.50–90.19) | 5.07 (2.41–10.67) |
| p for interaction | 0.001 | |||
| Chronic bronchitis, No. (%) | ||||
| No | 1.00 (reference) | 1.00 (reference) | 1.00 (reference) | 1.00 (reference) |
| Yes | 0.91 (0.56–1.48) | 0.99 (0.40–2.41) | 12.45 (0.84–184.65) | 0.97 (0.52–1.81) |
| p for interaction | 0.164 | |||
| Asthma, No. (%) | ||||
| No | 1.00 (reference) | 1.00 (reference) | 1.00 (reference) | 1.00 (reference) |
| Yes | 2.52 (1.34–4.74) | 4.27 (1.84–9.92) | 0.78 (0.11–5.29) | 1.37 (0.40–4.68) |
| p for interaction | 0.113 | |||
| Chronic obstructive pulmonary disease, No. (%) | ||||
| No | 1.00 (reference) | 1.00 (reference) | 1.00 (reference) | 1.00 (reference) |
| Yes | 0.23 (0.09–0.59) | 0.32 (0.06–1.63) | 1.88 (0.19–18.51) | 0.16 (0.03–0.70) |
| p for interaction | 0.168 | |||
| Tuberculosis, No. (%) | ||||
| No | 1.00 (reference) | 1.00 (reference) | 1.00 (reference) | 1.00 (reference) |
| Yes | 3.69 (2.23–6.12) | 5.01 (2.59–9.69) | 26.04 (1.55–437.05) | 1.47 (0.55–3.90) |
| p for interaction | 0.018 | |||
| Pulmonary nodule, No. (%) | ||||
| No | 1.00 (reference) | 1.00 (reference) | 1.00 (reference) | 1.00 (reference) |
| Yes | 41.32 (31.40–54.36) | 42.82 (30.86–59.39) | 98.10 (26.91–357.66) | 33.75 (18.67–61.00) |
| p for interaction | 0.179 | |||
| Family history *, No. (%) | ||||
| No | 1.00 (reference) | 1.00 (reference) | 1.00 (reference) | 1.00 (reference) |
| Yes | 5.04 (4.41–5.76) | 5.86 (4.96–6.93) | 6.29 (3.75–10.55) | 3.22 (2.44–4.23) |
| p for interaction | <0.001 | |||
| Heavy metal, No. (%) | ||||
| No | 1.00 (reference) | 1.00 (reference) | 1.00 (reference) | 1.00 (reference) |
| Yes | 1.97 (1.31–2.96) | 1.60 (0.92–2.77) | 2.13 (0.54–8.50) | 3.05 (1.49–6.27) |
| p for interaction | 0.378 | |||
| Diesel, No. (%) | ||||
| No | 1.00 (reference) | 1.00 (reference) | 1.00 (reference) | 1.00 (reference) |
| Yes | 2.20 (1.29–3.73) | 2.46 (1.18–5.14) | 3.23 (0.62–16.90) | 2.37 (0.98–5.74) |
| p for interaction | 0.735 | |||
| Coal dust, No. (%) | ||||
| No | 1.00 (reference) | 1.00 (reference) | 1.00 (reference) | 1.00 (reference) |
| Yes | 2.73 (1.61–4.65) | 4.00 (1.88–8.53) | 15.70 (1.81–135.82) | 1.18 (0.46–3.03) |
| p for interaction | 0.013 | |||
| Asbestos, No. (%) | ||||
| No | 1.00 (reference) | 1.00 (reference) | 1.00 (reference) | 1.00 (reference) |
| Yes | 0.97 (0.46–2.03) | 1.02 (0.43–2.44) | 3.08 (0.16–58.33) | 0.65 (0.11–3.82) |
| p for interaction | 0.561 | |||
| Physical activity, No. (%) | ||||
| Inactive | 1.00 (reference) | 1.00 (reference) | 1.00 (reference) | 1.00 (reference) |
| Low active | 0.58 (0.44–0.77) | 0.61 (0.44–0.83) | 0.28 (0.08–0.96) | 0.54 (0.25–1.18) |
| Moderate active | 0.47 (0.36–0.62) | 0.52 (0.38–0.71) | 0.11 (0.03–0.39) | 0.44 (0.21–0.91) |
| High active | 0.39 (0.29–0.52) | 0.42 (0.30–0.58) | 0.08 (0.02–0.33) | 0.40 (0.19–0.85) |
| p for interaction | <0.001 | |||
| Drinking status, No. (%) | ||||
| Never | 1.00 (reference) | 1.00 (reference) | 1.00 (reference) | 1.00 (reference) |
| Current | 0.93 (0.83–1.04) | 0.76 (0.65–0.89) | 1.68 (1.21–2.35) | 0.99 (0.79–1.25) |
| Former | 1.63 (1.35–1.97) | 1.88 (1.36–2.62) | 3.63 (1.80–7.31) | 1.39 (1.06–1.82) |
| p for interaction | <0.001 | |||
| Height, cm | 1.02 (1.01–1.03) | 1.02 (1.01–1.03) | 1.03 (1.00–1.06) | 1.05 (1.02–1.07) |
| p for interaction | 0.079 | |||
| Weight, kg | 1.00 (1.00–1.01) | 1.00 (1.00–1.01) | 1.01 (0.99–1.03) | 1.00 (0.99–1.01) |
| p for interaction | 0.081 | |||
| Weight change †, kg | 0.94 (0.93–0.96) | 0.93 (0.92–0.95) | 0.93 (0.87–0.99) | 0.97 (0.94–1.00) |
| p for interaction | 0.043 | |||
| Pack year ‡, years | 1.01 (1.00–1.01) | NA | 1.00 (1.00–1.01) | 1.00 (1.00–1.01) |
| p for interaction | 0.625 | |||
Disclaimer/Publisher’s Note: The statements, opinions and data contained in all publications are solely those of the individual author(s) and contributor(s) and not of MDPI and/or the editor(s). MDPI and/or the editor(s) disclaim responsibility for any injury to people or property resulting from any ideas, methods, instructions or products referred to in the content. |
© 2025 by the authors. Licensee MDPI, Basel, Switzerland. This article is an open access article distributed under the terms and conditions of the Creative Commons Attribution (CC BY) license (https://creativecommons.org/licenses/by/4.0/).
Share and Cite
Tu, H.; Zhao, Y.; Cui, J.; Lu, W.; Sun, G.; Xu, X.; Hu, Q.; Hu, K.; Wu, M.; Wu, X. Improving Lung Cancer Risk Prediction Using Machine Learning: A Comparative Analysis of Stacking Models and Traditional Approaches. Cancers 2025, 17, 1651. https://doi.org/10.3390/cancers17101651
Tu H, Zhao Y, Cui J, Lu W, Sun G, Xu X, Hu Q, Hu K, Wu M, Wu X. Improving Lung Cancer Risk Prediction Using Machine Learning: A Comparative Analysis of Stacking Models and Traditional Approaches. Cancers. 2025; 17(10):1651. https://doi.org/10.3390/cancers17101651
Chicago/Turabian StyleTu, Huakang, Yunfeng Zhao, Jiameng Cui, Wanzhu Lu, Gege Sun, Xiaohang Xu, Qingfeng Hu, Kejia Hu, Ming Wu, and Xifeng Wu. 2025. "Improving Lung Cancer Risk Prediction Using Machine Learning: A Comparative Analysis of Stacking Models and Traditional Approaches" Cancers 17, no. 10: 1651. https://doi.org/10.3390/cancers17101651
APA StyleTu, H., Zhao, Y., Cui, J., Lu, W., Sun, G., Xu, X., Hu, Q., Hu, K., Wu, M., & Wu, X. (2025). Improving Lung Cancer Risk Prediction Using Machine Learning: A Comparative Analysis of Stacking Models and Traditional Approaches. Cancers, 17(10), 1651. https://doi.org/10.3390/cancers17101651