
Blood-Based DNA Methylation Analysis by Multiplexed OBBPA-ddPCR to Verify Indications for Prostate Biopsies in Suspected Prostate Cancer Patients


 , and
, and 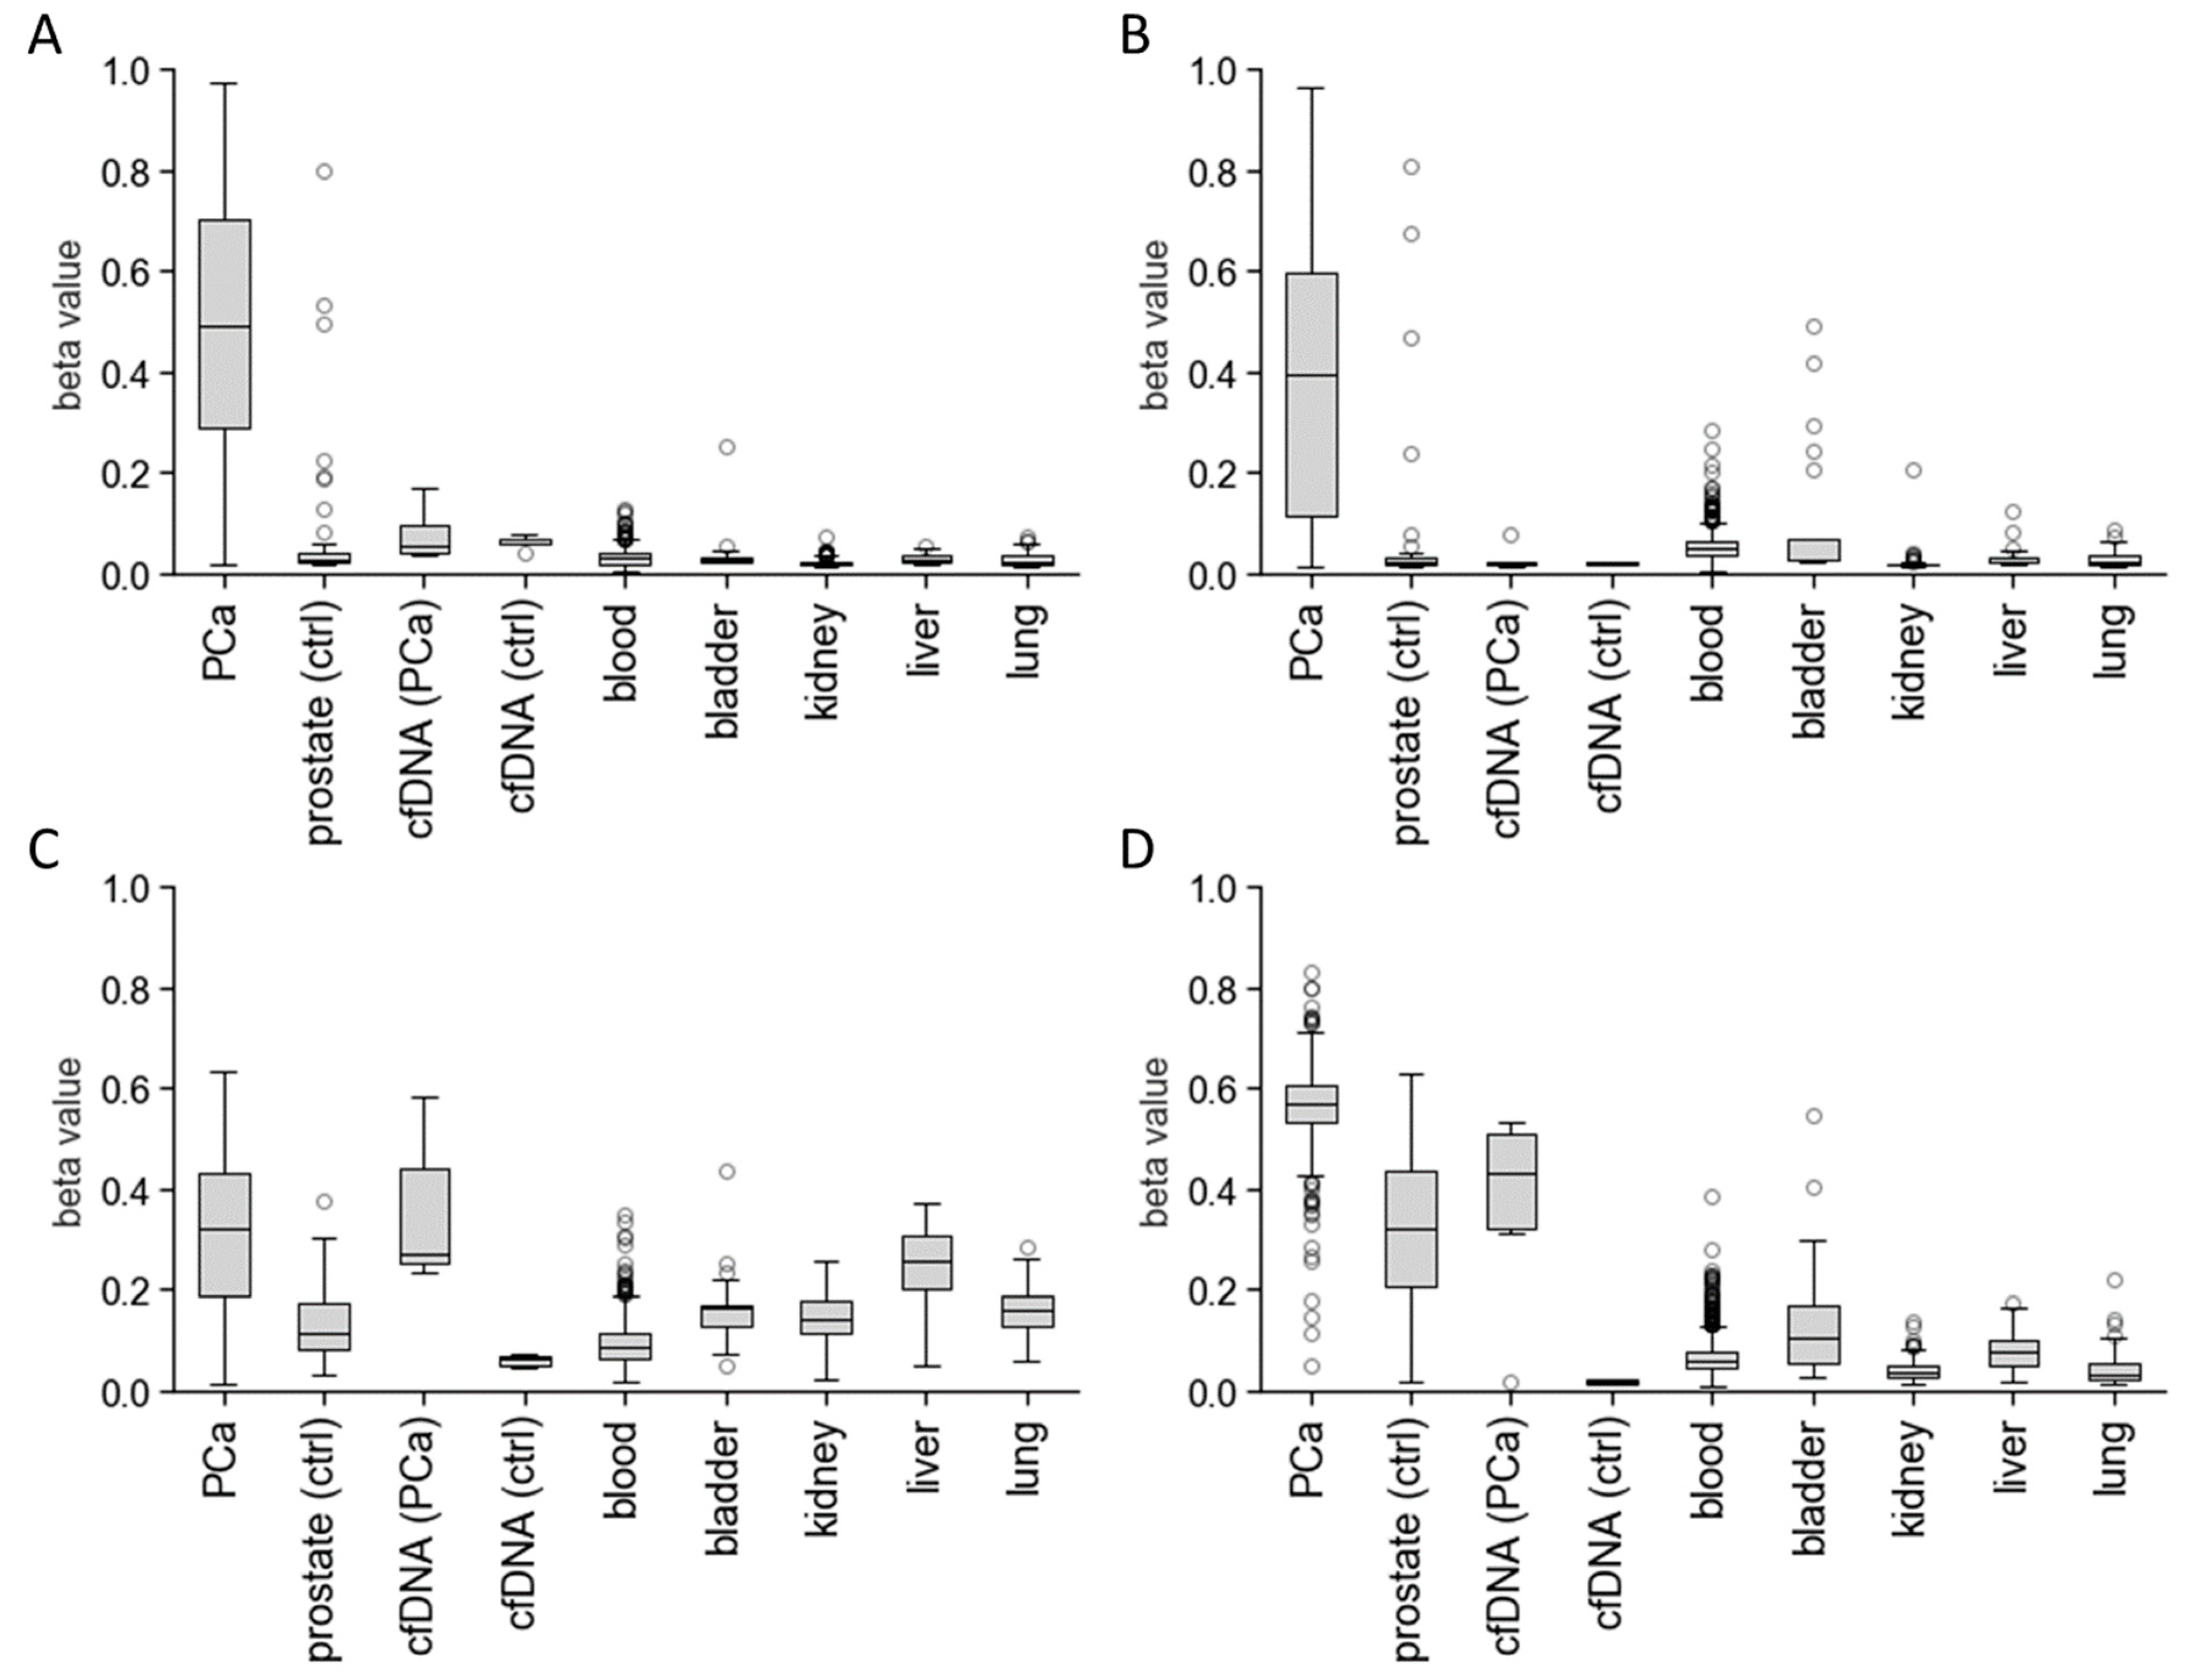
Abstract
Simple Summary
Abstract
1. Introduction
2. Materials and Methods
2.1. Blood Plasma Sample Collection and Analysis
2.2. In Silico Biomarker Selection
2.3. Preparation and Usage of External dsDNA Standard
2.4. Isolation of cfDNA from Blood Samples
2.5. Bisulphite Modification of Isolated cfDNA
2.6. Preparation of DNA Samples with a 50% Methylation Degree
2.7. Preamplification of Bisulphite-Modified DNA
2.8. ddPCR of Bisulphite-Modified DNA
2.9. Data Analysis
3. Results
3.1. In Silico Biomarker Selection
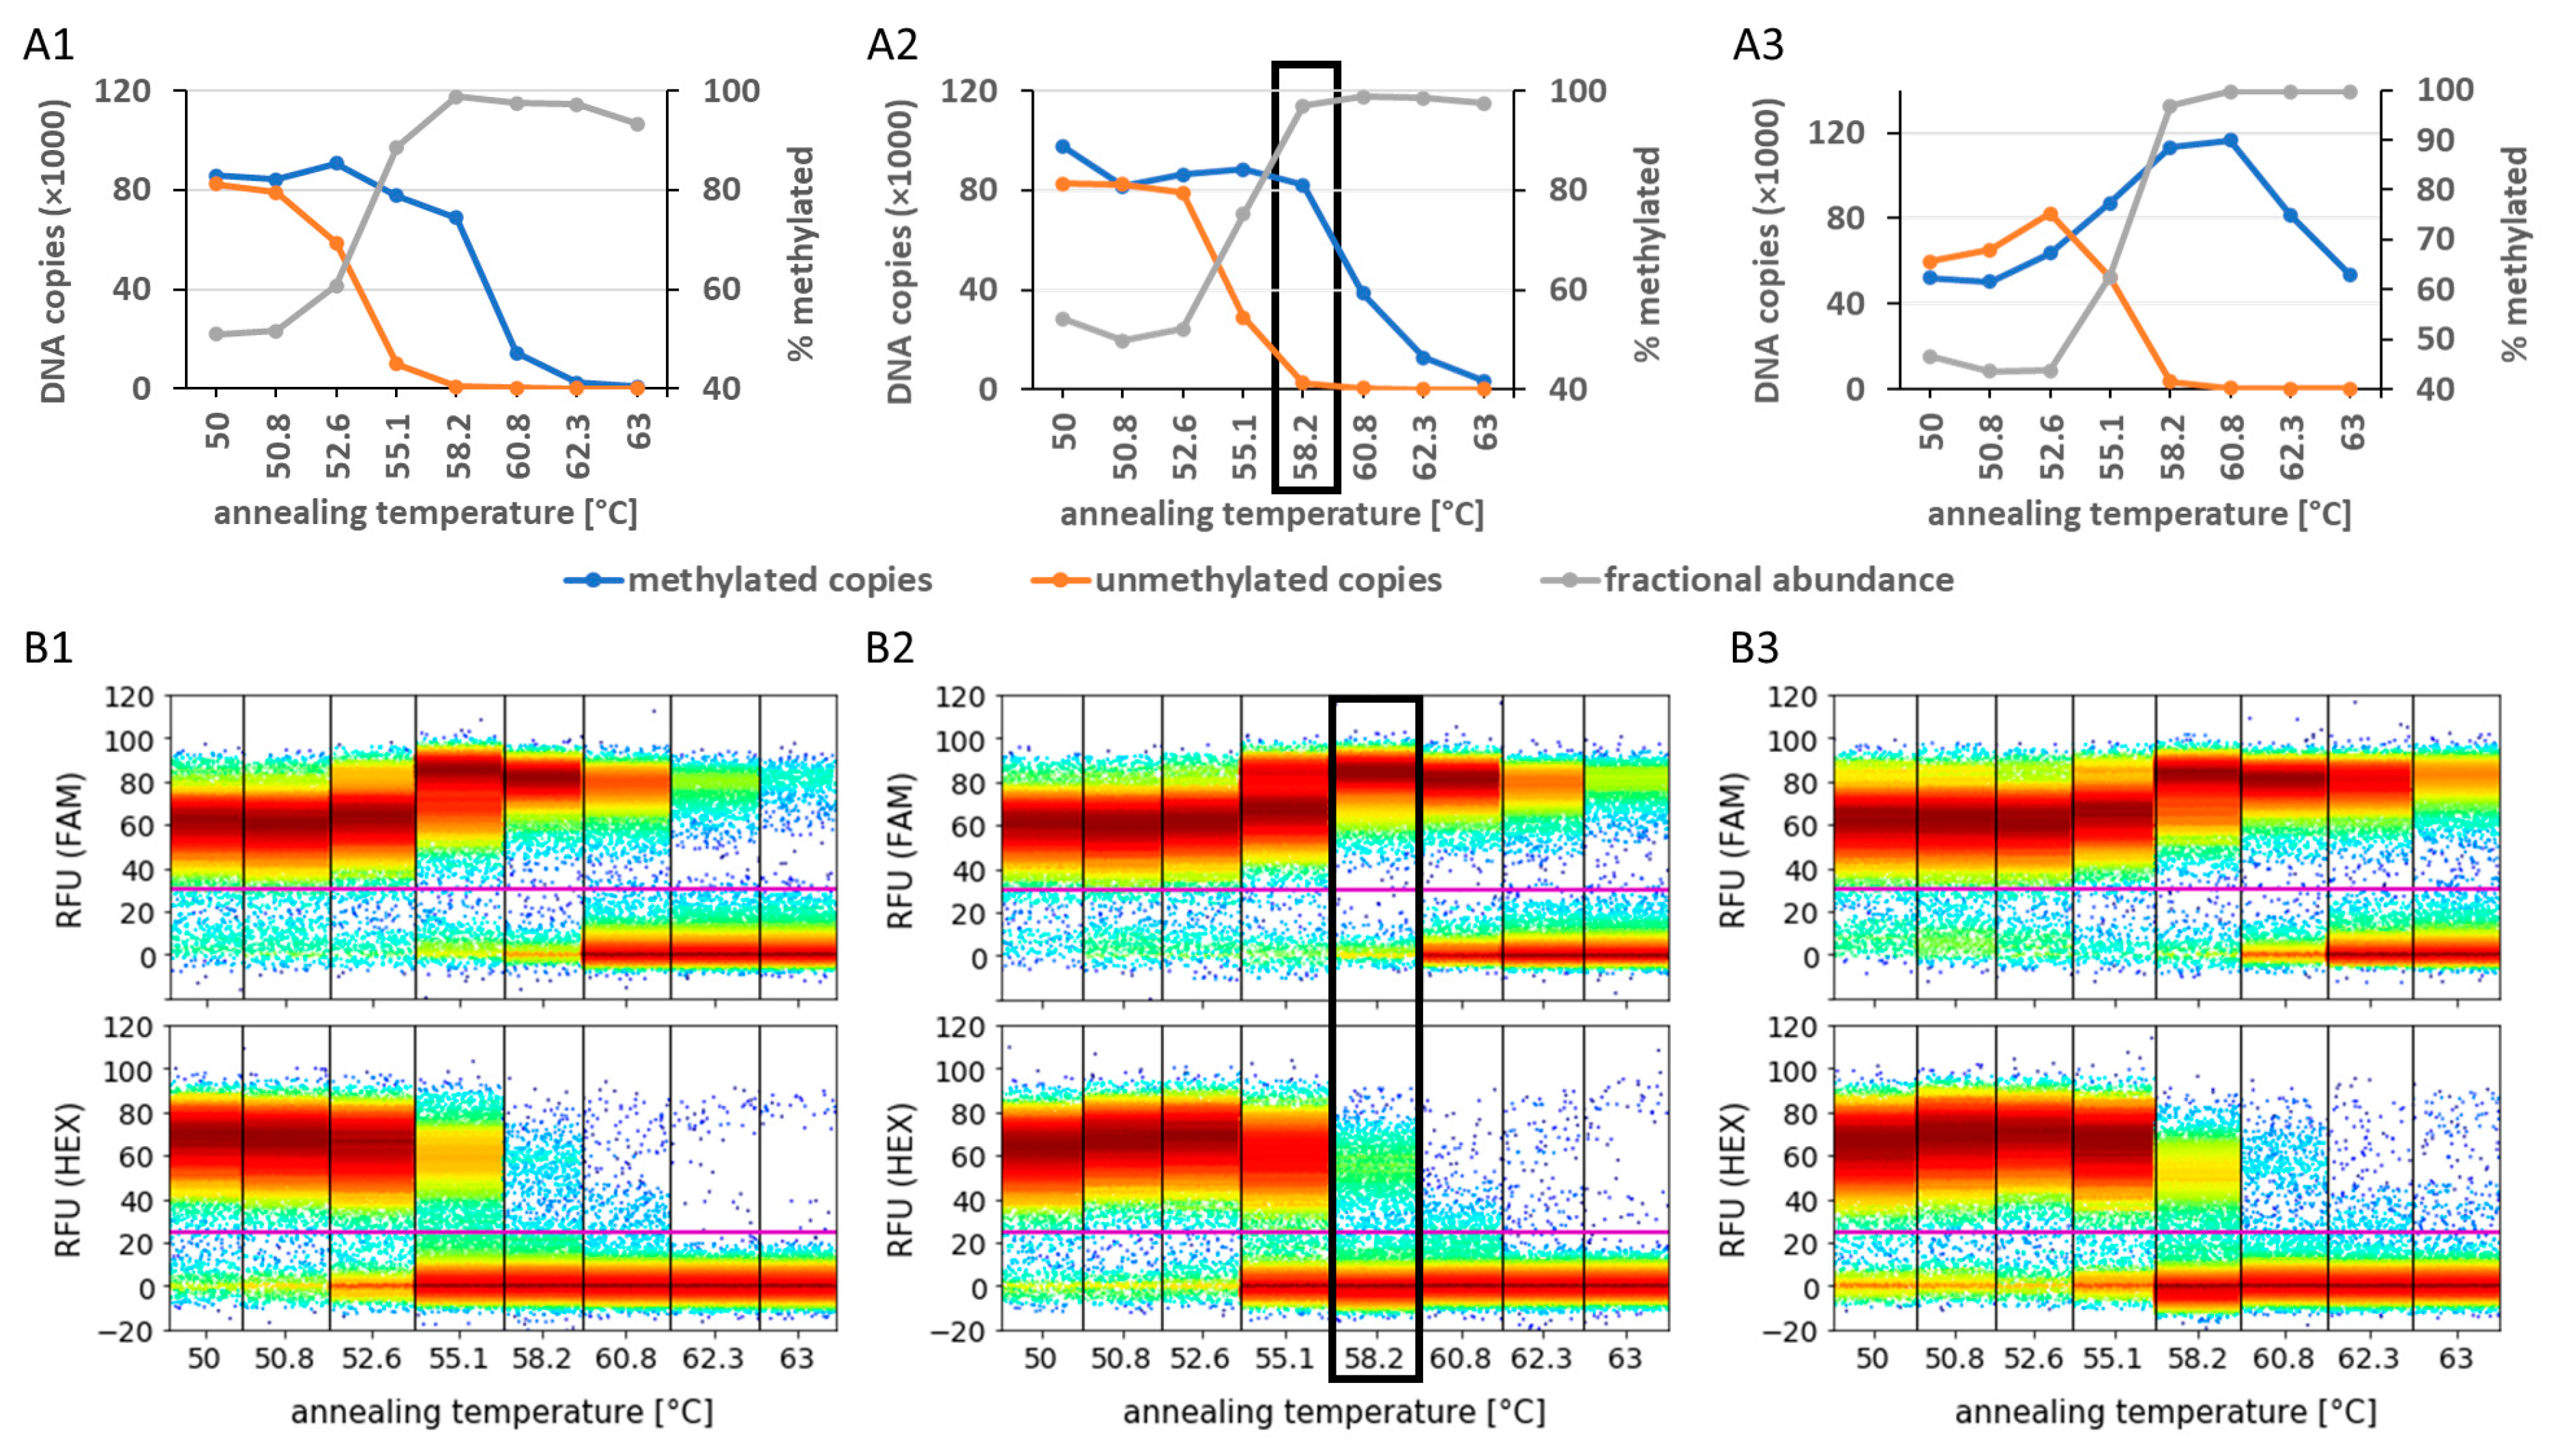
3.2. Analysis of Preamplification PCR Biases Using Primer Design, MgCl2 Concentration, and Annealing Temperature Optimisation
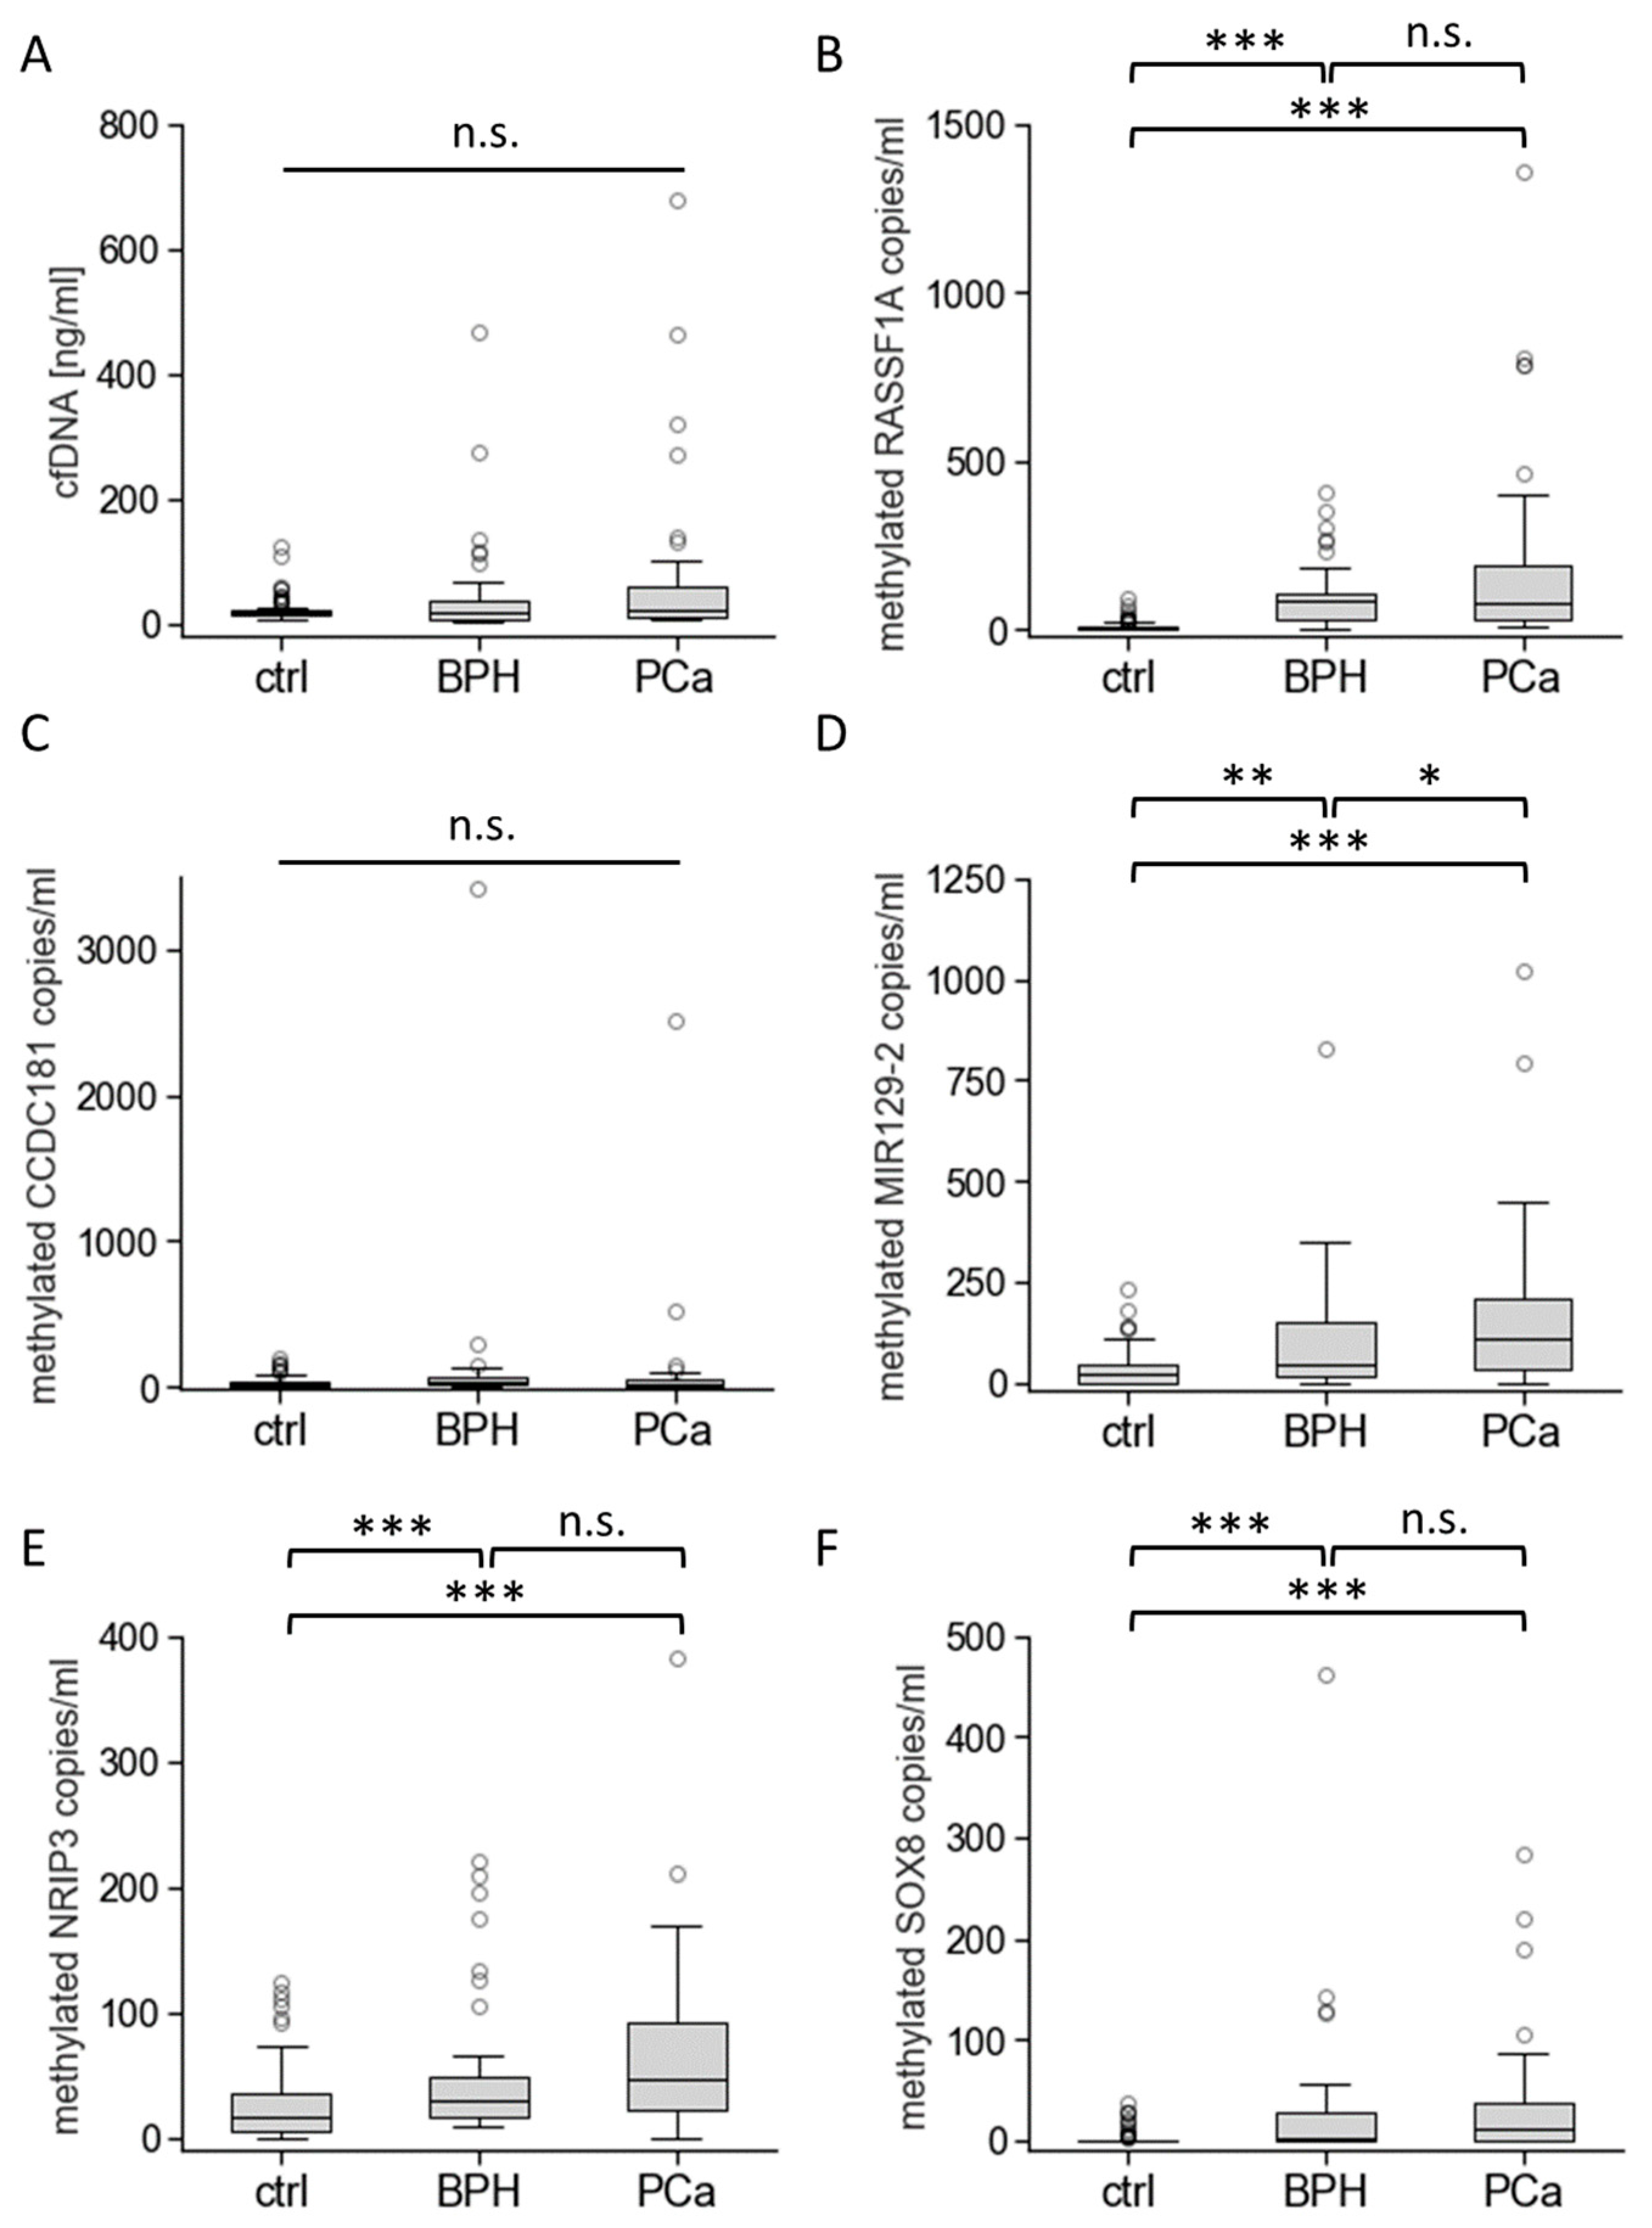
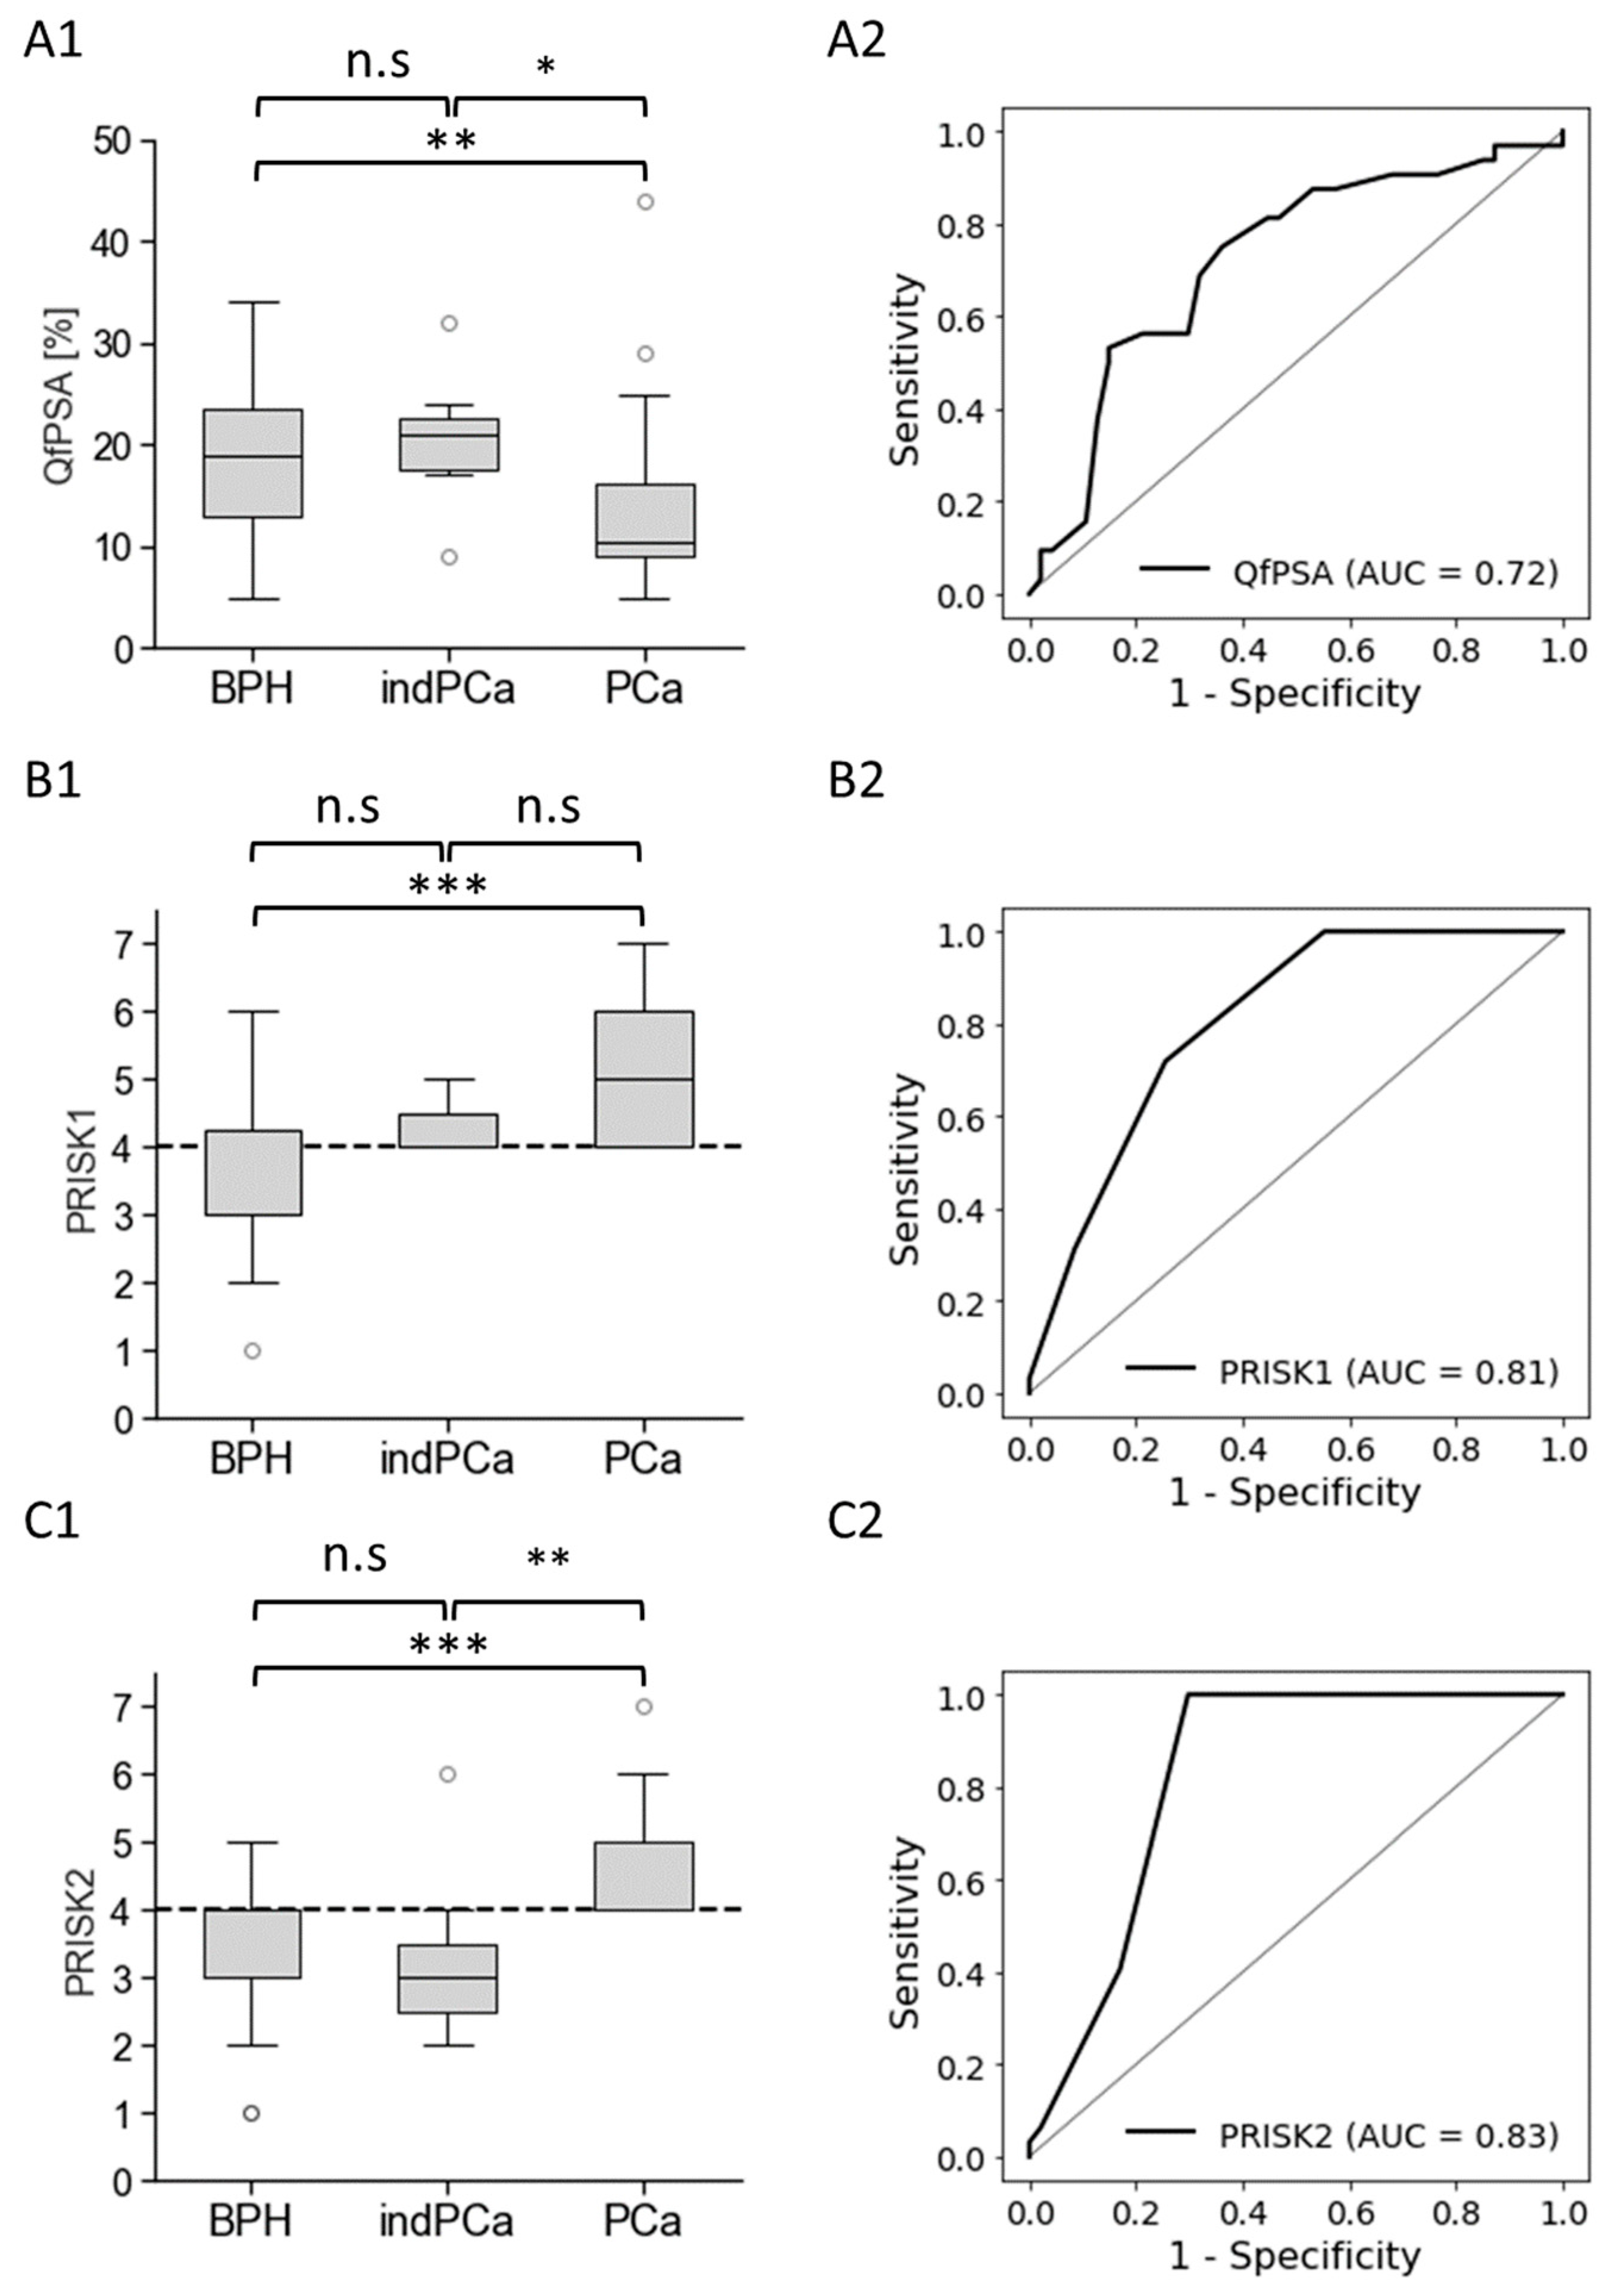
3.3. Biomarkers’ Methylation in Healthy Individuals and Patients with BPH or PCa
4. Discussion
5. Conclusions
Supplementary Materials
Author Contributions
Funding
Institutional Review Board Statement
Informed Consent Statement
Data Availability Statement
Acknowledgments
Conflicts of Interest
Abbreviations
| ASAP | atypical small acinar proliferation |
| AUC | area under the curve |
| BPH | benign prostatic hyperplasia |
| BRCA1 and 2 | breast cancer gene 1 and 2 |
| CCDC181 | coiled-coil domain containing 181 |
| cell-free DNA | cfDNA |
| CPD | copy per droplet |
| ddPCR | digital droplet PCR |
| FAM | carboxyfluorescein |
| fPSA | free (unbound) prostate-specific antigen |
| GS | Gleason score |
| HEX | hexachloro-fluorescein |
| MIR129-2 | microRNA 129-2 gene |
| NRIP3 | nuclear receptor interacting protein 3 gene |
| OBBPA-ddPCR | optimised bias-based preamplification–digital droplet PCR |
| PCa | prostate carcinoma |
| phi | prostate health index |
| piRISK1 and 2 | PSA-independent prostate carcinoma risk scores 1 and 2 |
| PRISK1 and 2 | PSA-dependent prostate carcinoma risk scores 1 and 2 |
| QfPSA | percentage of free PSA compared to total PSA |
| RASSF1A | Ras association domain family member 1 gene |
| ROC curve analyses | receiver operating characteristic curve analyses |
| SEN | diagnostic sensitivity |
| SOX8 | SRY-box transcription factor 8 gene |
| SPE | diagnostic specificity |
| TCGA | The Cancer Genome Atlas |
| tPSA | total serum prostate-specific antigen |
References
- Sung, H.; Ferlay, J.; Siegel, R.L.; Laversanne, M.; Soerjomataram, I.; Jemal, A.; Bray, F. Global Cancer Statistics 2020: GLOBOCAN Estimates of Incidence and Mortality Worldwide for 36 Cancers in 185 Countries. CA Cancer J. Clin. 2021, 71, 209–249. [Google Scholar] [CrossRef] [PubMed]
- Rebbeck, T.R.; Devesa, S.S.; Chang, B.-L.; Bunker, C.H.; Cheng, I.; Cooney, K.; Eeles, R.; Fernandez, P.; Giri, V.N.; Gueye, S.M.; et al. Global patterns of prostate cancer incidence, aggressiveness, and mortality in men of african descent. Prostate Cancer 2013, 2013, 560857. [Google Scholar] [CrossRef] [PubMed]
- Merriel, S.W.D.; Pocock, L.; Gilbert, E.; Creavin, S.; Walter, F.M.; Spencer, A.; Hamilton, W. Systematic review and meta-analysis of the diagnostic accuracy of prostate-specific antigen (PSA) for the detection of prostate cancer in symptomatic patients. BMC Med. 2022, 20, 54. [Google Scholar] [CrossRef] [PubMed]
- Schmelz, H.-U.; Sparwasser, C.; Weidner, W. (Eds.) Facharztwissen Urologie: Differenzierte Diagnostik und Therapie, 3rd ed.; Springer: Berlin/Heidelberg, Germany, 2014; ISBN 3642449417. [Google Scholar]
- Catalona, W.J.; Richie, J.P.; Ahmann, F.R.; Hudson, M.A.; Scardino, P.T.; Flanigan, R.C.; DeKernion, J.B.; Ratliff, T.L.; Kavoussi, L.R.; Dalkin, B.L.; et al. Comparison of Digital Rectal Examination and Serum Prostate Specific Antigen in the Early Detection of Prostate Cancer: Results of a Multicenter Clinical Trial of 6,630 Men. J. Urol. 2017, 197, S200–S207. [Google Scholar] [CrossRef] [PubMed]
- Mian, B.M.; Naya, Y.; Okihara, K.; Vakar-Lopez, F.; Troncoso, P.; Babaian, R.J. Predictors of cancer in repeat extended multisite prostate biopsy in men with previous negative extended multisite biopsy. Urology 2002, 60, 836–840. [Google Scholar] [CrossRef]
- Tombal, B. Over- and Underdiagnosis of Prostate Cancer: The Dangers. Eur. Urol. Suppl. 2006, 5, 511–513. [Google Scholar] [CrossRef]
- Tombal, B. Toward the end of blind prostate biopsies? Eur. Urol. 2012, 62, 997–998; discussion 999–1000. [Google Scholar] [CrossRef] [PubMed]
- Lin, K.; Croswell, J.M.; Koenig, H.; Lam, C.; Maltz, A. Prostate-Specific Antigen-Based Screening for Prostate Cancer: An Evidence Update for the U.S. Preventive Services Task Force; Agency for Healthcare Research and Quality: Rockville, MD, USA, 2011. [Google Scholar]
- Thompson, I.M.; Goodman, P.J.; Tangen, C.M.; Lucia, M.S.; Miller, G.J.; Ford, L.G.; Lieber, M.M.; Cespedes, R.D.; Atkins, J.N.; Lippman, S.M.; et al. The influence of finasteride on the development of prostate cancer. N. Engl. J. Med. 2003, 349, 215–224. [Google Scholar] [CrossRef] [PubMed]
- Martin, R.M.; Donovan, J.L.; Turner, E.L.; Metcalfe, C.; Young, G.J.; Walsh, E.I.; Lane, J.A.; Noble, S.; Oliver, S.E.; Evans, S.; et al. Effect of a Low-Intensity PSA-Based Screening Intervention on Prostate Cancer Mortality: The CAP Randomized Clinical Trial. JAMA 2018, 319, 883–895. [Google Scholar] [CrossRef]
- de Rooij, M.; Hamoen, E.H.J.; Fütterer, J.J.; Barentsz, J.O.; Rovers, M.M. Accuracy of multiparametric MRI for prostate cancer detection: A meta-analysis. AJR Am. J. Roentgenol. 2014, 202, 343–351. [Google Scholar] [CrossRef]
- Laird, P.W. The power and the promise of DNA methylation markers. Nat. Rev. Cancer 2003, 3, 253–266. [Google Scholar] [CrossRef] [PubMed]
- Levenson, V.V. Biomarkers for early detection of breast cancer: What, when, and where? Biochim. Biophys. Acta 2007, 1770, 847–856. [Google Scholar] [CrossRef]
- Shames, D.S.; Minna, J.D.; Gazdar, A.F. DNA methylation in health, disease, and cancer. Curr. Mol. Med. 2007, 7, 85–102. [Google Scholar] [CrossRef] [PubMed]
- Tost, J. DNA methylation: An introduction to the biology and the disease-associated changes of a promising biomarker. Mol. Biotechnol. 2010, 44, 71–81. [Google Scholar] [CrossRef] [PubMed]
- Esteller, M. Epigenetics in cancer. N. Engl. J. Med. 2008, 358, 1148–1159. [Google Scholar] [CrossRef] [PubMed]
- Friedemann, M.; Gutewort, K.; Thiem, D.; Nacke, B.; Jandeck, C.; Lange, B.S.; Sukocheva, O.; Suttorp, M.; Menschikowski, M. Methylation of the Phospholipase A2 Receptor 1 Promoter Region in Childhood B Cell Acute Lymphoblastic Leukaemia. Sci. Rep. 2020, 10, 9058. [Google Scholar] [CrossRef]
- Menschikowski, M.; Jandeck, C.; Friedemann, M.; Nacke, B.; Hantsche, S.; Tiebel, O.; Sukocheva, O.; Hagelgans, A. Identification of rare levels of methylated tumor DNA fragments using an optimized bias based pre-amplification-digital droplet PCR (OBBPA-ddPCR). Oncotarget 2018, 9, 36137–36150. [Google Scholar] [CrossRef]
- Friedemann, M.; Horn, F.; Gutewort, K.; Tautz, L.; Jandeck, C.; Bechmann, N.; Sukocheva, O.; Wirth, M.P.; Fuessel, S.; Menschikowski, M. Increased Sensitivity of Detection of RASSF1A and GSTP1 DNA Fragments in Serum of Prostate Cancer Patients: Optimisation of Diagnostics Using OBBPA-ddPCR. Cancers 2021, 13. [Google Scholar] [CrossRef]
- Jin, Y.; Jung, J.H.; Han, W.K.; Hwang, E.C.; Nho, Y.; Lee, N.; Yun, J.E.; Lee, K.S.; Lee, S.H.; Lee, H.; et al. Diagnostic accuracy of prostate-specific antigen below 4 ng/mL as a cutoff for diagnosing prostate cancer in a hospital setting: A systematic review and meta-analysis. Investig. Clin. Urol. 2022, 63, 251–261. [Google Scholar] [CrossRef]
- Lojanapiwat, B.; Anutrakulchai, W.; Chongruksut, W.; Udomphot, C. Correlation and diagnostic performance of the prostate-specific antigen level with the diagnosis, aggressiveness, and bone metastasis of prostate cancer in clinical practice. Prostate Int. 2014, 2, 133–139. [Google Scholar] [CrossRef]
- Broad Institute TCGA Genome Data Analysis Center. Analysis-Ready Standardized TCGA Data from Broad GDAC Firehose TCGA Data Version 2016_01_28 for PRAD; Broad Institute TCGA Genome Data Analysis Center: Cambridge, MA, USA, 2016. [Google Scholar]
- Sun, K.; Jiang, P.; Chan, K.C.A.; Wong, J.; Cheng, Y.K.Y.; Liang, R.H.S.; Chan, W.; Ma, E.S.K.; Chan, S.L.; Cheng, S.H.; et al. Plasma DNA tissue mapping by genome-wide methylation sequencing for noninvasive prenatal, cancer, and transplantation assessments. Proc. Natl. Acad. Sci. USA 2015, 112, E5503–E5512. [Google Scholar] [CrossRef] [PubMed]
- Loyfer, N.; Magenheim, J.; Peretz, A.; Cann, G.; Bredno, J.; Klochendler, A.; Fox-Fisher, I.; Shabi-Porat, S.; Hecht, M.; Pelet, T.; et al. A DNA methylation atlas of normal human cell types. Nature 2023, 613, 355–364. [Google Scholar] [CrossRef] [PubMed]
- Johansson, A.; Enroth, S.; Gyllensten, U. Continuous Aging of the Human DNA Methylome Throughout the Human Lifespan. PLoS ONE 2013, 8, e67378. [Google Scholar] [CrossRef]
- Li, S.; Zeng, W.; Ni, X.; Liu, Q.; Li, W.; Stackpole, M.L.; Zhou, Y.; Gower, A.; Krysan, K.; Ahuja, P.; et al. Comprehensive tissue deconvolution of cell-free DNA by deep learning for disease diagnosis and monitoring. Proc. Natl. Acad. Sci. USA 2023, 120, e2305236120. [Google Scholar] [CrossRef] [PubMed]
- Zhou, W.; Laird, P.W.; Shen, H. Comprehensive characterization, annotation and innovative use of Infinium DNA methylation BeadChip probes. Nucleic Acids Res. 2017, 45, e22. [Google Scholar] [CrossRef] [PubMed]
- SHAPIRO, S.S.; WILK, M.B. An analysis of variance test for normality (complete samples). Biometrika 1965, 52, 591–611. [Google Scholar] [CrossRef]
- Chin, H.W.; Kim, J.; Rasp, G.; Hristov, B. Prostate Cancer in Seniors: Part 1: Epidemiology, Pathology, and Screening. Fed. Pract. 2015, 32, 41S–44S. [Google Scholar] [PubMed]
- Yilmaz, H.; Ciftci, S.; Yavuz, U.; Ustuner, M.; Saribacak, A.; Dillioglugil, O. Percentage of free prostate-specific antigen (PSA) is a useful method in deciding to perform prostate biopsy with higher core numbers in patients with low PSA cut-off values. Kaohsiung J. Med. Sci. 2015, 31, 315–319. [Google Scholar] [CrossRef] [PubMed]
- Hernández, H.G.; Tse, M.Y.; Pang, S.C.; Arboleda, H.; Forero, D.A. Optimizing methodologies for PCR-based DNA methylation analysis. Biotechniques 2013, 55, 181–197. [Google Scholar] [CrossRef]
- Kristensen, L.S.; Wojdacz, T.K.; Thestrup, B.B.; Wiuf, C.; Hager, H.; Hansen, L.L. Quality assessment of DNA derived from up to 30 years old formalin fixed paraffin embedded (FFPE) tissue for PCR-based methylation analysis using SMART-MSP and MS-HRM. BMC Cancer 2009, 9, 453. [Google Scholar] [CrossRef]
- Shaw, R.J.; Akufo-Tetteh, E.K.; Risk, J.M.; Field, J.K.; Liloglou, T. Methylation enrichment pyrosequencing: Combining the specificity of MSP with validation by pyrosequencing. Nucleic Acids Res. 2006, 34, e78. [Google Scholar] [CrossRef] [PubMed]
- Rand, K.; Qu, W.; Ho, T.; Clark, S.J.; Molloy, P. Conversion-specific detection of DNA methylation using real-time polymerase chain reaction (ConLight-MSP) to avoid false positives. Methods 2002, 27, 114–120. [Google Scholar] [CrossRef] [PubMed]
- Kristensen, L.S.; Mikeska, T.; Krypuy, M.; Dobrovic, A. Sensitive Melting Analysis after Real Time- Methylation Specific PCR (SMART-MSP): High-throughput and probe-free quantitative DNA methylation detection. Nucleic Acids Res. 2008, 36, e42. [Google Scholar] [CrossRef] [PubMed]
- Kristensen, L.S.; Raynor, M.P.; Candiloro, I.; Dobrovic, A. Methylation profiling of normal individuals reveals mosaic promoter methylation of cancer-associated genes. Oncotarget 2012, 3, 450–461. [Google Scholar] [CrossRef] [PubMed]
- Preusser, M.; Elezi, L.; Hainfellner, J.A. Reliability and reproducibility of PCR-based testing of O6-methylguanine-DNA methyltransferase gene (MGMT) promoter methylation status in formalin-fixed and paraffin-embedded neurosurgical biopsy specimens. Clin. Neuropathol. 2008, 27, 388–390. [Google Scholar] [CrossRef] [PubMed]
- Xu, G.; Zhou, X.; Xing, J.; Xiao, Y.; Jin, B.; Sun, L.; Yang, H.; Du, S.; Xu, H.; Mao, Y. Identification of RASSF1A promoter hypermethylation as a biomarker for hepatocellular carcinoma. Cancer Cell Int. 2020, 20, 547. [Google Scholar] [CrossRef]
- Ye, M.; Huang, T.; Ni, C.; Yang, P.; Chen, S. Diagnostic Capacity of RASSF1A Promoter Methylation as a Biomarker in Tissue, Brushing, and Blood Samples of Nasopharyngeal Carcinoma. EBioMedicine 2017, 18, 32–40. [Google Scholar] [CrossRef]
- Pabalan, N.; Kunjantarachot, A.; Ruangpratheep, C.; Jarjanazi, H.; Christofolini, D.M.; Barbosa, C.P.; Bianco, B. Potential of RASSF1A promoter methylation as biomarker for endometrial cancer: A systematic review and meta-analysis. Gynecol. Oncol. 2017, 146, 603–608. [Google Scholar] [CrossRef] [PubMed]
- Daniunaite, K.; Jarmalaite, S.; Kalinauskaite, N.; Petroska, D.; Laurinavicius, A.; Lazutka, J.R.; Jankevicius, F. Prognostic value of RASSF1 promoter methylation in prostate cancer. J. Urol. 2014, 192, 1849–1855. [Google Scholar] [CrossRef]
- Stewart, G.D.; van Neste, L.; Delvenne, P.; Delrée, P.; Delga, A.; McNeill, S.A.; O’Donnell, M.; Clark, J.; van Criekinge, W.; Bigley, J.; et al. Clinical utility of an epigenetic assay to detect occult prostate cancer in histopathologically negative biopsies: Results of the MATLOC study. J. Urol. 2013, 189, 1110–1116. [Google Scholar] [CrossRef]
- Tang, W.; Guo, X.; Niu, L.; Song, D.; Han, B.; Zhang, H. Identification of key molecular targets that correlate with breast cancer through bioinformatic methods. J. Gene Med. 2020, 22, e3141. [Google Scholar] [CrossRef]
- Burdennyy, A.M.; Filippova, E.A.; Khodyrev, D.S.; Pronina, I.V.; Lukina, S.S.; Ivanova, N.A.; Kazubskaya, T.P.; Loginov, V.I.; Braga, E.A. Optimized Marker System for Early Diagnosis of Breast Cancer. Bull. Exp. Biol. Med. 2021, 172, 57–62. [Google Scholar] [CrossRef]
- Vrba, L.; Futscher, B.W. A suite of DNA methylation markers that can detect most common human cancers. Epigenetics 2018, 13, 61–72. [Google Scholar] [CrossRef]
- Qin, S.; Liu, G.; Jin, H.; Chen, X.; He, J.; Xiao, J.; Qin, Y.; Mao, Y.; Zhao, L. The Dysregulation of SOX Family Correlates with DNA Methylation and Immune Microenvironment Characteristics to Predict Prognosis in Hepatocellular Carcinoma. Dis. Markers 2022, 2022, 2676114. [Google Scholar] [CrossRef]
- Macedo-Silva, C.; Constâncio, V.; Miranda-Gonçalves, V.; Leite-Silva, P.; Salta, S.; Lobo, J.; Guimarães, R.; Carvalho-Maia, C.; Gigliano, D.; Farinha, M.; et al. DNA methylation biomarkers accurately detect esophageal cancer prior and post neoadjuvant chemoradiation. Cancer Med. 2023, 12, 8777–8788. [Google Scholar] [CrossRef]
- Gubenko, M.S.; Loginov, V.I.; Burdennyy, A.M.; Pronina, I.V.; Kazubskaya, T.P.; Pertsov, S.S. Changes in the Level of Methylation of a Group of microRNA Genes as a Factor in the Development and Progression of Non-Small Cell Lung Cancer. Bull. Exp. Biol. Med. 2022, 174, 254–258. [Google Scholar] [CrossRef]
- Patil, N.; Abba, M.L.; Zhou, C.; Chang, S.; Gaiser, T.; Leupold, J.H.; Allgayer, H. Changes in Methylation across Structural and MicroRNA Genes Relevant for Progression and Metastasis in Colorectal Cancer. Cancers 2021, 13, 5951. [Google Scholar] [CrossRef]
- Rezayi Soufiani, A.; Dolatkhah, R.; Raeisi, M.; Chavoshi, H.; Mohammadi, P.; Mehdinavaz Aghdam, A. Hypermethylation of MIR129-2 Regulates SOX4 Transcription and Associates with Metastasis in Patients with Colorectal Cancer. J. Gastrointest. Cancer 2022, 53, 718–724. [Google Scholar] [CrossRef]
- Grimm, D.; Bauer, J.; Wise, P.; Krüger, M.; Simonsen, U.; Wehland, M.; Infanger, M.; Corydon, T.J. The role of SOX family members in solid tumours and metastasis. Semin. Cancer Biol. 2020, 67, 122–153. [Google Scholar] [CrossRef]
- Schlierf, B.; Friedrich, R.P.; Roerig, P.; Felsberg, J.; Reifenberger, G.; Wegner, M. Expression of SoxE and SoxD genes in human gliomas. Neuropathol. Appl. Neurobiol. 2007, 33, 621–630. [Google Scholar] [CrossRef]
- Chen, Y.-C.; Huang, R.-L.; Huang, Y.-K.; Liao, Y.-P.; Su, P.-H.; Wang, H.-C.; Chang, C.-C.; Lin, Y.-W.; Yu, M.-H.; Chu, T.-Y.; et al. Methylomics analysis identifies epigenetically silenced genes and implies an activation of β-catenin signaling in cervical cancer. Int. J. Cancer 2014, 135, 117–127. [Google Scholar] [CrossRef] [PubMed]
- Liu, H.; Gao, Y.; Vafaei, S.; Gu, X.; Zhong, X. The Prognostic Value of Plasma Cell-Free DNA Concentration in the Prostate Cancer: A Systematic Review and Meta-Analysis. Front. Oncol. 2021, 11, 599602. [Google Scholar] [CrossRef] [PubMed]
- Huang, Y.; Li, Z.-Z.; Huang, Y.-L.; Song, H.-J.; Wang, Y.-J. Value of free/total prostate-specific antigen (f/t PSA) ratios for prostate cancer detection in patients with total serum prostate-specific antigen between 4 and 10 ng/mL: A meta-analysis. Medicine 2018, 97, e0249. [Google Scholar] [CrossRef] [PubMed]
- Catalona, W.J.; Partin, A.W.; Sanda, M.G.; Wei, J.T.; Klee, G.G.; Bangma, C.H.; Slawin, K.M.; Marks, L.S.; Loeb, S.; Broyles, D.L.; et al. A multicenter study of [-2]pro-prostate specific antigen combined with prostate specific antigen and free prostate specific antigen for prostate cancer detection in the 2.0 to 10.0 ng/ml prostate specific antigen range. J. Urol. 2011, 185, 1650–1655. [Google Scholar] [CrossRef] [PubMed]


Disclaimer/Publisher’s Note: The statements, opinions and data contained in all publications are solely those of the individual author(s) and contributor(s) and not of MDPI and/or the editor(s). MDPI and/or the editor(s) disclaim responsibility for any injury to people or property resulting from any ideas, methods, instructions or products referred to in the content. |
© 2024 by the authors. Licensee MDPI, Basel, Switzerland. This article is an open access article distributed under the terms and conditions of the Creative Commons Attribution (CC BY) license (https://creativecommons.org/licenses/by/4.0/).
Share and Cite
Friedemann, M.; Jandeck, C.; Tautz, L.; Gutewort, K.; von Rein, L.; Sukocheva, O.; Fuessel, S.; Menschikowski, M. Blood-Based DNA Methylation Analysis by Multiplexed OBBPA-ddPCR to Verify Indications for Prostate Biopsies in Suspected Prostate Cancer Patients. Cancers 2024, 16, 1324. https://doi.org/10.3390/cancers16071324
Friedemann M, Jandeck C, Tautz L, Gutewort K, von Rein L, Sukocheva O, Fuessel S, Menschikowski M. Blood-Based DNA Methylation Analysis by Multiplexed OBBPA-ddPCR to Verify Indications for Prostate Biopsies in Suspected Prostate Cancer Patients. Cancers. 2024; 16(7):1324. https://doi.org/10.3390/cancers16071324
Chicago/Turabian StyleFriedemann, Markus, Carsten Jandeck, Lars Tautz, Katharina Gutewort, Lisa von Rein, Olga Sukocheva, Susanne Fuessel, and Mario Menschikowski. 2024. "Blood-Based DNA Methylation Analysis by Multiplexed OBBPA-ddPCR to Verify Indications for Prostate Biopsies in Suspected Prostate Cancer Patients" Cancers 16, no. 7: 1324. https://doi.org/10.3390/cancers16071324
APA StyleFriedemann, M., Jandeck, C., Tautz, L., Gutewort, K., von Rein, L., Sukocheva, O., Fuessel, S., & Menschikowski, M. (2024). Blood-Based DNA Methylation Analysis by Multiplexed OBBPA-ddPCR to Verify Indications for Prostate Biopsies in Suspected Prostate Cancer Patients. Cancers, 16(7), 1324. https://doi.org/10.3390/cancers16071324