
Reduced Breast and Ovarian Cancer Through Targeted Genetic Testing: Estimates Using the NEEMO Microsimulation Model

 , , and
Simple Summary
Abstract
1. Introduction
2. Materials and Methods
2.1. Model Overview
- Part 1: Model population generation (the “input population”, see Supplementary Figure S1; and
- Part 2: The main simulation (referred to as the simulation; see Supplementary Figures S2 and S3).
2.2. Population Generation
2.2.1. Overview
2.2.2. Population Genotypes
2.3. Main Simulation Model Structure
- Genetic testing, being either:
- Full P/LP variant detection: genetic sequencing and large genomic rearrangements, either with a high-risk gene panel (BRCA1, BRCA2 and PALB2), or an extended gene panel (high-risk genes, plus ATM, BRIP1, CHEK2, RAD51C, RAD51D); or
- Predictive genetic testing: Targeted sequencing for a known family P/LP variant;
- Breast cancer screening: digital mammography and/or breast magnetic resonance imaging (MRI);
- Risk-reducing surgeries: bilateral risk-reducing mastectomy (BRRM), contralateral risk-reducing mastectomy (CRRM), and risk-reducing salpingo-oophorectomy (RRSO).
2.3.1. Cancer Risk and Natural History
2.3.2. Breast Cancer
2.3.3. Ovarian Cancer
2.3.4. Mortality
2.3.5. Clinical Interventions
2.3.6. Clinical Genetics Services
2.3.7. Breast Screening
2.3.8. Risk-Reducing Surgery
2.4. Model Validation
2.5. Model Outcomes
2.5.1. Scenarios
- No genetic testing: no testing for any HBOC-related P/LP gene variants;
- Current practice: HBOC genetic testing with a high-risk gene panel (BRCA1, BRCA2, PALB2) based on MBS criteria and current breast and ovarian cancer referral rates;
- Optimised referral of breast and ovarian cancer: As for (2), with referral of all breast and ovarian cancer cases who are eligible for testing to genetic services;
- Genetic testing for all breast cancers: As for (3), with the addition of genetic testing being offered to all breast cancer patients aged younger than 80 years.
2.5.2. Modelled Population
2.5.3. Sensitivity Analysis
3. Results
3.1. Validation
3.1.1. Population Validation
3.1.2. Cancer Outcomes Validation
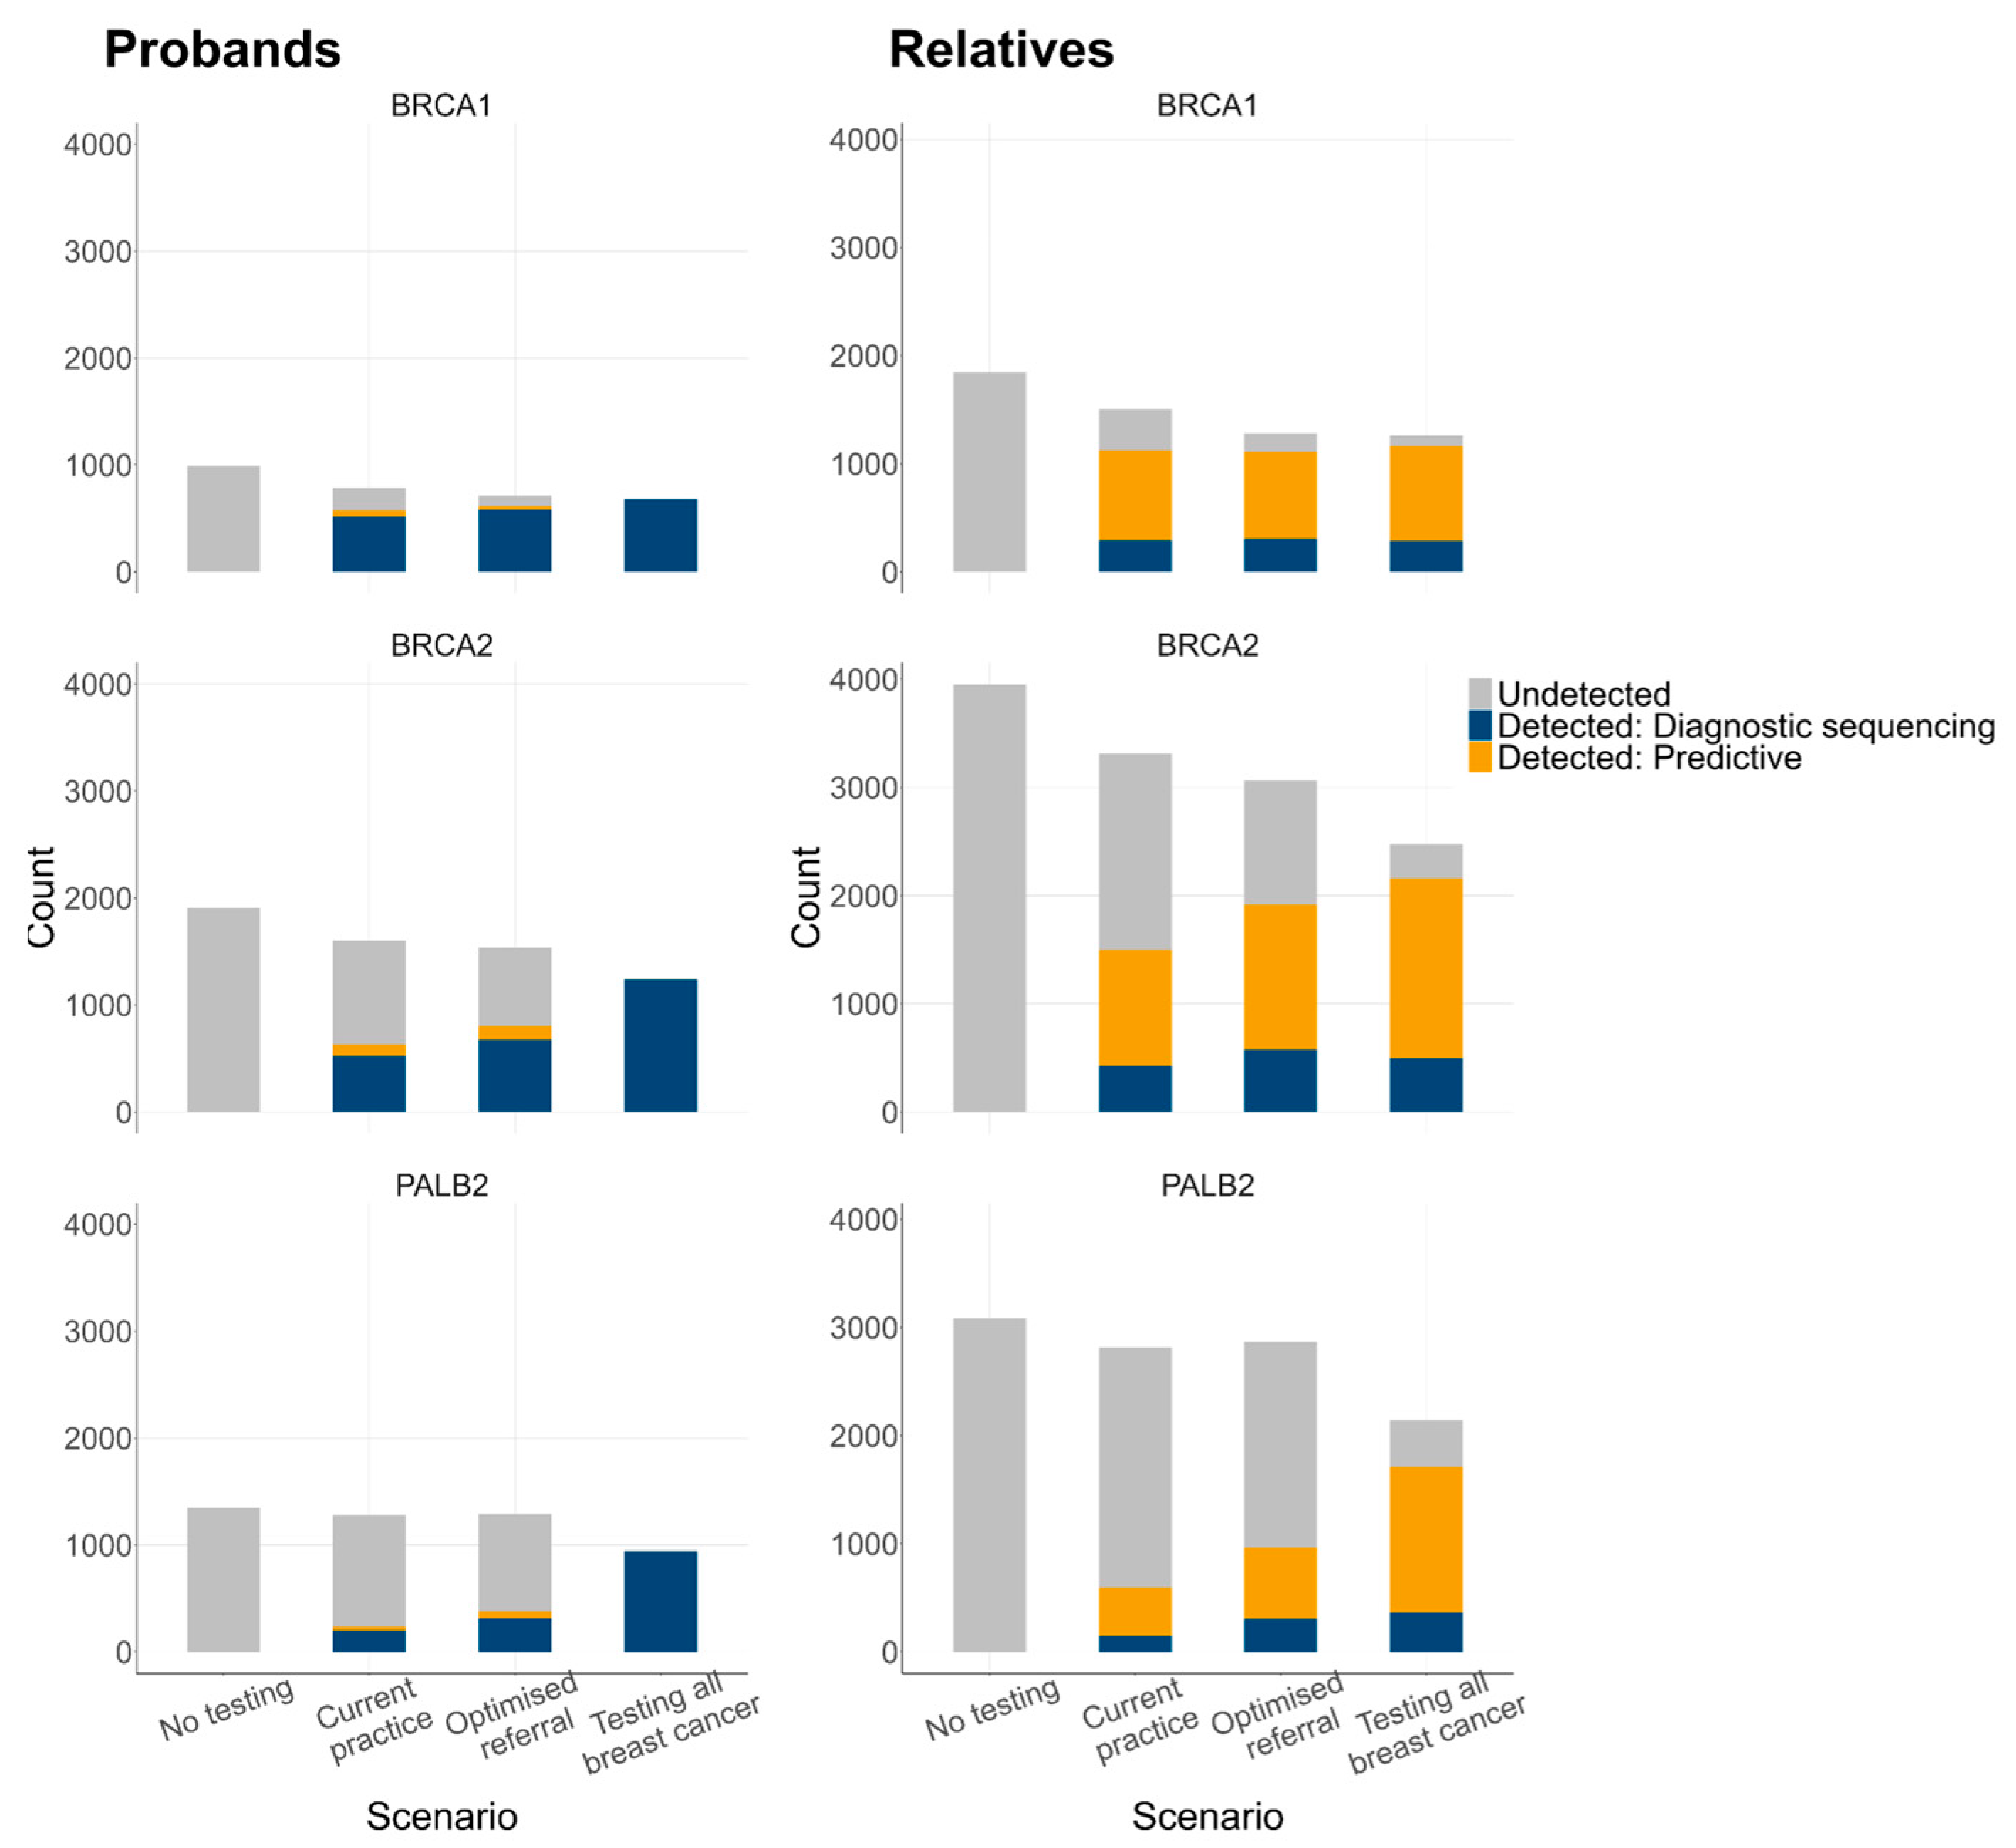
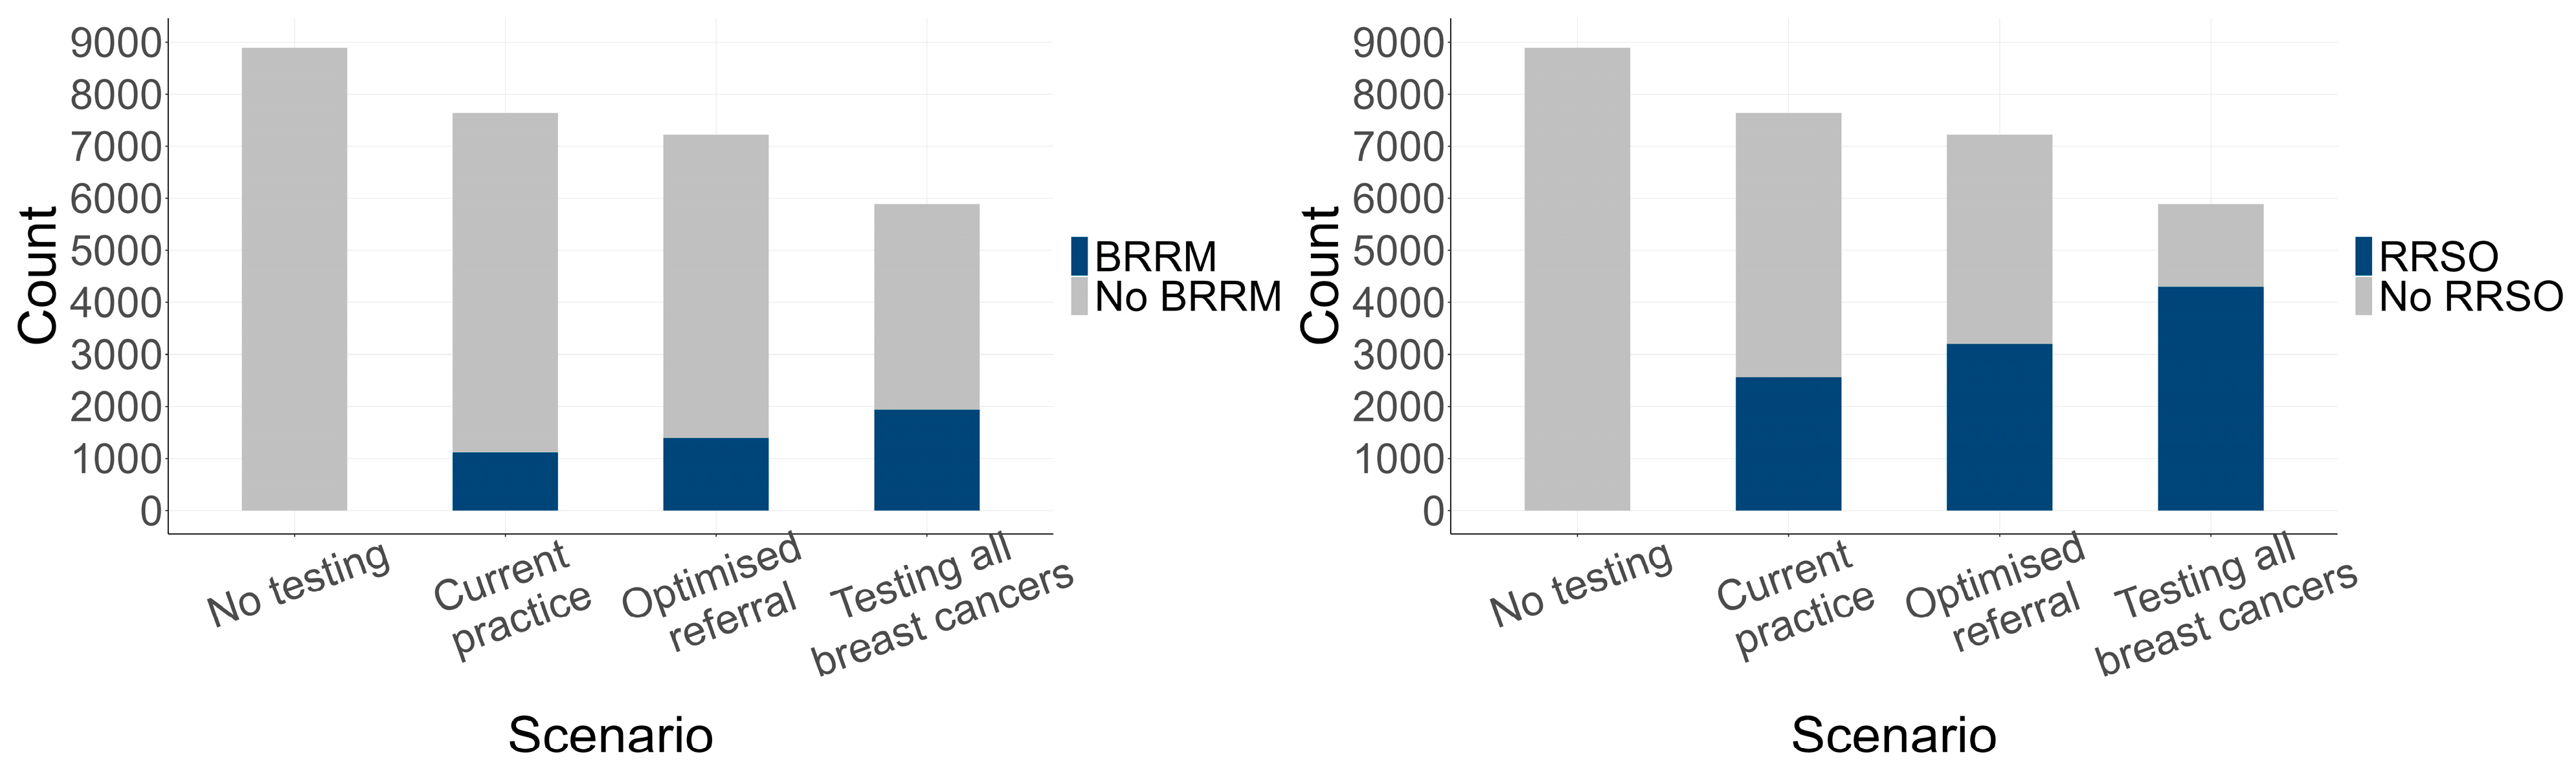
3.2. Estimated Genetic Testing Rates and Clinical Outcomes
3.2.1. Genetic Testing Rates
3.2.2. Genetic Testing Outcomes
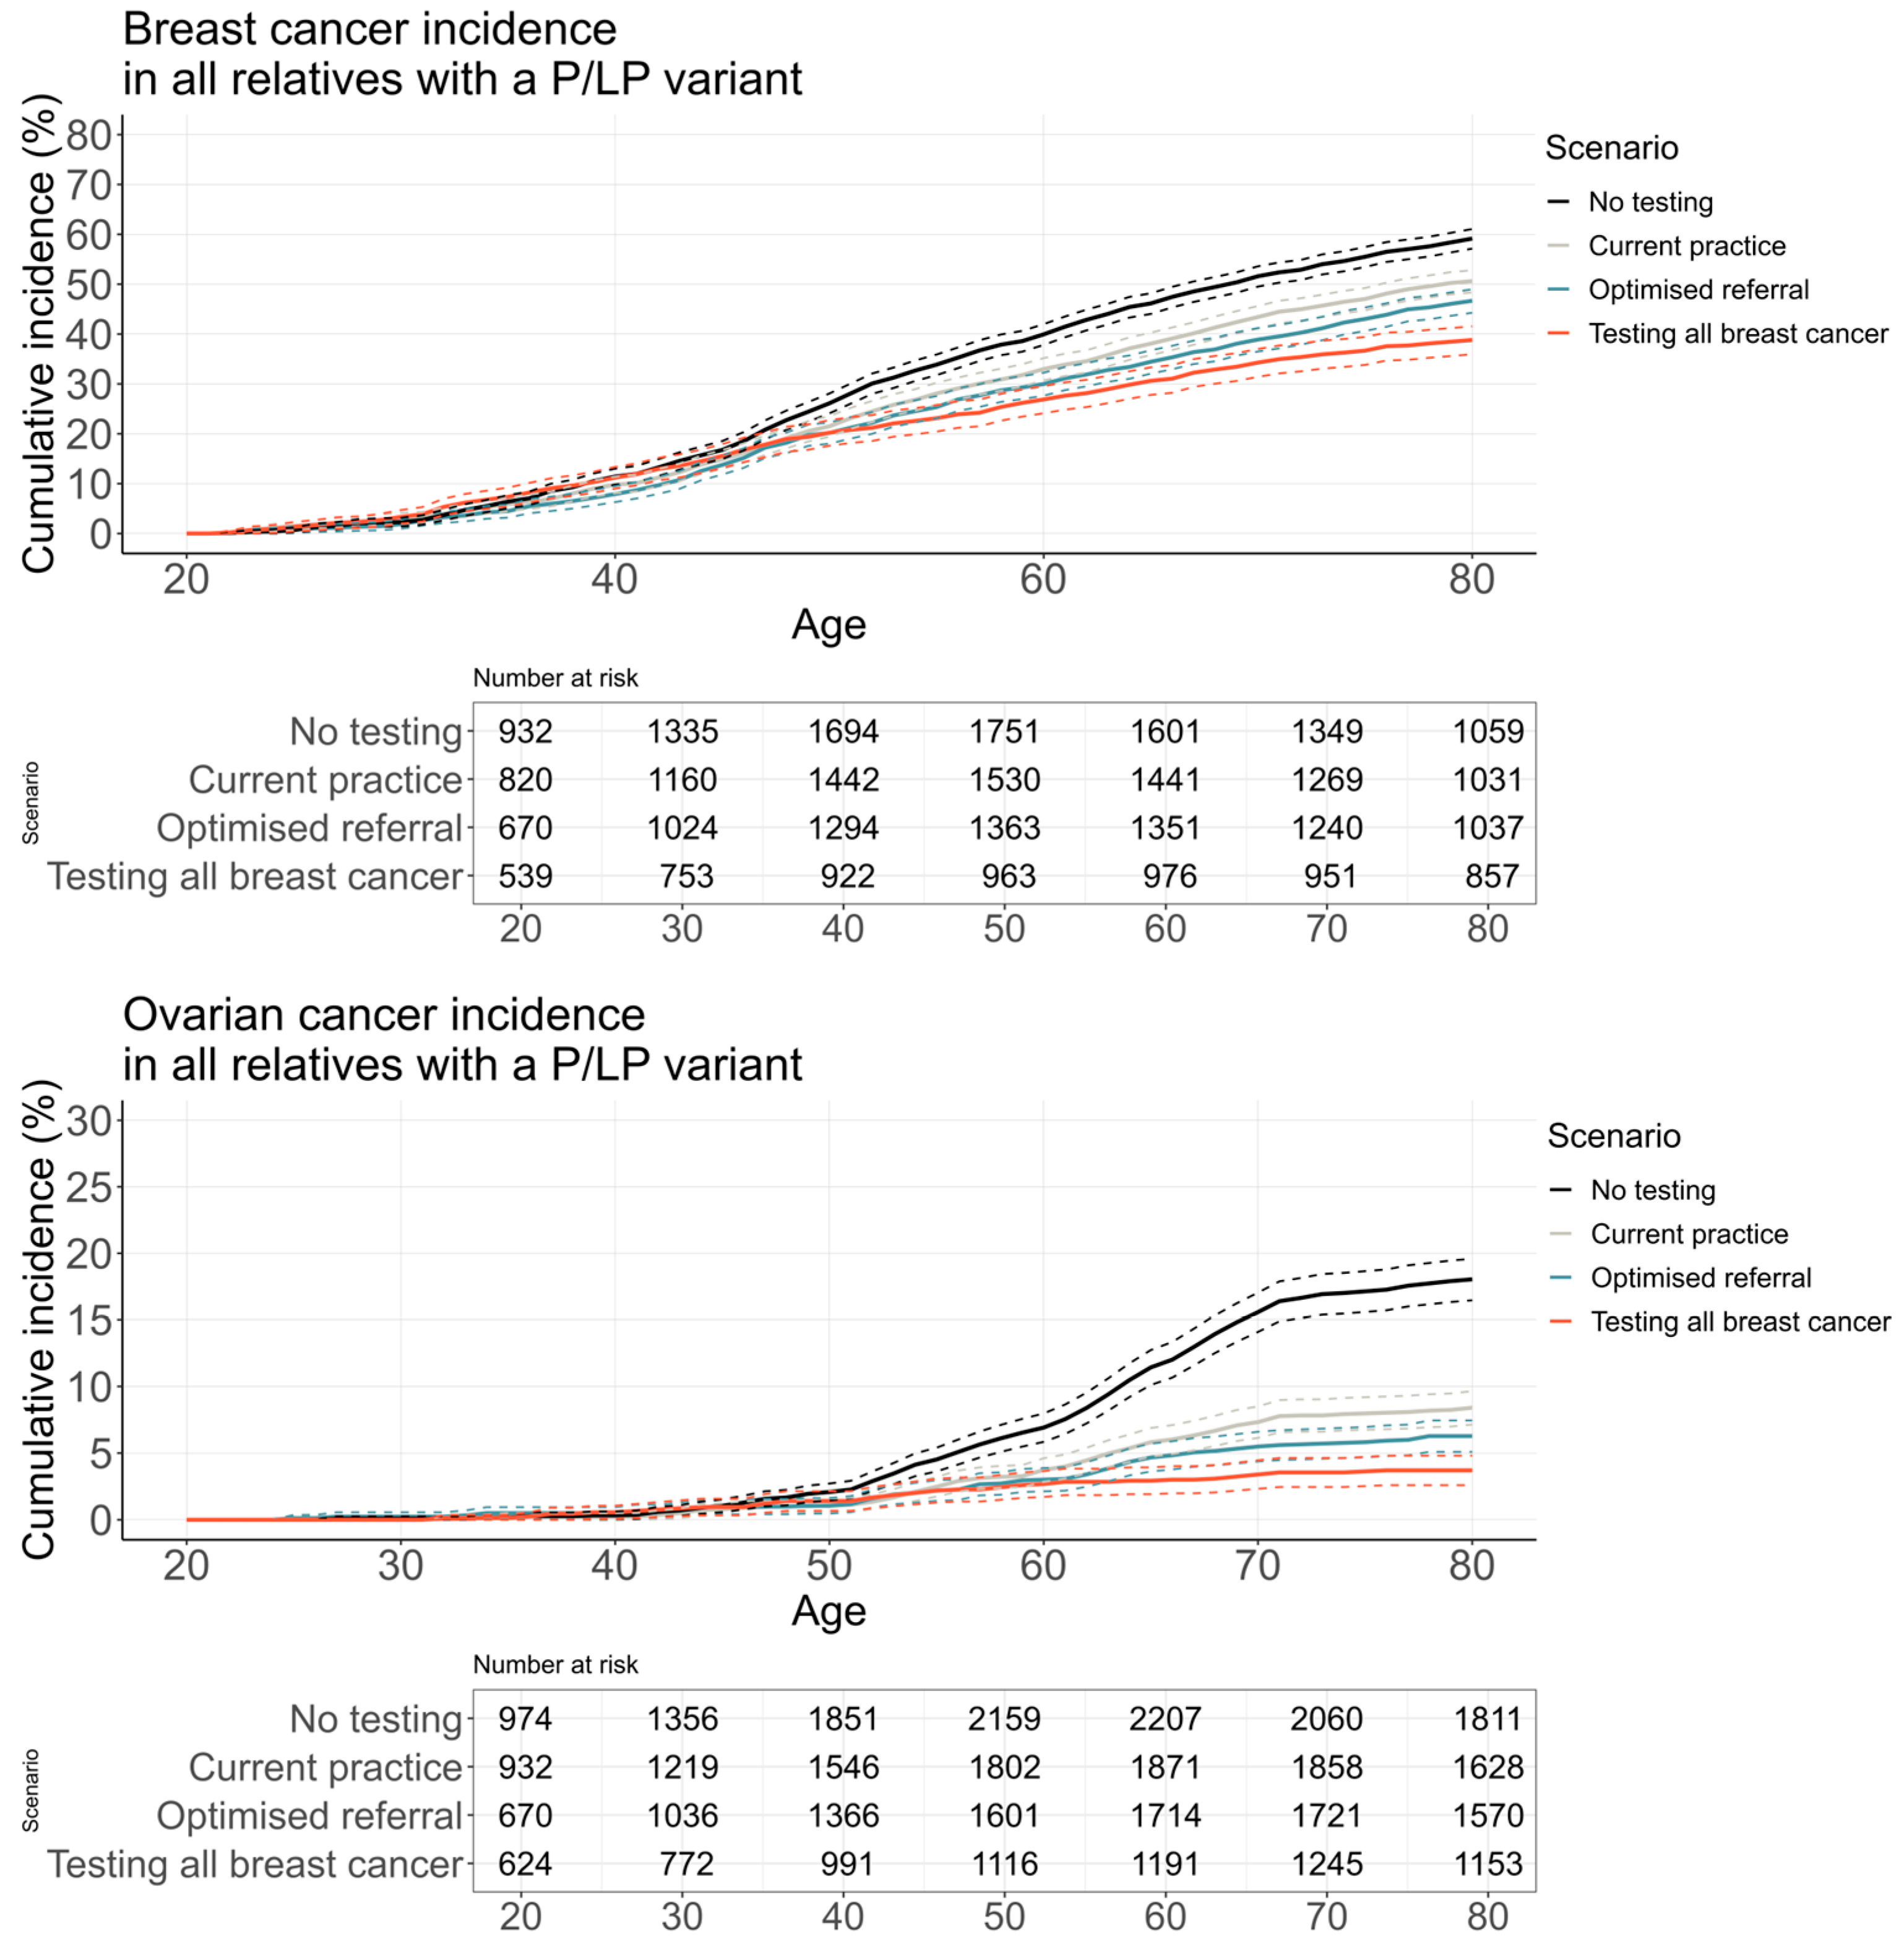
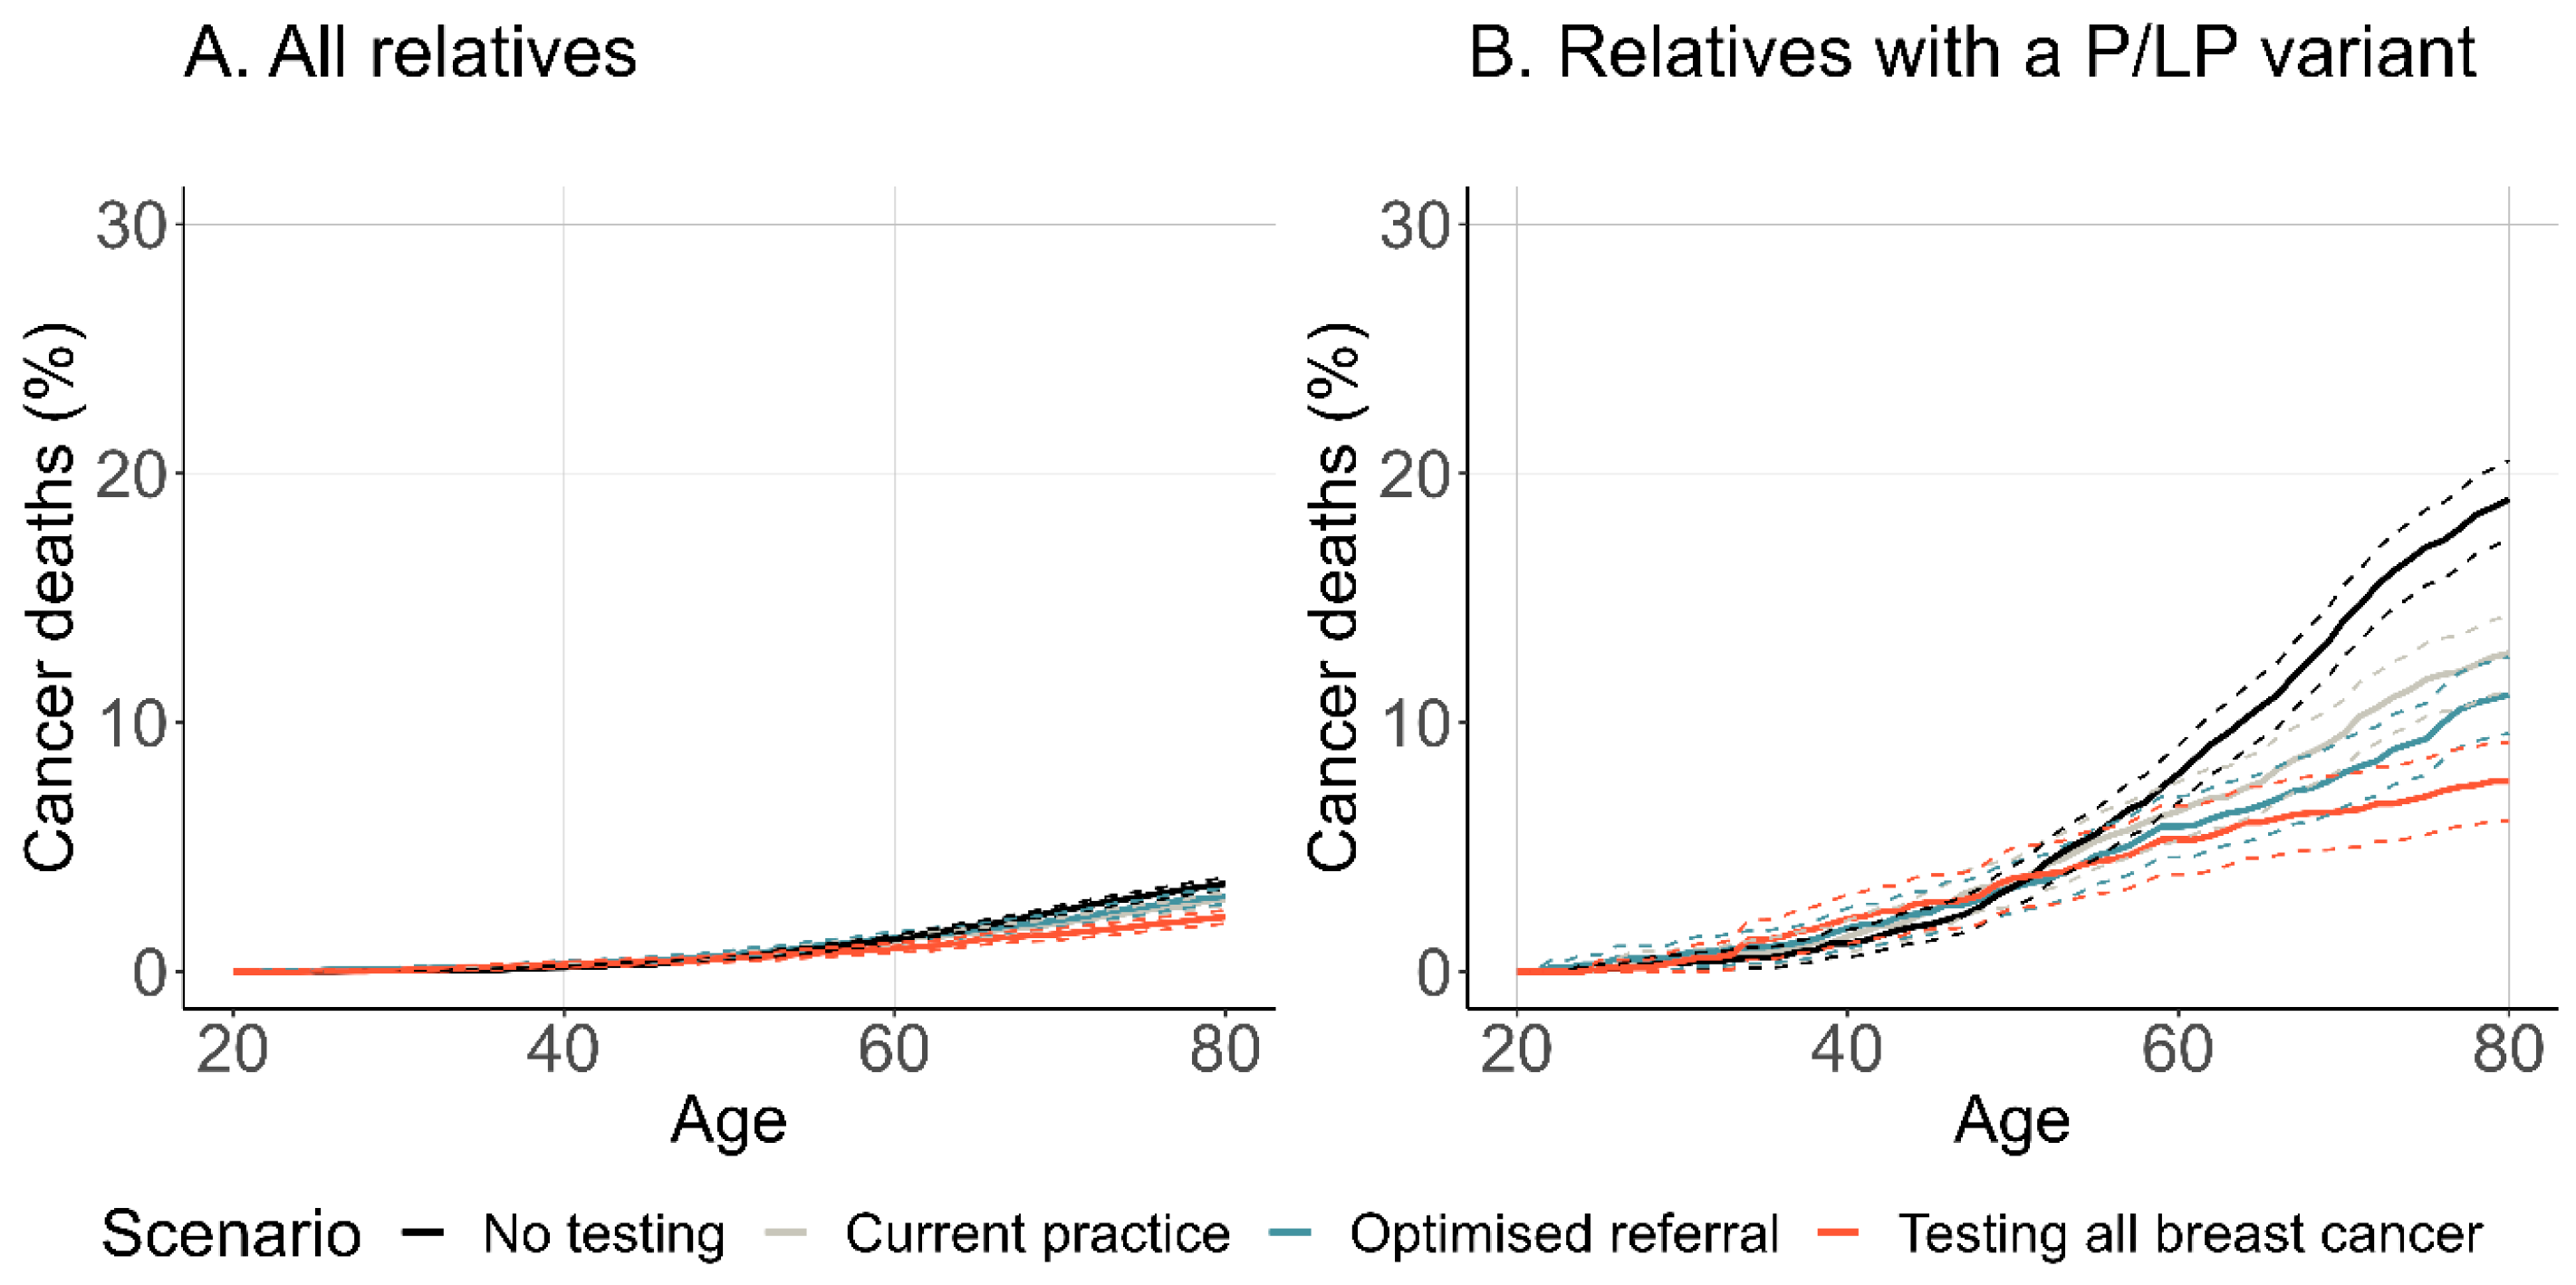
3.2.3. Cancer Incidence and Mortality
3.2.4. Sensitivity Analysis Outcomes
4. Discussion
Limitations
5. Conclusions
Supplementary Materials
Author Contributions
Funding
Institutional Review Board Statement
Informed Consent Statement
Data Availability Statement
Acknowledgments
Conflicts of Interest
List of Abbreviations
| BC | Breast cancer |
| BRRM | Bilateral risk-reducing mastectomy |
| CRRM | Contralateral risk-reducing mastectomy |
| HBOC | Hereditary breast and ovarian cancer |
| HER2 | Human epidermal growth factor receptor 2 |
| MBS | Medicare Benefits Schedule |
| MRI | Magnetic resonance imaging |
| NEEMO | populatioN gEnEtic testing Model |
| P/LP | Pathogenic/likely pathogenic |
| RRSO | Risk-reducing salpingo-oophorectomy |
| SEER | Surveillance, Epidemiology, and End Results |
References
- Tung, N.; Lin, N.U.; Kidd, J.; Allen, B.A.; Singh, N.; Wenstrup, R.J.; Hartman, A.R.; Winer, E.P.; Garber, J.E. Frequency of germline mutations in 25 cancer susceptibility genes in a sequential series of patients with breast cancer. J. Clin. Oncol. 2016, 34, 1460–1468. [Google Scholar] [CrossRef]
- Breast Cancer Association Consortium; Dorling, L.; Carvalho, S.; Allen, J.; González-Neira, A.; Luccarini, C.; Wahlstrom, C.; Pooley, K.A.; Parsons, M.T.; Fortuno, C.; et al. Breast cancer risk genes—Association analysis in more than 113,000 women. N. Engl. J. Med. 2021, 384, 428–439. [Google Scholar]
- Alsop, K.; Fereday, S.; Meldrum, C.; deFazio, A.; Emmanuel, C.; George, J.; Dobrovic, A.; Birrer, M.J.; Webb, P.M.; Stewart, C.; et al. BRCA mutation frequency and patterns of treatment response in brca mutation–positive women with ovarian cancer: A report from the Australian Ovarian Cancer Study Group. J. Clin. Oncol. 2012, 30, 2654–2663. [Google Scholar] [CrossRef] [PubMed]
- Morgan, R.D.; Burghel, G.J.; Flaum, N.; Bulman, M.; Clamp, A.R.; Hasan, J.; Mitchell, C.L.; Schlecht, H.; Woodward, E.R.; Lallo, F.I.; et al. Prevalence of germline pathogenic BRCA1/2 variants in sequential epithelial ovarian cancer cases. J. Med. Genet. 2019, 56, 301–307. [Google Scholar] [CrossRef]
- NICE. Familial Breast Cancer: Classification, Care and Managing Breast Cancer and Related Risks in People with a Family History of Breast Cancer [CG164]; Report No.: CG164; National Institute for Health and Care Excellence: London, UK, 2013. [Google Scholar]
- Daly, M.B.; Pal, T.; Berry, M.P.; Buys, S.S.; Dickson, P.; Domchek, S.M.; Elkhanany, A.; Friedman, S.; Goggins, M.; Hutton, M.L.; et al. Genetic/Familial High-Risk Assessment: Breast, Ovarian, and Pancreatic, Version 2.2021, NCCN Clinical Practice Guidelines in Oncology. J. Natl. Compr. Canc Netw. 2021, 19, 77–102. [Google Scholar] [CrossRef]
- eviQ. eviQ Cancer Treatments Online. Cancer Institute. 2023. Available online: https://www.eviq.org.au/ (accessed on 17 October 2023).
- Department of Health, Australian Government. MBS Online: Medicare Benefits Schedule. Canberra: Commonwealth of Australia. 2023. Available online: http://www.mbsonline.gov.au/ (accessed on 16 October 2023).
- Pokharel, H.P.; Hacker, N.F.; Andrews, L. Changing patterns of referrals and outcomes of genetic participation in gynaecological-oncology multidisciplinary care. Aust. N. Z. J. Obstet. Gynaecol. 2016, 56, 633–638. [Google Scholar] [CrossRef]
- Doe, S.; Petersen, S.; Swain, M. Utilization of genetic testing in breast cancer treatment after implementation of comprehensive multi-disciplinary care. Breast J. 2020, 26, 911–916. [Google Scholar] [CrossRef]
- Kentwell, M.; Dow, E.; Antill, Y.; Wrede, C.D.; McNally, O.; Higgs, E.; Hamilton, A.; Ananda, S.; Linderman, G.L.; Scott, C.L. Mainstreaming cancer genetics: A model integrating germline BRCA testing into routine ovarian cancer clinics. Gynecol. Oncol. 2017, 145, 130–136. [Google Scholar] [CrossRef] [PubMed]
- Rummel, S.K.; Lovejoy, L.A.; Turner, C.E.; Shriver, C.D.; Ellsworth, R.E. Should genetic testing for cancer predisposition be standard-of-care for women with invasive breast cancer? The Murtha Cancer Center experience. Cancers 2020, 12, 234. [Google Scholar] [CrossRef] [PubMed]
- Childers, C.P.; Childers, K.K.; Maggard-Gibbons, M.; Macinko, J. National estimates of genetic testing in women with a history of breast or ovarian cancer. J. Clin. Oncol. 2017, 35, 3800–3806. [Google Scholar] [CrossRef] [PubMed]
- Kurian, A.W.; Griffith, K.A.; Hamilton, A.S.; Ward, K.C.; Morrow, M.; Katz, S.J.; Jagsi, R. Genetic testing and counseling among patients with newly diagnosed breast cancer. JAMA 2017, 317, 531–534. [Google Scholar] [CrossRef]
- Rowley, S.M.; Mascarenhas, L.; Devereux, L.; Li, N.; Amarasinghe, K.C.; Zethoven, M.; Lee, J.E.A.; Lewis, A.; Morgan, J.A.; Limb, S.; et al. Population-based genetic testing of asymptomatic women for breast and ovarian cancer susceptibility. Genet. Med. 2019, 21, 913–922. [Google Scholar] [CrossRef] [PubMed]
- Delikurt, T.; Williamson, G.R.; Anastasiadou, V.; Skirton, H. A systematic review of factors that act as barriers to patient referral to genetic services. Eur. J. Hum. Genet. 2015, 23, 739–745. [Google Scholar] [CrossRef]
- Kurian, A.W.; Ward, K.C.; Abrahamse, P.; Hamilton, A.S.; Deapen, D.; Morrow, M.; Jagsi, R.; Katz, S.J. Association of germline genetic testing results with locoregional and systemic therapy in patients with breast cancer. JAMA Oncol. 2020, 6, e196400. [Google Scholar] [CrossRef] [PubMed]
- De Silva, D.L.; Stafford, L.; Skandarajah, A.R.; Sinclair, M.; Devereux, L.; Hogg, K.; Kentwell, M.; Park, A.; Lal, L.; Zethoven, M.; et al. Universal genetic testing for women with newly diagnosed breast cancer in the context of multidisciplinary team care. Med. J. Aust. 2023, 218, 368–373. [Google Scholar] [CrossRef]
- Gentile, D.; Losurdo, A.; Sagona, A.; Zuradelli, M.; Gatzemeier, W.; Barbieri, E.; Testori, A.; Errico, V.; Bianchi, P.; Biondi, E.; et al. Surgical management of BRCA-mutation carriers: A single institution experience. Eur. J. Surg. Oncol. 2022, 48, 1706–1712. [Google Scholar] [CrossRef]
- Domchek, S.M.; Friebel, T.M.; Singer, C.F.; Evans, D.G.; Lynch, H.T.; Isaacs, C.; Garber, J.E.; Neuhausen, S.L.; Matloff, E.; Eeles, R.; et al. Association of risk-reducing surgery in BRCA1 or BRCA2 mutation carriers with cancer risk and mortality. JAMA 2010, 304, 967–975. [Google Scholar] [CrossRef]
- Guzauskas, G.F.; Garbett, S.; Zhou, Z.; Schildcrout, J.S.; Graves, J.A.; Williams, M.S.; Hao, J.; Jones, L.K.; Spencer, S.J.; Jiang, S.; et al. Population genomic screening for three common hereditary conditions: A cost-effectiveness analysis. Ann. Intern. Med. 2023, 176, 585–595. [Google Scholar] [CrossRef] [PubMed]
- Sun, L.; Brentnall, A.; Patel, S.; Buist, D.S.M.; Bowles, E.J.A.; Evans, D.G.R.; Eccles, D.; Hopper, J.; Li, S.; Southey, M.; et al. A cost-effectiveness analysis of multigene testing for all patients with breast cancer. JAMA Oncol. 2019, 5, 1718–1730. [Google Scholar] [CrossRef]
- Meshkani, Z.; Aboutorabi, A.; Moradi, N.; Langarizadeh, M.; Motlagh, A.G. Population or family history based BRCA gene tests of breast cancer? A systematic review of economic evaluations. Hered. Cancer Clin. Pract. 2021, 19, 35. [Google Scholar] [CrossRef]
- Petelin, L.; Trainer, A.H.; Mitchell, G.; Liew, D.; James, P.A. Cost-effectiveness and comparative effectiveness of cancer risk management strategies in BRCA1/2 mutation carriers: A systematic review. Genet. Med. 2018, 20, 1145–1156. [Google Scholar] [CrossRef] [PubMed]
- Zischke, J.; White, N.; Gordon, L. Accounting for intergenerational cascade testing in economic evaluations of clinical genomics: A scoping review. Value Health 2022, 25, 944–953. [Google Scholar] [CrossRef] [PubMed]
- Arnold, M.; Quante, A.S. Personalized mammography screening and screening adherence—A simulation and economic evaluation. Value Health 2018, 21, 799–808. [Google Scholar] [CrossRef]
- Petelin, L.; Hossack, L.; Mitchell, G.; Liew, D.; Trainer, A.H.; James, P.A. A microsimulation model for evaluating the effectiveness of cancer risk management for BRCA pathogenic variant carriers: miBRovaCAre. Value Health 2019, 22, 854–862. [Google Scholar] [CrossRef]
- Petelin, L.; Hossack, L.; Shanahan, M.; Mitchell, G.; Liew, D.; James, P.A.; Trainer, A.H. Cost-effectiveness of long-term clinical management of BRCA pathogenic variant carriers. Genet. Med. 2020, 22, 831–839. [Google Scholar] [CrossRef] [PubMed]
- Mavaddat, N.; Michailidou, K.; Dennis, J.; Lush, M.; Fachal, L.; Lee, A.; Tyrer, J.P.; Chen, T.H.; Wang, Q.; Bolla, M.K.; et al. Polygenic risk scores for prediction of breast cancer and breast cancer subtypes. Am. J. Hum. Genet. 2019, 104, 21–34. [Google Scholar] [CrossRef]
- Yang, X.; Leslie, G.; Gentry-Maharaj, A.; Ryan, A.; Intermaggio, M.; Lee, A.; Kalsi, J.K.; Tyrer, J.; Gaba, F.; Manchanda, R.; et al. Evaluation of polygenic risk scores for ovarian cancer risk prediction in a prospective cohort study. J. Med. Genet. 2018, 55, 546–554. [Google Scholar] [CrossRef]
- Surveillance, Epidemiology, and End Results (SEER) Program. SEER*Stat Database: Incidence—SEER 18 Regs Research Data (1992–2014). National Cancer Institute. 2017. Available online: www.seer.cancer.gov (accessed on 29 January 2020).
- Rosenthal, A.N.; Fraser, L.S.M.; Philpott, S.; Manchanda, R.; Burnell, M.; Badman, P.; Hadwin, R.; Rizzuto, I.; Benjamin, E.; Singh, N.; et al. Evidence of stage shift in women diagnosed with ovarian cancer during phase II of the United Kingdom Familial Ovarian Cancer Screening Study. J. Clin. Oncol. 2017, 35, 1411–1420. [Google Scholar] [CrossRef] [PubMed]
- Menon, U.; Gentry-Maharaj, A.; Burnell, M.; Singh, N.; Ryan, A.; Karpinskyj, C.; Carlino, G.; Taylor, J.; Massingham, S.K.; Raikou, M.; et al. Ovarian cancer population screening and mortality after long-term follow-up in the UK Collaborative Trial of Ovarian Cancer Screening (UKCTOCS): A randomised controlled trial. Lancet 2021, 397, 2182–2193. [Google Scholar] [CrossRef]
- Australian Bureau of Statistics. Life Tables, States, Territories and Australia 2015–2017; Report No.: 3302055001DO001_20112013; Australian Bureau of Statistics: Canberra, Australia, 2018. [Google Scholar]
- Australian Institute of Health and Welfare. BreastScreen Australia Monitoring Report 2018; (Cancer Series No 112); Report No.: Cat no CAN116; Australian Institute of Health and Welfare: Canberra, Australia, 2018. [Google Scholar]
- Vreemann, S.; Gubern-Merida, A.; Schlooz-Vries, M.S.; Bult, P.; van Gils, C.H.; Hoogerbrugge, N.; Karssemeijer, N.; Mann, R.M. Influence of risk category and screening round on the performance of an MR imaging and mammography screening program in carriers of the BRCA mutation and other women at increased risk. Radiology 2018, 286, 443–451. [Google Scholar] [CrossRef] [PubMed]
- Nickson, C.; Smith, M.A.; Feletto, E.; Velentzis, L.S.; Broun, K.; Deij, S.; Grogan, P.; Hall, M.; He, E.; St John, D.J.; et al. A modelled evaluation of the impact of COVID-19 on breast, bowel, and cervical cancer screening programmes in Australia. eLife 2023, 12, e82818. [Google Scholar] [CrossRef]
- Eleje, G.U.; Eke, A.C.; Ezebialu, I.U.; Ikechebelu, J.I.; Ugwu, E.O.; Okonkwo, O.O. Risk-reducing bilateral salpingo-oophorectomy in women with BRCA1 or BRCA2 mutations. Cochrane Database Syst. Rev. 2018, 8, CD012464. [Google Scholar] [CrossRef] [PubMed]
- Carbine, N.E.; Lostumbo, L.; Wallace, J.; Ko, H. Risk-reducing mastectomy for the prevention of primary breast cancer. Cochrane Database Syst. Rev. 2018, 4, CD002748. [Google Scholar] [CrossRef]
- Australian Institute of Health and Welfare. Australian Cancer Database. Available online: https://www.aihw.gov.au/about-our-data/our-data-collections/australian-cancer-database (accessed on 8 May 2019).
- Australian Bureau of Statistics. Fertility, by Age, by State. Canberra. 2019. Available online: https://www.abs.gov.au/statistics/microdata-tablebuilder/tablebuilder (accessed on 21 May 2019).
- Shiyanbola, O.O.; Arao, R.F.; Miglioretti, D.L.; Sprague, B.L.; Hampton, J.M.; Stout, N.K.; Kerlikowske, K.; Braithwaite, D.; Buist, D.S.M.; Egan, K.M.; et al. Emerging trends in family history of breast cancer and associated risk. Cancer Epidemiol. Biomark. Prev. 2017, 26, 1753–1760. [Google Scholar] [CrossRef]
- Norquist, B.M.; Harrell, M.I.; Brady, M.F.; Walsh, T.; Lee, M.K.; Gulsuner, S.; Bernards, S.S.; Casadei, S.; Yi, Q.; Burger, R.A.; et al. Inherited mutations in women with ovarian carcinoma. JAMA Oncol. 2016, 2, 482–490. [Google Scholar] [CrossRef] [PubMed]
- Wong-Brown, M.W.; Meldrum, C.J.; Carpenter, J.E.; Clarke, C.L.; Narod, S.A.; Jakubowska, A.; Rudnicka, H.; Lubinski, J.; Scott, R.J. Prevalence of BRCA1 and BRCA2 germline mutations in patients with triple-negative breast cancer. Breast Cancer Res. Treat. 2015, 150, 71–80. [Google Scholar] [CrossRef]
- Crispin, M.; Udovicich, C.; Chan, S.; Wong, S.; Pitcher, M. Trends in genetic screening referral in breast cancer patients under the age of forty: 2001–2016. Breast J. 2018, 24, 1109–1111. [Google Scholar] [CrossRef] [PubMed]
- Manchanda, R.; Sun, L.; Patel, S.; Evans, O.; Wilschut, J.; De Freitas Lopes, A.C.; Gaba, F.; Brentnall, A.; Duffy, S.; Cui, B.; et al. Economic evaluation of population-based BRCA1/BRCA2 mutation testing across multiple countries and health systems. Cancers 2020, 12, 1929. [Google Scholar] [CrossRef]
- Simões Corrêa Galendi, J.; Kautz-Freimuth, S.; Stock, S.; Müller, D. Uptake rates of risk-reducing surgeries for women at increased risk of hereditary breast and ovarian cancer applied to cost-effectiveness analyses: A scoping systematic review. Cancers 2022, 14, 1786. [Google Scholar] [CrossRef]
- Friedlander, M.; Moore, K.N.; Colombo, N.; Scambia, G.; Kim, B.G.; Oaknin, A.; Lisyanskaya, A.; Sonke, G.S.; Gourley, C.; Banerjee, S.; et al. Patient-centred outcomes and effect of disease progression on health status in patients with newly diagnosed advanced ovarian cancer and a BRCA mutation receiving maintenance olaparib or placebo (SOLO1): A randomised, phase 3 trial. Lancet Oncol. 2021, 22, 632–642. [Google Scholar] [CrossRef]
- Poveda, A.; Floquet, A.; Ledermann, J.A.; Asher, R.; Penson, R.T.; Oza, A.M.; Korach, J.; Huzarski, T.; Pignata, S.; Friedlander, M.; et al. Olaparib tablets as maintenance therapy in patients with platinum-sensitive relapsed ovarian cancer and a BRCA1/2 mutation (SOLO2/ENGOT-Ov21): A final analysis of a double-blind, randomised, placebo-controlled, phase 3 trial. Lancet Oncol. 2021, 22, 620–631. [Google Scholar] [CrossRef]
- Kurian, A.W.; Abrahamse, P.; Bondarenko, I.; Hamilton, A.S.; Deapen, D.; Gomez, S.L.; Morrow, M.; Berek, J.S.; Hofer, T.P.; Katz, S.J.; et al. Association of genetic testing results with mortality among women with breast cancer or ovarian cancer. J. Natl. Cancer Inst. 2022, 114, 245–253. [Google Scholar] [CrossRef]
- Offit, K.; Tkachuk, K.A.; Stadler, Z.K.; Walsh, M.F.; Diaz-Zabala, H.; Levin, J.D.; Steinsnyder, Z.; Ravichandran, V.; Sharaf, R.N.; Frey, M.K.; et al. Cascading after peridiagnostic cancer genetic testing: An alternative to population-based screening. J. Clin. Oncol. 2020, 38, 1398–1408. [Google Scholar] [CrossRef] [PubMed]
- Lee, A.; Mavaddat, N.; Wilcox, A.N.; Cunningham, A.P.; Carver, T.; Hartley, S.; Babb De Villiers, C.; Izquierdo, A.; Simard, J.; Schmidt, M.K.; et al. BOADICEA: A comprehensive breast cancer risk prediction model incorporating genetic and nongenetic risk factors. Genet. Med. 2019, 21, 1708–1718. [Google Scholar] [CrossRef]
- Kopasker, D.; Katikireddi, S.V.; Santos, J.V.; Richiardi, M.; Bronka, P.; Rostila, M.; Cecchini, M.; Ali, S.; Emmert-Fees, K.; Bambra, C.; et al. Microsimulation as a flexible tool to evaluate policies and their impact on socioeconomic inequalities in health. Lancet Reg. Health Eur. 2023, 34, 100758. [Google Scholar] [CrossRef] [PubMed]
- Beard, C.; Monohan, K.; Cicciarelli, L.; James, P.A. Mainstream genetic testing for breast cancer patients: Early experiences from the Parkville Familial Cancer Centre. Eur. J. Hum. Genet. 2021, 29, 872–880. [Google Scholar] [CrossRef]
- Sokolova, A.; Johnstone, K.J.; McCart Reed, A.E.; Simpson, P.T.; Lakhani, S.R. Hereditary breast cancer: Syndromes, tumour pathology and molecular testing. Histopathology 2023, 82, 70–82. [Google Scholar] [CrossRef]
- Sopik, V.; Narod, S.A. The relationship between tumour size, nodal status and distant metastases: On the origins of breast cancer. Breast Cancer Res. Treat. 2018, 170, 647–656. [Google Scholar] [CrossRef] [PubMed]
- Kuchenbaecker, K.B.; Hopper, J.L.; Barnes, D.R.; Phillips, K.A.; Mooij, T.M.; Roos-Blom, M.J.; Jervis, S.; Van Leeuwen, F.E.; Milne, R.L.; Andrieu, N.; et al. Risks of breast, ovarian, and contralateral breast cancer for BRCA1 and BRCA2 mutation carriers. JAMA 2017, 317, 2402–2416. [Google Scholar] [CrossRef]
- Yang, X.; Leslie, G.; Doroszuk, A.; Schneider, S.; Allen, J.; Decker, B.; Dunning, A.M.; Redman, J.; Scarth, J.; Plaskocinska, I.; et al. Cancer risks associated with germline PALB2 pathogenic variants: An international study of 524 families. J. Clin. Oncol. 2020, 38, 674–685. [Google Scholar] [CrossRef]
- Schmidt, M.K.; Hogervorst, F.; Van Hien, R.; Cornelissen, S.; Broeks, A.; Adank, M.A.; Meijers, H.; Waisfisz, Q.; Hollestelle, A.; Schutte, M.; et al. Age- and tumor subtype-specific breast cancer risk estimates for CHEK2*1100delC carriers. J. Clin. Oncol. 2016, 34, 2750–2760. [Google Scholar] [CrossRef]
- Couch, F.J.; Shimelis, H.; Hu, C.; Hart, S.N.; Polley, E.C.; Na, J.; Hallberg, E.; Moore, R.; Thomas, A.; Lilyquist, J.; et al. Associations between cancer predisposition testing panel genes and breast cancer. JAMA Oncol. 2017, 3, 1190. [Google Scholar] [CrossRef] [PubMed]
- Yang, X.; Song, H.; Leslie, G.; Engel, C.; Hahnen, E.; Auber, B.; Horváth, J.; Kast, K.; Niederacher, D.; Turnbull, C.; et al. Ovarian and breast cancer risks associated with pathogenic variants in RAD51C and RAD51D. J. Natl. Cancer Inst. 2020, 112, 1242–1250. [Google Scholar] [CrossRef]
- Ramus, S.J.; Song, H.; Dicks, E.; Tyrer, J.P.; Rosenthal, A.N.; Intermaggio, M.P.; Fraser, L.; Gentry-Maharaj, A.; Hayward, J.; Philpott, S.; et al. Germline mutations in the BRIP1, BARD1, PALB2, and NBN genes in women with ovarian cancer. J. Natl. Cancer Inst. 2015, 107, djv214. [Google Scholar] [CrossRef]
- Candido-dos-Reis, F.J.; Song, H.; Goode, E.L.; Cunningham, J.M.; Fridley, B.L.; Larson, M.C.; Alsop, K.; Dicks, E.; Harrington, P.; Ramus, S.J.; et al. Germline min BRCA1 or BRCA2 and ten-sear survival for women diagnosed with epithelial ovarian cancer. Clin. Cancer Res. 2015, 21, 652–657. [Google Scholar] [CrossRef]
- Australian Institute of Health and Welfare. Ovarian Cancer in Australia: An Overview, 2010. Canberra. Available online: https://www.aihw.gov.au/reports/cancer/ovarian-cancer-in-australia-an-overview-2010/summary (accessed on 29 January 2020).
- Farshid, G.; Walters, D. Molecular subtypes of screen-detected breast cancer. Breast Cancer Res. Treat. 2018, 172, 191–199. [Google Scholar] [CrossRef]


| Odds Ratio | Source | ||
|---|---|---|---|
| Breast cancer referral | |||
| Constant | 3.23 | Parkville Familial Cancer Centre, the Victorian Cancer Registry, expert opinion | |
| Aged 40–49 | 0.38 | ||
| Aged 50–69 | 0.22 | ||
| Aged 70 and over | 0.10 | ||
| Survival < 12 months | 0.35 | ||
| High grade | 2.37 | ||
| Non triple-negative | 0.50 | Assumption (expert opinion) | |
| HER2 | 0.22 | Assumption (expert opinion) | |
| Ovarian cancer referral | |||
| Constant | 3.09 | Parkville Familial Cancer Centre, the Victorian Cancer Registry, expert opinion | |
| Aged 60–74 | 0.20 | ||
| Aged 75 and over | 0.08 | ||
| Survival < 12 months | 0.04 | ||
| High grade | 1.06 | ||
| Prior breast cancer diagnosis 1 | 17.75 | ||
| Mucinous histotype | 0.08 | Assumption (expert opinion) | |
| Other histotype 2 | 0.20 | Assumption (expert opinion) | |
| Uptake | |||
| Breast cancer | 0.96 | [10] | |
| Ovarian cancer | 0.95 | [11] | |
| Time Since Family Pathogenic/Likely Pathogenic Variant First Identified | Source | ||||
|---|---|---|---|---|---|
| First Degree | <1 Year | 1–3 Years | >3 Years | Parkville Familial Cancer Centre, unpublished observation | |
| Age < 18 | 0 | 0 | 0 | ||
| Age 18–29 | 0.259 | 0.098 | 0.071 | ||
| Age 30–49 | 0.286 | 0.098 | 0.022 | ||
| Age 50–59 | 0.146 | 0.033 | 0.010 | ||
| Age ≥ 60 | 0.099 | 0.014 | 0.007 | ||
| Second Degree | |||||
| Age <18 | 0 | 0 | 0 | ||
| Age 18–29 | 0.072 | 0.045 | 0.034 | ||
| Age 30–49 | 0.112 | 0.080 | 0.021 | ||
| Age 50–59 | 0.114 | 0.034 | 0.002 | ||
| Age ≥ 60 | 0.039 | 0.017 | 0.002 | ||
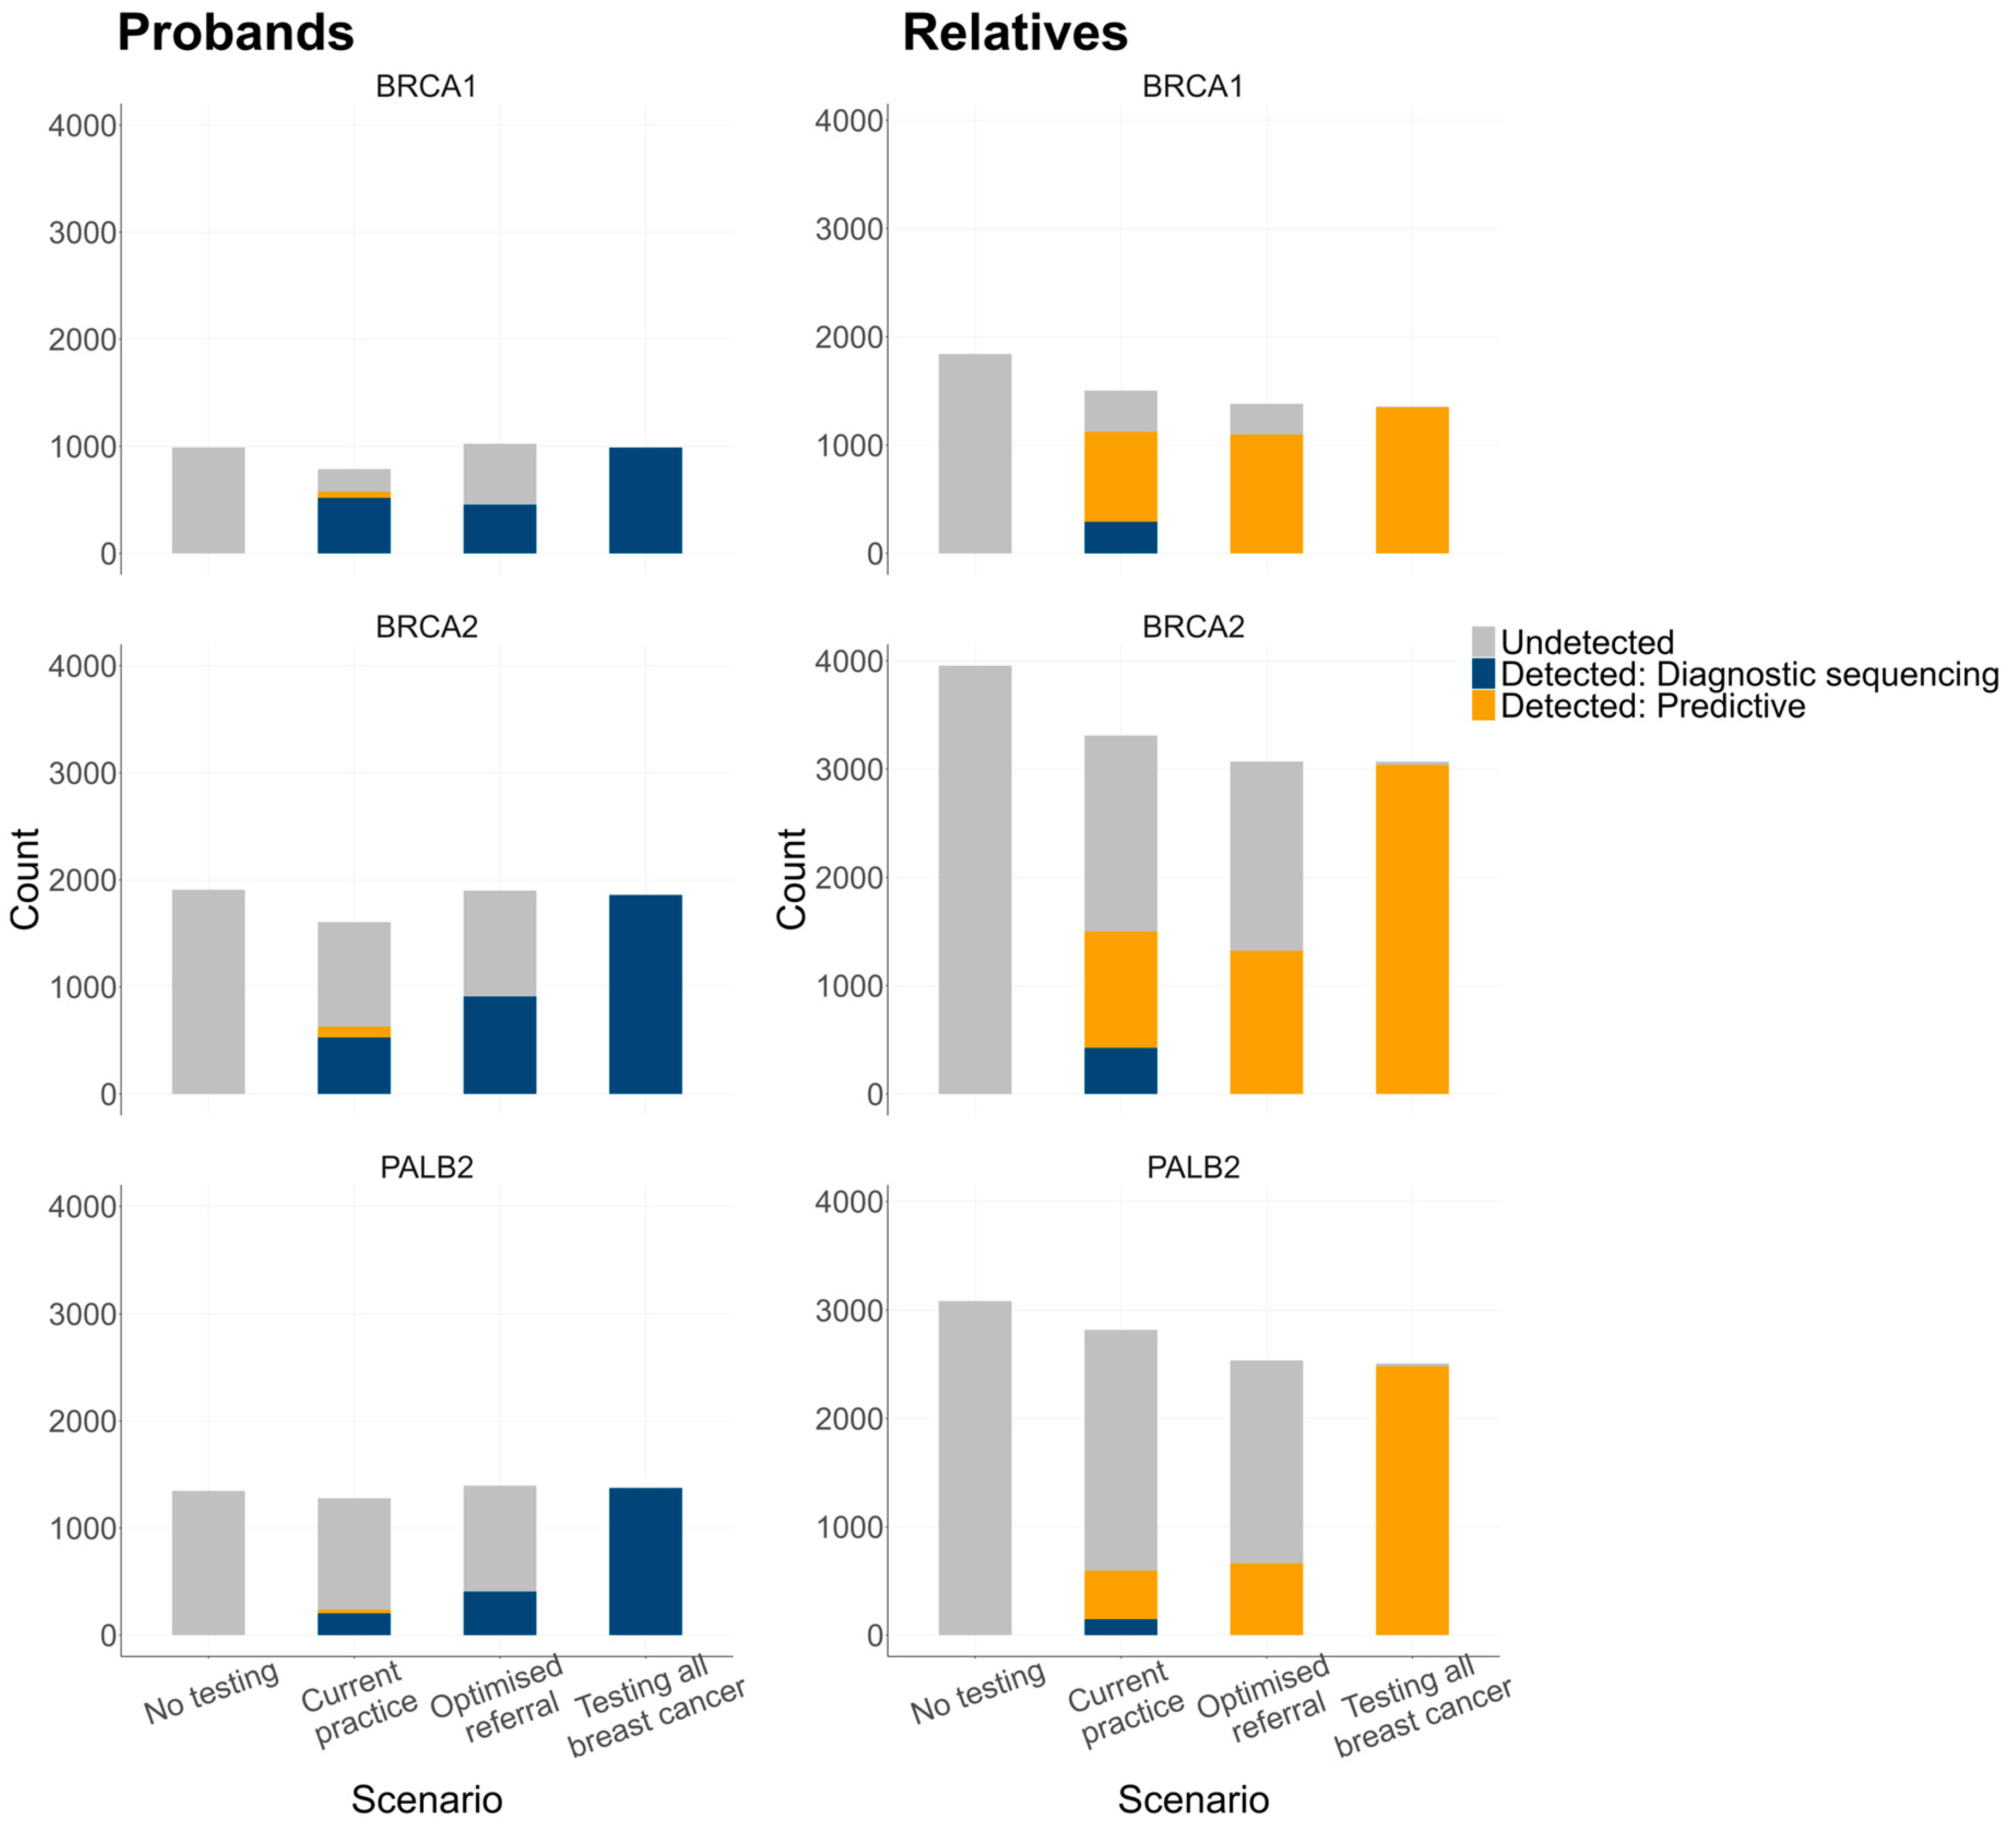
| Group | Outcome | Scenario 1: No Genetic Testing | Scenario 2: Current Practice | Scenario 3: Optimised Referral of Breast and Ovarian Cancer | Scenario 4: Genetic Testing for all Breast Cancers | |
|---|---|---|---|---|---|---|
| Probands (women diagnosed with breast cancer before the age of 80 years) | Total number | 121,343 | 120,700 | 121,299 | 120,166 | |
| Age at diagnosis, mean (sd) | 60.53 (10.93) | 60.5 (10.94) | 60.47 (10.92) | 60.60 (10.90) | ||
| Prevalence of P/LP variants, n (%) | BRCA1 BRCA2 PALB2 Total | 990 (0.82%) 1908 (1.58%) 1347 (1.11%) 4245 (3.53%) | 787 (0.65%) 1605 (1.33%) 1278 (1.05%) 3670 (3.05%) | 714 (0.59%) 1539 (1.28%) 1291 (1.06%) 3544 (2.95%) | 684 (0.56%) 1235 (1.02%) 948 (0.78%) 2867 (2.39%) | |
| Genetic testing, diagnostic sequencing, n (%) | 0 (0%) | 9279 (7.69%) | 16,159 (13.32%) | 120,162 (99.99%) | ||
| Genetic testing, predictive test, n (%) | 0 (0%) | 537 (0.44%) | 727 (0.60%) | 664 (0.55%) | ||
| Secondary ovarian cancer in P/LP variant carriers, n (%) | 557 (13.12%) | 283 (7.71%) | 200 (5.64%) | 49 (1.71%) | ||
| Male and female relatives of probands who carry a P/LP variant | Total number | 66 358 | 56,672 | 54,020 | 43,352 | |
| Average per proband | 15.63 | 15.44 | 15.24 | 15.12 | ||
| Genetic testing, diagnostic sequencing, n (%) 1 | 0 (%) | 1438 (2.54%) | 2238 (4.14%) | 3938 (9.08%) | ||
| Genetic testing, predictive test, n (%) 1 | 0 (0%) | 10,813 (19.09%) | 13,705 (25.37%) | 19,621 (45.26%) | ||
| All cancer-unaffected female relatives, including non-carriers | Total number | 30,736 | 26,661 | 25,319 | 20,461 | |
| Average per proband | 7.24 | 7.26 | 7.14 | 7.14 | ||
| Age, median (IQR) | 34 (18, 58) | 34 (18, 59) | 34 (17, 59) | 34 (17, 60) | ||
| Cancer-unaffected female relatives, excluding non-carriers | Total number | 8881 | 7633 | 7217 | 5881 | |
| Average per proband | 2.08 | 2.07 | 2.06 | 2.04 | ||
| Age, median (IQR) | 31 (17, 48) | 31 (17, 49) | 31 (17, 50) | 31 (17, 51) | ||
| Group | Outcome | Scenario 1: No Genetic Testing | Scenario 2: Current Practice | Scenario 3: Optimised Referral of Breast and Ovarian Cancer | Scenario 4: Genetic Testing all Breast Cancers | ||||
|---|---|---|---|---|---|---|---|---|---|
| Mean | 95% CI | Mean | 95% CI | Mean | 95% CI | Mean | 95% CI | ||
| Probands with a P/LP and their relatives 1 | Life expectancy | 84.672 | (84.538, 84.806) | 85.067 | (84.927, 85.208) | 85.189 | (85.045, 85.333) | 85.315 | (85.155, 85.475) |
| Life-years saved | 41.903 | (41.606, 42.199) | 41.991 | (41.671, 42.311) | 42.118 | (41.787, 42.449) | 41.887 | (41.519, 42.255) | |
| Relatives 1 with a P/LP variant only | Life expectancy | 82.304 | (82.008, 82.600) | 83.443 | (83.141, 83.746) | 83.973 | (83.667, 84.279) | 84.159 | (83.818, 84.501) |
| Life-years saved | 47.860 | (47.373, 48.347) | 48.780 | (48.241, 49.319) | 49.150 | (48.595, 49.705) | 49.112 | (48.495, 49.730) | |
Disclaimer/Publisher’s Note: The statements, opinions and data contained in all publications are solely those of the individual author(s) and contributor(s) and not of MDPI and/or the editor(s). MDPI and/or the editor(s) disclaim responsibility for any injury to people or property resulting from any ideas, methods, instructions or products referred to in the content. |
© 2024 by the authors. Licensee MDPI, Basel, Switzerland. This article is an open access article distributed under the terms and conditions of the Creative Commons Attribution (CC BY) license (https://creativecommons.org/licenses/by/4.0/).
Share and Cite
Petelin, L.; Cunich, M.; Procopio, P.; Schofield, D.; Devereux, L.; Nickson, C.; James, P.A.; Campbell, I.G.; Trainer, A.H. Reduced Breast and Ovarian Cancer Through Targeted Genetic Testing: Estimates Using the NEEMO Microsimulation Model. Cancers 2024, 16, 4165. https://doi.org/10.3390/cancers16244165
Petelin L, Cunich M, Procopio P, Schofield D, Devereux L, Nickson C, James PA, Campbell IG, Trainer AH. Reduced Breast and Ovarian Cancer Through Targeted Genetic Testing: Estimates Using the NEEMO Microsimulation Model. Cancers. 2024; 16(24):4165. https://doi.org/10.3390/cancers16244165
Chicago/Turabian StylePetelin, Lara, Michelle Cunich, Pietro Procopio, Deborah Schofield, Lisa Devereux, Carolyn Nickson, Paul A. James, Ian G. Campbell, and Alison H. Trainer. 2024. "Reduced Breast and Ovarian Cancer Through Targeted Genetic Testing: Estimates Using the NEEMO Microsimulation Model" Cancers 16, no. 24: 4165. https://doi.org/10.3390/cancers16244165
APA StylePetelin, L., Cunich, M., Procopio, P., Schofield, D., Devereux, L., Nickson, C., James, P. A., Campbell, I. G., & Trainer, A. H. (2024). Reduced Breast and Ovarian Cancer Through Targeted Genetic Testing: Estimates Using the NEEMO Microsimulation Model. Cancers, 16(24), 4165. https://doi.org/10.3390/cancers16244165