

hist2RNA: An Efficient Deep Learning Architecture to Predict Gene Expression from Breast Cancer Histopathology Images

 ,
,  ,
,
Abstract
Simple Summary
Abstract
1. Introduction
2. Materials and Methods
2.1. Study Overview
2.2. Data Collection
2.3. Data Preparation
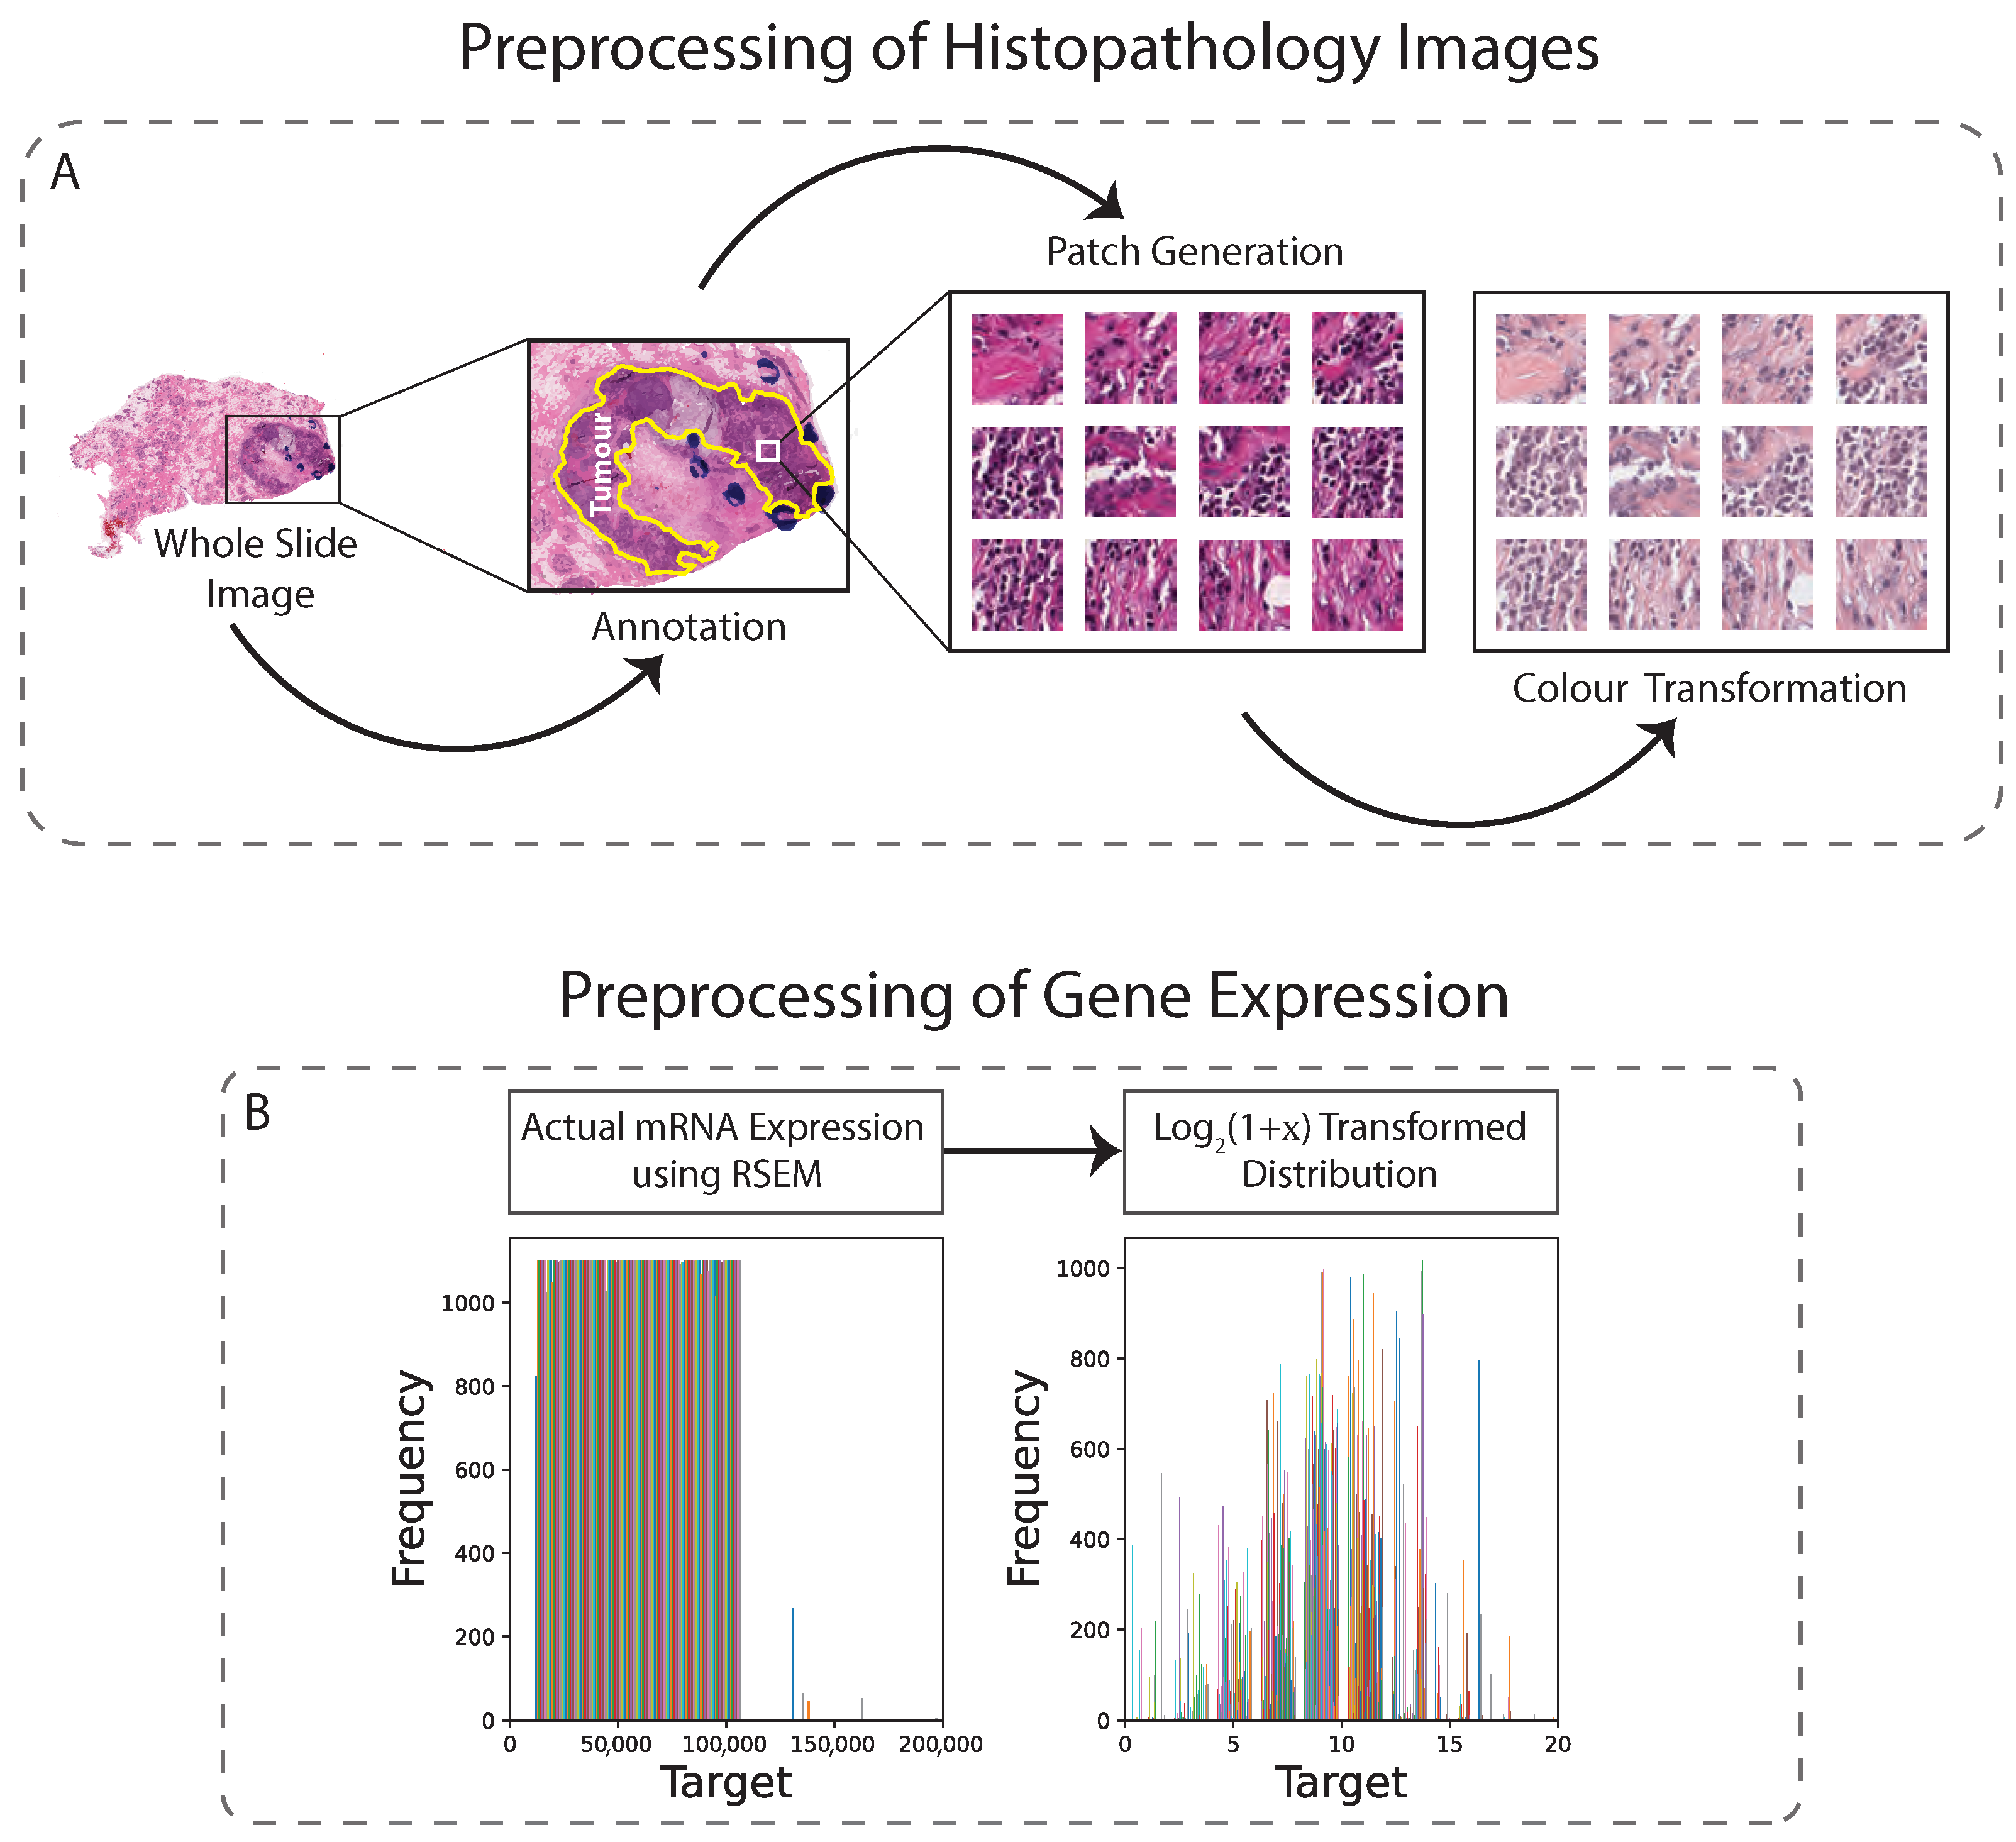
2.3.1. Slide Annotation
2.3.2. Image Data Preprocessing
2.3.3. RNA Sequencing Data Preprocessing
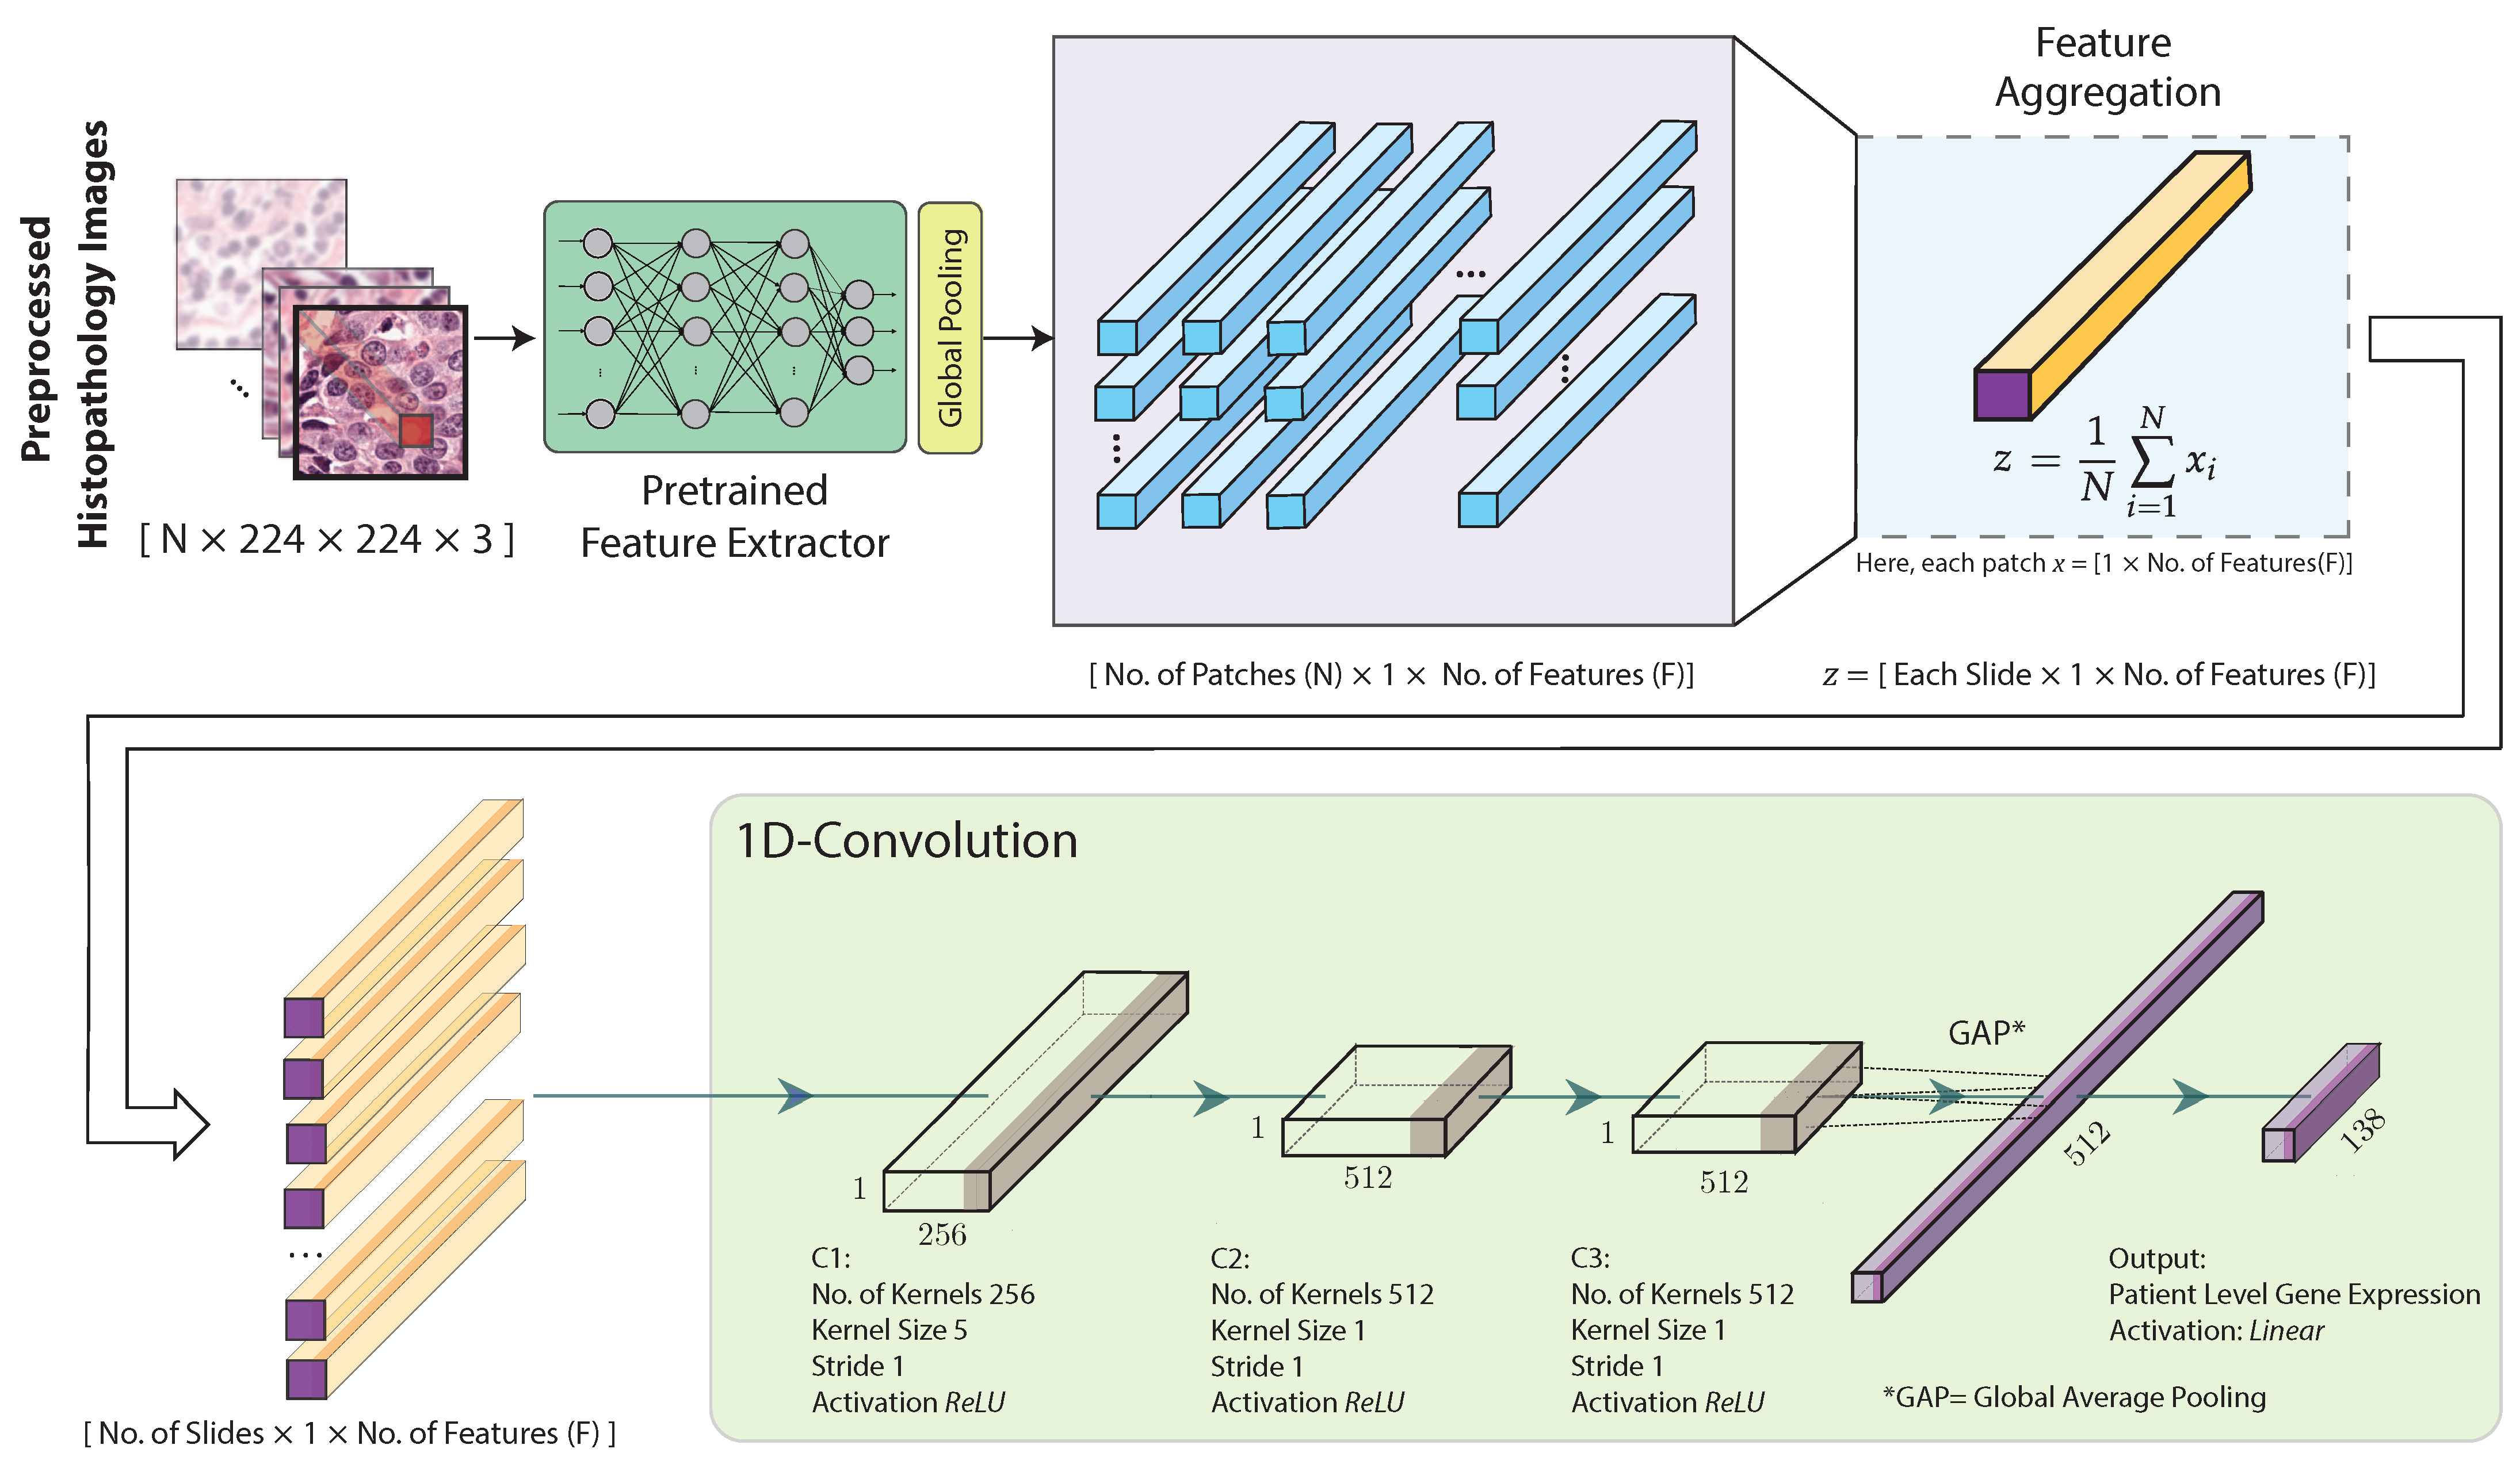
2.4. Feature Extraction, Aggregation and Model Training
2.5. Evaluation Metrics
3. Results
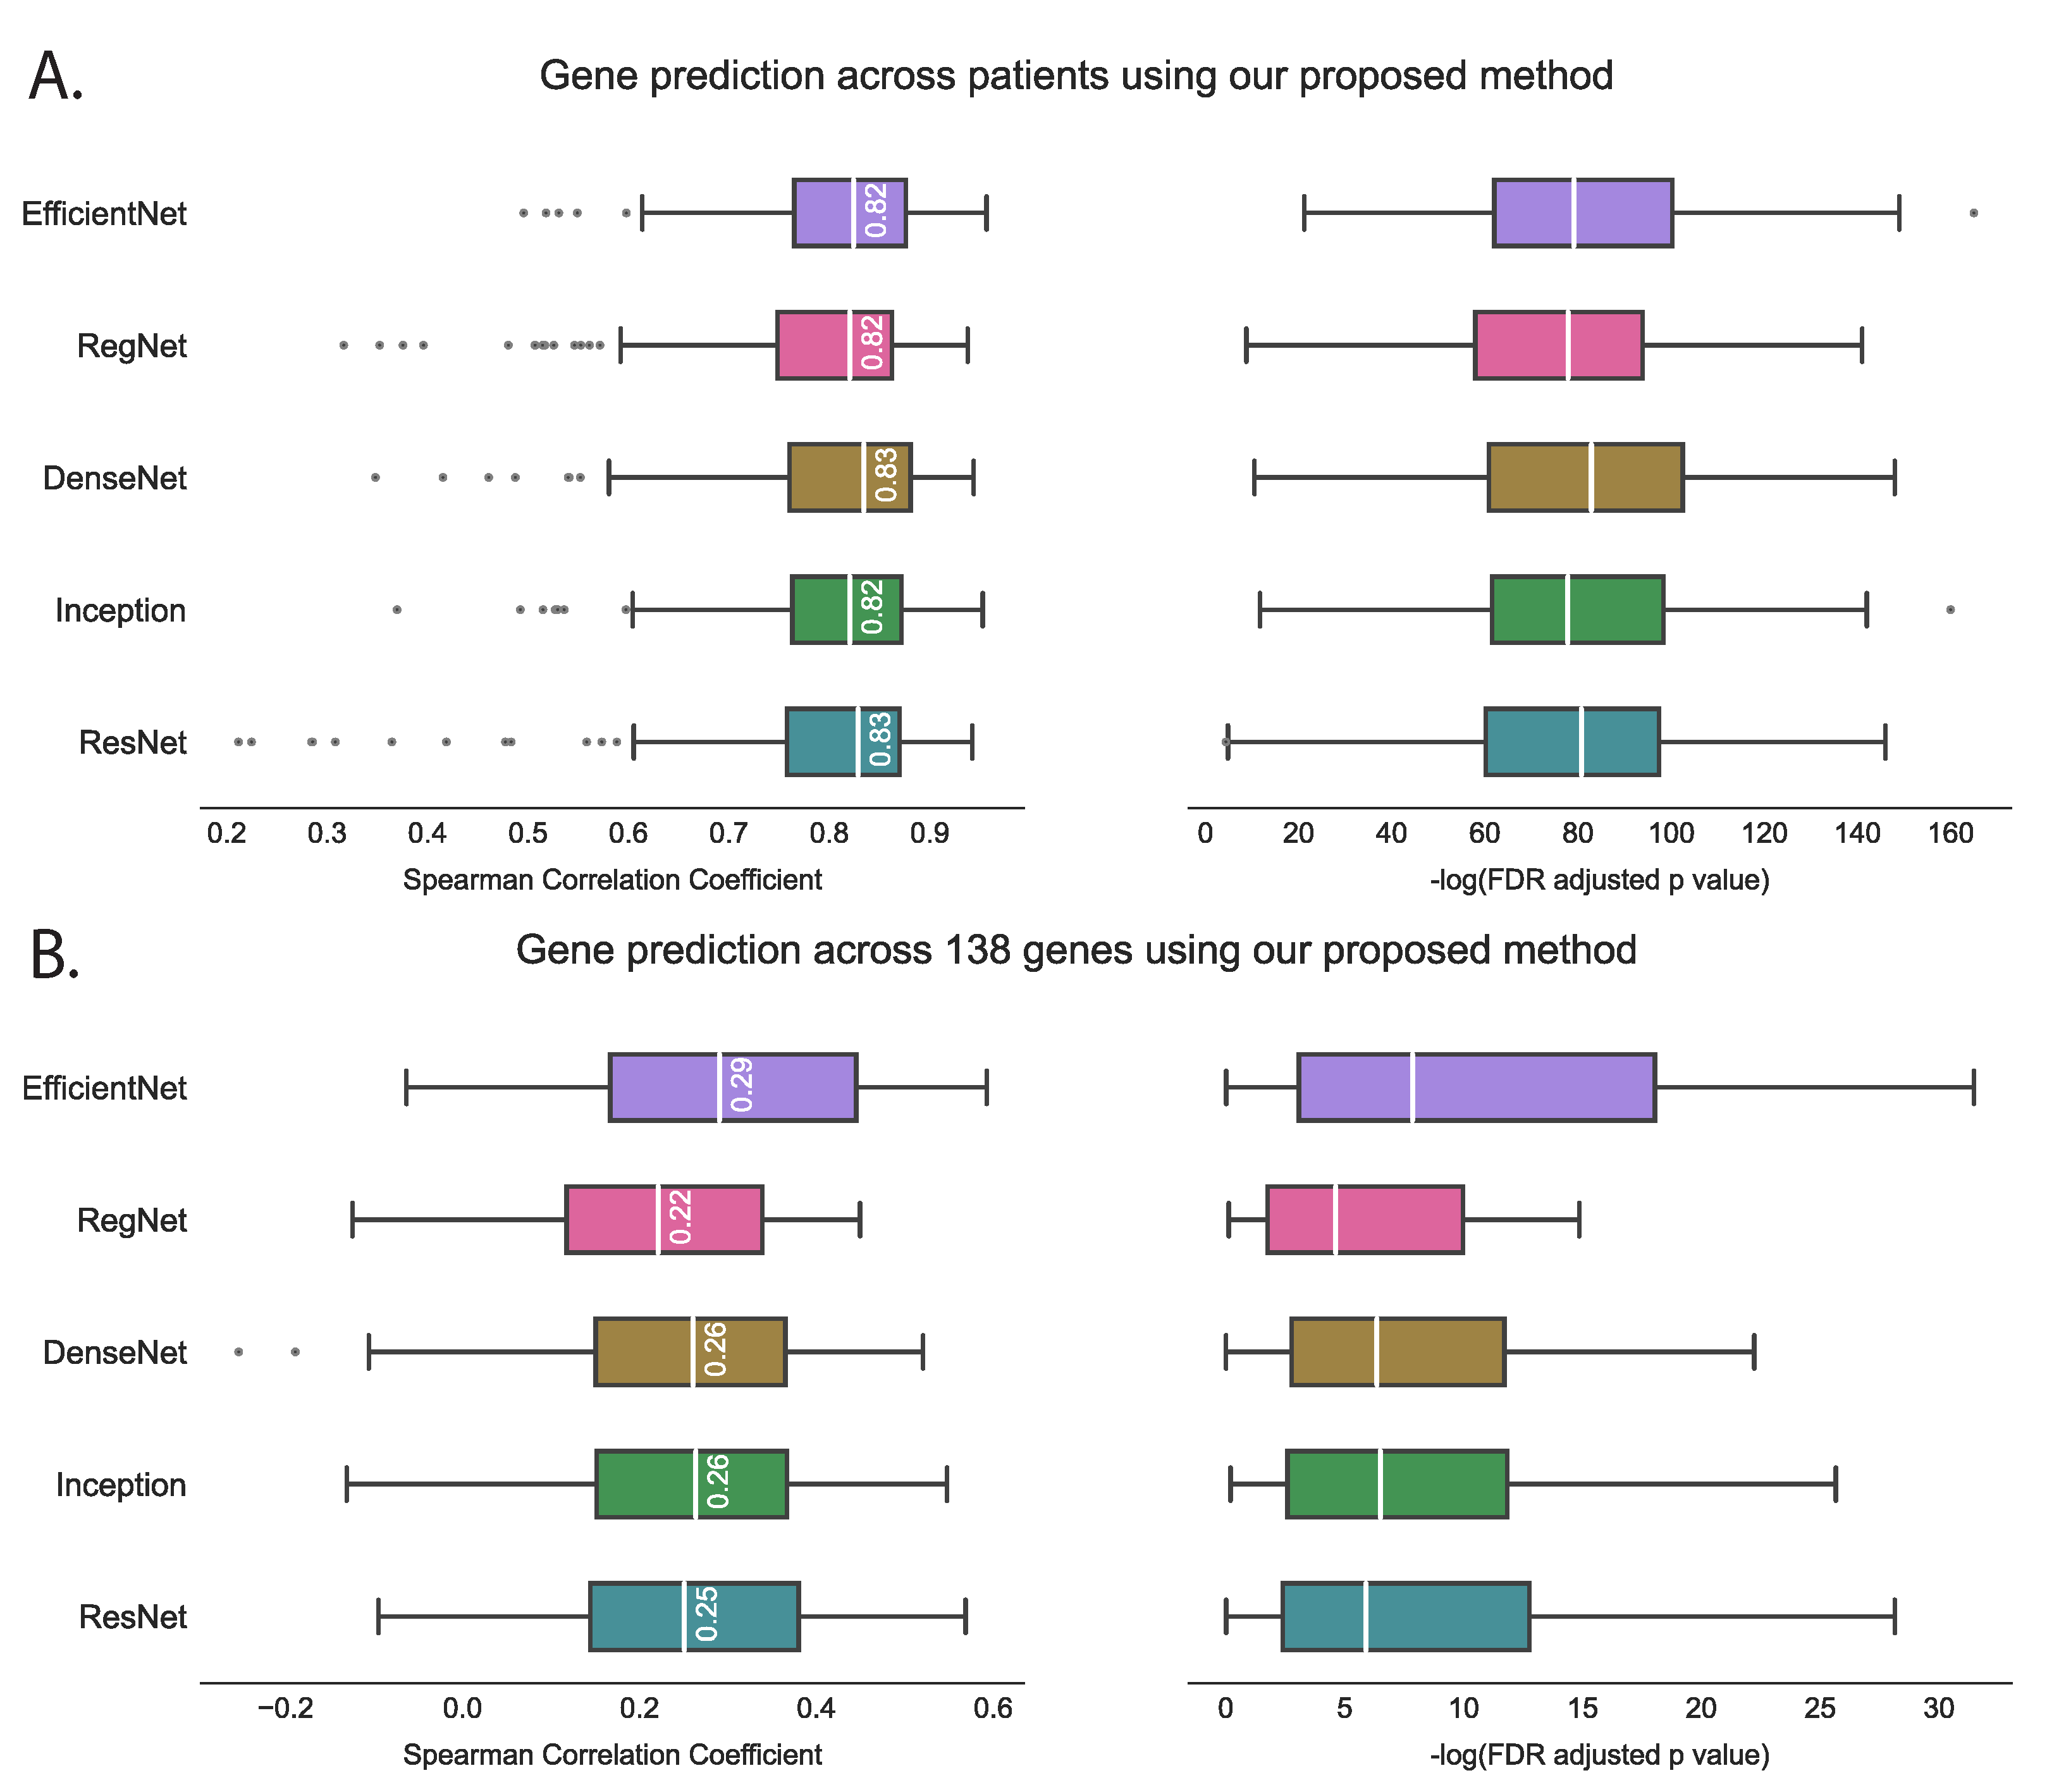
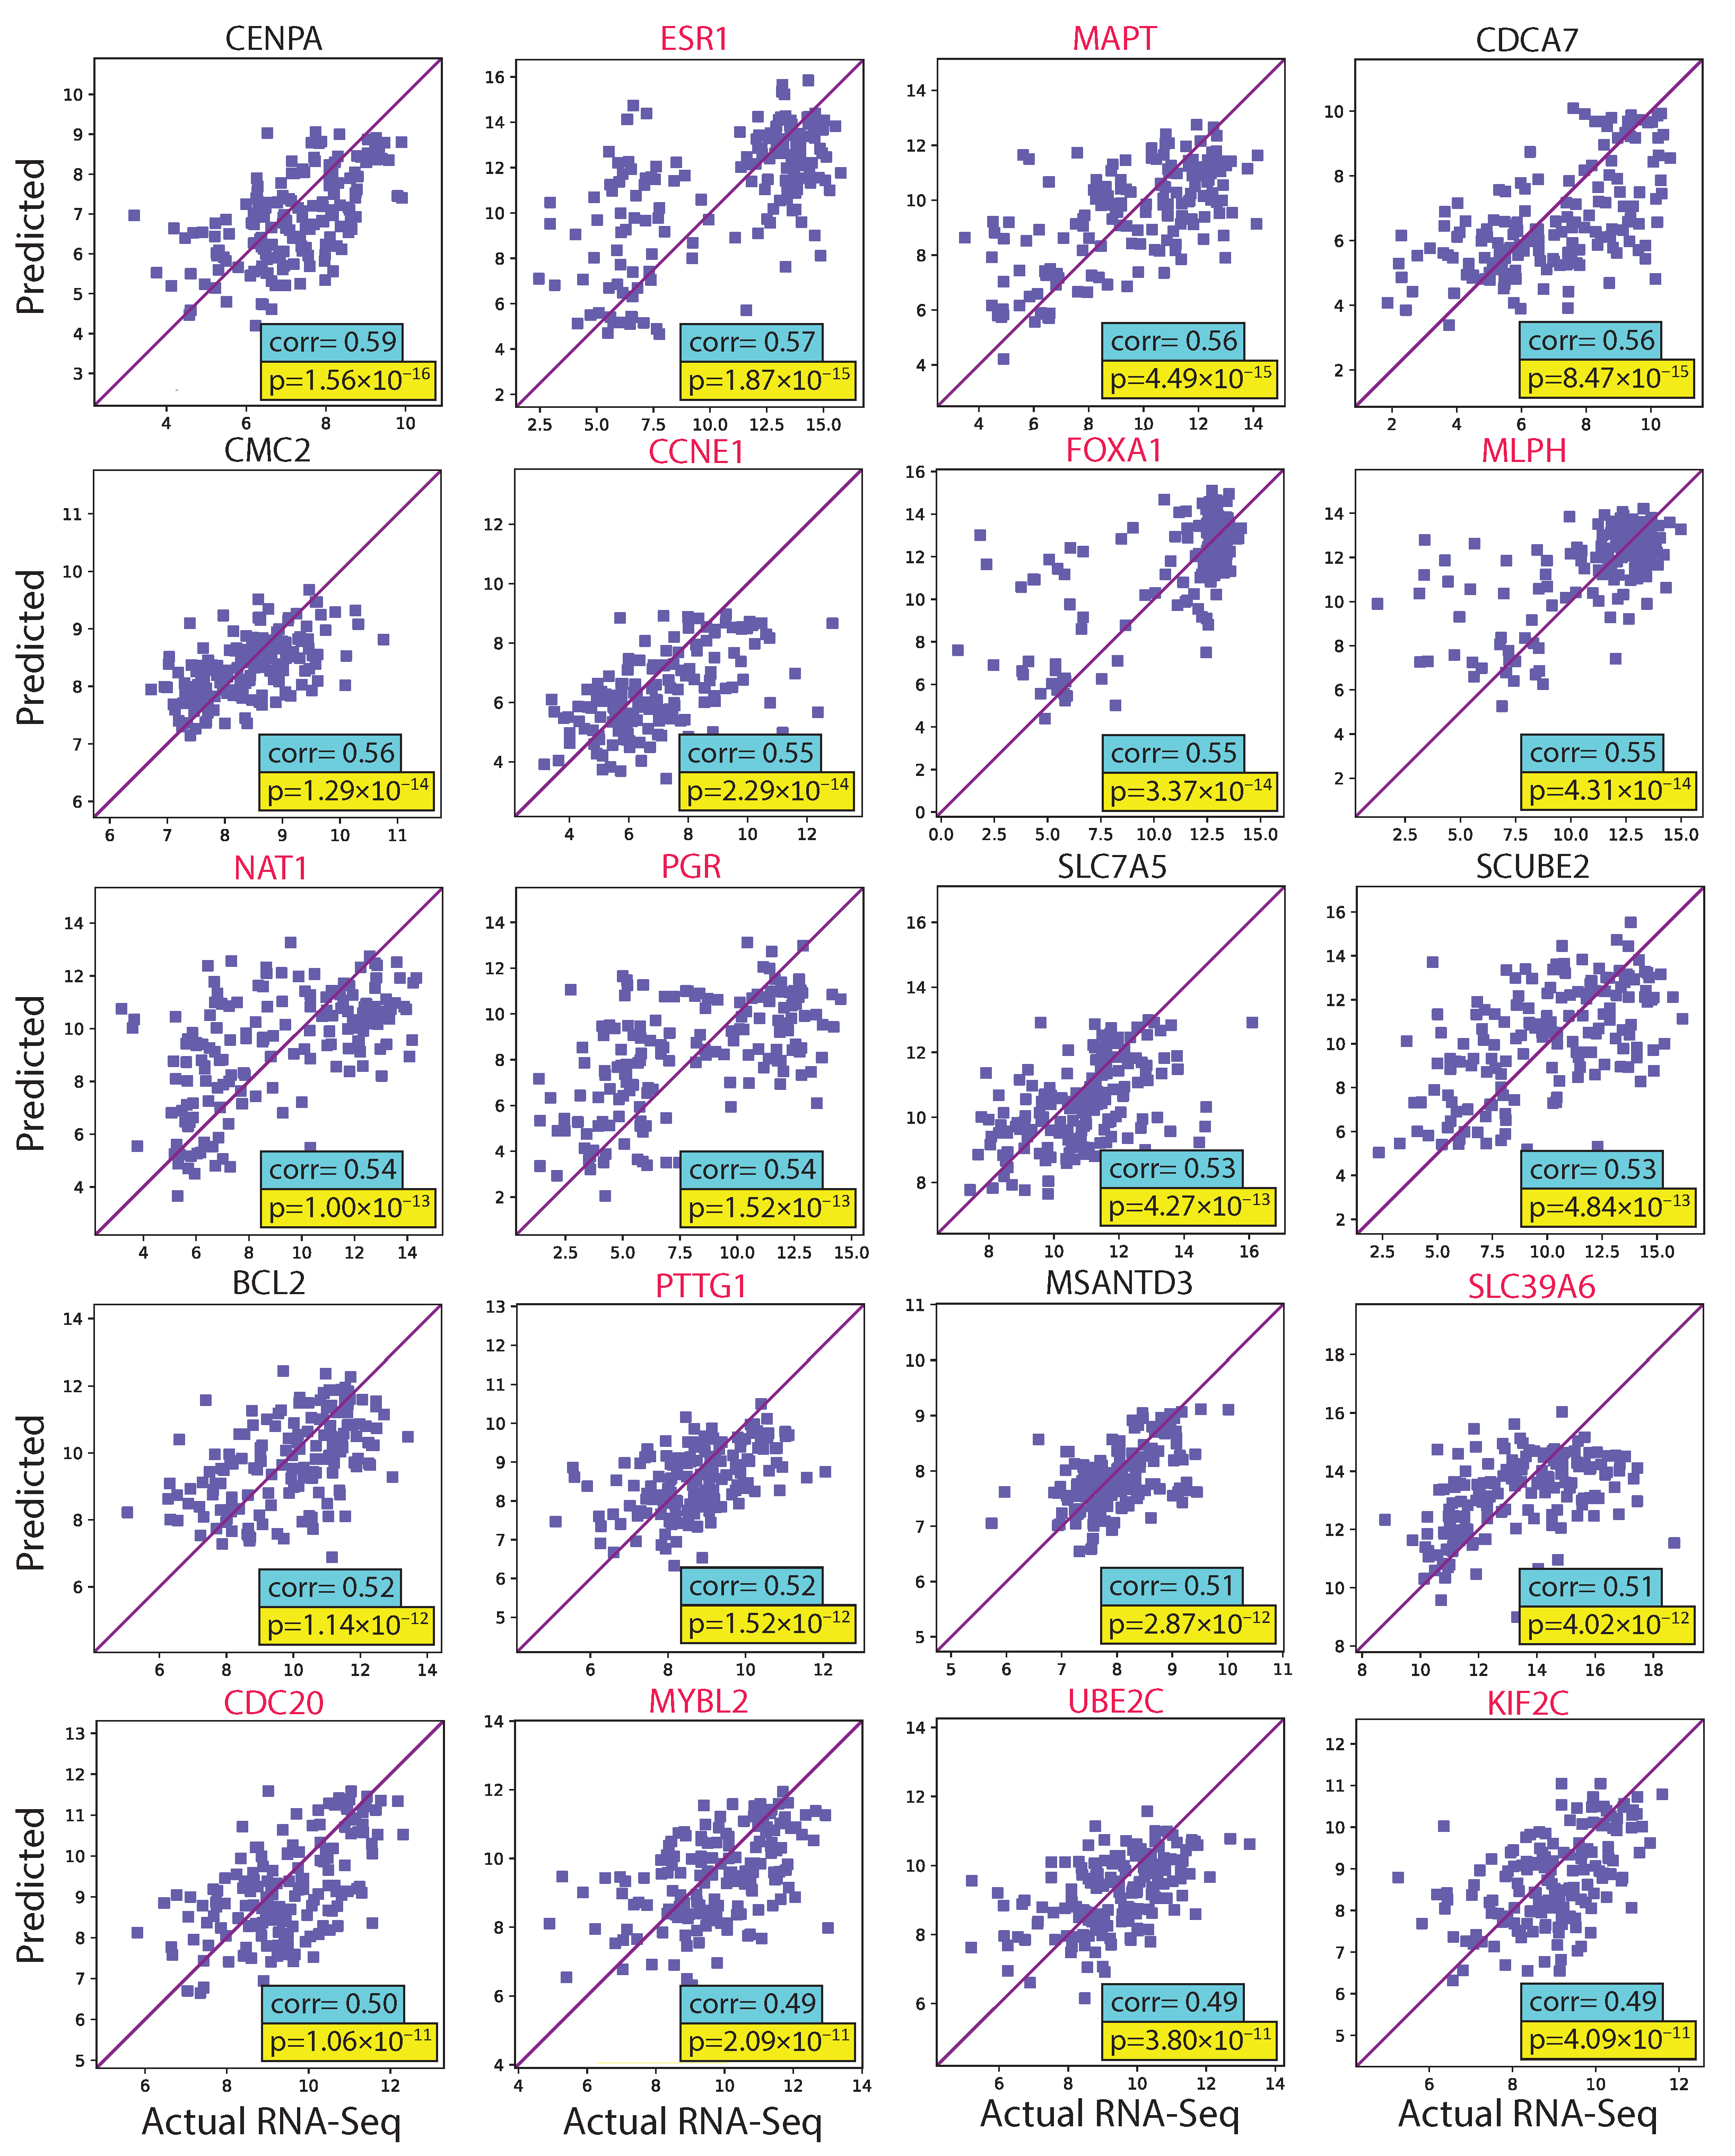
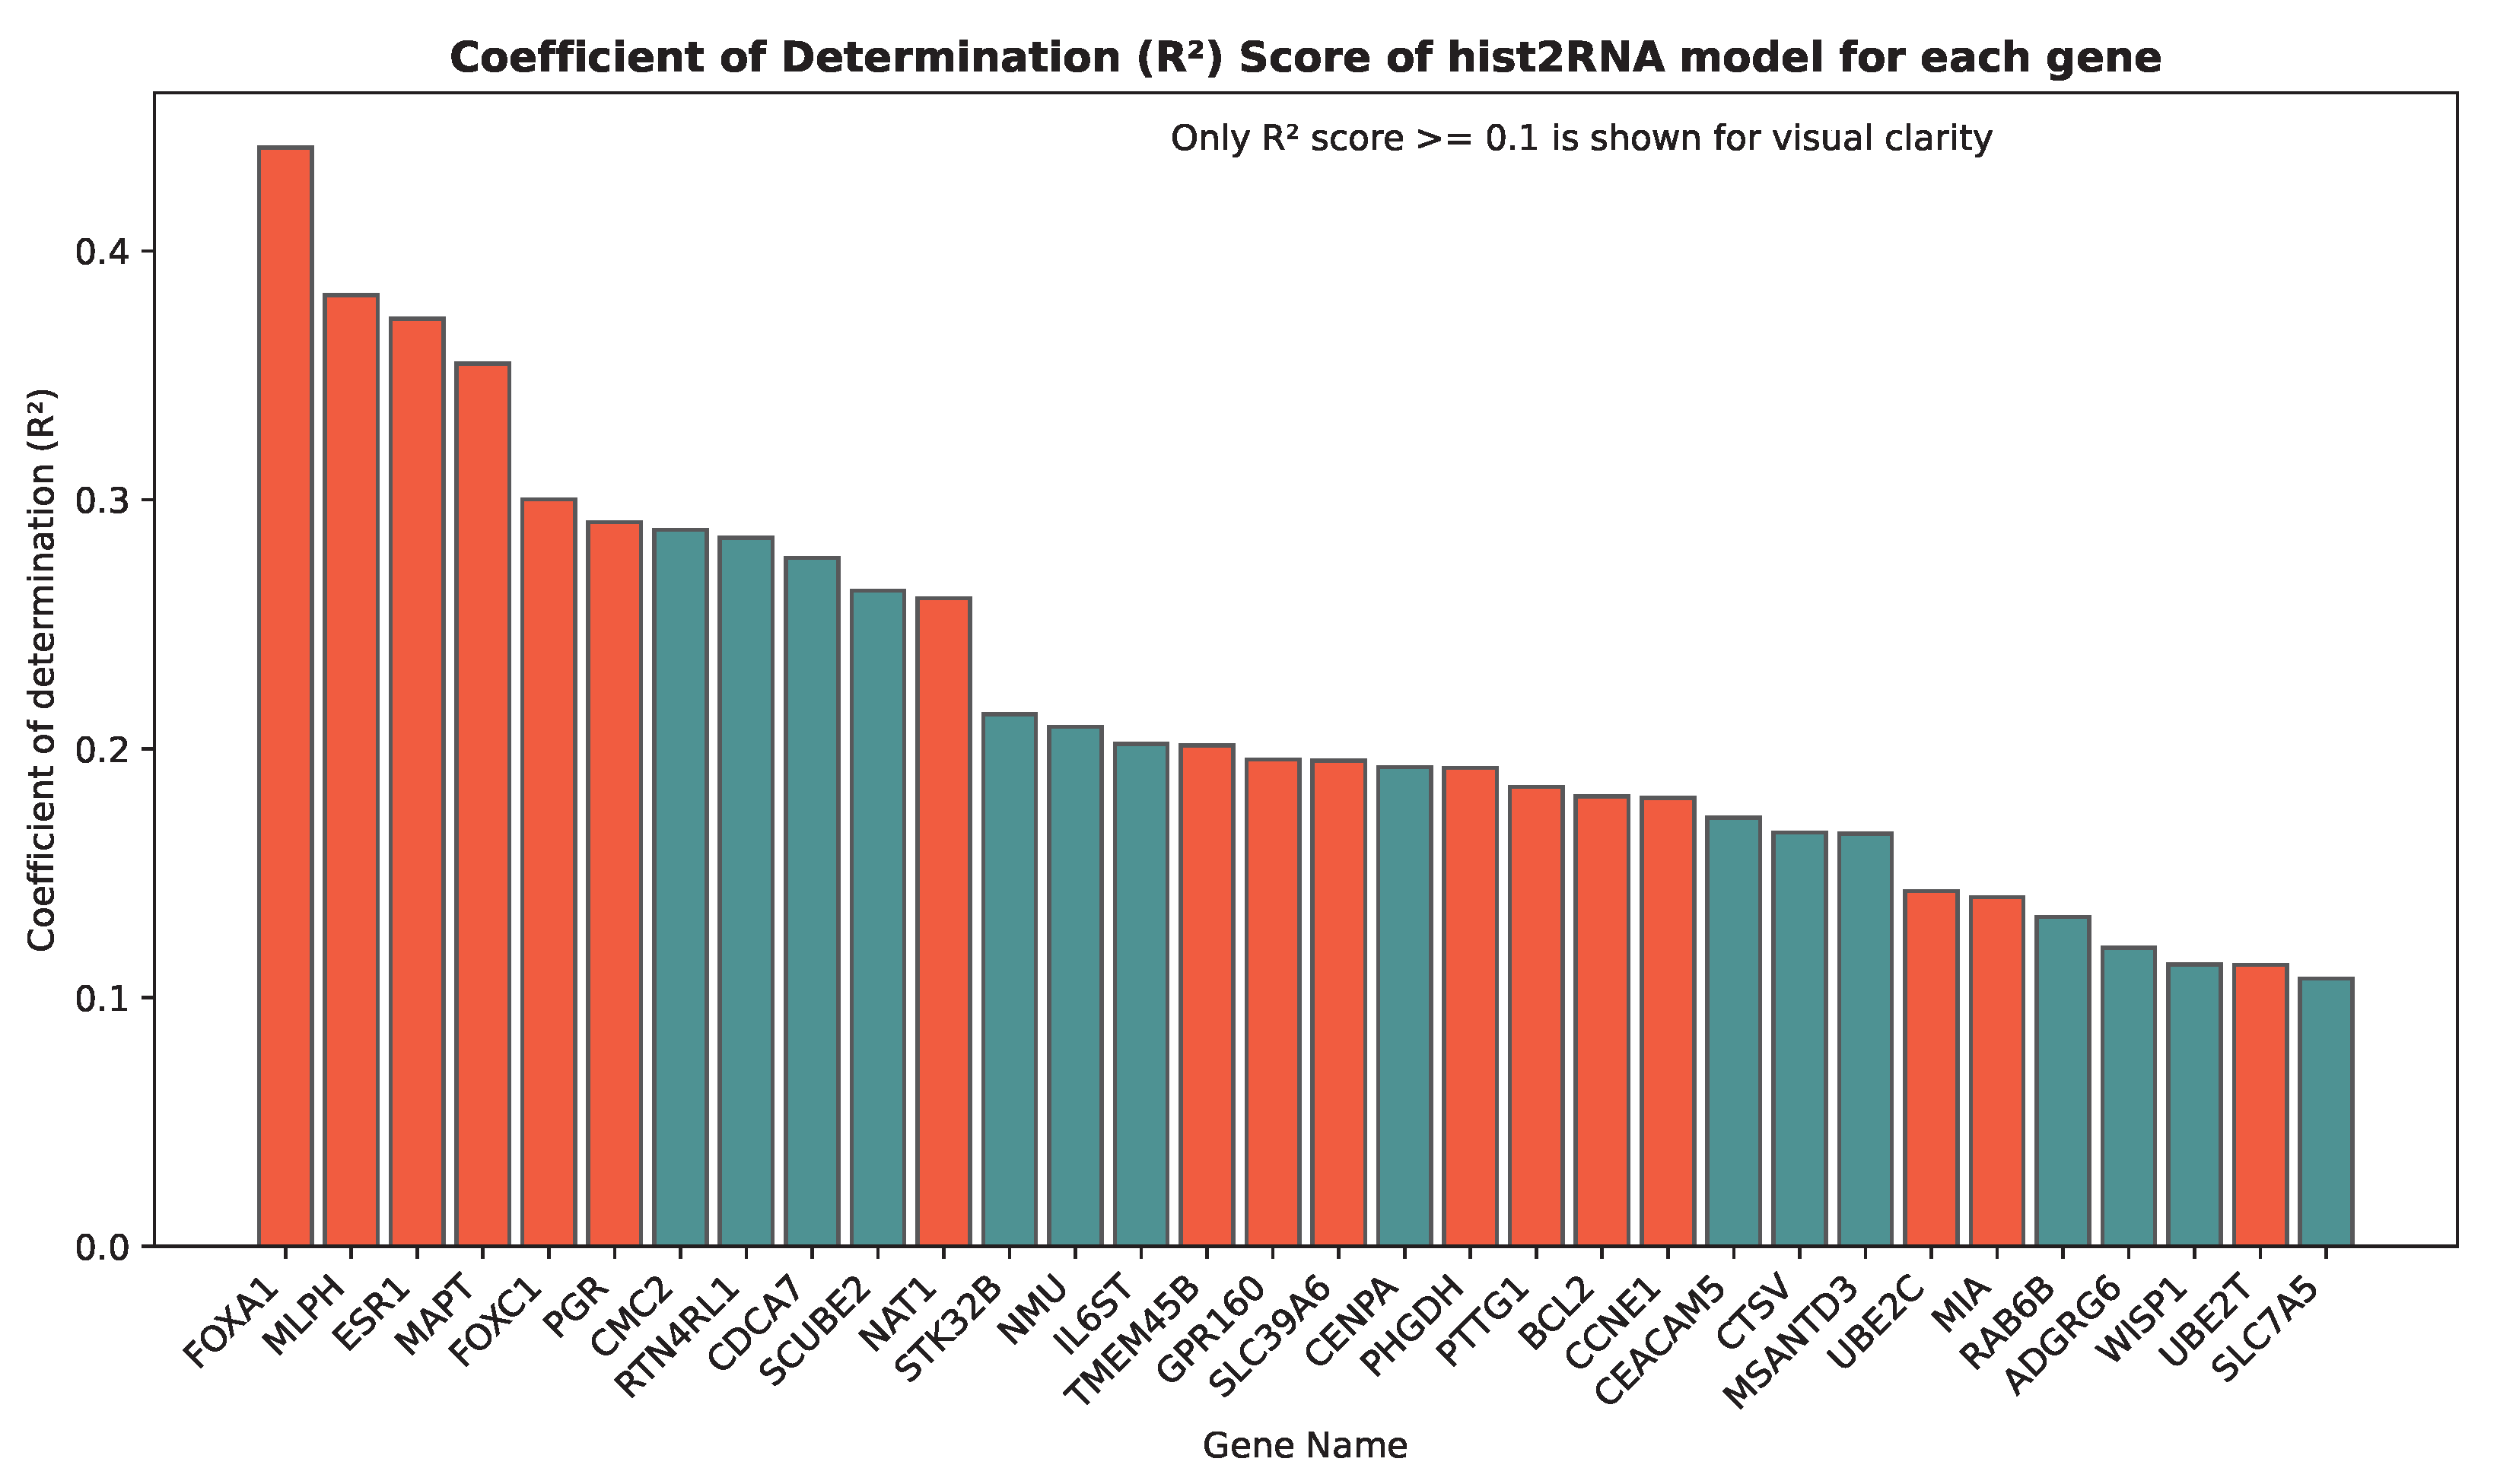
3.1. Evaluating hist2RNA Method on Held-Out Test Data
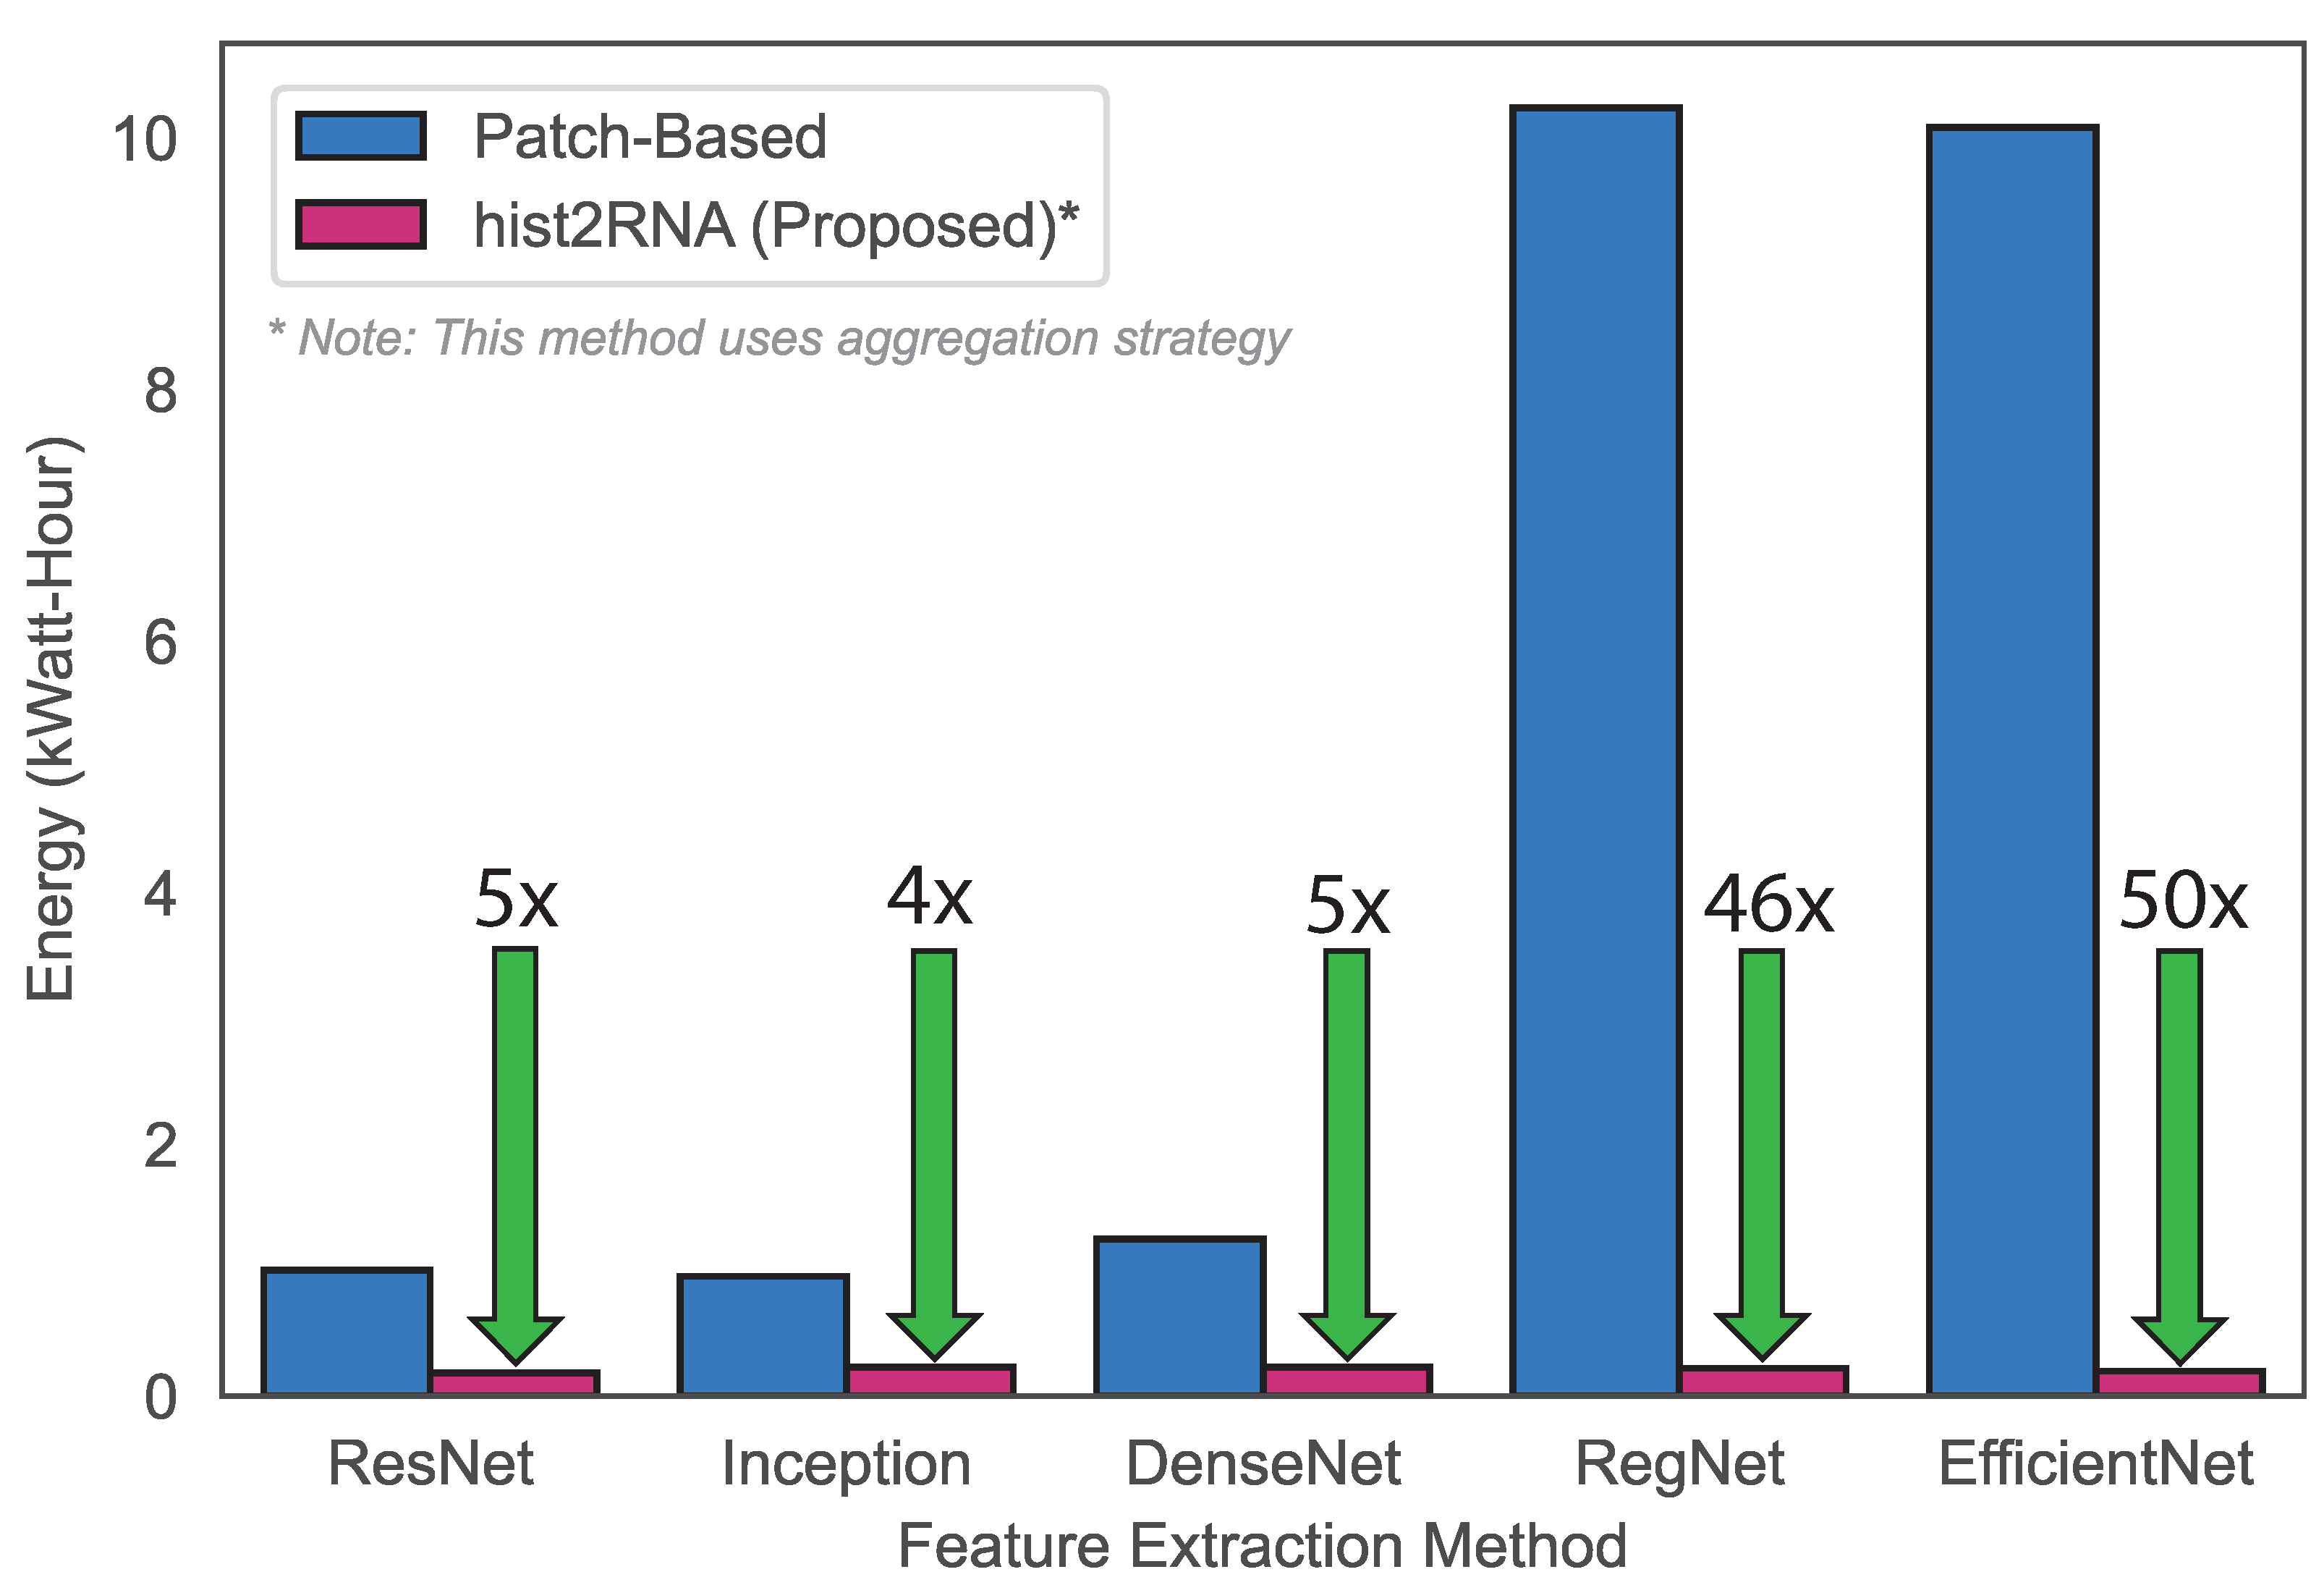
3.2. Classification of Breast Cancer Subtypes and Computational Efficiency of hist2RNA
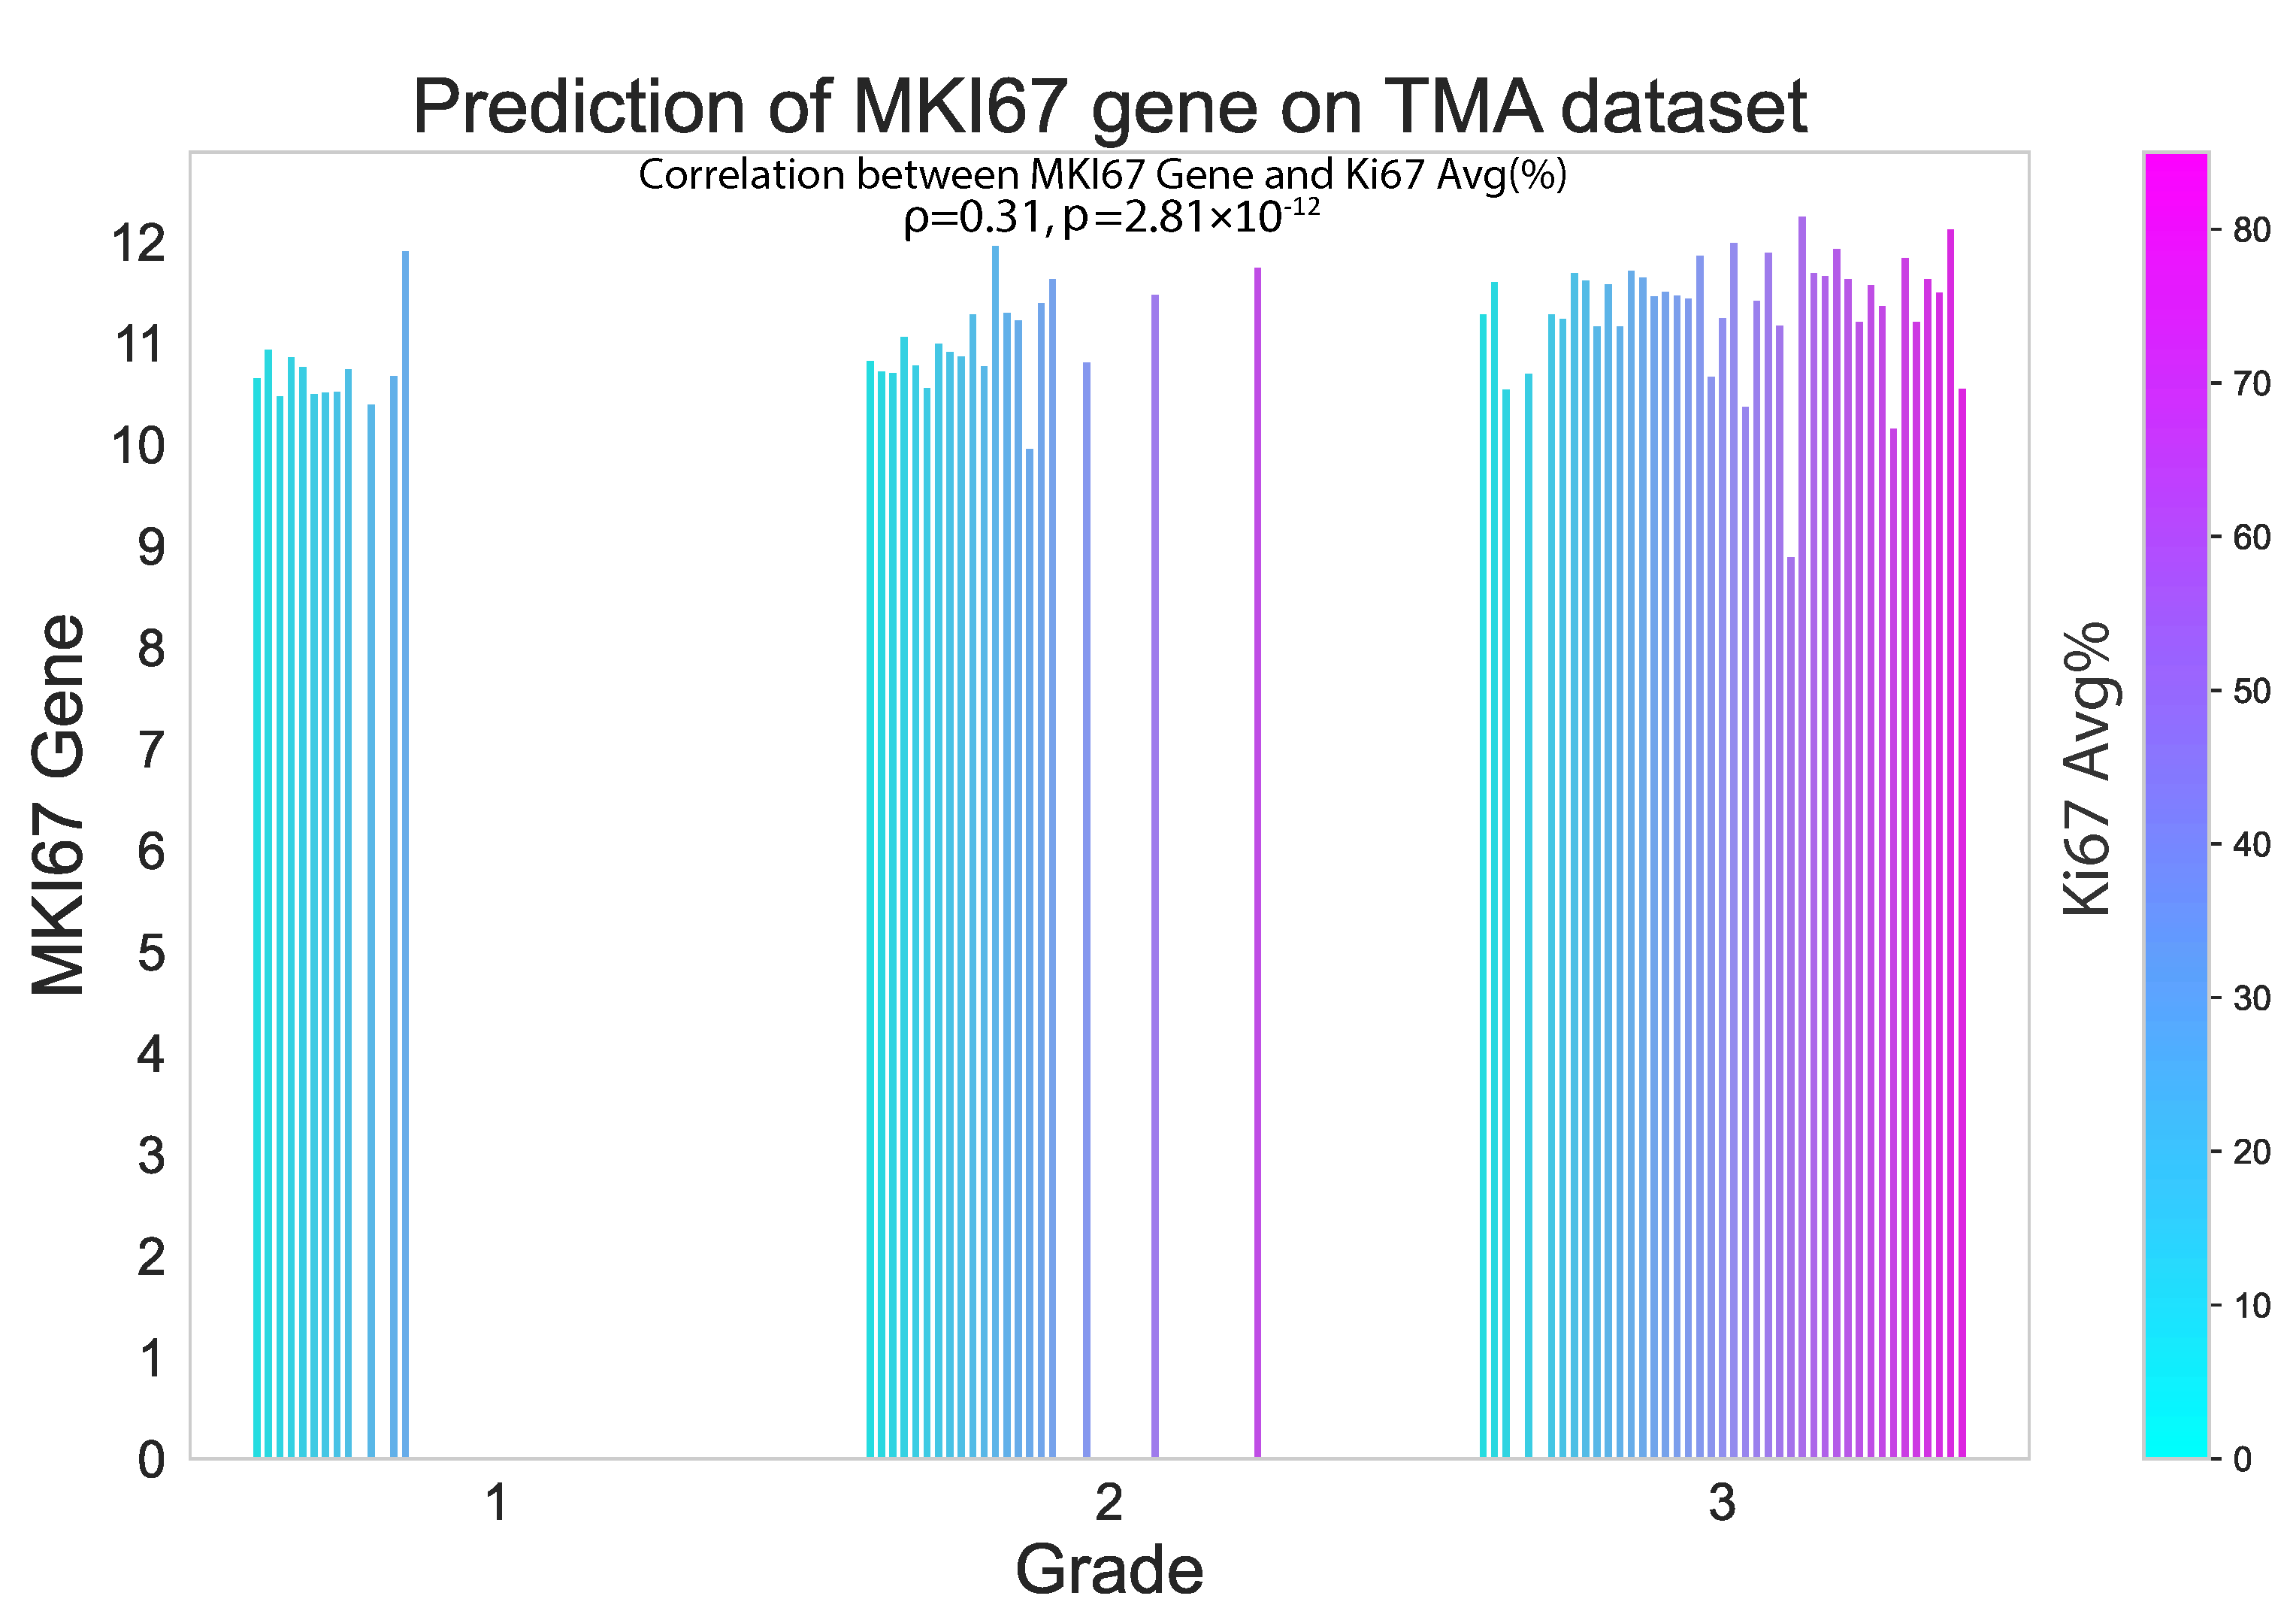
3.3. Performance of hist2RNA on External TMA Dataset
4. Discussion
4.1. hist2RNA Model Performance in Gene Expression Prediction
4.2. Comparing Breast Cancer Subtype Classification Approaches
4.3. Clinical Implications of hist2RNA Model in Breast Cancer
4.4. Multigene Prognostic Signatures and Risk Stratification
4.5. Comparison with Other State-of-the-Art Approaches
4.6. Limitations, Challenges and Future Directions
5. Conclusions
Supplementary Materials
Author Contributions
Funding
Institutional Review Board Statement
Informed Consent Statement
Data Availability Statement
Acknowledgments
Conflicts of Interest
References
- Wilkinson, L.; Gathani, T. Understanding breast cancer as a global health concern. Br. J. Radiol. 2022, 95, 1130. [Google Scholar] [CrossRef] [PubMed]
- Foundation, N.B.C. Breast Cancer Stats in Australia. 2022. Available online: https://nbcf.org.au/about-breast-cancer/breast-cancer-stats/ (accessed on 20 November 2022).
- Ji, P.; Gong, Y.; Jiang, C.C.; Hu, X.; Di, G.H.; Shao, Z.M. Association between socioeconomic factors at diagnosis and survival in breast cancer: A population-based study. Cancer Med. 2020, 9, 1922–1936. [Google Scholar] [CrossRef]
- Hirra, I.; Ahmad, M.; Hussain, A.; Ashraf, M.U.; Saeed, I.A.; Qadri, S.F.; Alghamdi, A.M.; Alfakeeh, A.S. Breast cancer classification from histopathological images using patch-based deep learning modeling. IEEE Access 2021, 9, 24273–24287. [Google Scholar] [CrossRef]
- Conti, A.; Duggento, A.; Indovina, I.; Guerrisi, M.; Toschi, N. Radiomics in breast cancer classification and prediction. Semin. Cancer Biol. 2021, 72, 238–250. [Google Scholar] [CrossRef]
- Zhou, X.; Li, C.; Rahaman, M.M.; Yao, Y.; Ai, S.; Sun, C.; Wang, Q.; Zhang, Y.; Li, M.; Li, X.; et al. A comprehensive review for breast histopathology image analysis using classical and deep neural networks. IEEE Access 2020, 8, 90931–90956. [Google Scholar] [CrossRef]
- Paik, S.; Tang, G.; Shak, S.; Kim, C.; Baker, J.; Kim, W.; Cronin, M.; Baehner, F.L.; Watson, D.; Bryant, J.; et al. Gene expression and benefit of chemotherapy in women with node-negative, estrogen receptor-positive breast cancer. J. Clin. Oncol. 2006, 24, 3726–3734. [Google Scholar] [CrossRef] [PubMed]
- Albain, K.S.; Barlow, W.E.; Shak, S.; Hortobagyi, G.N.; Livingston, R.B.; Yeh, I.T.; Ravdin, P.; Bugarini, R.; Baehner, F.L.; Davidson, N.E.; et al. Prognostic and predictive value of the 21-gene recurrence score assay in postmenopausal women with node-positive, oestrogen-receptor-positive breast cancer on chemotherapy: A retrospective analysis of a randomised trial. Lancet Oncol. 2010, 11, 55–65. [Google Scholar] [CrossRef] [PubMed]
- Sparano, J.A.; Gray, R.J.; Makower, D.F.; Pritchard, K.I.; Albain, K.S.; Hayes, D.F.; Geyer, C.E.; Dees, E.C.; Goetz, M.P.; Olson, J.A.; et al. Adjuvant Chemotherapy Guided by a 21-Gene Expression Assay in Breast Cancer. N. Engl. J. Med. 2018, 379, 111–121. [Google Scholar] [CrossRef] [PubMed]
- Ki, C.S. Recent advances in the clinical application of next-generation sequencing. Pediatr. Gastroenterol. Hepatol. Nutr. 2020, 24, 1–6. [Google Scholar] [CrossRef]
- Deverka, P.A.; Dreyfus, J.C. Clinical integration of next generation sequencing: Coverage and reimbursement challenges. J. Law Med. Ethics 2014, 42, 22–41. [Google Scholar] [CrossRef]
- Szymiczek, A.; Lone, A.; Akbari, M.R. Molecular intrinsic versus clinical subtyping in breast cancer: A comprehensive review. Clin. Genet. 2021, 99, 613–637. [Google Scholar] [CrossRef] [PubMed]
- Lu, Z.; Zhan, X.; Wu, Y.; Cheng, J.; Shao, W.; Ni, D.; Han, Z.; Zhang, J.; Feng, Q.; Huang, K. BrcaSeg: A deep learning approach for tissue quantification and genomic correlations of histopathological images. Genom. Proteom. Bioinform. 2021, 19, 1032–1042. [Google Scholar] [CrossRef] [PubMed]
- Karthiga, R.; Narashimhan, K. Deep Convolutional neural network for computer-aided detection of breast cancer using histopathology images. J. Phys. Conf. Ser. 2021, 1767, 012042. [Google Scholar] [CrossRef]
- Yu, K.; Tan, L.; Lin, L.; Cheng, X.; Yi, Z.; Sato, T. Deep-Learning-Empowered breast cancer auxiliary diagnosis for 5GB remote e-health. IEEE Wirel. Commun. 2021, 28, 54–61. [Google Scholar] [CrossRef]
- Katzman, J.L.; Shaham, U.; Cloninger, A.; Bates, J.; Jiang, T.; Kluger, Y. DeepSurv: Personalized treatment recommender system using a Cox proportional hazards deep neural network. BMC Med. Res. Methodol. 2018, 18, 24. [Google Scholar] [CrossRef]
- Ragab, M.; Albukhari, A.; Alyami, J.; Mansour, R.F. Ensemble deep-learning-enabled clinical decision support system for breast cancer diagnosis and classification on ultrasound images. Biology 2022, 11, 439. [Google Scholar] [CrossRef]
- Qu, H.; Zhou, M.; Yan, Z.; Wang, H.; Rustgi, V.K.; Zhang, S.; Gevaert, O.; Metaxas, D.N. Genetic mutation and biological pathway prediction based on whole slide images in breast carcinoma using deep learning. NPJ Precis. Oncol. 2021, 5, 87. [Google Scholar] [CrossRef]
- Sammut, S.J.; Crispin-Ortuzar, M.; Chin, S.F.; Provenzano, E.; Bardwell, H.A.; Ma, W.; Cope, W.; Dariush, A.; Dawson, S.J.; Abraham, J.E.; et al. Multi-omic machine learning predictor of breast cancer therapy response. Nature 2022, 601, 623–629. [Google Scholar] [CrossRef]
- Binder, A.; Bockmayr, M.; Hägele, M.; Wienert, S.; Heim, D.; Hellweg, K.; Ishii, M.; Stenzinger, A.; Hocke, A.; Denkert, C.; et al. Morphological and molecular breast cancer profiling through explainable machine learning. Nat. Mach. Intell. 2021, 3, 355–366. [Google Scholar] [CrossRef]
- Macenko, M.; Niethammer, M.; Marron, J.S.; Borland, D.; Woosley, J.T.; Guan, X.; Schmitt, C.; Thomas, N.E. A method for normalizing histology slides for quantitative analysis. In Proceedings of the 2009 IEEE International Symposium on Biomedical Imaging: From Nano to Macro, Boston, MA, USA, 28 June–1 July 2009; pp. 1107–1110. [Google Scholar]
- Vahadane, A.; Peng, T.; Sethi, A.; Albarqouni, S.; Wang, L.; Baust, M.; Steiger, K.; Schlitter, A.M.; Esposito, I.; Navab, N. Structure-preserving color normalization and sparse stain separation for histological images. IEEE Trans. Med. Imaging 2016, 35, 1962–1971. [Google Scholar] [CrossRef]
- Sandfort, V.; Yan, K.; Pickhardt, P.J.; Summers, R.M. Data augmentation using generative adversarial networks (CycleGAN) to improve generalizability in CT segmentation tasks. Sci. Rep. 2019, 9, 16884. [Google Scholar] [CrossRef]
- Hong, R.; Liu, W.; DeLair, D.; Razavian, N.; Fenyö, D. Predicting endometrial cancer subtypes and molecular features from histopathology images using multi-resolution deep learning models. Cell Rep. Med. 2021, 2, 100400. [Google Scholar] [CrossRef] [PubMed]
- Bernal, J.; Kushibar, K.; Cabezas, M.; Valverde, S.; Oliver, A.; Llado, X. Quantitative analysis of patch-based fully convolutional neural networks for tissue segmentation on brain magnetic resonance imaging. IEEE Access 2019, 7, 89986–90002. [Google Scholar] [CrossRef]
- Schmauch, B.; Romagnoni, A.; Pronier, E.; Saillard, C.; Maillé, P.; Calderaro, J.; Kamoun, A.; Sefta, M.; Toldo, S.; Zaslavskiy, M.; et al. A deep learning model to predict RNA-Seq expression of tumours from whole slide images. Nat. Commun. 2020, 11, 3877. [Google Scholar] [CrossRef] [PubMed]
- Schrammen, P.L.; Laleh, N.G.; Echle, A.; Truhn, D.; Schulz, V.; Brinker, T.J.; Brenner, H.; Chang-Claude, J.; Alwers, E.; Brobeil, A.; et al. Weakly supervised annotation-free cancer detection and prediction of genotype in routine histopathology. J. Pathol. 2021, 256, 50–60. [Google Scholar] [CrossRef]
- Weitz, P.; Wang, Y.; Kartasalo, K.; Egevad, L.; Lindberg, J.; Grönberg, H.; Eklund, M.; Rantalainen, M. Transcriptome-wide prediction of prostate cancer gene expression from histopathology images using co-expression-based convolutional neural networks. Bioinformatics 2022, 38, 3462–3469. [Google Scholar] [CrossRef]
- Wang, Y.; Kartasalo, K.; Weitz, P.; Acs, B.; Valkonen, M.; Larsson, C.; Ruusuvuori, P.; Hartman, J.; Rantalainen, M. Predicting molecular phenotypes from histopathology images: A transcriptome-wide expression–morphology analysis in breast cancer. Cancer Res. 2021, 81, 5115–5126. [Google Scholar] [CrossRef]
- Hoang, V.T.; Jo, K.H. PydNet: An efficient CNN architecture with pyramid depthwise convolution kernels. In Proceedings of the 2019 International Conference on System Science and Engineering, Dong Hoi, Vietnam, 20–21 July 2019; pp. 154–158. [Google Scholar] [CrossRef]
- Zhang, X.; Zhou, X.; Lin, M.; Sun, J. ShuffleNet: An extremely efficient convolutional neural network for mobile devices. In Proceedings of the IEEE Computer Society Conference on Computer Vision and Pattern Recognition, Salt Lake City, UT, USA, 18–23 June 2018; pp. 6848–6856. [Google Scholar] [CrossRef]
- Tavolara, T.E.; Niazi, M.K.; Gower, A.C.; Ginese, M.; Beamer, G.; Gurcan, M.N. Deep learning predicts gene expression as an intermediate data modality to identify susceptibility patterns in mycobacterium tuberculosis infected diversity outbred mice. eBioMedicine 2021, 67, 103388. [Google Scholar] [CrossRef]
- Hegenbarth, J.C.; Lezzoche, G.; Windt, L.J.D.; Stoll, M. Perspectives on bulk-tissue RNA sequencing and single-cell RNA sequencing for cardiac transcriptomics. Front. Mol. Med. 2022, 2, 839338. [Google Scholar] [CrossRef]
- Millar, E.K.; Browne, L.H.; Beretov, J.; Lee, K.; Lynch, J.; Swarbrick, A.; Graham, P.H. Tumour stroma ratio assessment using digital image analysis predicts survival in triple negative and luminal breast cancer. Cancers 2020, 12, 3749. [Google Scholar] [CrossRef]
- Bankhead, P.; Loughrey, M.B.; Fernández, J.A.; Dombrowski, Y.; McArt, D.G.; Dunne, P.D.; McQuaid, S.; Gray, R.T.; Murray, L.J.; Coleman, H.G.; et al. QuPath: Open source software for digital pathology image analysis. Sci. Rep. 2017, 7, 16878. [Google Scholar] [CrossRef] [PubMed]
- Li, B.; Dewey, C.N. RSEM: Accurate transcript quantification from RNA-Seq data with or without a reference genome. BMC Bioinform. 2011, 12, 323. [Google Scholar] [CrossRef] [PubMed]
- Zwiener, I.; Frisch, B.; Binder, H. Transforming RNA-Seq data to improve the performance of prognostic gene signatures. PLoS ONE 2014, 9, e85150. [Google Scholar] [CrossRef] [PubMed]
- Davidson-Pilon, C.; Kalderstam, J.; Jacobson, N.; sean reed.; Kuhn, B.; Zivich, P.; Williamson, M.; Abdeali, J.K.; Datta, D.; Fiore-Gartland, A.; et al. CamDavidsonPilon/Lifelines: v0.24.15; Zenodo: Geneva, Switzerland, 2020. [Google Scholar] [CrossRef]
- Kather, J.N.; Heij, L.R.; Grabsch, H.I.; Loeffler, C.; Echle, A.; Muti, H.S.; Krause, J.; Niehues, J.M.; Sommer, K.A.; Bankhead, P.; et al. Pan-cancer image-based detection of clinically actionable genetic alterations. Nat. Cancer 2020, 1, 789–799. [Google Scholar] [CrossRef] [PubMed]
- Liu, H.; Xu, W.D.; Shang, Z.H.; Wang, X.D.; Zhou, H.Y.; Ma, K.W.; Zhou, H.; Qi, J.L.; Jiang, J.R.; Tan, L.L.; et al. Breast cancer molecular subtype prediction on pathological images with discriminative patch selection and multi-instance learning. Front. Oncol. 2022, 12, 858453. [Google Scholar] [CrossRef]
- Vieira, A.F.; Schmitt, F. An update on breast cancer multigene prognostic tests-emergent clinical biomarkers. Front. Med. 2018, 5, 248. [Google Scholar] [CrossRef] [PubMed]


| Parameter | Risk Group Cut-off Value | No. of Patients in Each Group | Multivariate (n = 406) | Univariate (n = b406) | ||||
|---|---|---|---|---|---|---|---|---|
| HR | 95% CI | p | HR | 95% CI | p | |||
| Tumour Grade | 1 & 2 vs. 3 | 324 vs. 81 | 0.94 | 0.62–1.42 | 7.6 × 10⁻¹ | 0.92 | 0.31–1.36 | 6.7 × 10⁻¹ |
| Tumour Size | >20 vs. ≤20 (mm) | 297 vs. 108 | 1.57 | 1.11–2.21 | 1 × 10⁻² | 1.56 | 0.77–2.15 | 1 × 10⁻² |
| Age | >55 vs. ≤55 | 139 vs. 266 | 3.04 | 2.02–4.58 | <5 × 10⁻³ | 2.96 | 1.49–4.43 | <5 × 10⁻³ |
| LN status | pos. vs. neg. | 283 vs. 122 | 1.24 | 0.89–1.73 | 2 × 10⁻¹ | 1.43 | 0.67–1.96 | 3 × 10⁻² |
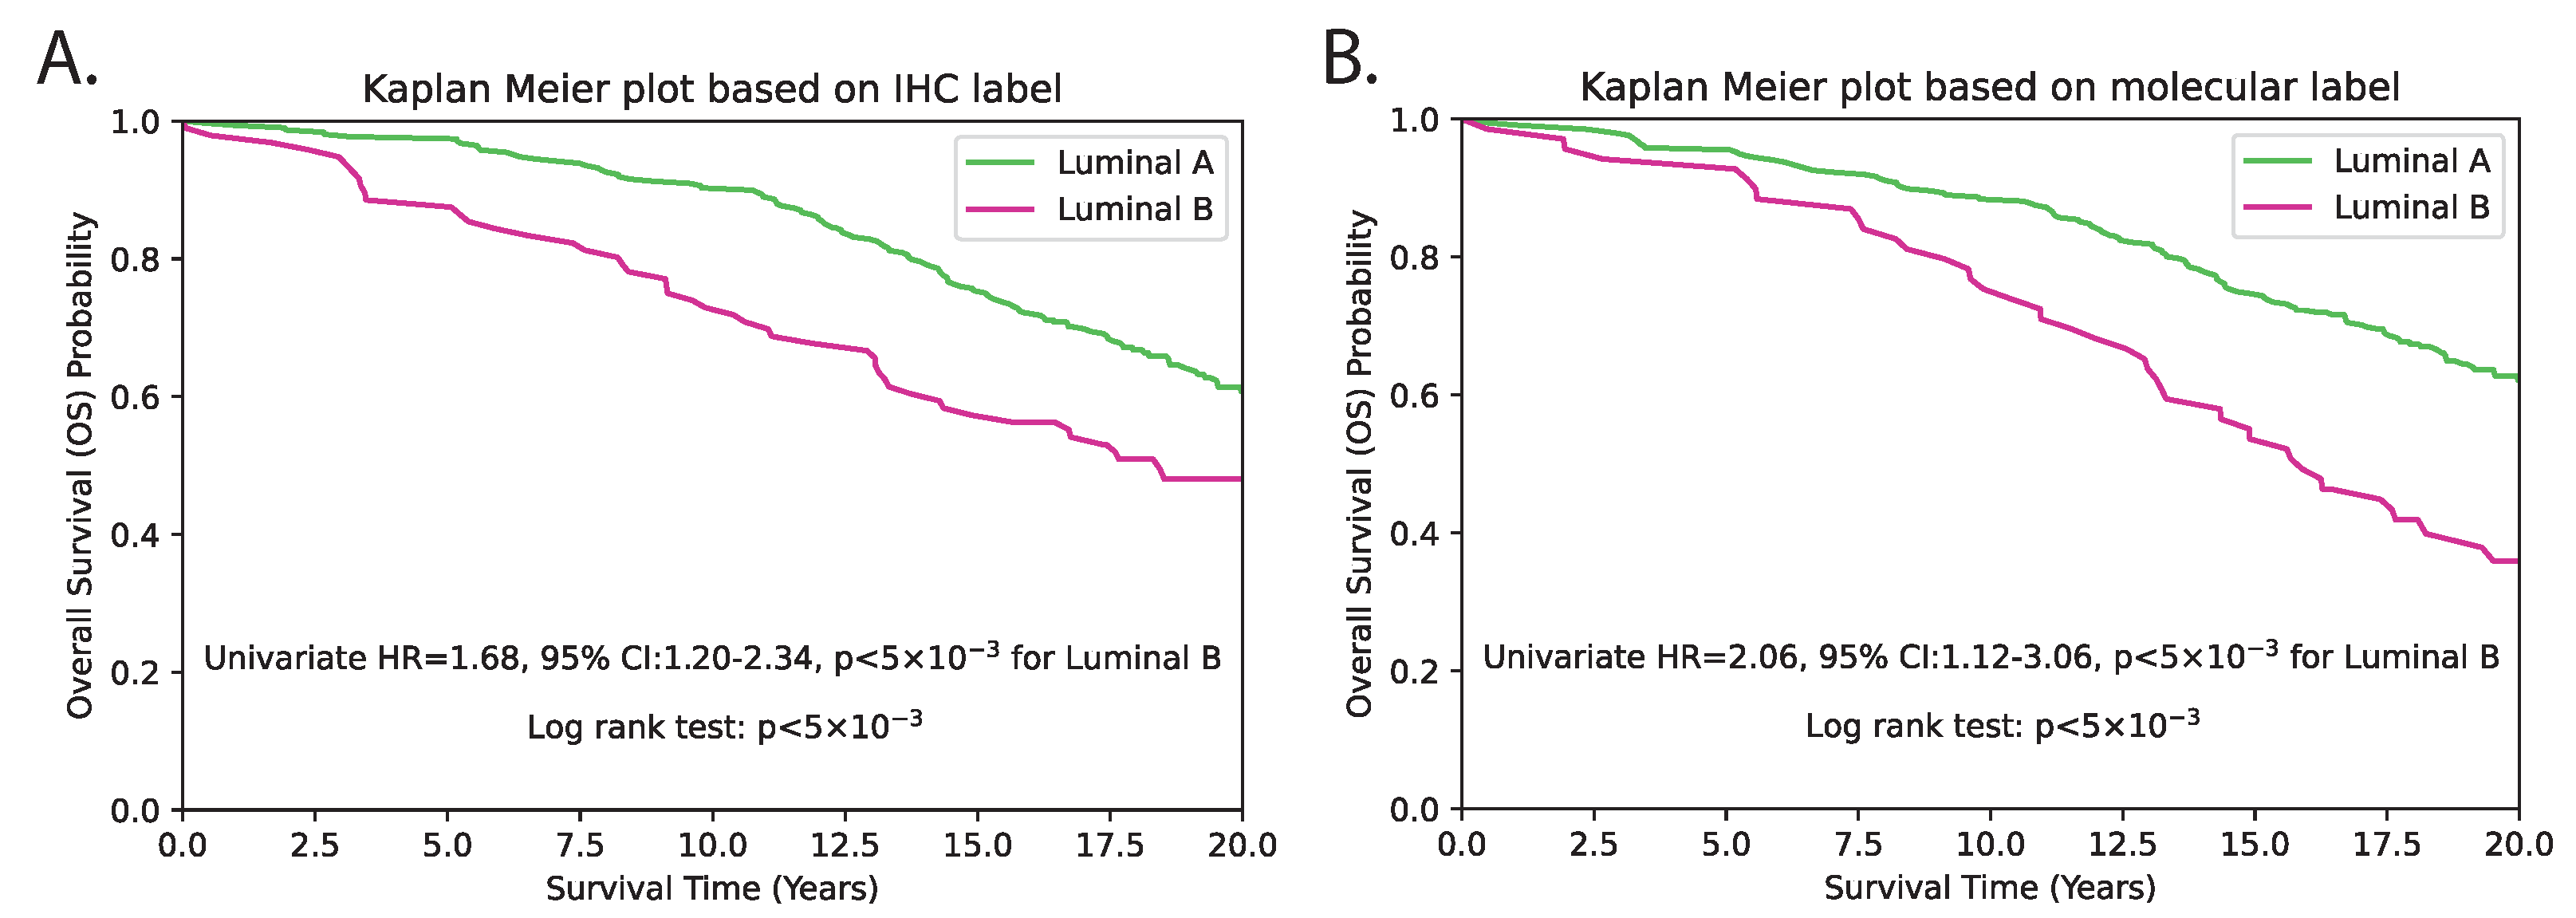
| hist2RNA Predicted | LumB vs. LumA | 69 vs. 336 | 1.87 | 1.30–2.68 | <5 × 10⁻³ | 2.16 | 1.12–3.06 | <5 × 10⁻³ |
| Parameter | Risk Group Cut-off Value | No. of Patients in Each Group | Multivariate (n = 406) | Univariate (n = 406) | ||||
|---|---|---|---|---|---|---|---|---|
| HR | 95% CI | p | HR | 95% CI | p | |||
| Tumour Grade | 1 & 2 vs. 3 | 324 vs. 81 | 0.72 | 0.45–1.13 | 1.5 × 10⁻¹ | 0.92 | 0.31–1.36 | 6.7 × 10⁻¹ |
| Tumour Size | >20 vs. ≤20 (mm) | 297 vs. 108 | 1.63 | 1.16–2.30 | <5 × 10⁻³ | 1.56 | 0.77–2.15 | 1 × 10⁻² |
| Age | >55 vs. ≤55 | 139 vs. 266 | 3.21 | 2.13–4.83 | <5 × 10⁻³ | 2.96 | 1.49–4.43 | <5 × 10⁻³ |
| LN status | pos. vs. neg. | 283 vs. 122 | 1.27 | 0.91–1.77 | 2 × 10⁻¹ | 1.43 | 0.67–1.96 | 3 × 10⁻² |
| IHC Subtype | LumB vs. LumA | 96 vs. 309 | 2.07 | 1.42–3.02 | <5 × 10⁻³ | 1.68 | 1.20–2.34 | <5 × 10⁻³ |
Disclaimer/Publisher’s Note: The statements, opinions and data contained in all publications are solely those of the individual author(s) and contributor(s) and not of MDPI and/or the editor(s). MDPI and/or the editor(s) disclaim responsibility for any injury to people or property resulting from any ideas, methods, instructions or products referred to in the content. |
© 2023 by the authors. Licensee MDPI, Basel, Switzerland. This article is an open access article distributed under the terms and conditions of the Creative Commons Attribution (CC BY) license (https://creativecommons.org/licenses/by/4.0/).
Share and Cite
Mondol, R.K.; Millar, E.K.A.; Graham, P.H.; Browne, L.; Sowmya, A.; Meijering, E. hist2RNA: An Efficient Deep Learning Architecture to Predict Gene Expression from Breast Cancer Histopathology Images. Cancers 2023, 15, 2569. https://doi.org/10.3390/cancers15092569
Mondol RK, Millar EKA, Graham PH, Browne L, Sowmya A, Meijering E. hist2RNA: An Efficient Deep Learning Architecture to Predict Gene Expression from Breast Cancer Histopathology Images. Cancers. 2023; 15(9):2569. https://doi.org/10.3390/cancers15092569
Chicago/Turabian StyleMondol, Raktim Kumar, Ewan K. A. Millar, Peter H. Graham, Lois Browne, Arcot Sowmya, and Erik Meijering. 2023. "hist2RNA: An Efficient Deep Learning Architecture to Predict Gene Expression from Breast Cancer Histopathology Images" Cancers 15, no. 9: 2569. https://doi.org/10.3390/cancers15092569
APA StyleMondol, R. K., Millar, E. K. A., Graham, P. H., Browne, L., Sowmya, A., & Meijering, E. (2023). hist2RNA: An Efficient Deep Learning Architecture to Predict Gene Expression from Breast Cancer Histopathology Images. Cancers, 15(9), 2569. https://doi.org/10.3390/cancers15092569