Article

Small and Large Extracellular Vesicles Derived from Pleural Mesothelioma Cell Lines Offer Biomarker Potential

1
School of Medical Sciences, The University of Sydney, Camperdown, NSW 2006, Australia
2
School of Biotechnology and Biomolecular Sciences, Faculty of Science, University of New South Wales, Sydney, NSW 2052, Australia
3
UNSW Data Science Hub, University of New South Wales, Sydney, NSW 2052, Australia
4
Westmead Clinical School, Faculty of Medicine and Health, The University of Sydney, Westmead, NSW 2145, Australia
5
Centre for Cancer Research, The Westmead Institute for Medical Research, The University of Sydney, Westmead, NSW 2145, Australia
6
Department of Dermatology, Westmead Hospital, Westmead, NSW 2145, Australia
7
Department of Pathology, University of Otago, Dunedin 9016, New Zealand
8
Department of Medical Oncology, Royal North Shore Hospital, Sydney, NSW 2065, Australia
9
Department of Medical Oncology, Chris O’Brien Lifehouse, Sydney, NSW 2050, Australia
10
Asbestos Diseases Research Institute, Sydney, NSW 2139, Australia
11
The Sydney Nano Institute, The University of Sydney, Camperdown, NSW 2006, Australia
*
Authors to whom correspondence should be addressed.
Cancers 2023, 15(8), 2364; https://doi.org/10.3390/cancers15082364
Submission received: 2 February 2023 / Revised: 21 March 2023 / Accepted: 27 March 2023 / Published: 18 April 2023
(This article belongs to the Special Issue Decoding Cancer Signals Using Liquid Biopsy)

Abstract

:

Simple Summary

Pleural mesothelioma, a fatal thoracic cancer with one of the poorest survival rates of any cancer, is in urgent clinical need for biomarkers to aid early diagnosis, improve prognostication, and treatment options. Extracellular vesicles (EVs) have great potential as tumour biomarkers, however there are limited studies so far on their role in mesothelioma. We aimed to characterize different classes of EV derived from different mesothelioma cell lines. We provided a comprehensive proteomic database of cancer associated proteins in EVs that can offer new targets for future biomarker studies in pleural mesothelioma. We have also demonstrated that different subtypes of EVs can be isolated, namely 10 K, 18 K, and 100 K, each carrying oncogenic cargo with biomarker potential for pleural mesothelioma. Major differences were found in the cargo between the three EV subtypes, which can help narrow the molecular targets for diagnostic, prognostic, and predictive biomarker studies.

Abstract

Pleural mesothelioma, previously known as malignant pleural mesothelioma, is an aggressive and fatal cancer of the pleura, with one of the poorest survival rates. Pleural mesothelioma is in urgent clinical need for biomarkers to aid early diagnosis, improve prognostication, and stratify patients for treatment. Extracellular vesicles (EVs) have great potential as biomarkers; however, there are limited studies to date on their role in pleural mesothelioma. We conducted a comprehensive proteomic analysis on different EV populations derived from five pleural mesothelioma cell lines and an immortalized control cell line. We characterized three subtypes of EVs (10 K, 18 K, and 100 K), and identified a total of 4054 unique proteins. Major differences were found in the cargo between the three EV subtypes. We show that 10 K EVs were enriched in mitochondrial components and metabolic processes, while 18 K and 100 K EVs were enriched in endoplasmic reticulum stress. We found 46 new cancer-associated proteins for pleural mesothelioma, and the presence of mesothelin and PD-L1/PD-L2 enriched in 100 K and 10 K EV, respectively. We demonstrate that different EV populations derived from pleural mesothelioma cells have unique cancer-specific proteomes and carry oncogenic cargo, which could offer a novel means to extract biomarkers of interest for pleural mesothelioma from liquid biopsies.

1. Introduction

Pleural mesothelioma, previously known as malignant pleural mesothelioma or MPM, is a rare but fatal cancer that forms on the thin membrane that lines the lungs and thoracic cavity [1]. It continues to have one of the poorest survival rates of any cancer, with a median survival of typically less than a year after diagnosis for untreated patients [1,2] or 16 to 18 months for patients receiving treatment [3,4], and a five-year survival rate of around 7% [5]. The primary cause of pleural mesothelioma is exposure to asbestos fibres, a group of naturally occurring fibrous minerals with excellent physical and electrochemical insulating properties and a long history of industrial applications [5,6]. Despite a progressive ban on asbestos production and usage in over 50 countries worldwide since the 1980s, the incidence of pleural mesothelioma continues to rise due to the long latency period (20 to 50 years) between asbestos exposure and the development of the tumor [5,6,7]. As a result, pleural mesothelioma is common in the elderly population and in males with a history of occupational exposure to asbestos [5].
The diagnosis of pleural mesothelioma can be a complex process requiring multiple techniques, such as invasive tissue biopsy, cytological examination of the pleural fluid, and thoracoscopy, accompanied by immunohistochemistry staining on a wide panel of markers to differentiate pleural mesothelioma from other tumors [8]. Consequently, pleural mesothelioma is often diagnosed at an advanced stage and has a poor prognosis. Currently, the performance status and histological subtype are the only factors used as prognostic indicators [9,10], with three histologic subtypes validated in clinical practice. Epithelioid is the most common subtype of pleural mesothelioma, constituting up to two-thirds of cases, with a survival of 19 months [2,11]; sarcomatoid is the least common subtype with the worst survival of 4 to 6 months [11], and biphasic is a mixture of epithelioid and sarcomatoid subtypes, with the survival dependent on the ratio of epithelioid and sarcomatoid cells present in the tumor [11].
Until 2020, the treatment for pleural mesothelioma was limited to systemic combination chemotherapy, typically platinum or cisplatin and pemetrexed with or without bevacizumab, with only modest improvements in survival [9,10,12]. In recent years, immunotherapy using immune checkpoint inhibitors has transformed the treatment landscape of pleural mesothelioma. In October 2020, the US Food and Drug Administration approved the combination immunotherapy drugs, nivolumab (anti-programmed death-1 antibody) plus ipilimumab (anti-cytotoxic T-lymphocyte antigen-4 antibody), as first-line treatment for patients with unresectable pleural mesothelioma. This came following the results of the CHECKMATE-743 trial, which showed a median overall survival of 18.1 months for patients who received combination immunotherapy versus 14.1 months for patients who received chemotherapy [4]. A recent study with a minimum of three years of follow-up further showed that nivolumab plus ipilimumab continued to provide long-term survival benefit over chemotherapy, regardless of histology [13], indicating that immunotherapy is the new treatment modality for pleural mesothelioma. Nevertheless, not all patients benefit from immunotherapy, and although significant progress has been made for the treatment of pleural mesothelioma, there remains an urgent need for biomarkers and molecular targets that could help with early diagnosis, improve prognostication, help stratify patients to targeted treatments, and help select patients who might benefit from immunotherapy. There is also an important clinical need for non-invasive or minimally invasive techniques for detecting biomarkers without using invasive tissue biopsies.
During the formation and growth of the tumor, various components may be released into the body fluids due to apoptosis, necrosis, or active release of particles [14]. These include circulating tumor cells, circulating tumor DNA, circulating tumor RNA, and extracellular vesicles (EVs) [14]. These offer a means to identify biomarkers from liquid biopsies. EVs have demonstrated enormous potential as biomarkers for cancer, including for pleural mesothelioma. EVs are membrane-contained particles secreted by malignant and non-malignant cells to transport biological information from one cell to another and mediate intercellular communication [15,16,17,18]. Their cargo composition consists of different classes of proteins, lipids, and genetic material including DNA, RNA, mRNA, and miRNA [15,16,17,18]. EVs reported in the literature are typically classified according to their size and biogenesis; however, there is substantial overlap. Although there is currently no standardized nomenclature for different EV populations, the most common EV subtypes reported in the literature include small EVs (50–150 nm) [19], commonly called exosomes, formed from the endosomal biogenesis pathways and typically isolated using a centrifugal force ranging from 100,000× g to 200,000× g; larger-sized EVs (50–1000 nm), previously termed microparticles and later changed to microvesicles, formed by blebbing from the plasma membrane and typically isolated using a centrifugal force of 18,000× g; and apoptotic bodies (1–4 µm), which are shed from dying cells and are typically isolated using a centrifugal force of 2000–3000× g [15,19,20]. Recently, EVs containing oncogenic cargo have been characterized, named oncosomes (100–400 nm) and large oncosomes (1–10 µm), which are thought to be shed exclusively from cancer cells [21]. These so-called large oncosomes have been isolated using a centrifugal force of 10,000× g [15,20,21].
EVs circulate freely in almost all body fluids, including blood, urine, milk, and saliva [19], making them an ideal candidate for non-invasive or minimally invasive biopsies. Furthermore, EVs are encapsulated by a phospholipid membrane, which protects their contents from degradation, making them highly stable in body fluids [22]. Growing evidence suggests that the behavior and functional roles of EVs are specific, not random, which can help reveal the tumor-specific immune suppression mechanisms for individual patients [15,16,17,18]. These qualities make EVs ideal biomarker candidates for pleural mesothelioma over tissue-based biomarkers, due to the invasiveness of tissue biopsies, the difficulty in capturing the tumor heterogeneity of pleural mesothelioma and its subtypes from only a section of the tumor tissue, and the limited access to tissue samples from mostly elderly patients who are typically already at an advanced stage of disease and are usually poor candidates for surgery [14]. EVs have a major advantage of being available in body fluids, offering a novel pathway to perform liquid biopsies for pleural mesothelioma.
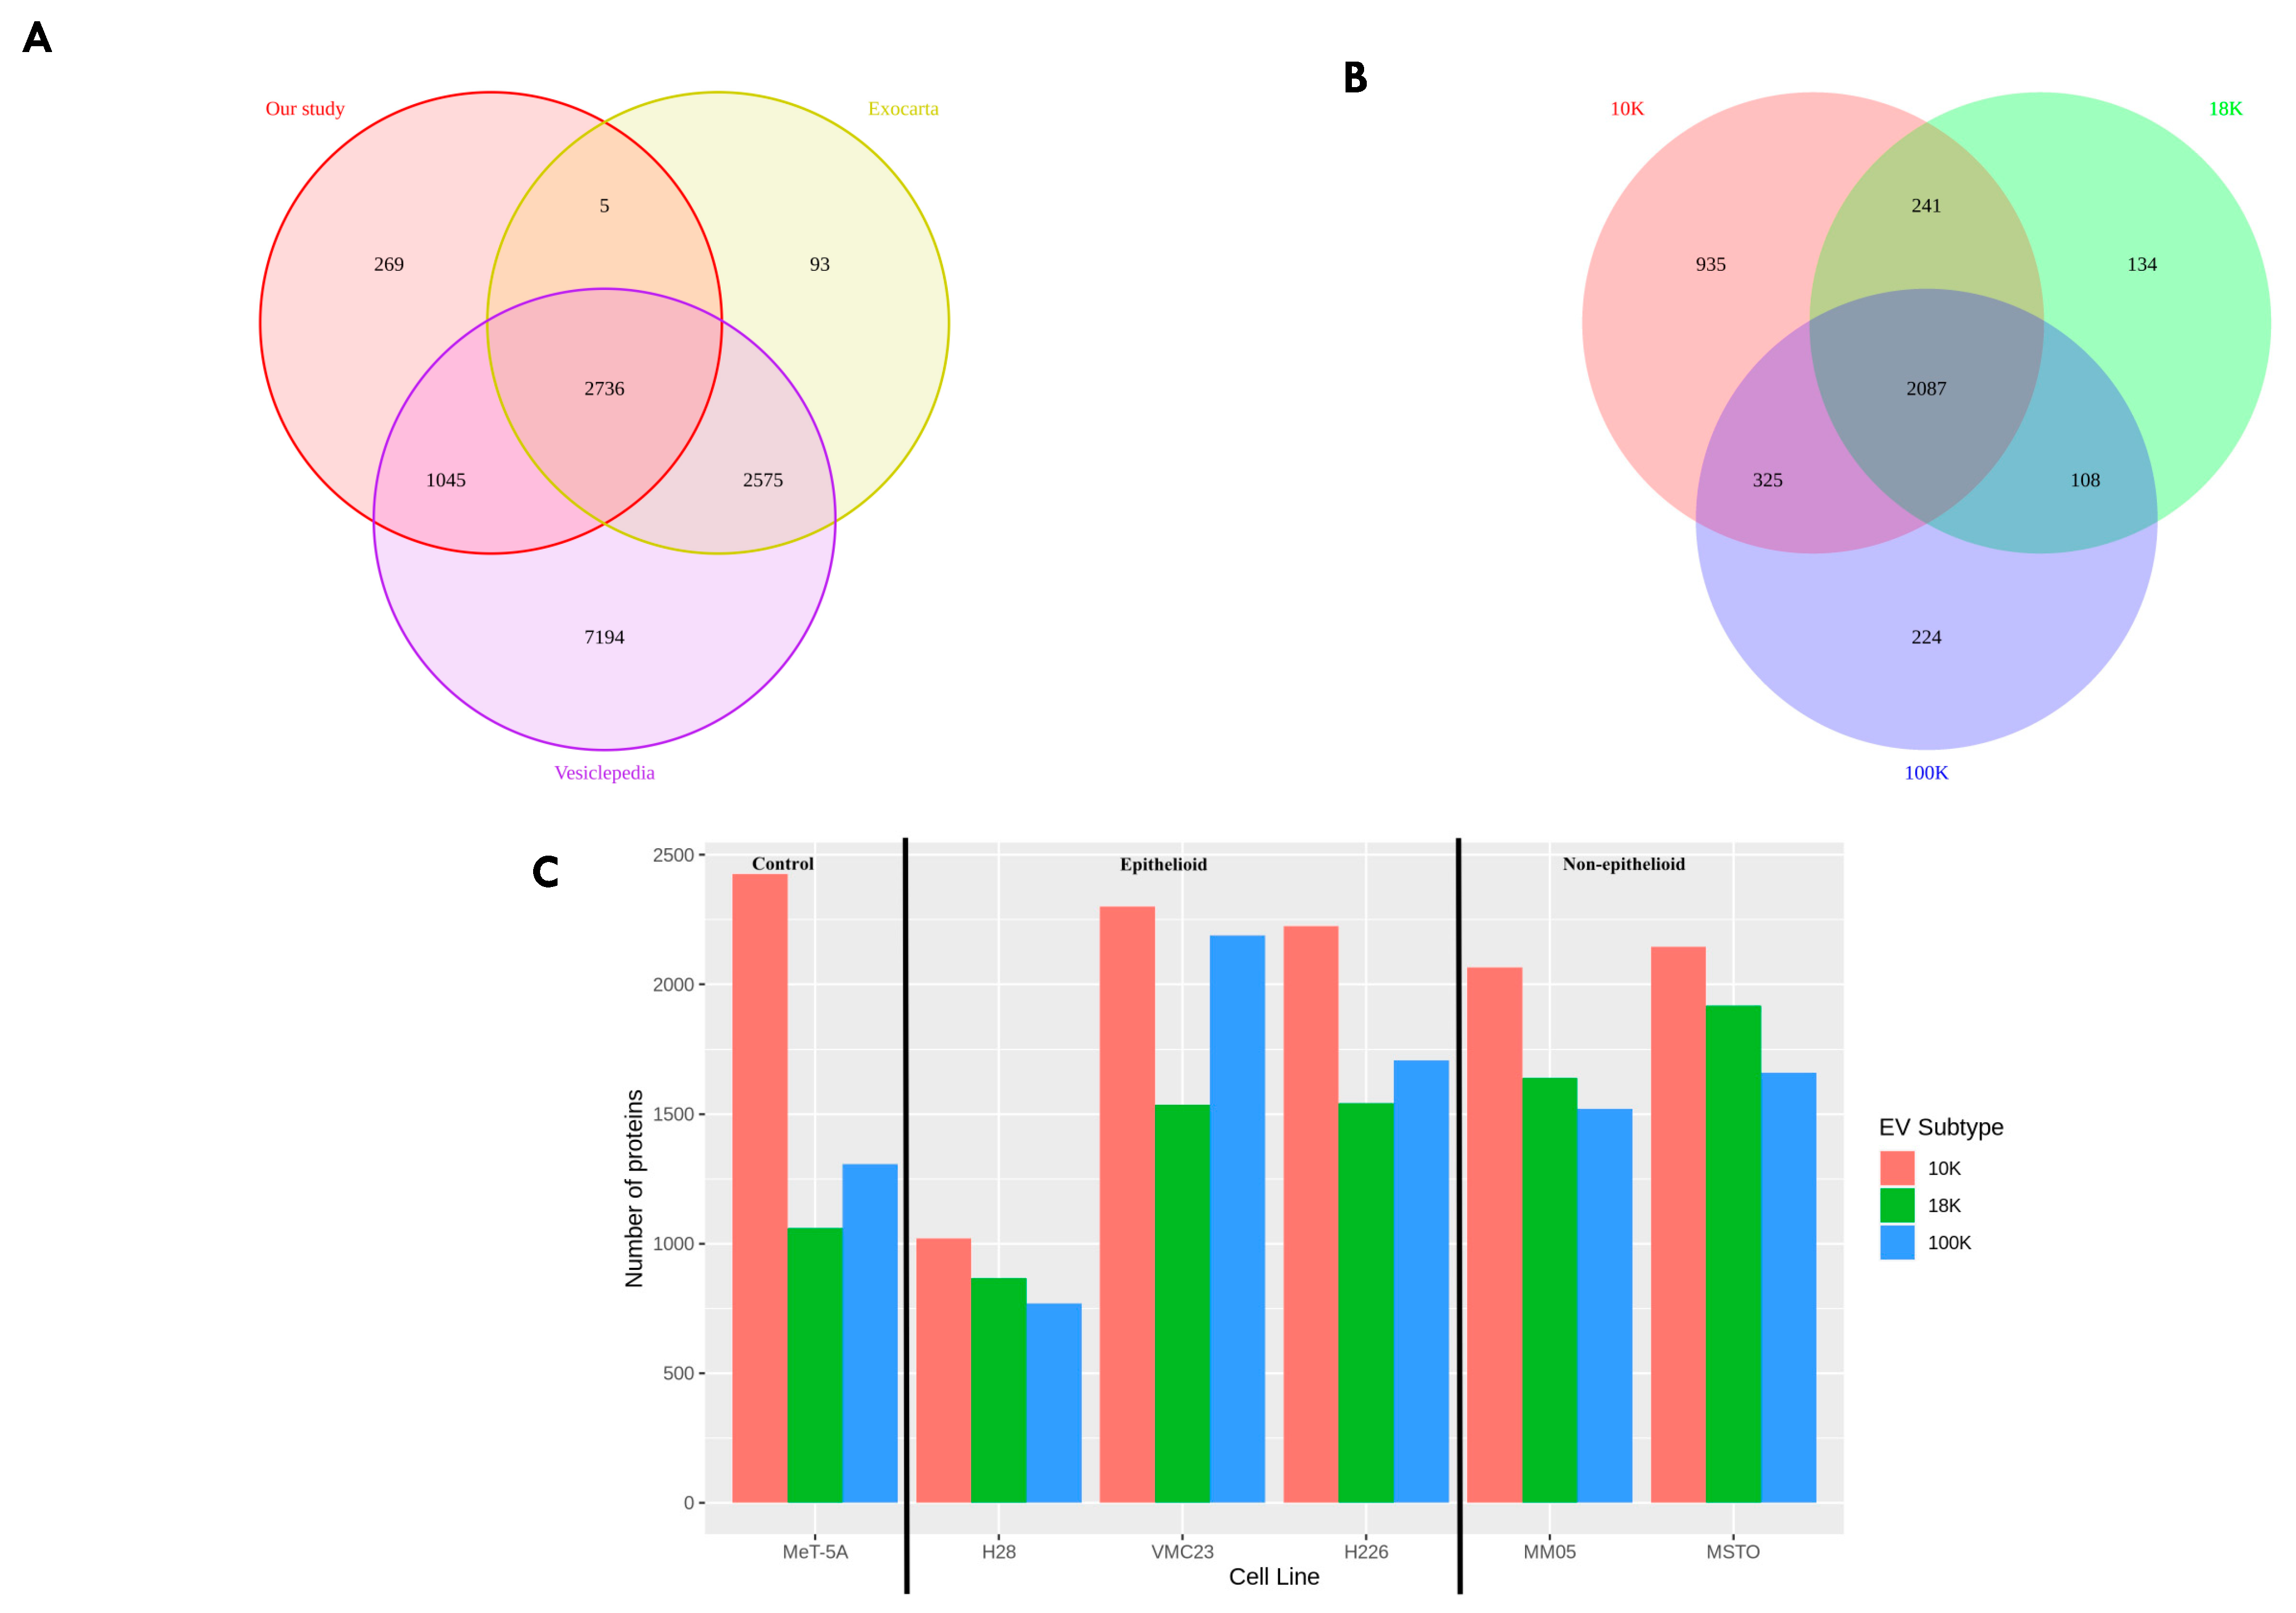
Our study had two main objectives. Firstly, we aimed to characterize and distinguish the proteomes of three subtypes of EVs derived from pleural mesothelioma cell lines using different centrifugal forces: large-sized EVs isolated at 10,000× g (10 K) and at 18,000× g (18 K), and then small-sized EVs isolated at 100,000× g (100 K). Secondly, we aimed to identify unique cancer-specific proteins that are contained within the different EV subtypes derived from pleural mesothelioma cell lines, which could offer a novel means to extract specific biomarkers of interest from liquid biopsies. To our knowledge, this is the first study that distinguishes three subtypes of EVs, and the first to characterize larger-sized EVs in pleural mesothelioma.

2. Materials and Methods

2.1. Cell Culture

Five mesothelioma cell lines and an immortalized human mesothelial cell line (Table 1) were cultured in growth medium consisting of Roswell Park Memorial Institute (RPMI) 1640 with L-glutamine and sodium bicarbonate (R8758; Sigma–Aldrich, St. Louis, MO, USA), supplemented with 10% fetal bovine serum (FBS) (F9423; Sigma–Aldrich, MO, USA). Cells were grown at 37 °C in a humidified atmosphere of 5% CO2. Cell viability was assessed using trypan blue exclusion methods (T8154; Sigma–Aldrich, MO, USA). Cell viability and cell counts were obtained using an automated cell counter (Countess II, Thermo Fisher Scientific, Waltham, MA, USA).

2.2. EV Isolation

Each cell line was initially grown to 80% confluence in T25 flasks, and then passaged to a T75 flask. When cells reached 80% confluence in the T75 flask, each cell line was passaged to eleven T75 flasks, where ten flasks were maintained for EV isolation and one T75 flask was maintained to repeat another round of EV isolation. Once the cells reached 70% confluence, they were starved of FBS and kept in RPMI 1640 alone for 72 h. The conditioned media from all ten flasks were pooled in 50 mL centrifuge tubes and centrifuged at 2000× g for 10 min (4 °C) to remove protein aggregates and cell debris. The cleared medium was then concentrated using 100 KDa MWCO Amicon® Ultra-15 Centrifugal Filter Units (UFC910096, Millipore, Billerica, MA, USA), by repeatedly performing centrifugation at 2000× g for 5 min at 4 °C until 2 mL of sample remained above the filter. The concentrated 2 mL samples were transferred to Eppendorf tubes and centrifuged at 10,000× g for 45 min at 4 °C to obtain our 10 K EV sample. The supernatant was transferred to new Eppendorf tubes. The new sample tubes were centrifuged at 18,000× g for 45 min at 4 °C to obtain our 18 K EV sample. The supernatant was then transferred to ultracentrifuge tubes. In the ultracentrifuge tubes, 200 µL of 30% sucrose-deuterium oxide (D2O) was deposited at the bottom of the tubes. The samples were centrifuged at 100,000× g for 60 min at 4 °C (Hitachi CP100NX ultracentrifuge, P50A3 rotor) to obtain our 100 K EV sample. Finally, the supernatant was removed, and the 100 K pellets were resuspended in the sucrose cushion. All pellets and supernatants were retained and stored at −80 °C. In total, four rounds of EV isolation were completed for each cell line to produce four biological replicates. In each round of EV isolation, two technical replicates were produced.

2.3. Protein Quantification

Protein lysates of cells and EVs were prepared via lysis in radioimmunoprecipitation assay (RIPA) buffer (89900; Thermo Fisher Scientific) and protease inhibitors (11836153001; cOmplete™, Mini Protease Inhibitor Cocktail, Roche Diagnostics, Mannheim, Germany). Protein concentrations were determined using the Pierce Bicinchoninic Acid (BCA) Protein Assay Kit (Thermo Fisher Waltham, MA, USA) according to the manufacturer’s instructions. Absorbance was measured at 562 nm using a spectrophotometer. Protein concentration was interpolated based on the constructed standard curves.

2.4. Nanoparticle Tracking Analysis

Nanoparticle tracking analysis (NTA) was performed using the NanoSight LM10 instrument (Malvern, Analytical), with the green laser (532 nm) to measure the number of particles and the particle size distribution of EV samples. The instrument temperature was set to 25 °C, the camera level was set to 11 and the detection threshold set to 2; however, the camera was manually focused where needed to optimize particle definition. Samples were diluted 1 in 500 with filtered and double distilled water (DDH2O) to a volume of 1 mL to maintain a concentration below 5 × 10⁹ particles/mL. For the first reading, an initial volume of 0.5 mL of the sample was injected into the sample viewing unit using a syringe. For the subsequent readings, samples were injected in 0.1 mL increments. Videos were captured in 5 repetitive cycles, with each cycle analyzing 0.1 mL of injected sample. The sample viewing unit was washed three times in between samples with DDH2O followed by 80% v/v ethanol. The movement of particles due to Brownian motion was recorded every 60 s at 30 frames per second. All NTA experiments were performed at room temperature.

2.5. Flow Cytometry

EV samples (10 K and 18 K only) were stained using the Annexin V-FITC kit (IM3614, Beckman Coulter, Brea, CA, USA) according to the manufacturer’s instructions. Briefly, in a 96-well plate with a round bottom, 20 µL of the EV sample was incubated with 1 µL of Annexin V and 2 µL of 10× concentrated binding buffer for 20 min in the dark. Samples were then suspended in 180 µL of 1× binding buffer solution, prepared with sterile water, to a final sample volume of 200 μL. Samples were transferred to flow tubes and the fluorescent signals were measured on the Gallios™ Flow Cytometer (Beckman Coulter, CA, US) using the 488 nm blue laser. Samples were measured over 120 s at a medium flow rate (37 μL/min). We used the protocol previously described by our group to define the gates and the different particle sizes for small and large EVs [23]. Data were analyzed using Kaluza software (v1.2; Beckman Coulter, Lane Cove, NSW, Australia).

2.6. Western Blotting

Protein samples were denatured by adding 2 × concentrate Laemmli sample buffer with 10% β -mercaptoethanol (S3401, Merck KGaA, Darmstadt, Germany) and heating to 95 °C for 5 min. Equal amounts of proteins (50 μg) were loaded and electrophoresed on 10% SDS-PAGE gels at 110 V for 90 min using Mini-Protean® Tetra cells (Bio-Rad Laboratories, Hercules, CA, USA) filled with Tris/Glycine/SDS running buffer containing 25 mM Tris-HCl, 192 mM glycine, and 0.1% SDS (1610772, Bio-Rad Laboratories, Hercules, CA, USA). The electrophoresed proteins were transferred onto a nitrocellulose membrane (0.45 μm) at 110 V for 105 min using a transfer buffer consisting of Tris/Glycine buffer with 25 mM Tris and 192 mM glycine (1610771, Bio-Rad Laboratories, Hercules, CA, USA) and 20% methanol. Membranes were blocked in a blocking buffer containing 5% w/v non-fat dry milk in Tris buffer saline (TBS) plus tween 20 (TBST) (10 mM Tris; 100 mM NaCl; 0.1% Tween 20), for 1 h at room temperature on an orbital shaker. The membranes were incubated with a primary antibody (Table 2) in TBST overnight at 4 °C on an orbital shaker. Then, membranes were washed three times with TBST for 5 min each and incubated with a HRP-conjugated secondary antibody (Cell Signaling Technology, Danvers, MA, USA, 1:5000) for 1 h at room temperature. The immunoreactive blots were visualized using the Clarity Western ECL Substrate (1705060, Bio-Rad Laboratories, Hercules, CA, USA), and then imaged using the ChemiDoc Imaging System (Bio-Rad Laboratories, Hercules, CA, USA).

2.7. Transmission Electron Microscopy (TEM)

Representative samples from large and small EVs were used for imaging using TEM. Samples were adsorbed onto carbon copper 200 mesh grids (GSCU200C-50; 5 uL/grid, Proscitech, Thuringowa, QLD, Australia) and incubated in the dark for 1 min. Samples were then washed with water and then negatively stained with 2% Uranyl Acetate for 3 min at room temperature. Grids were air dried and TEM images were collected with the JOEL 1400 transmission electron microscope (JOEL, Tokyo, Japan) at 120 kV.

2.8. Mass Spectrometry (LC-MS/MS)

EVs were lysed in 6 M urea, 2 M thiourea, 100 mM HEPES buffer, pH 7.5 and then sonicated on ice for 10 min. Proteins (50 μg) for each sample were reduced with 10 mM DL-Dithiothreitol (DTT) for 30 min at room temperature. They were then alkylated with 25 mM iodoacetamide for 30 min at room temperature in the dark, and then quenched with DTT to a final concentration of 20 mM. Samples were diluted with 100 mM HEPES, and then digested with 1 μg of trypsin (Promega Sequencing Grade) overnight at 30 °C. Samples were then acidified with 1% trifluoroacetic acid (TFA) and desalted on HLB columns, Oasis 10 mg extraction cartridges (Waters™, Milford, MA, USA). Peptide separation was achieved by eluting with 50% acetonitrile (ACN) plus 0.1% TFA. Columns were washed three times with 5% ACN plus 0.1% TFA before and after loading the samples. Samples were analyzed on a Q Exactive HFX3 Mass Spectrometer (Thermo Fisher Scientific).

2.9. Proteomic Data Analysis

Raw data were processed using Proteome Discoverer (v2.2, Thermo Fisher Scientific, Waltham, MA, USA). The MS/MS spectra were searched using Mascot (Matrix Science, London, UK; version 2.4.0) against the UniProt human and contaminants databases (Human, May 2020; Contaminants, November 2018). The following parameters were applied: trypsin digestion, with up to two missed cleavages; variable modifications to carbamidomethyl (C), protein N-terminal acetylation, deamidation (NQ), and oxidation (M); precursor mass tolerance of 10 ppm; MS/MS tolerance of 0.05 Da, and minimum peptide length of 6. Spectral matches were validated using Percolator based on q-values with a maximum delta CN of 0.05 and false discovery rate (FDR) of 1%. Proteins were quantified using label-free quantification and grouped according to a strict parsimony principle. All data for proteomic analysis were retrieved using Proteome Discoverer software version 2.4.1.15 (Thermo Fisher Scientific, Bremen, Germany).

2.10. Statistical Analysis

Statistical analysis for NTA and flow cytometry was performed using GraphPad Prism 5.0 Software (GraphPad Software Inc., San Diego, CA, USA). Pooled data were used, and Mann-Whitney U tests were conducted for each comparative set of unpaired data. Effects were considered significant when p value was ≤0.05 (* p ≤ 0.05, ** p ≤ 0.01, *** p ≤ 0.001 and **** p ≤ 0.0001).
Statistical analysis for proteomics was conducted in R. Proteins with missing values in less than 75% of the replicates were retained. The remaining missing values were imputed using the missForest algorithm [24]. Non-human proteins and contaminant proteins were discarded. FilterByExpr from edgeR package in R was used to filter low abundance proteins. The resultant data were quantile normalized. For each sample, technical replicates were averaged; when the difference between protein abundances across technical replicates was >90% quantile across all proteins, the minimum abundance between the two technical replicates was used in lieu of averaging. The differential expression analysis was conducted via limma-voom [25] R package, and p-values were adjusted for multiple hypotheses testing using the Benjamini-Hochberg correction; the (s)adjusted p-value < 0.05 was considered to be significant. The UMAP (Uniform Manifold Approximation and Projection) algorithm was used for non-linear dimension reduction to produce 2-dimensional embeddings of each sample and generate 2D scatter plots to visualize how separable the classes under consideration are (e.g., EV subtypes). All the visualizations and analyses mentioned above were conducted in R. The visualizations were primarily created using ggplot and ComplexHeatmap [26,27]. Functional enrichment analysis for biological processes and cellular components was performed on the Proteome Discoverer software using the false discovery rate adjusted p value < 0.05. To better understand how changes in the proteome may affect mesothelium’s pathophysiology, we employed Ingenuity Pathway Analysis (IPA) bioinformatics tool (Ingenuity Systems, USA; version 23.0; release date: 17 January 2023; http://analysis.ingenuity.com) to retrieve information about cancer-related molecular pathways and biological functions predicted to be activated or inhibited by proteins significantly changed in the EV subtypes.

3. Results

3.1. Morphological Characteristics of Pleural Mesothelioma Cell Lines

Five pleural mesothelioma cell lines and one immortalized cell line were included in this study, as shown in Table 1. Figure 1A shows the morphology of the cell lines under the IncuCyte® live-cell imaging equipment. Cells were grown in culture as a monolayer of adherent cells and exhibited varying cell morphologies. MeT-5A, H226, and MSTO displayed epithelial-like cell morphology with regular shaped and uniform cuboidal or ‘cobble-stone’ configuration, whereas H28, VMC23, and MM05 displayed fibroblast-like cell morphology. Cells derived from the same histological subtype of pleural mesothelioma did not show similar morphologies in culture. The percentage and number of live cells were counted on the day of EV isolation from three representative flasks. On average, each cell line had at least 80% viability on the day of EV isolation (Figure 1B), with more than 2 million live cells on average in each T75 flask (Figure 1C).

3.2. Characterization of 10 K, 18 K, and 100 K EVs

Figure 2A shows a schematic of the protocol used to isolate the three types of EVs in this study. EVs from pooled conditioned medium were isolated as described in Figure 2A to obtain 10 K, 18 K, and 100 K EV pellets. NTA profiles show that, overall, mesothelioma cell lines produced more EVs compared to the control cell line, MeT-5A (Figure 2B–D). There is also a consistent trend in the hierarchy of high to low EV production by mesothelioma cell lines: MM05 released the highest number of particles across 10 K, 18 K, and 100 K pellets, despite having the lowest cell count prior to EV isolation (Figure 1C), followed by VMC23, H226, and MSTO. H28 produced the lowest number of particles across all EV types and was comparable to the control cell line, MeT-5A, in terms of the number of particles released. The highest concentration of particles captured by NTA was in the size range of 100 to 300 nm across all EV types. On close inspection of the larger size range of the scale (500 nm–1 µm), 10 K EV pellets produced a relatively higher concentration of large-size particles (Figure 2B), 18 K EV pellets produced a relatively lower concentration of large-sized particles (Figure 2C), whereas 100 K EV pellets had the lowest concentration of large-sized particles (Figure 2D). The pooled average size of particles in each EV pellet was calculated (Figure 2E), showing 10 K EVs having a significantly higher average particle size compared to 18 K (p = 0.002) and 100 K (p = 0.002). Moreover, 18 K EV samples had a significantly higher average particle size compared to 100 K (p = 0.02). Overall, although each pellet contained particles of all sizes, as small as <100 nm and as large as 1 µm, the larger-sized particles (from 305 nm to 1 µm) consisted of mostly 10 K EVs, medium-sized particles (105–300 nm) consisted of mostly 18 K EVs, and small-sized particles ( 100 nm) consisted of mostly 100 K EVs (Figure 2F).
Representative EV samples were imaged using TEM (Figure 2G), showing the characteristic “cup-shaped” vesicles as a result of dehydration during sample preparation. It is apparent that large EV samples (10 K) contain a much higher concentration of EV population compared to the small EV samples (100 K). Furthermore, EVs contained in the 10 K pellets contain smaller-sized vesicles, consistent with our NTA results.
Figure 3 shows the forward scatter and side scatter cytograms, as well as the gating strategy employed in flow cytometry. All 18 K and 10 K pellets expressed phosphatidylserine (PS) to varying degrees. In the 18 K EVs, MM05 displayed the highest number of Annexin V+ events (Figure 3C), consistent with the NTA results (Figure 2C). MM05 also displayed a concentrated cluster of Annexin V+ events in the large EV gate relative to the other cell lines. All 18 K pellets displayed a higher expression of PS in the smaller-sized gate (350–700 nm) relative to the larger-sized gate (700–1000 nm), indicating a lack of large EVs in the 18 K pellet (Figure 3A). In the 10 K EV samples, all cell-derived 10 K EVs expressed PS (Figure 3B) in the larger-sized gate capturing up to 3 µm sized particles. Moreover, 10 K EVs derived from VMC23 displayed the highest number of Annexin V+ events, and 10 K EVs derived from H28 displayed the lowest number of Annexin V+ events. Four controls were included to account for false-positive events: a blank sample consisting of a buffer with no Annexin V staining; a sample from the filtrate, which is the residual media collected after passing conditioned media through the Amicon® filter units in the final step of EV isolation (Figure 2A); cell culture media directly from the bottle, and the supernatant collected after the final 100 K ultracentrifugation step (EV-depleted media).
Specific markers were used to characterize each EV pellet. In addition, 10 K EVs were characterized with western blotting by testing for the presence of at least cytokeratin 18 (CK18) or heat shock 70 kDa protein 5 (HSPA5), which are suggested markers for large EVs, and 100 K EVs were characterized with western blotting by testing for the presence of at least ALIX or any of the tetraspanins CD9 and CD81. GAPDH was used as an internal control in western blots to verify equivalent amounts of protein (50 µg) for cells and EV samples. The average protein yield was 3.4 mg/mL (range 2.0–4.3 mg/mL) for 10 K pellets, 2.8 mg/mL (range 1.3–3.9 mg/mL) for 18 K pellets, and 1.6 mg/mL (range 0.2–2.9 mg/mL) for 100 K pellets. Western blotting showed that all 10 K pellets expressed at least one large EV marker (Figure 3C). For the 100 K pellets, all but H28 expressed at least one small EV marker (Figure 3D), although the protein amount in the 100 K pellets of the H28 cell line was very low, and a faint band was detected for GAPDH in H28 100 K EVs.

3.3. The 10 K, 18 K, and 100 K Pellets Show Distinct Profiles

A total of 4054 proteins were identified in our study via label-free quantitative proteomic analysis. Of these, 2736 proteins (67%) have been previously reported in the Exocarta and Vesiclepedia (http://microvesicles.org, accessed on 30 August 2021) databases, and 269 proteins were unique to our study (Figure 4A). Between the EV types, 935 proteins were unique to 10 K pellets, 134 proteins were unique to 18 K pellets, and 224 proteins were unique to 100 K pellets (Figure 4B). The total number of proteins extracted from each EV pellet in each cell line is shown in Figure 4C, with H28 having the lowest protein content compared to the other mesothelioma cell lines, consistent with NTA and western blotting results. A 2D visualization of proteomics data after UMAP dimensionality reduction demonstrated a very clear spatial separation between 10 K, 18 K, and 100 K pellets across all cell lines (Figure 5A). The clusters shown for each sample include at least two biological replicates, each with two technical replicates, providing a high level of confidence for the distinction shown between the EV types. We also performed a UMAP plot of the EV types according to the histological subtype (Figure 5B). We found a clear separation only in the 18 K EVs, where all 18 K EVs derived from the epithelioid cell lines (VMC23, H226, and H28) were distinctly separated from the 18 K EVs derived from the non-epithelioid cell lines (MM05 and MSTO). The separation between histological subtypes of pleural mesothelioma is not as clear in the 10 K and 100 K EV groups.
In Figure 6A, a heatmap with hierarchical clustering shows the abundance and protein profiles of all EVs across all cell lines. A cluster of proteins can be observed abundantly across all EV subtypes, indicated by the lighter-colored scales in the upper section of the heat map. There are also small clusters of high abundant proteins that are visible exclusively in a specific subtype of EVs, indicated by the yellow, orange, and red scales. The clusters are more apparent in the 10 K EVs, where multiple clusters can be seen that are absent in the corresponding 18 K and 100 K EV pellets. In Figure 6B, the heatmap focused on markers that have been commonly reported as EV markers. Mitofilin is the only marker that was exclusively differentially expressed in the 10 K EVs.
We also investigated the top five differentially expressed proteins in each EV type compared to the corresponding EV type derived from the control cell line, MeT-5A (Figure 7). In the 10 K EVs, among the top differentially expressed proteins, we found upregulation of leucine-tRNA ligase (SYLC), carbohydrate sulfotransferase 3 (CHST3), neogenin (immunoglobulin superfamily DCC subclass member 2) (NEO1), aldo-keto reductase family 1 member A1 (AK1A1), and the toll-interacting protein (TOLIP). We also found downregulation of high-affinity cAMP-specific 3’,5’-cyclic phosphodiesterase 7A (PDE7A), nucleolar and coiled-body phosphoprotein 1 (NOLC1), microfibrillar-associated protein 1 (MFAP1), bisphosphoglycerate mutase (PMGE), cystic fibrosis transmembrane conductance regulator (CFTR), and pre-mRNA 3’-end-processing factor FIP1 (FIP1). In the 18 K EVs, among the top differentially expressed proteins, we found upregulation of asparagine synthetase (ASNS), platelet-derived growth factor receptor beta (PGFRB), vitamin K-dependent protein S (PROS), and ubiquitin-40S ribosomal protein S27a (RS27), as well as downregulation of collagen alpha-1 (COAA1), protein IWS1 homolog (IWSI), gelsolin (GELS), and adenylate kinase isoenzyme 1 (KAD1). In the 100 K EVs, some of the top differentially expressed proteins include upregulation of aldo-keto reductase family 1 member C2 (AK1C2), integrin-linked protein kinase (ILK), ATP-dependent DNA helicase Q1 (RECQ1), lysyl oxidase homolog 1 (LOXL1), and N-alpha-acetyltransferase 15 (NAA15), as well as downregulation of multiple inositol polyphosphate phosphatase 1 (MINP1), desmoplakin (DESP), SAP domain-containing ribonucleoprotein (SARNP), and mesencephalic astrocyte-derived neurotrophic factor (MANF). These proteins have associations with cancer pathogenesis, as discussed below.

3.4. Proteomic Profiles Reveal Specific Biological Processes and Cellular Components Exclusively Enriched in 10 K, 18 K, and 100 K EVs

There were 11 biological processes and 10 enriched cellular components common to all EV pellets (Table 3). Among the biological processes common to all EV types, we observed antigen processing and presentation, neutrophil activation, and degranulation, all of which are known to be involved in inflammation and immune response.
The biological processes unique to each EV subtype are provided in Table 4, and the top 10 biological processes and enriched cellular components for each EV subtype are shown in Figure 8.
Four biological processes were common to 10 K and 18 K EVs; five biological processes were common to 10 K and 100 K EVs, while 51 biological processes were common to 18 K and 100 K EVs (Figure 8D), suggesting that 10 K EVs are potentially more distinguished than 18 K and 100 K EVs. In the 10 K EV pellet, unique biological processes included regulation of gene silencing, mRNA export from the nucleus, multi-organism transport, DNA packaging, and metabolic, catabolic, and exocytic processes. In the 18 K EVs, unique biological processes included the Wnt signaling pathway, which is known to play a key role in the development of malignant mesothelioma [28]; other processes also included antigen processing and presentation of exogenous peptide antigens via MHC class I, response to hypoxia, T cell receptor signaling pathway, activation and regulation of innate immune response, RNA transport, and response to interleukin-1, which is an inflammatory cytokine [29]. In the 100 K EVs, some of the unique biological processes identified included protein targeting to membrane, transfer RNA metabolic process, and threonine kinase signaling pathway, which is known to be activated in mesothelioma [30].
There were 17 enriched cellular components common to the 18 K and 100 K EV pellets, but only two enriched cellular components common to the 10 K and 18 K EV pellets and only one enriched cellular component common to the 10 K and 100 K EV pellets (Figure 8D), suggesting again that 10 K EVs are potentially more distinguished than 18 K and 100 K EVs. Among the common enriched cellular components, we found cell-substrate junction, collagen-containing extracellular matrix, and spliceosomal complex enriched in all EV types. Among the cellular components exclusively enriched in 10 K EVs, we identified the mitochondria as a recurring source of enrichment for 10 K EVs. For the 18 K EVs, we found exclusive enrichment in coated membrane, coated vesicle, coated vesicle membrane, membrane coat, and proteasome, all of which are responsible for the degradation of intracellular proteins. Finally for the 100 K EVs, we found exclusive enrichment in ficolin-1-rich granule membrane, ribosome, and specific components of the spliceosome complex, among others listed in Table 5.

3.5. Cancer-Associated Proteins in EVs of Pleural Mesothelioma

We then searched our entire proteome database for cancer-associated proteins, or proteins that have been reported in other cancers and associated with tumorigenesis. We found 46 proteins that were present in all the EV pellets from all mesothelioma cell lines and absent in all the EV pellets from the control cell line, MeT-5A (Table 6). Among these included mesothelin (MSLN), epidermal growth factor receptor (EGFR), fibulin-1 (FBLN1), platelet-derived growth factor receptor beta (PDGFRB), ras-related protein R-Ras2 (RRAS2), protein transport protein (SC23B and SC31A), tumor necrosis factor receptor superfamily member 10B (TR10B), macrophage colony-stimulating factor 1 (CSF1), and DNA damage-binding protein 2 (DDB2). The full list of proteins and their descriptions are provided in Table 6. Their presence across all EVs derived from mesothelioma cell lines suggests strong biomarker potential for pleural mesothelioma within the cargo of EVs.
Our IPA analysis provided further insights into the activation or inhibition levels of cancer-related molecular pathways and biological functions in EV pellets compared to the corresponding MeT-5A control. Specifically, we found that the 10 K EV pellets showed predominantly decreased oxidative phosphorylation, microRNA biogenesis signaling, and neutrophil extracellular trap signaling pathways (z-score < −2; p < 0.05; Figure 9A). Coenzyme A signaling and mitochondrial dysfunctions were activated in the 10 K EV pellets, except for the H226 (z-score > 2; p < 0.05). Except for VMC23 and MSTO, all other 10 K EV pellets exhibited decreased cell viability, cell survival, cell proliferation, and DNA repair functions (Figure 9D).
In contrast, the 18 K and 100 K EV pellets, except for H28 (showing decreased or insignificant activity), exhibited significantly increased activation of eukaryotic initiation factor 2 (EIF2) signaling, estrogen receptor signaling, synaptogenesis, and gonadotropin-releasing hormone (GNRH) signaling pathways (Figure 9B,C), as well as increased cell viability, cell survival, cell migration, and cell proliferation, and decreased apoptotic functions (Figure 9E,F). The list of top 15 canonical pathways and biofunctions implicated in the EV groups are presented in Figure 9.

3.6. Cancer-Associated Proteins Specific to 10 K, 18 K, and 100 K EVs

As shown in Figure 10, there were 17 proteins with links to cancer found exclusively in the 10 K EVs. Among these are NADH-ubiquinone oxidoreductase subunit A13 (NDUFA13), which is located in the mitochondrial inner membrane and function as a tumor suppressor [77]; protein Wnt-10a (WNT10A), involved in Wnt signaling and has an established role in mesothelioma [78]; transcription factor 7-like 2 (TCF7L2), a transcription factor in the Wnt-signaling pathway [79]; mitotic spindle assembly checkpoint protein MAD1 (MAD1L1), a checkpoint gene with its dysfunction associated with chromosol instability [80]; and Fas cell surface death receptor (FAS), a member of the tumor necrosis factor-receptor superfamily with a key role in apoptotic signaling pathways and where mutations can prevent the immune system from attacking tumor cells [81]. In the 18 K EVs, two cancer-associated proteins were exclusively found: EH domain-binding protein 1 (EHBP1), associated with endocytic trafficking and previously reported in prostate cancer [82,83]; and leukemia inhibitory factor receptor (LIFR), involved in the cellular differentiation, proliferation and survival and previously reported in epithelial tumors of the salivary gland [84]. In the 100 K EVs, among the unique cancer-associated proteins, we found notch receptor 3 (NOTCH3), which plays a key role in the function and survival of vascular smooth muscle cells [85]; serine/threonine-protein kinase 10 (STK10), which functions as a tumor suppressor [86]; janus kinase 2 (JAK2), which plays a key role in cytokine and growth factor signaling [87]; and fanconi anemia group J protein (FANCJ), which plays an important role in cell cycle checkpoint control [88]. The full list of cancer-associated proteins in each EV type is provided in Figure 10. Details of each protein and their description are provided in Table 7, Table 8 and Table 9.

3.7. Mesothelioma Markers Are Localized to Specific EV Types

We then conducted a search of proteins that have established biomarker potential in pleural mesothelioma tumor tissue samples. We found that all these proteins were significantly differentially expressed in specific EV subtypes, suggesting that some of these biomarkers are localized to small or large EVs (Table 10). Among these, pleural mesothelioma-associated proteins include the programmed cell death 1 ligand 2 (PD-L2), which we found to be significantly overexpressed in only the 10 K EVs of VMC23 and MM05; bridging Integrator 1 (Bin1), which we have previously identified as a tumor suppressor and prognostic marker of pleural mesothelioma [89], was significantly under expressed in only the 18 K EVs of all pleural mesothelioma cell lines. Cyclin-dependent kinase inhibitor 2A (CDKN2A) was significantly under expressed in only the 10 K EVs of all cell lines, and cellular tumor antigen p53 (TP53) was found significantly under expressed in only the 10 K EVs of all cell lines (Table 10).
We further validated the presence of two key pleural mesothelioma biomarkers, PD-L1 and mesothelin, via western blotting in each EV pellet across all cell lines (Figure 11). PD-L1 was not detected in any of the 18 K EV pellets. PD-L1 was detected in the 10 K EVs of all but H28 mesothelioma cell lines. Interestingly, the enrichment was relatively greater in the 10 K EVs than in the 100 K EVs, consistent with our proteomics results. For MM05 and MSTO, PD-L1 was only detected in the 10 K EVs and not in the 100 K EVs. Mesothelin was detected in all three 10 K, 18 K, and 100 K pellets derived from four of the mesothelioma cells, but not in the EVs derived from H28 cell line, although this was not surprising given the consistently low EVs and protein yield obtained from H28 cells across all experiments.

4. Discussion

In this study, we have demonstrated that different subtypes of EVs are released by mesothelioma cancer cells and their cargo can uncover new diagnostic, prognostic, or predictive biomarkers for cancer therapy.
Only two proteomic studies have been published to date on EVs derived from mesothelioma cell lines. However, to our knowledge, there are currently no studies that have investigated EVs derived from the cell lines used in this study. Our study is also the first to investigate different subtypes of EVs from mesothelioma cell lines. In the previous proteomic studies, the focus has been on small EVs, termed exosomes, whereas medium- to large-sized EVs have not yet been studied in mesothelioma cell lines. Greening et al. (2016) [90] conducted quantitative proteomics on pleural mesothelioma-derived exosomes (isolated at 100,000× g for 2 h) from four malignant mesothelioma cell lines (J038, LO68, OLD1612, and JU77). They defined a selective mesothelioma oncogenic exosomal signature (mEXOS) consisting of 570 proteins [90]. Of the 570 proteins in mEXOS, 344 proteins (approximately 60%) were identified as complementary DNA (cDNA) and 3 proteins were uncharacterized protein fragments. Of the remaining 224 proteins in mEXOS, 48 proteins were also identified in our proteomics results in this study, most of which were found in all our EV subtypes, with some exceptions (Supplementary Table S1). For example, Annexin A6, which is a calcium-dependent membrane-binding protein that is closely associated with several cancers such as melanoma, epithelial carcinoma, cervical, breast and prostate cancer [91], was not identified in our 100 K EVs, but was found mostly in our 10 K EVs and in only one 18 K EVs derived from the MM05 cell line. This suggests the possibility for membrane-binding proteins to be localized to the larger-sized EVs due to their biogenesis through blebbing from the plasma membrane. Furthermore, ADAMTS12 (which has shown both pro- and anti-tumor roles and associated with immune cells [92]), neuropilin 2 and interleukin-7 (both of which act on immune cells and have shown great potential in cancer immunotherapy [93,94]) were only detected in our 10 K EVs and 100 K EVs, but not in any of our 18 K EVs, suggesting the presence of immune-associated proteins localized to the cargo of large (10 K) and small (100 K) EVs. Furthermore, OASL (potential prognostic biomarker in breast cancer [95]) was only found in one of our 10 K EVs, suggesting that the cargo of 10 EVs contains oncogenic material. Overall, our results complement the protein signature characterized in mEXOS in Greening et al.’s study and uncovers a larger portfolio of proteins of biomarker value for mesothelioma. Our results further show that certain markers are localized to specific subsets of EVs, which can help streamline biomarker identification and tracking for mesothelioma.
Greening et al. also observed 16 mesothelioma-associated proteins in the cargo of their small EVs, the so-called exosomes, of which 14 were also found in the protein cargo of EVs in our study (as indicated in Table 10). These include mesothelin, calretinin, and vimentin. These proteins are already known to be expressed in mesothelioma tumor tissue microenvironment and have been suggested as biomarkers for the differential diagnosis of pleural mesothelioma [96,97,98]. Their presence in EVs across two studies from different mesothelioma cell lines, especially in specific subsets of EVs in our results, opens an exciting pathway to detect and extract these important biomarkers for pleural mesothelioma without invasive tissue biopsy techniques.
In another proteomics study, Hegmans et al. analyzed exosomes derived from two mesothelioma cells (PMR-MM7 and PMRMM8) [99]. They did not find mesothelioma-associated antigens; however, they found 19 proteins that were associated with antigen presentation, including MHC class I molecules. Interestingly, we found antigen presentation via MHC class I exclusively enriched in our 18 K EVs. These results provide insight into the select oncogenic cargo of EV subtypes and support the notion that cancer-specific biomarkers are localized to specific subtypes of EVs, where proteins associated with antigen presentation more likely to be localized to the cargo of the 18 K EVs. In a recent study involving pleural biopsies of 44 mesothelioma patients, Kosari et al. found that multiple antigen processing and presentation gene sets were predictive of overall survival, which could help facilitate patient selection for immunotherapy [100]. Our study suggests that circulating 18 K EVs may offer novel predictive biomarker potential for immunotherapy for mesothelioma patients.
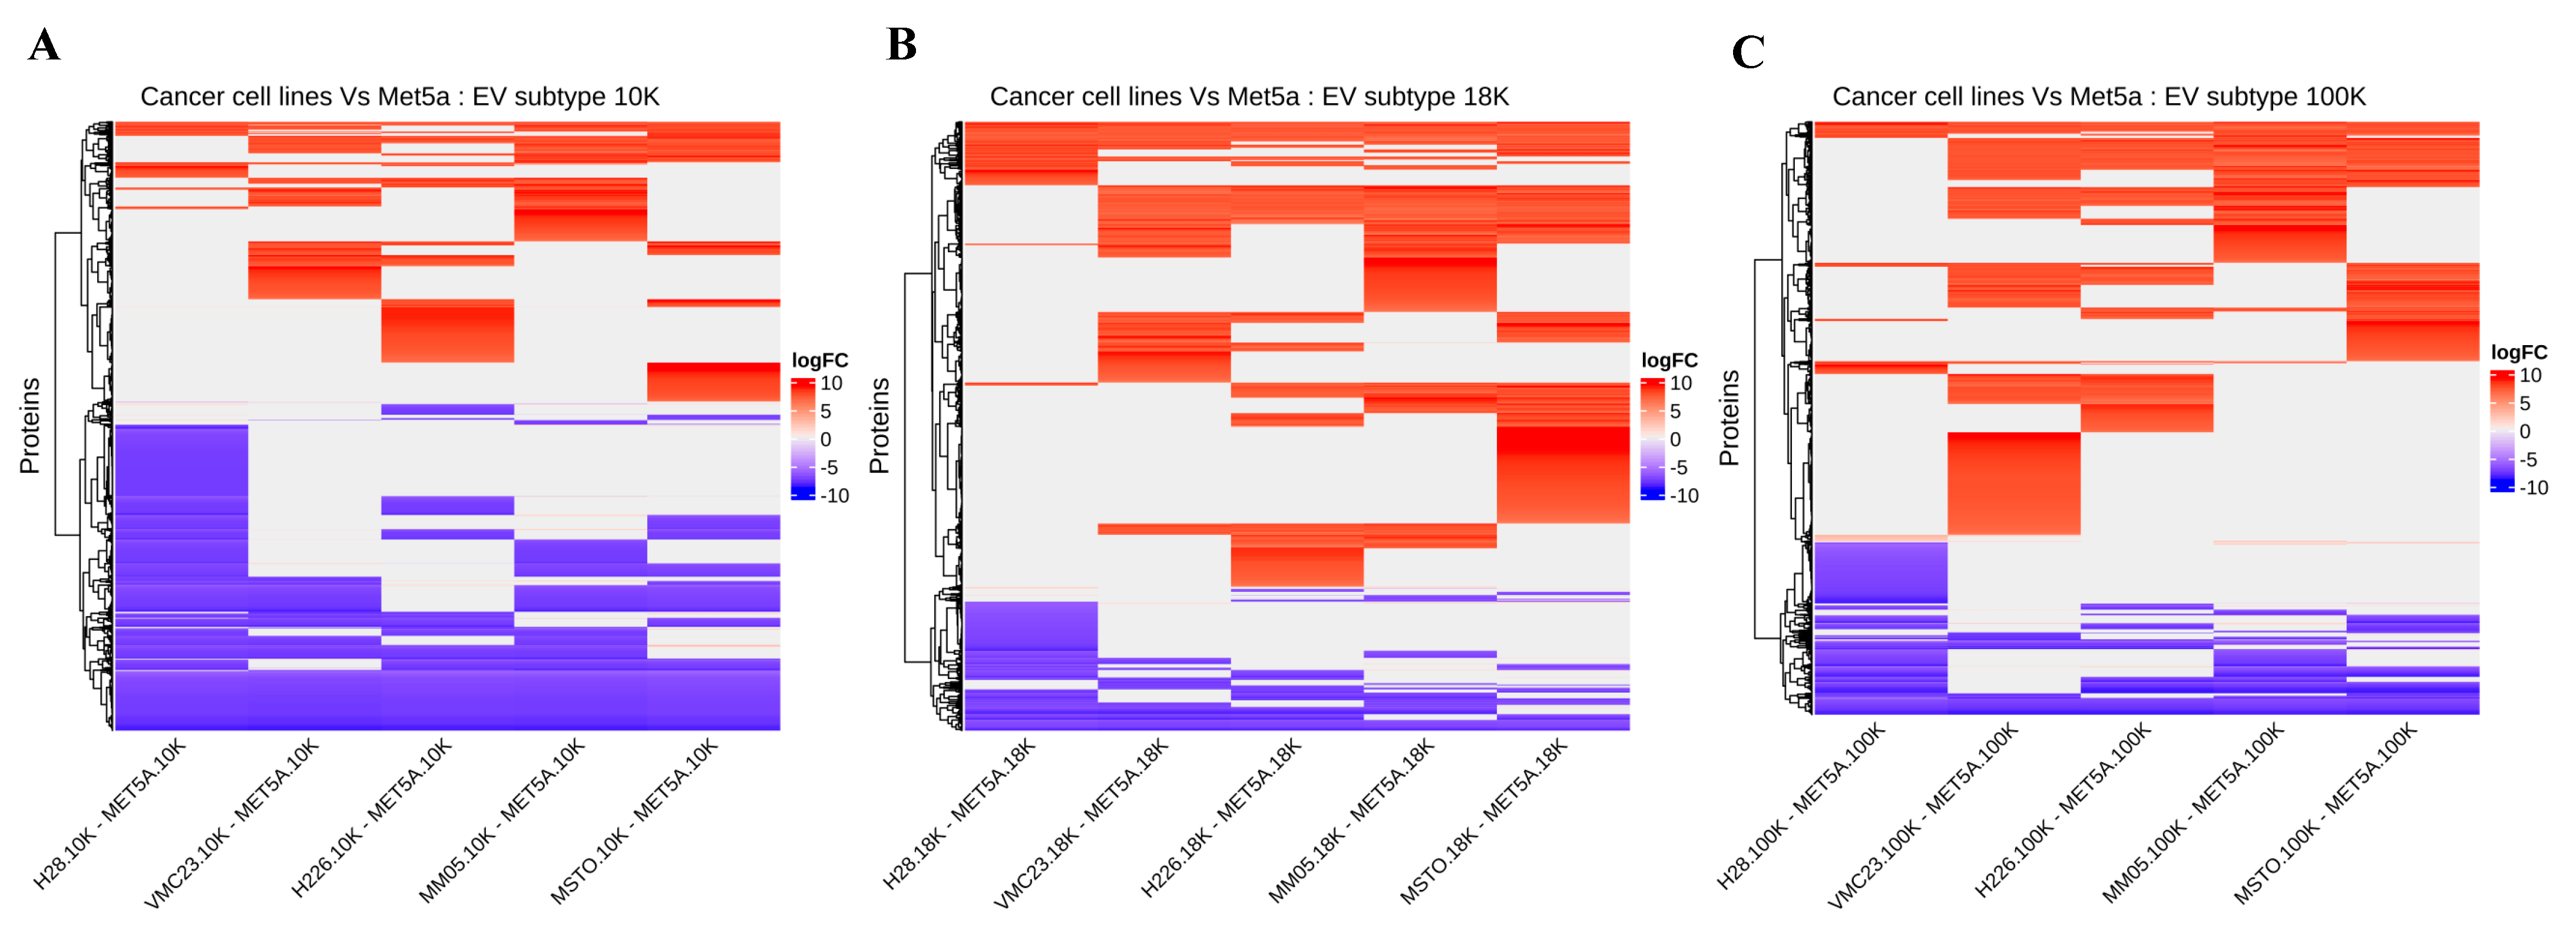
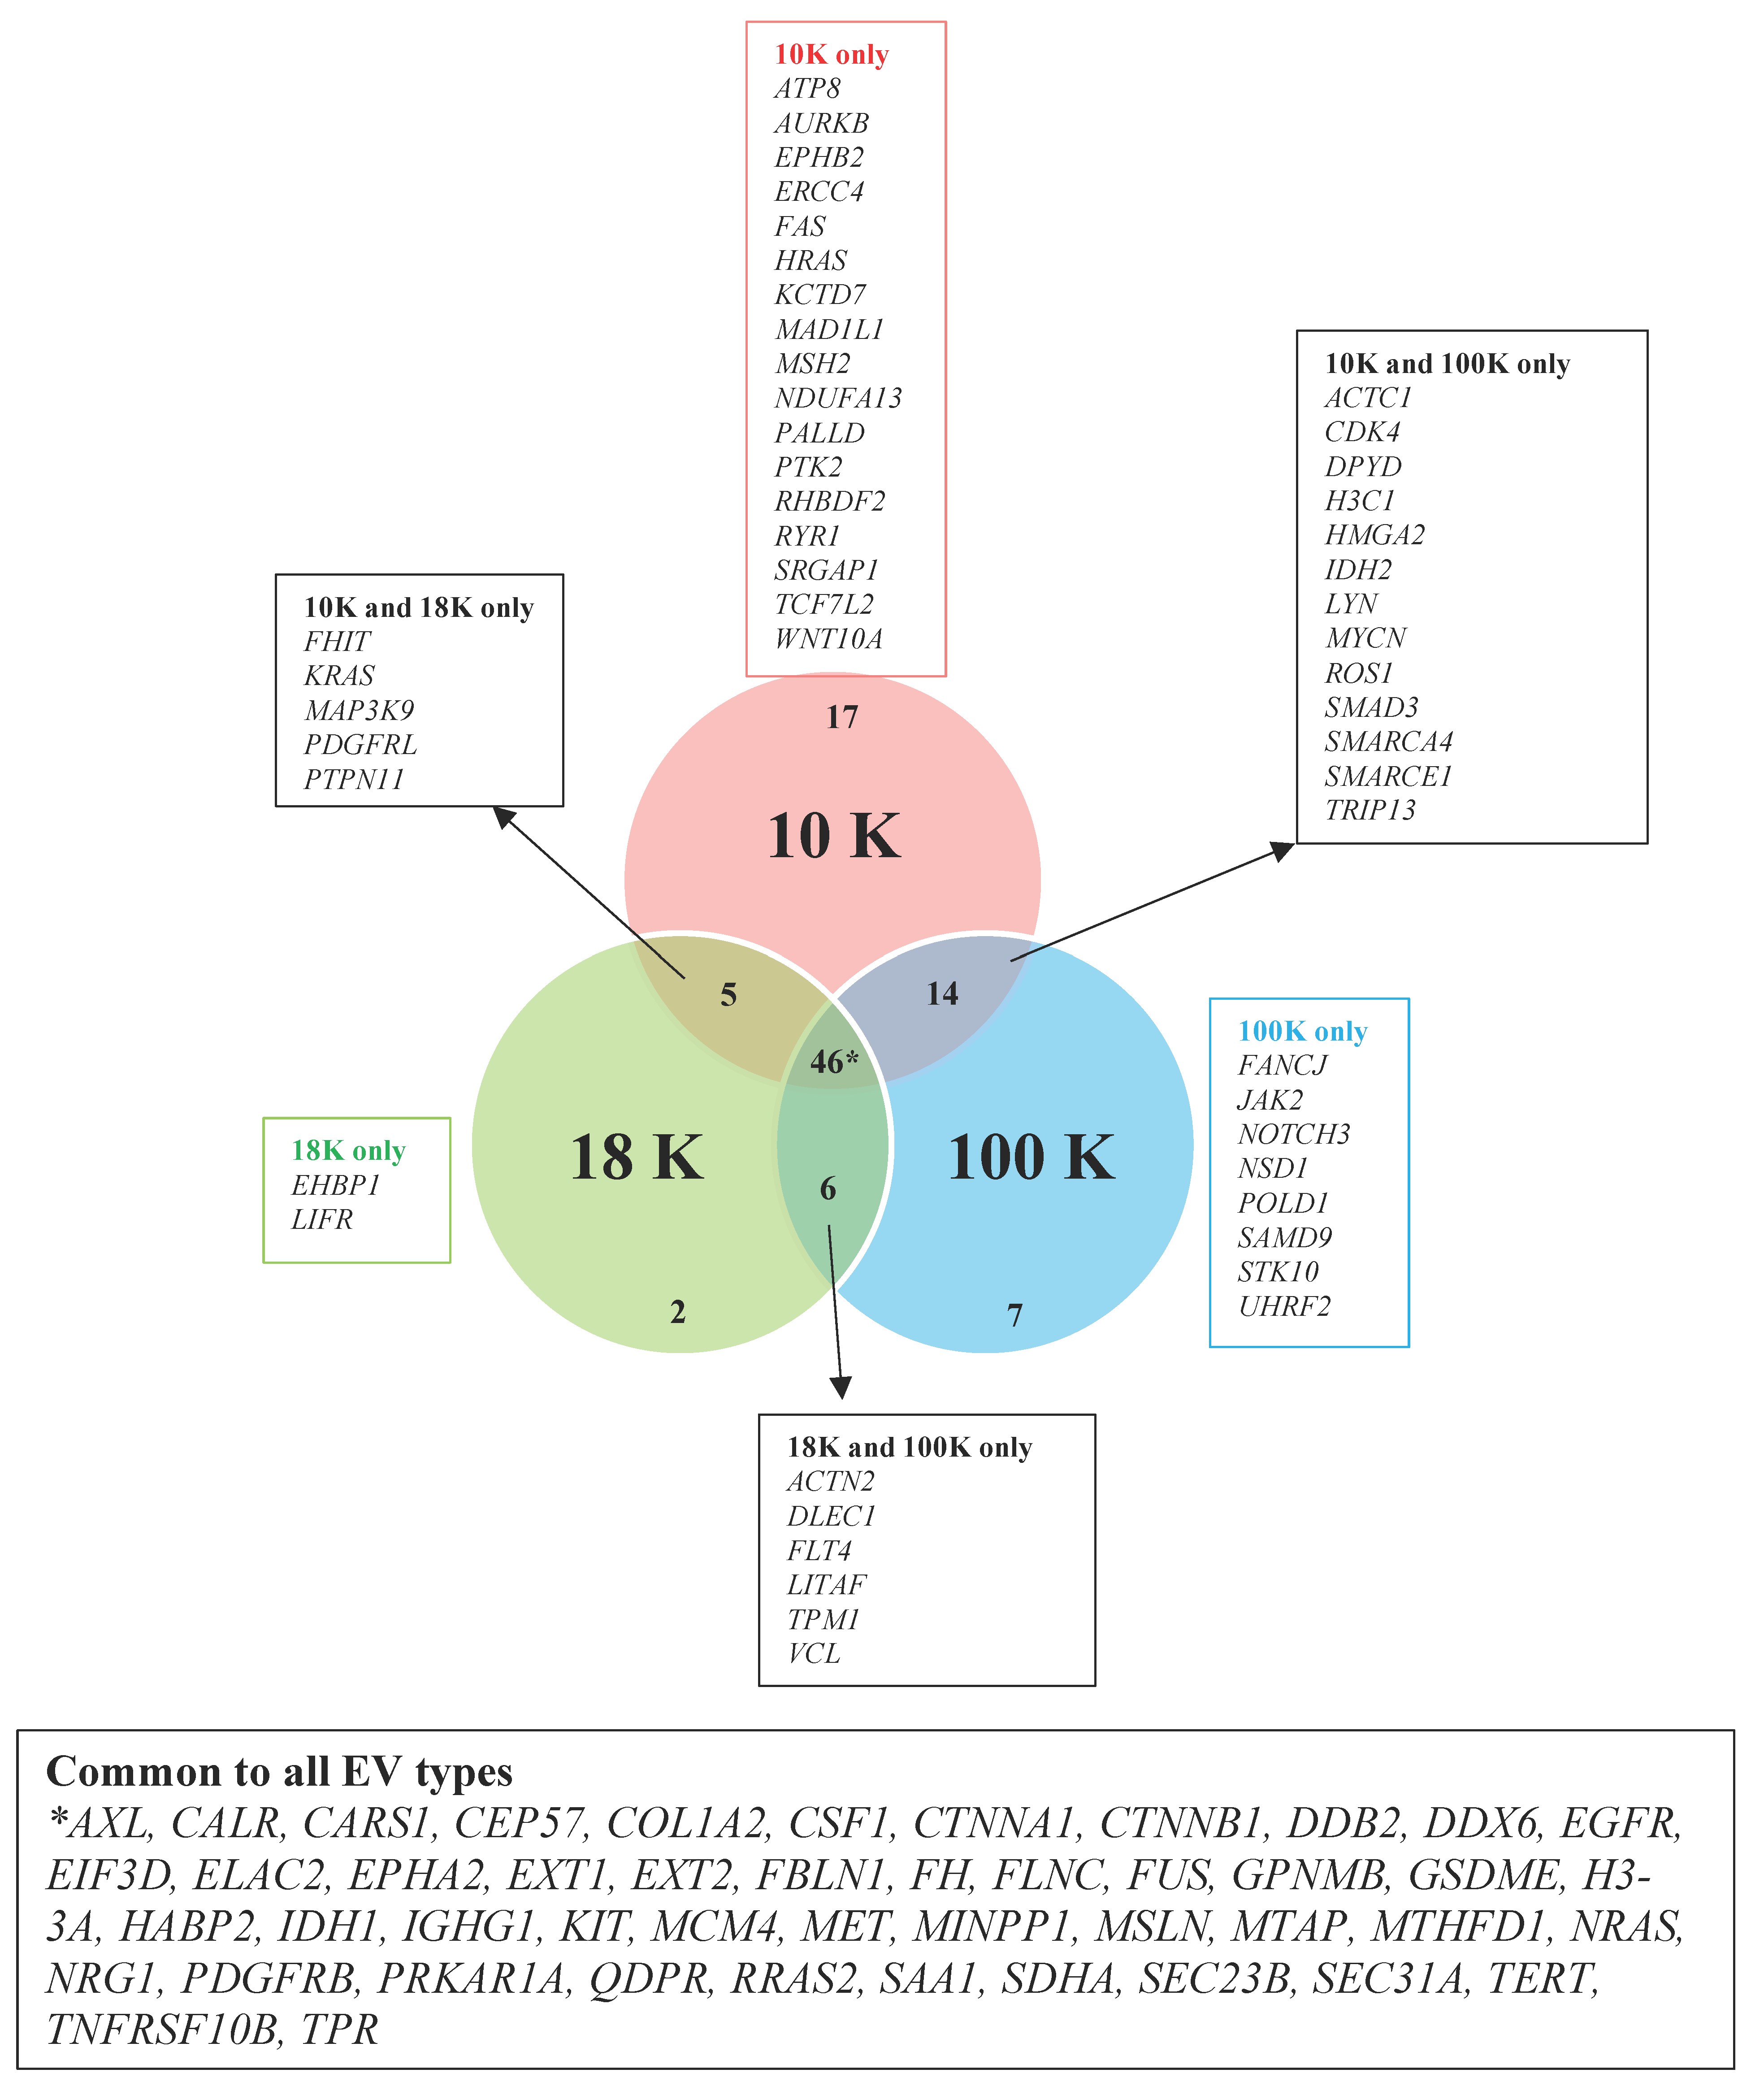
We have uncovered several novel biomarker candidates for pleural mesothelioma by identifying the top upregulated and downregulated proteins that were consistently expressed in each of the EV subtypes derived from all pleural mesothelioma cell lines, compared to the corresponding EVs of the control cell line. Each of these highly over- and under-expressed proteins are involved in cancer pathogenesis and have reported diagnostic, prognostic, or predictive biomarker potential in other cancers from previous reports, suggesting that they have great potential as cancer biomarkers for pleural mesothelioma. In addition, we identified several cancer-associated proteins that were present in all the EV pellets from all five mesothelioma cell lines and absent in all the EV pellets from the control cell line. Among these are proteins such as AXL, which has recently been discovered as a potential target in cancer treatment as it has important signaling functions that drive cancer cell survival, proliferation, migration and invasion and whose aberrant expression has been found in several malignancies including breast cancer, chronic lymphocytic leukemia, and pancreatic cancer [31]; and calreticulin, a protein found in the endoplasmic reticulum that is involved in a spectrum of cellular process including folding of proteins that help stressed and dying cells release co-stimulatory signals to immune cells [32].
Our results further suggest that mitochondrial metabolism may play an important role in pleural mesothelioma tumorigenesis. The mitochondrial enzymes succinate dehydrogenase (SDHA), fumarate hydratase (FH), and isocitrate dehydrogenase (IDH1) were detected in all our EV pellets (10 K, 18 K, and 100 K) derived from all our mesothelioma cell lines but were absent in all EV pellets derived from our control cell line, MeT-5A. It has previously been reported that mitochondrial function is essential for cancer cell viability and that mutations in SDHA, FH, and IDH1 [101] can change mitochondrial metabolism and allow cancer cells to adapt to changing environments. They could be potential biomarkers for pleural mesothelioma. Although we detected these enzymes in all EV pellets derived from all our pleural mesothelioma cell lines, the mitochondria were an enriched cellular component exclusively in the 10 K EVs. One hypothesis is that mitochondrial EV cargo may have originated from the large EVs and passed on to other EV types for cellular transport, which warrants further investigation. It has also been suggested that mitochondrial proteins are present in EV cargo even in unstimulated conditions, or that there may be mitochondria-derived vesicles (MDVs), which are small vesicles that carry mitochondrial proteins to other organelles. One study showed that cells selectively package damaged mitochondrial components in MDVs for lysosomal degradation to prevent the release of damaged components or pro-inflammatory content [102]. Although we found mitochondrial proteins in all our EV subtypes, especially in the 10 K EVs, we did not characterize MDVs as this was outside the scope of our study. Our results warrant further investigation into the role of MDVs as a potential EV subtype that may confer biomarker potential.
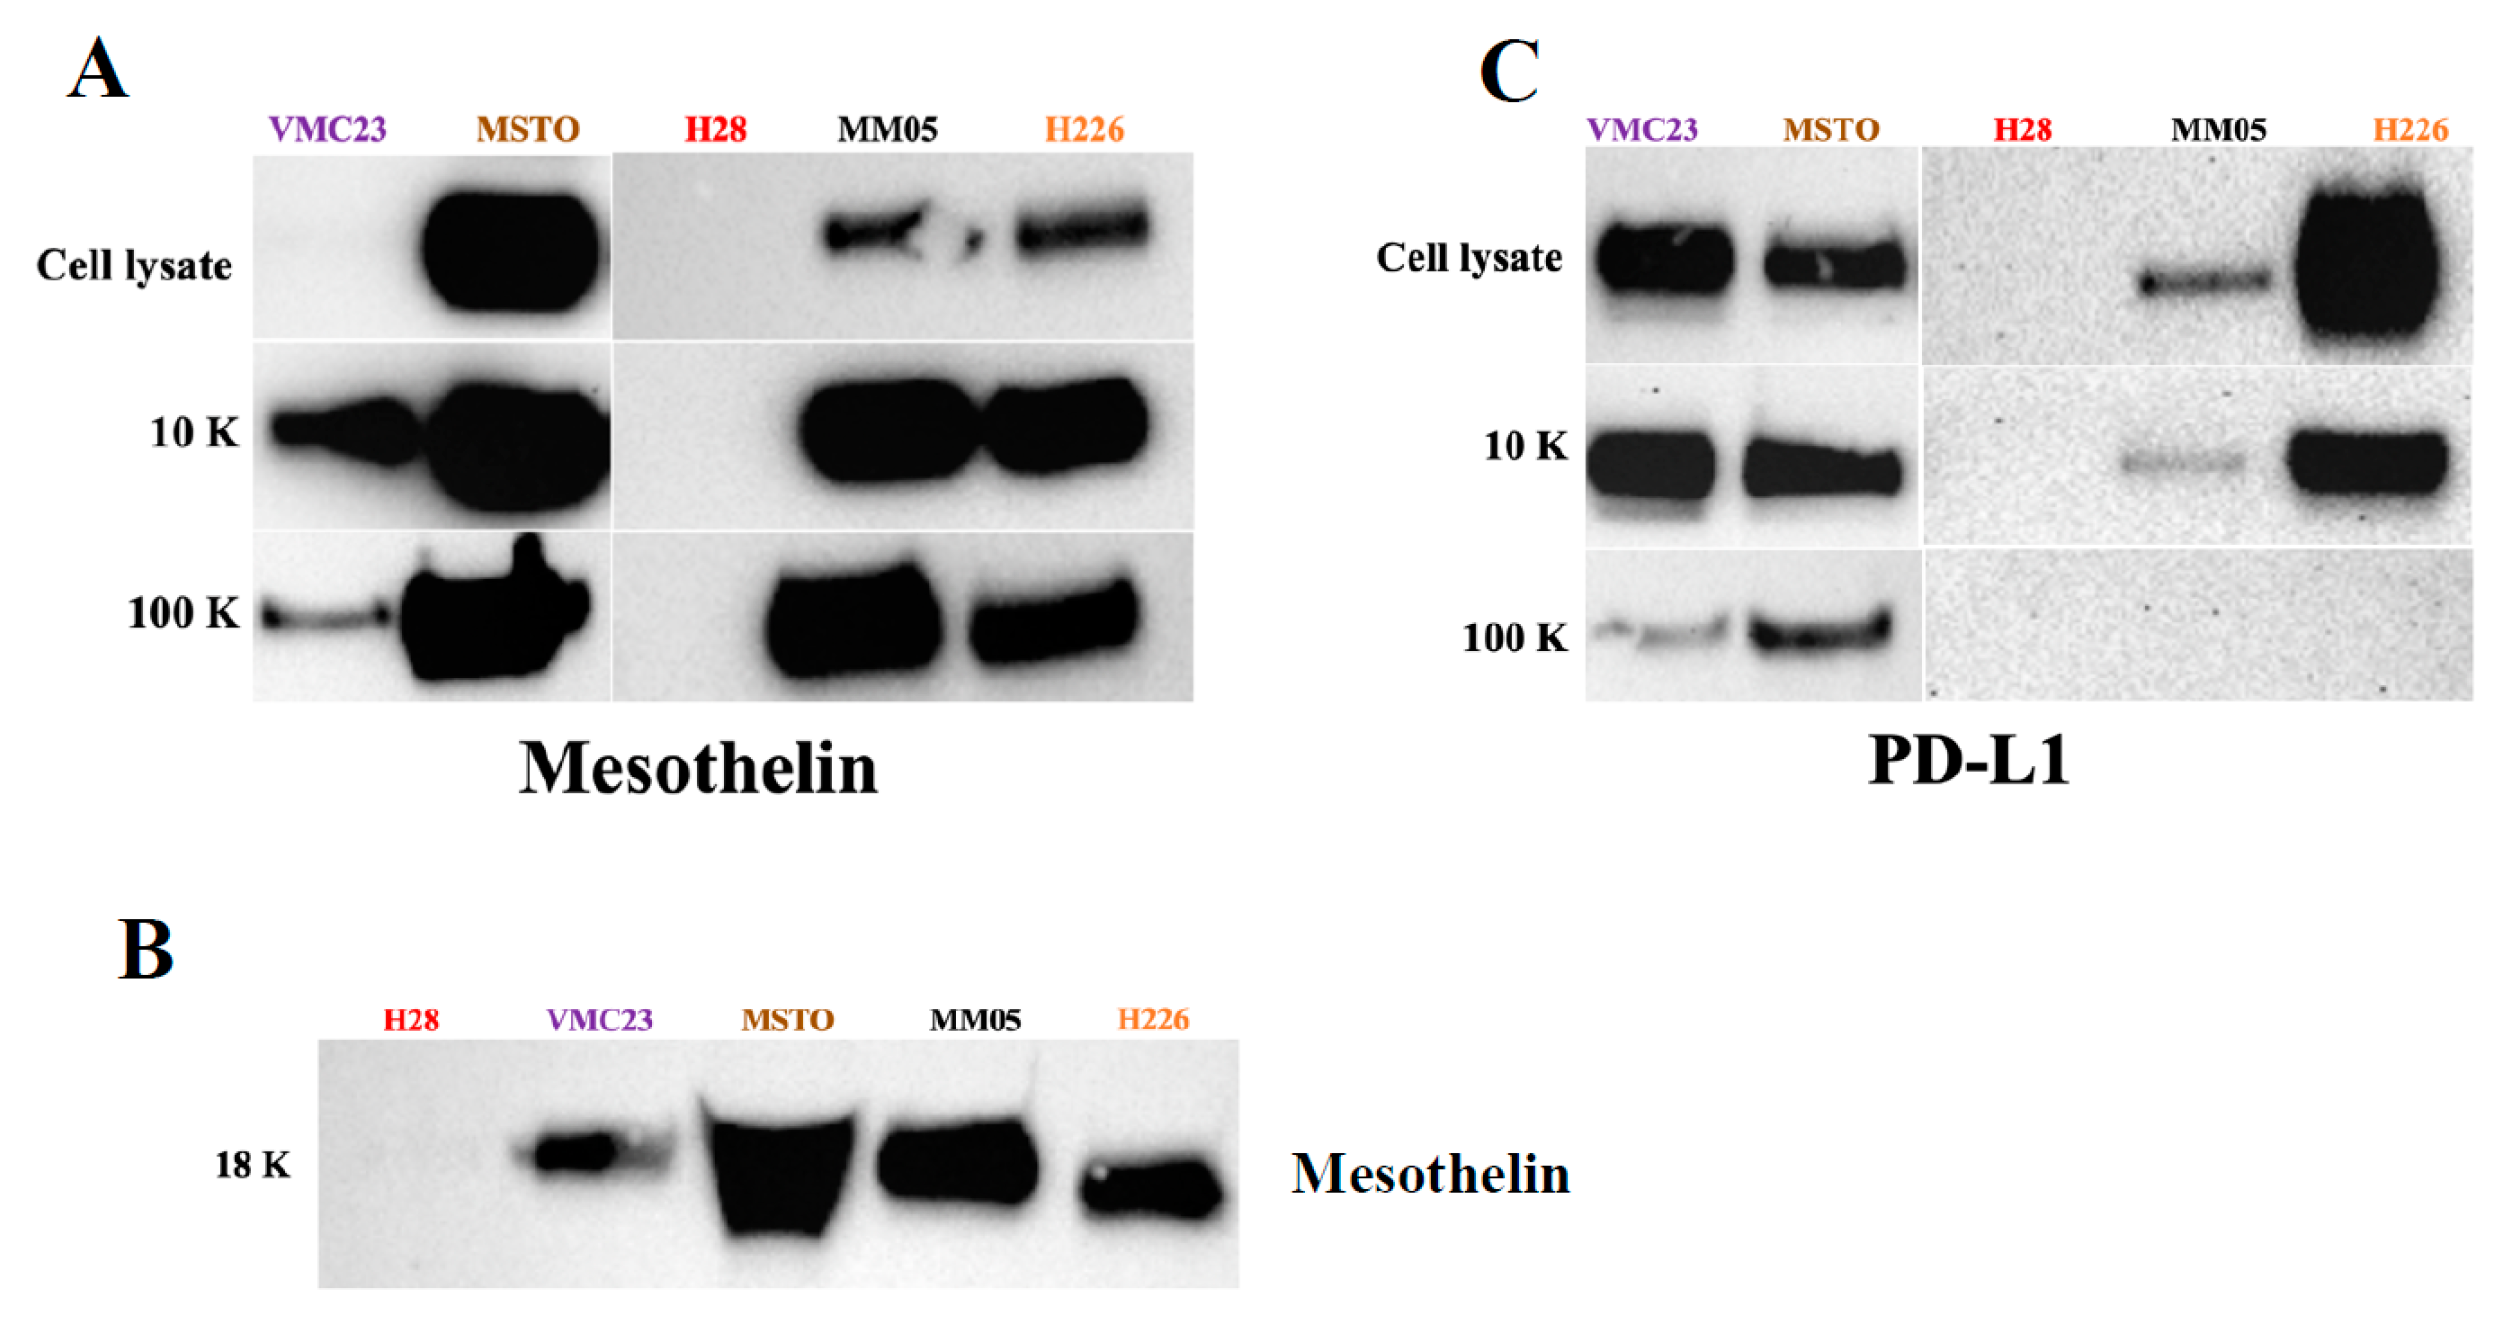
We also searched for known pleural mesothelioma markers that have been established from tissue samples, to determine if we can detect them in our EVs. Mesothelin and the programmed death ligand-1 (PD-L1) are the most widely reported biomarkers in pleural mesothelioma [103,104]. Mesothelin is a cell surface protein that is expressed normally in mesothelial cells and is elevated in the serum of pleural mesothelioma patients, particularly for epithelioid subtype. Soluble mesothelin has gained regulatory approval for monitoring of patients who are diagnosed with epithelioid or biphasic pleural mesothelioma, albeit in limited situations [97]. It currently lacks the required sensitivity for routine clinical use. PD-L1 is an immune-suppressing receptor that is expressed on tumor cells. It binds to the corresponding PD-1 receptor on T cells to suppress their tumor-killing function. PD-L1 expression in the tumor tissue has been established as marker of poor prognosis in pleural mesothelioma [105]. It is currently being investigated as a predictive biomarker for immunotherapy in multiple clinical trials [106], including in our recent study evaluating the safety and efficacy of pembrolizumab in mesothelioma patients [106]. However, results have so far been equivocal. Recently, Chiarucci et al. (2020) investigated the soluble form of PD-L1 in the sera of pleural mesothelioma patients from the NIBIT-MESO-1 clinical trial [107]. They found elevated levels of soluble PD-L1 in the immunotherapy-treated patients vs. baseline (p < 0.001). The study provides the basis to investigate soluble PD-L1 as opposed to tumor PD-L1 expression levels for biomarker potential. This is especially important for pleural mesothelioma due to the lack of tumor availability for robust biomarker studies. Although the origins of the soluble form of PD-L1 is not yet fully understood in pleural mesothelioma, our study alludes to EVs as one possible mechanism. Previously, PD-L1 has only been reported in small EVs, the so-called exosomes, in melanoma [108], non-small cell lung cancer [109], and gastric cancer [110]. Our study is the first to investigate PD-L1 in large EVs, where we found a higher enrichment of PD-L1 expression in our large EV pellets, 10 K, relative to our small EV pellets, 100 K. We did not detect PD-L1 in our 18 K EV pellets. Similarly, we detected mesothelin in our EV pellets. Interestingly, for some of our cell lines, a higher enrichment of mesothelin was detected in our small EVs, 100 K, relative to the 10 K and 18 K EV pellets. Our results give preliminary evidence that PD-L1 and mesothelin are localized to specific subtypes of EVs in pleural mesothelioma, which warrants further investigation. Our results also encourage further investigation of PD-L1 in the cargo of 10 K EVs as a source of biomarker for pleural mesothelioma.
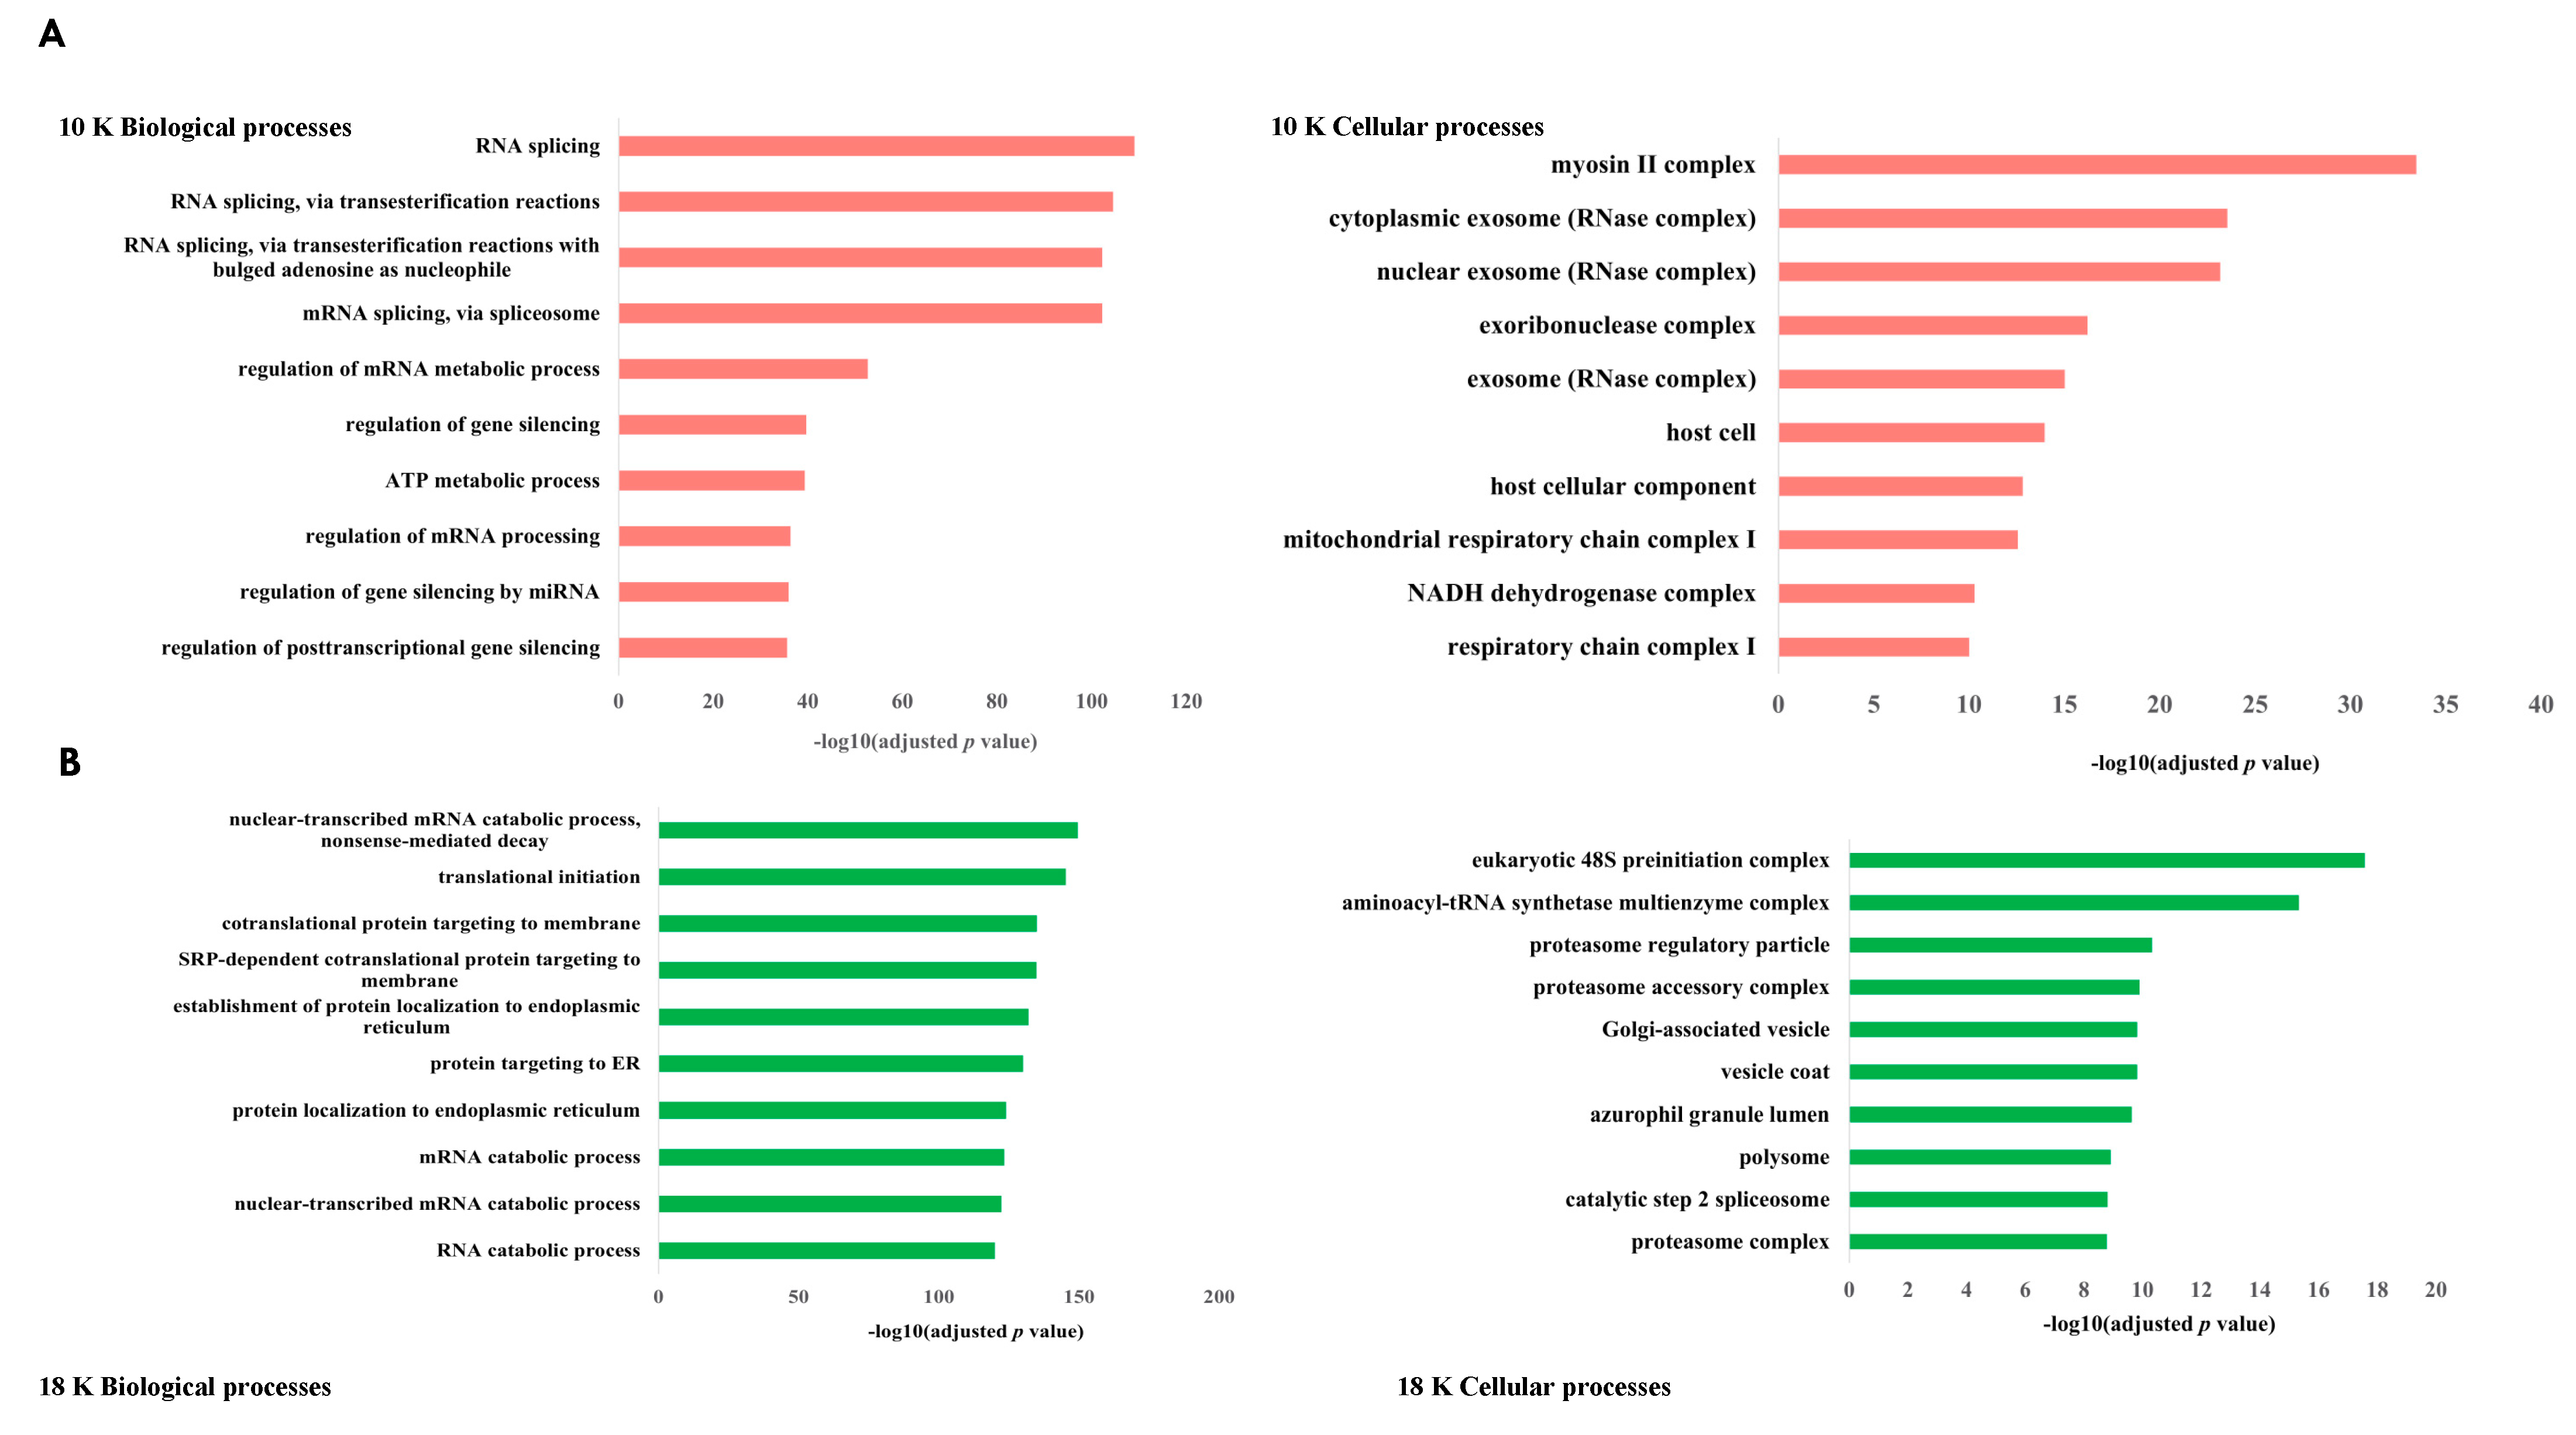
While our large 10 K EVs were mostly enriched with mitochondrial components, interestingly, both our 18 K EVs and 100 K EVs were mostly associated with the endoplasmic reticulum (ER). Some of the top biological processes associated with the 18 K EVs and 100 K EVs were protein targeting to the ER, protein localization to the ER, and SRP-dependent co-translational protein targeting to the membrane, which is a protein that binds to the ER [111]. The ER lumen was also one of the top enriched components in the 18 K EVs and 100 K EVs. It is known that protein handling and folding in the ER are critical processes for cell function and survival. In the tumor microenvironment, oncogenic and metabolic abnormalities can create aberrant activation of ER stress signals that could in turn activate aberrate signaling pathways for tumor growth [112]. ER stress is therefore an important characteristic of the tumor microenvironment. Some studies suggest that the modulation of ER stress can make aggressive tumors sensitive to cytotoxic drugs and immunotherapies [112]; however, this needs to be investigated further. We observed that there are many overlaps in the biological processes and cellular components between 18 K EVs and 100 K EVs; however, 10 K EVs in comparison do not share many common biological processes or enriched cellular components to either the 18 K EVs or the 100 K EVs. Our results suggest that EV isolation at 10 K results in the isolation of more distinct EV subtypes that carry unique oncogenic cargo and should be investigated more in future EV studies.
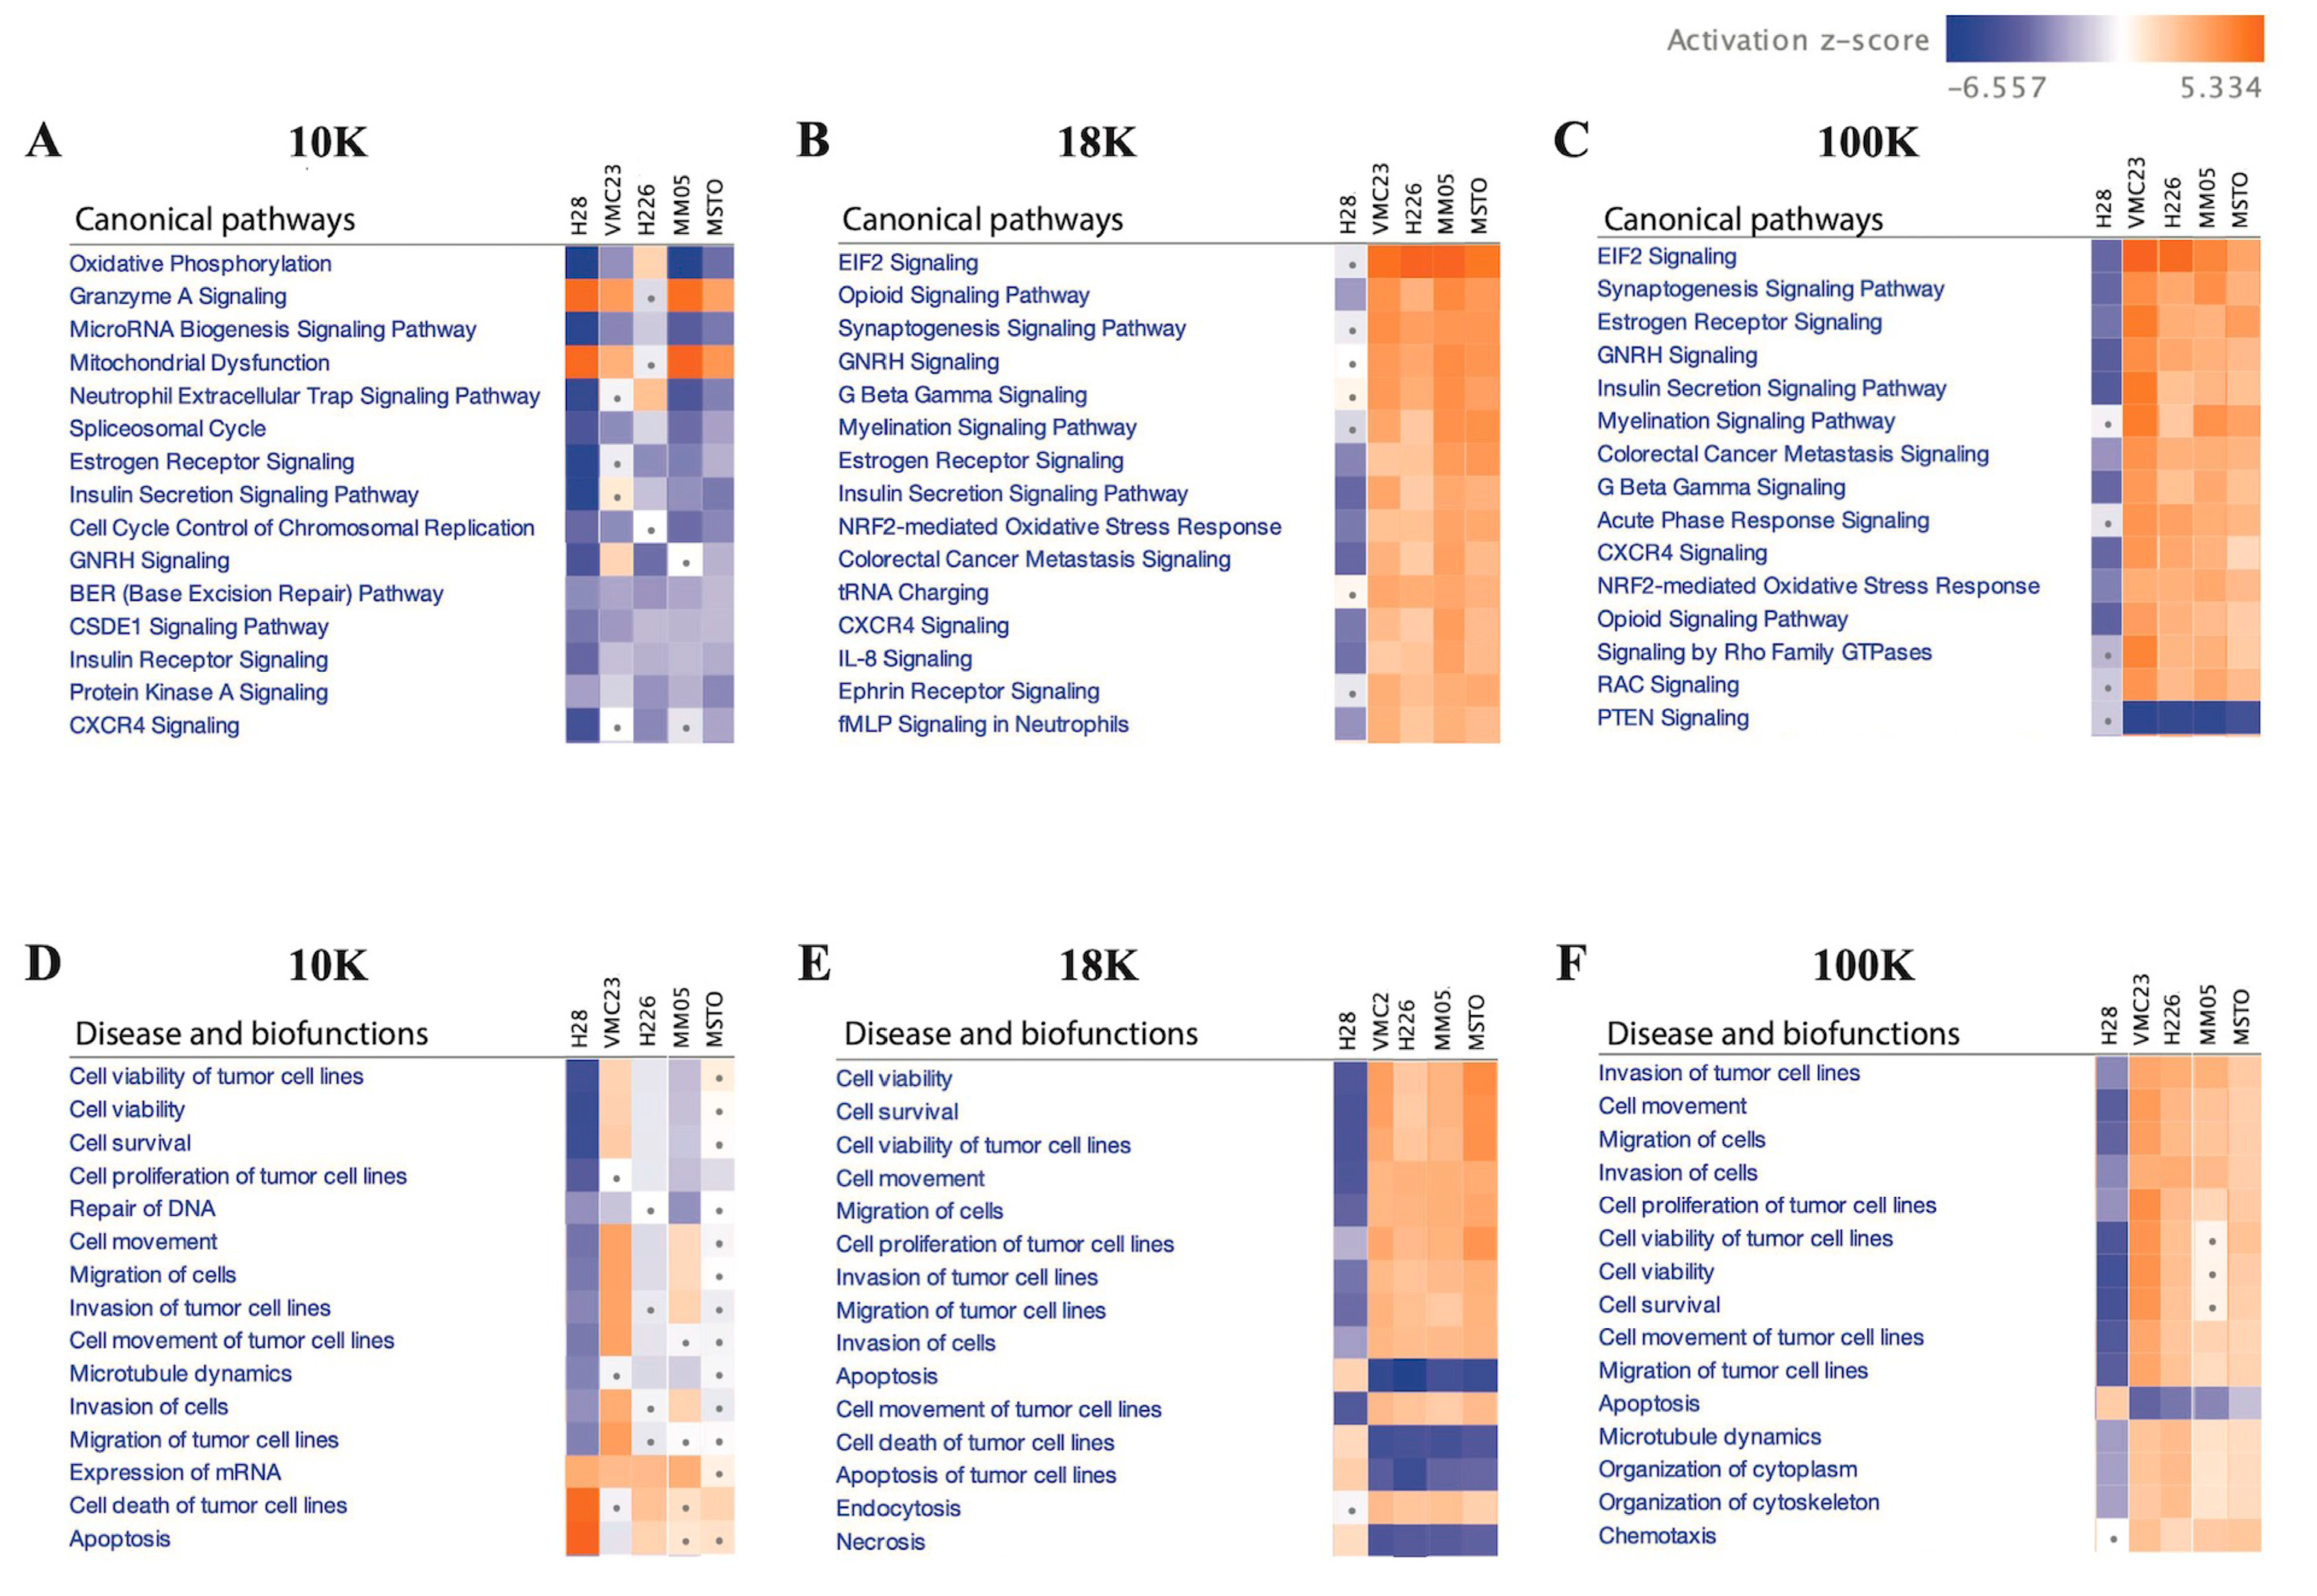
Additionally, IPA analysis of the data revealed that 10 K EV pellets exhibit a distinct proteomic profile, characterized by decreased activities of oxidative phosphorylation, microRNA biogenesis signaling, and neutrophil extracellular trap signaling pathways. These pathways are known to interplay and promote tumor growth, progression, and metastasis when activated [113,114]. The observed reduction in protein activation in these pathways may account for the decreased cell viability, cell survival, cell proliferation, and DNA repair as seen in the 10 K EVs. Further investigations are required to verify these results; however, one possible explanation is that the exosomes may contain more carcinogenic materials and are primarily present in fractions isolated at speeds greater than 10 K [115]. Nonetheless, we did report in this study that 10 AK EVs still carries potential protein biomarkers that warrants further investigation.
Conversely, a majority of the 18 K and 100 K EV pellets exhibited increased activation of various pathways, including the EIF2 signaling and NRF2-mediated oxidative stress response pathways. Our findings align with prior research that demonstrated that increased expression and activity of EIF2 [116] can promote the growth of mesothelioma. NRF2 has also been reported to play a critical role in the proliferation of MSTO-211H cell lines by elevating intracellular ROS levels [117]. These results are consistent with our observation that hallmark cancer features, such as cell viability, cell migration, and cell proliferation, are enhanced, while apoptotic activity is decreased in the 18 K and 100 K EVs. Overall, our results suggest that EV isolation at 10 K results in the isolation of more distinct EV subtypes that carry limited but unique oncogenic cargo and should be investigated more in future EV studies.
There are currently limited reports in the literature on different EV subtypes and their role in cancer. Our study encourages further research especially in 10 K EVs, as we have shown important oncogenic cargo to be present exclusively in 10 K EVs derived from pleural mesothelioma cells. In other cancers, there is a dominant focus on small EVs, the so-called exosomes, in the EV literature, with relatively limited reports on larger-sized EVs. Perhaps one of the barriers to studying sub-populations of EVs is the lack of unique markers that can characterize and distinguish them from each other. Crescitelli et al. (2020) investigated subpopulations of EVs derived from metastatic melanoma tissue by isolating EVs at 16,500× g for 20 min and then at 118,000× g for 2.5 h to isolate large and small EVs, respectively [
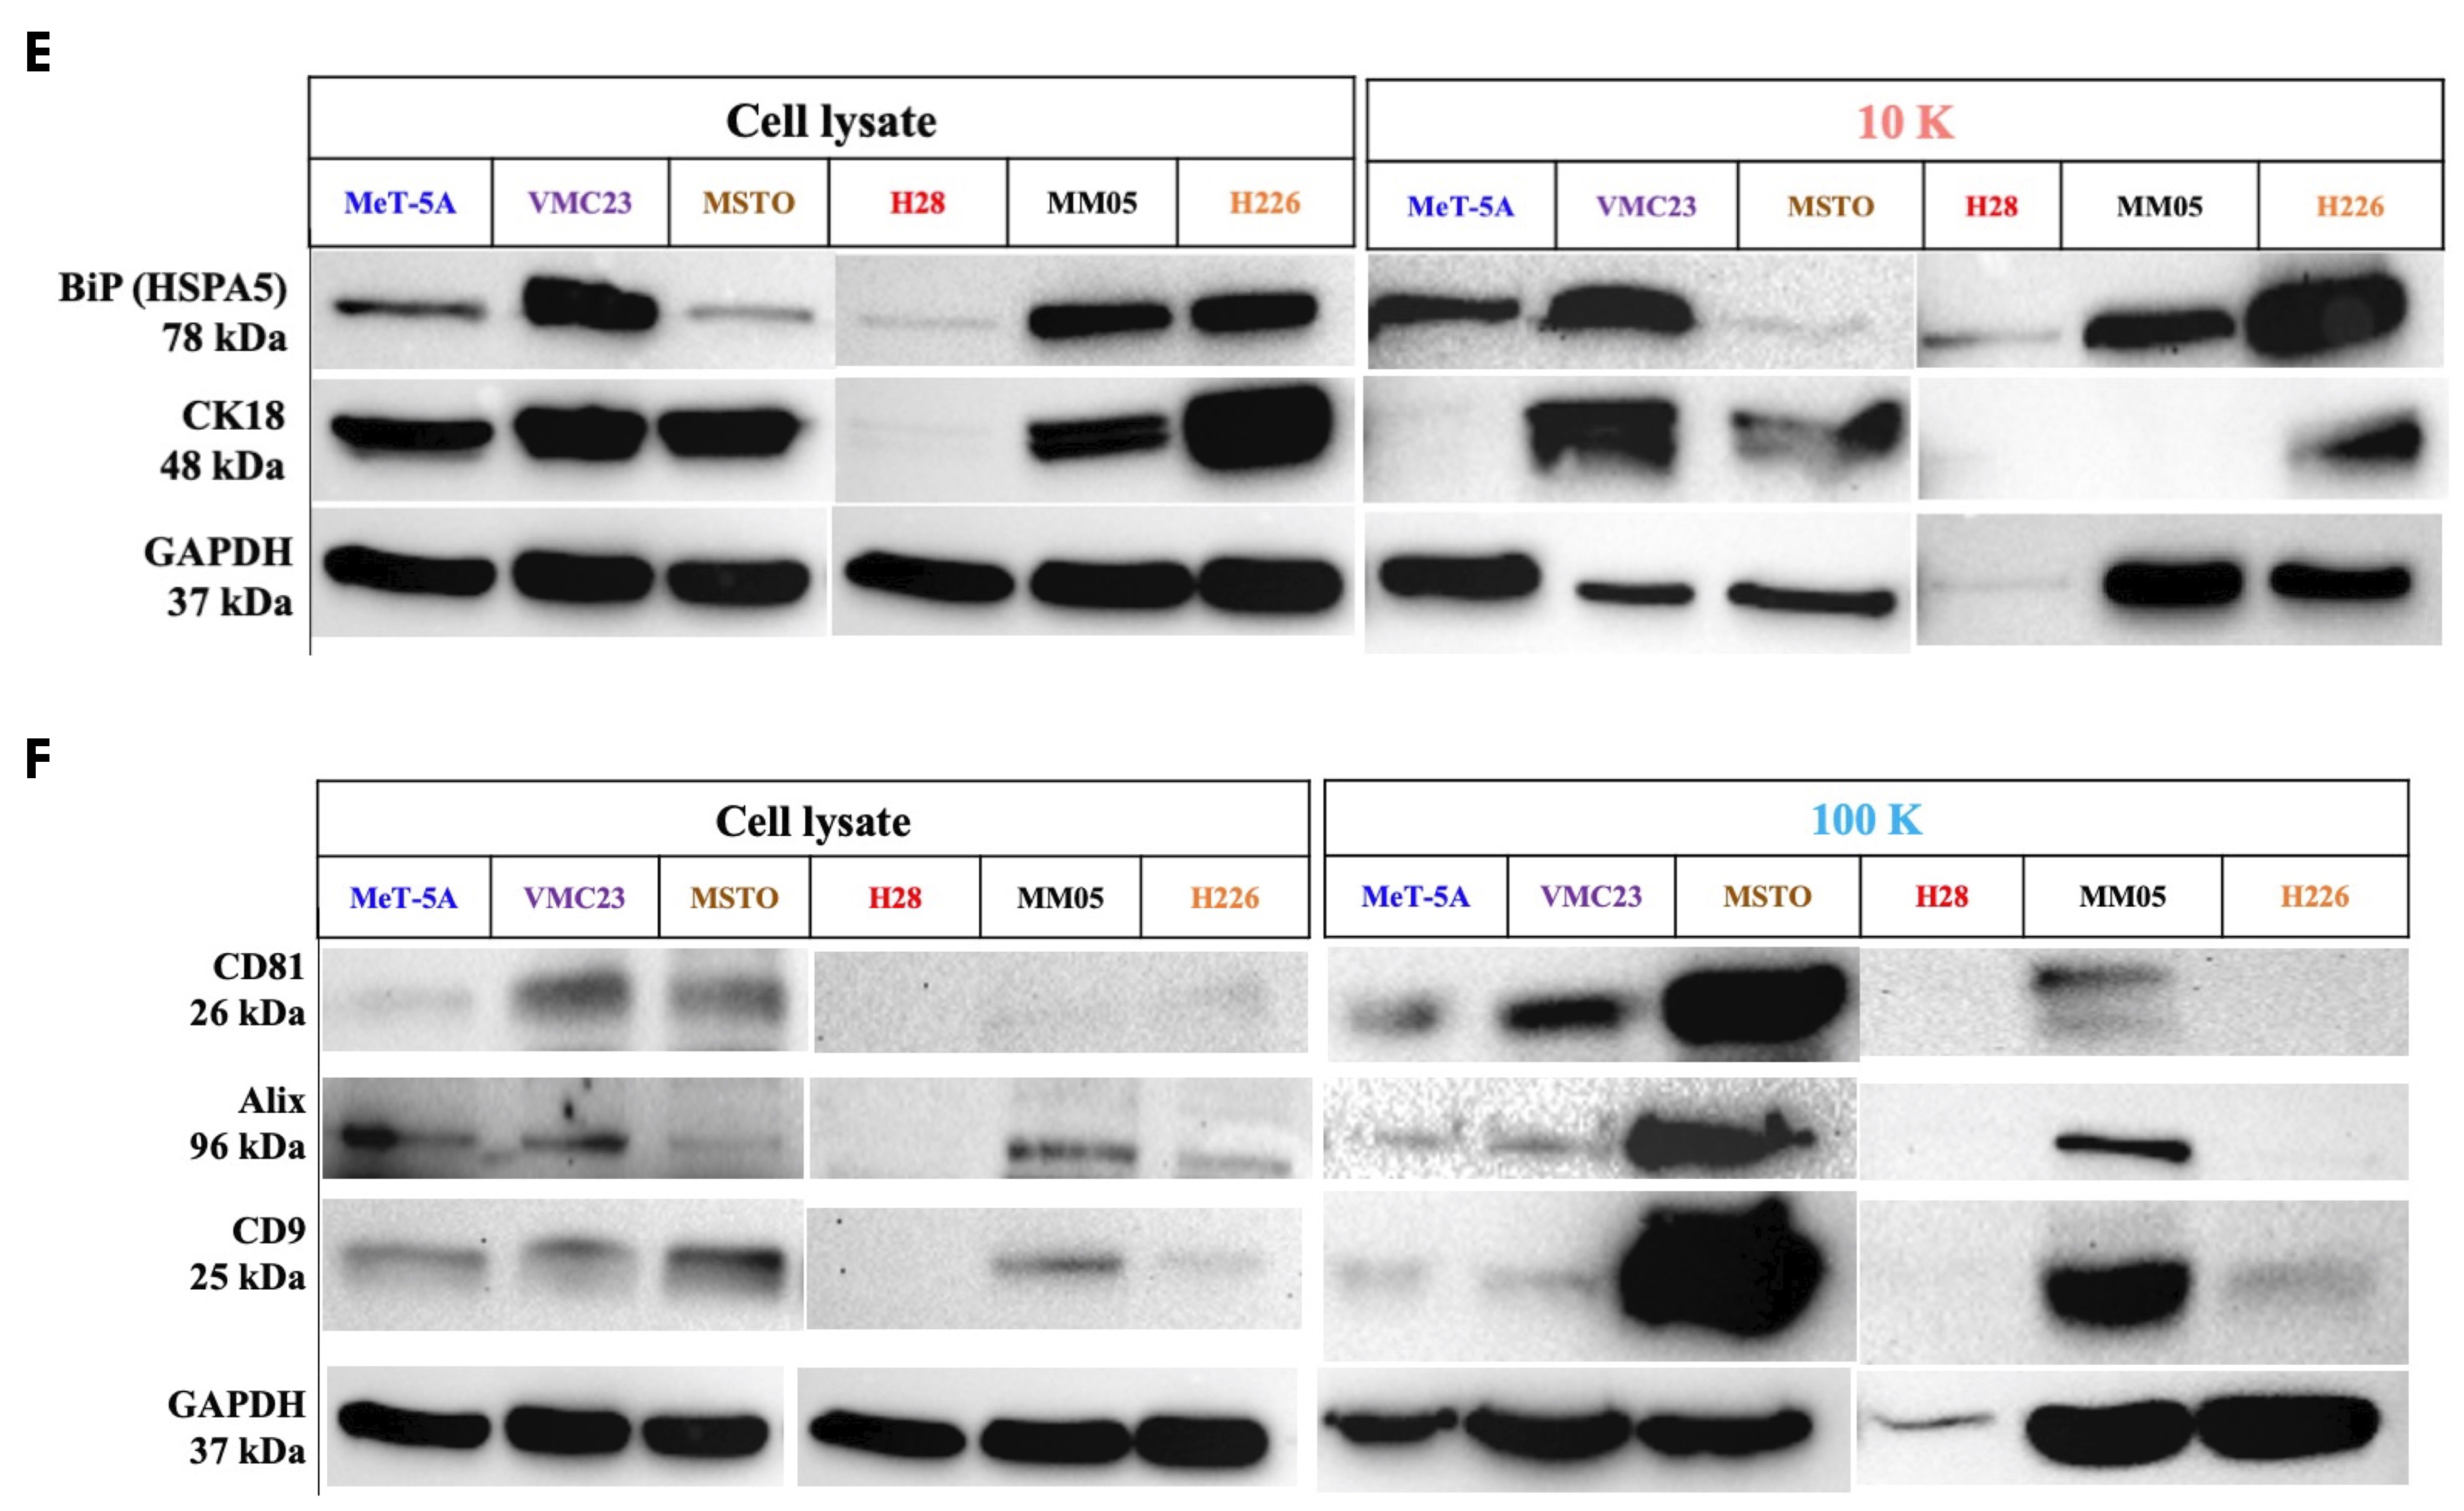
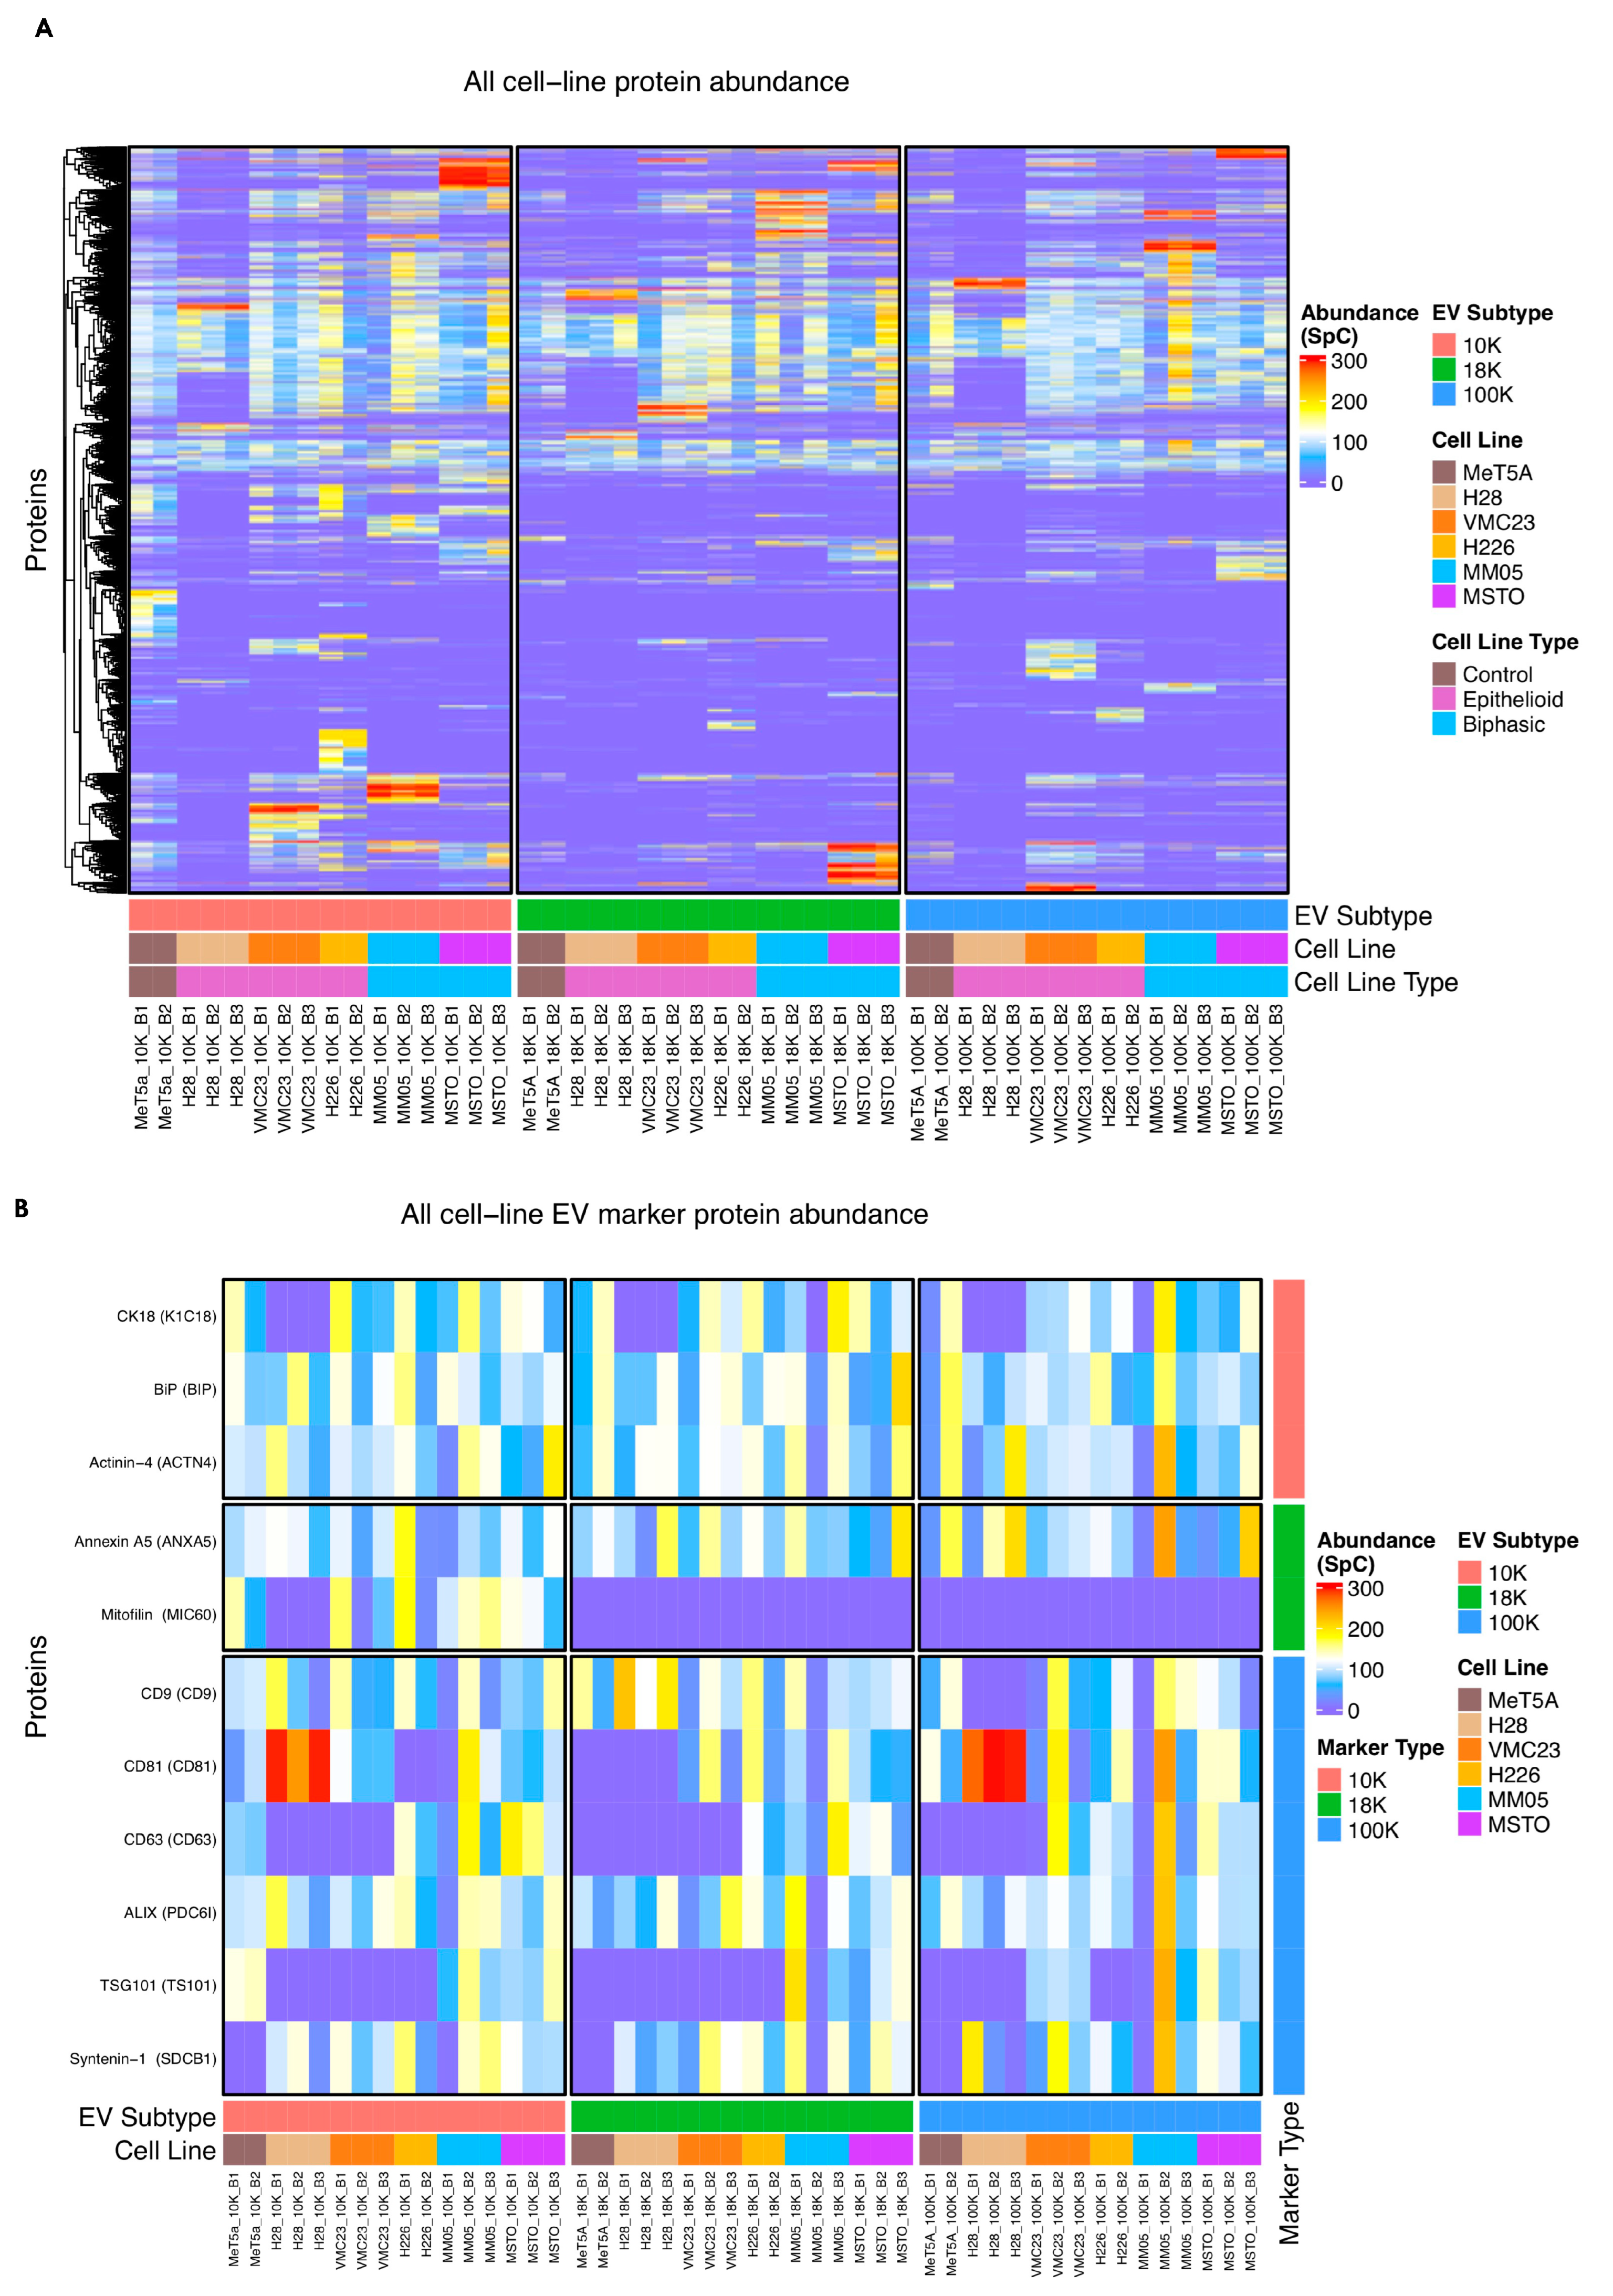
16]. They found mitofilin (a mitochondrial inner membrane protein) exclusively enriched in the large EVs. Similarly in our results, mitofilin was found only in the 10 K EVs derived from all but H28 cell lines, and absent across the 18 K and 100 K EVs derived from all cell lines, suggesting that it could potentially be a unique marker of 10 K EVs. We also detected HSPA5 (BiP) only in our 10 K EVs, whereas CK18 (previously reported as a marker of large oncosomes [
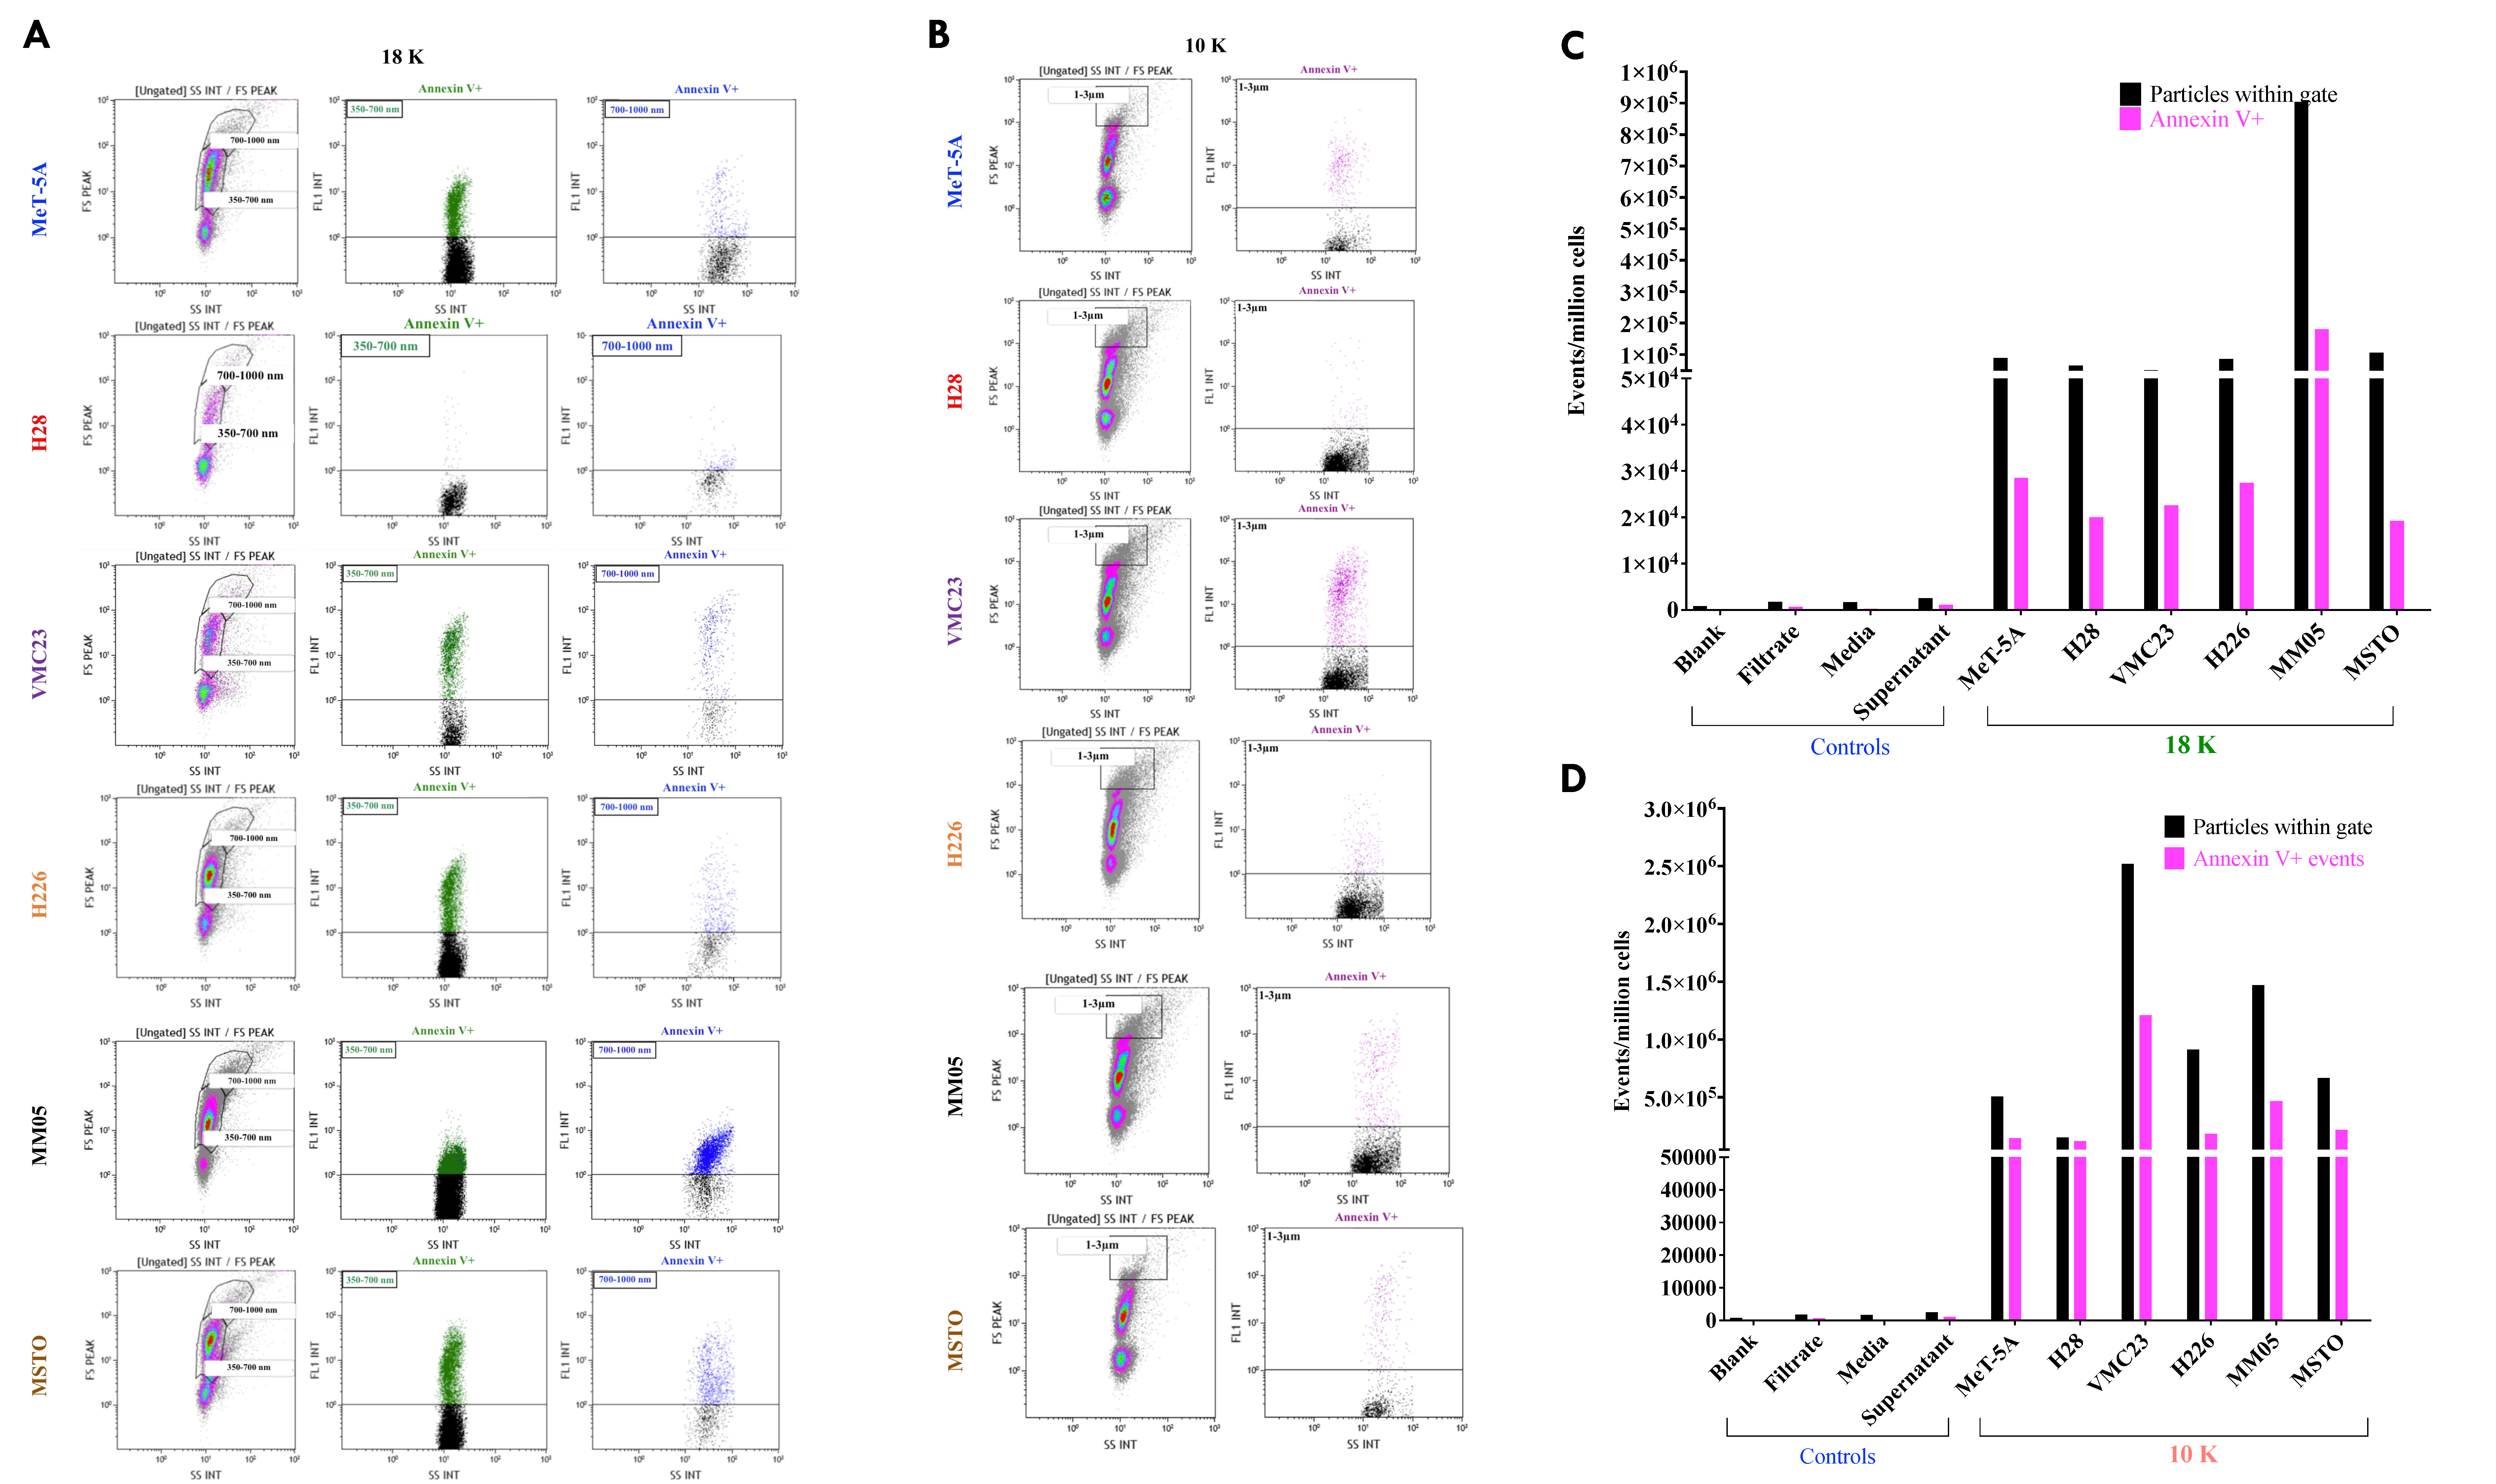
21]) was detected in some of our 10 K EVs and in some of our 100 K EVs. Our results suggest that mitofilin and BiP may be better markers of 10 K EVs. We further characterized 18 K and 10 K EVs using flow cytometry with the EVs stained with Annexin V, which has a high affinity to PS. PS is a phospholipid that is located on the inner membrane of cells or EVs and is translocated to the outer membrane in response to an event or stimuli, such as a vesicular event [118]. EVs, which form from blebbing or shedding of the plasma membrane, are typically characterized by the presence of PS on their outer membrane [119], which prompted us to further characterize 18 K and 10 K EVs using this technique.
For small EVs, tetraspanins including CD9, CD81, and CD63 have been commonly reported as markers of small EVs, or so-called exosomes. However, tetraspanins have been shown to induce plasma membrane curvature, making them present in shedding vesicles [120]. This may explain why we observed enrichment of CD9 in our 10 K EVs (Supplementary Figure S1). This is consistent with the results from Javadi et al. (2021), who conducted a proteomics study of EV subpopulations derived from pleural mesothelioma pleural effusion samples [121] and found enrichment of cell surface tetraspanins CD9 in their large EV pellet (isolated at 10,000× g for 10 min and referred to as microvesicles), and enrichment of CD81 in their small EV pellet (isolated 100,000× g for 90 min and referred to as exosomes). We also observed enrichment of CD81 in our 100 K EVs, suggesting that CD81 may be a better marker of 100 K EVs. It is noted that currently, there is no single marker that can uniquely identify EVs [122,123]. It should also be noted that EVs can also contain proteins that are considered pan-EV markers, i.e., they are common for most EV subtypes [123], and our results suggest that most of the commonly used EV markers could possibly be pan-EV markers. Our results also showed that the enriched biological processes and cellular processes are distinct in the 10 K EVs compared to 18 K and 100 K EV subtypes. Furthermore, our NTA and TEM results demonstrate that there is substantial overlap in the size of EVs across the three subtypes. This suggests that biogenesis pathway may be a better way of classifying EV subtypes, rather than by the size and the currently available makers.
The main strength of our study is that we performed a pooled analysis of potential biomarkers for pleural mesothelioma from five mesothelioma cell lines of different histological subtypes and an immortalized control cell line, each with at least two biological replicates, and two technical replicates within every biological sample. To our knowledge, this is the largest proteomics study conducted on EVs derived from mesothelioma cell lines to date. This study took a discovery approach to uncover the proteomic profile of pleural mesothelioma and identify a comprehensive list of markers that have cancer biomarker potential. We have revealed several oncogenic targets for mesothelioma, and while we have argued that each of the enriched proteins have associations with cancer pathogenesis from other reports, a follow-up study is strongly encouraged to validate the biomarker potential of each of the key targets discovered in this study for mesothelioma.
The other key strength of our study is that we studied potential biomarkers within different EV populations, which enabled us to reveal multiple targets and uncover the distinct roles of three EV subtypes. Our study opens a pathway of accessing key proteins of biomarker potential more directly from the oncogenic cargo of specific EV subtypes, rather than from a pooled pellet of EVs, or via invasive tissue extraction techniques. This would be a significant step towards improving biomarker access for pleural mesothelioma. We acknowledge that there is vast heterogeneity in the size and populations of EV subtypes that are still under research and not fully understood. In this study, we show that at least three EV subtypes can be isolated using different centrifugal forces, i.e., 10,000× g, 18,000× g and 100,000× g to isolate 10 K, 18 K, and 100 K EVs, respectively. These three subtypes showed many overlapping similarities, as well as many unique properties.
There were also limitations to our study that should be considered for future studies. Firstly, it is now recognized that the methods of EV isolation have limited association with the method of EV formation, and EV isolation protocols typically adopt a purification step. We chose not to use density gradient separation techniques for isolating 10 K and 18 K EVs but chose to use a sucrose cushion for isolating the 100 K EVs. While gradient separation techniques offer higher specificity and are intended to remove as many non-vesicular components and debris as possible, it is acknowledged that this technique is still under research, has the risk of producing low EV yield or recovery, and has not been optimized for 10 K and 18 K EVs. Therefore, we chose to isolate 18 K and 10 K using the differential centrifugation method, which was originally the primary EV isolation technique reported in the literature. This was to ensure that we capture a higher EV yield, at the risk of potentially compromising the purity of the EV pellets retrieved [
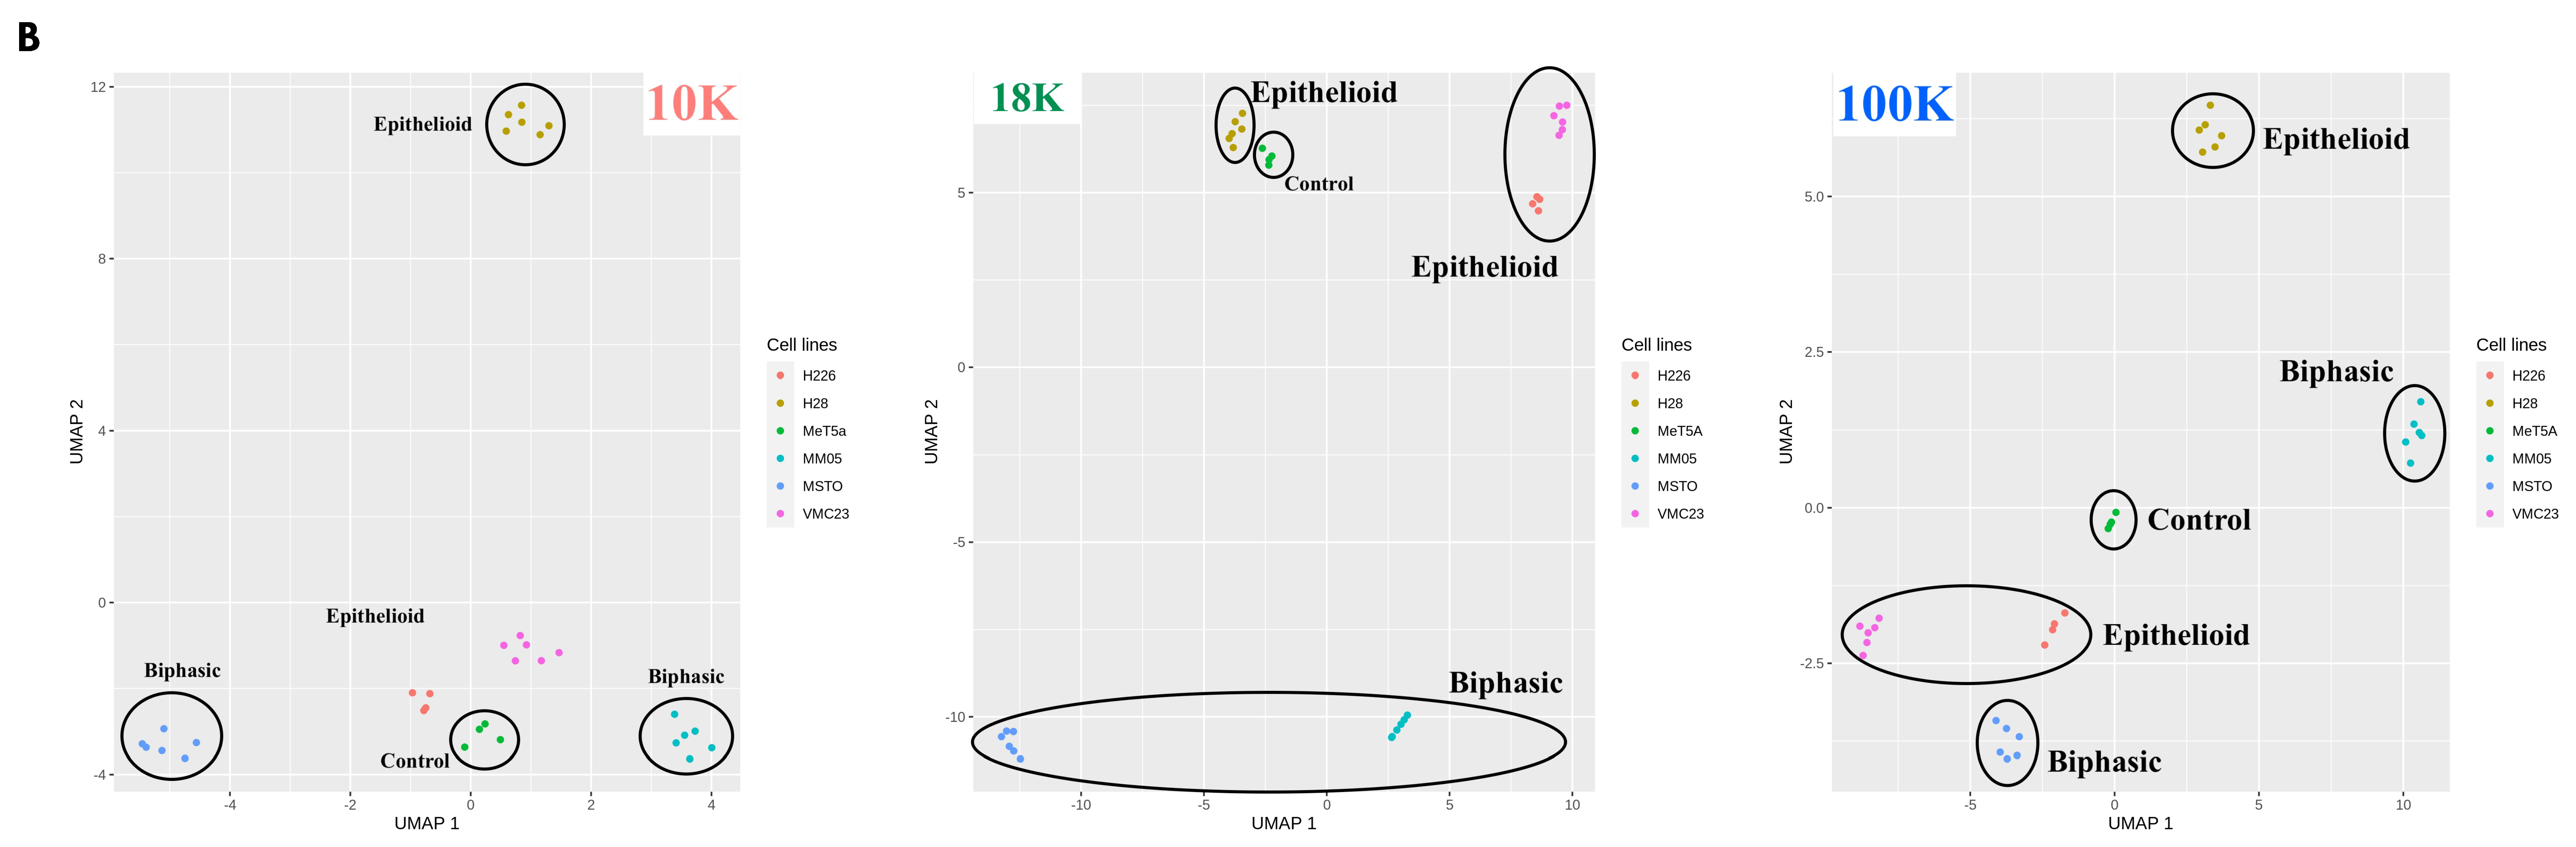
122]. Our isolation technique for 10 K and 18 K may have caused some of the overlap in the presence of surface EV markers we observed in both the large and small EV pellets. We were also limited with the NTA technology for the particle size distribution because large particles are less likely to be reliably detected by the NTA. Therefore, we were limited to a particle size of 1 μm in our current study and relied on flow cytometry with a specific membrane marker and gating strategy to detect larger-sized EVs. Further optimization of isolation techniques is needed for future EV studies. Despite this, our results showed a predominantly large EV population in our 10 K pellets, a relatively smaller EV population in our 18 K pellets, and small EV populations in our 100 K pellets. Furthermore, our UMAP plots show a clear separation between the three EV subtypes, indicating major differences in the cargo between 10 K, 18 K, and 100 K EVs. Furthermore, MeT-5A may not have been a robust control cell line for mesothelioma. MeT-5A is an immortalized cell line that has been transfected with the simian virus 40 (SV40), which has been proposed as a risk factor for mesothelioma [124]. Although a direct causal link between SV40 and human mesothelioma has not been established, future experiments should consider the use of a mesothelial control cell line without any confounding risk factors.
Given the lack of standardized nomenclature and isolation techniques for EVs, we avoided assigning naming conventions to our EV pellets. We were also limited with the NTA technology for the particle size distribution because large particles are less likely to be reliably detected using the NTA. Therefore, we were limited to a particle size of 1 µm in our current study and relied on flow cytometry with a specific membrane marker and gating strategy to detect larger-sized EVs. Improvements in EV technologies are needed to detect particles larger than 1 µm.
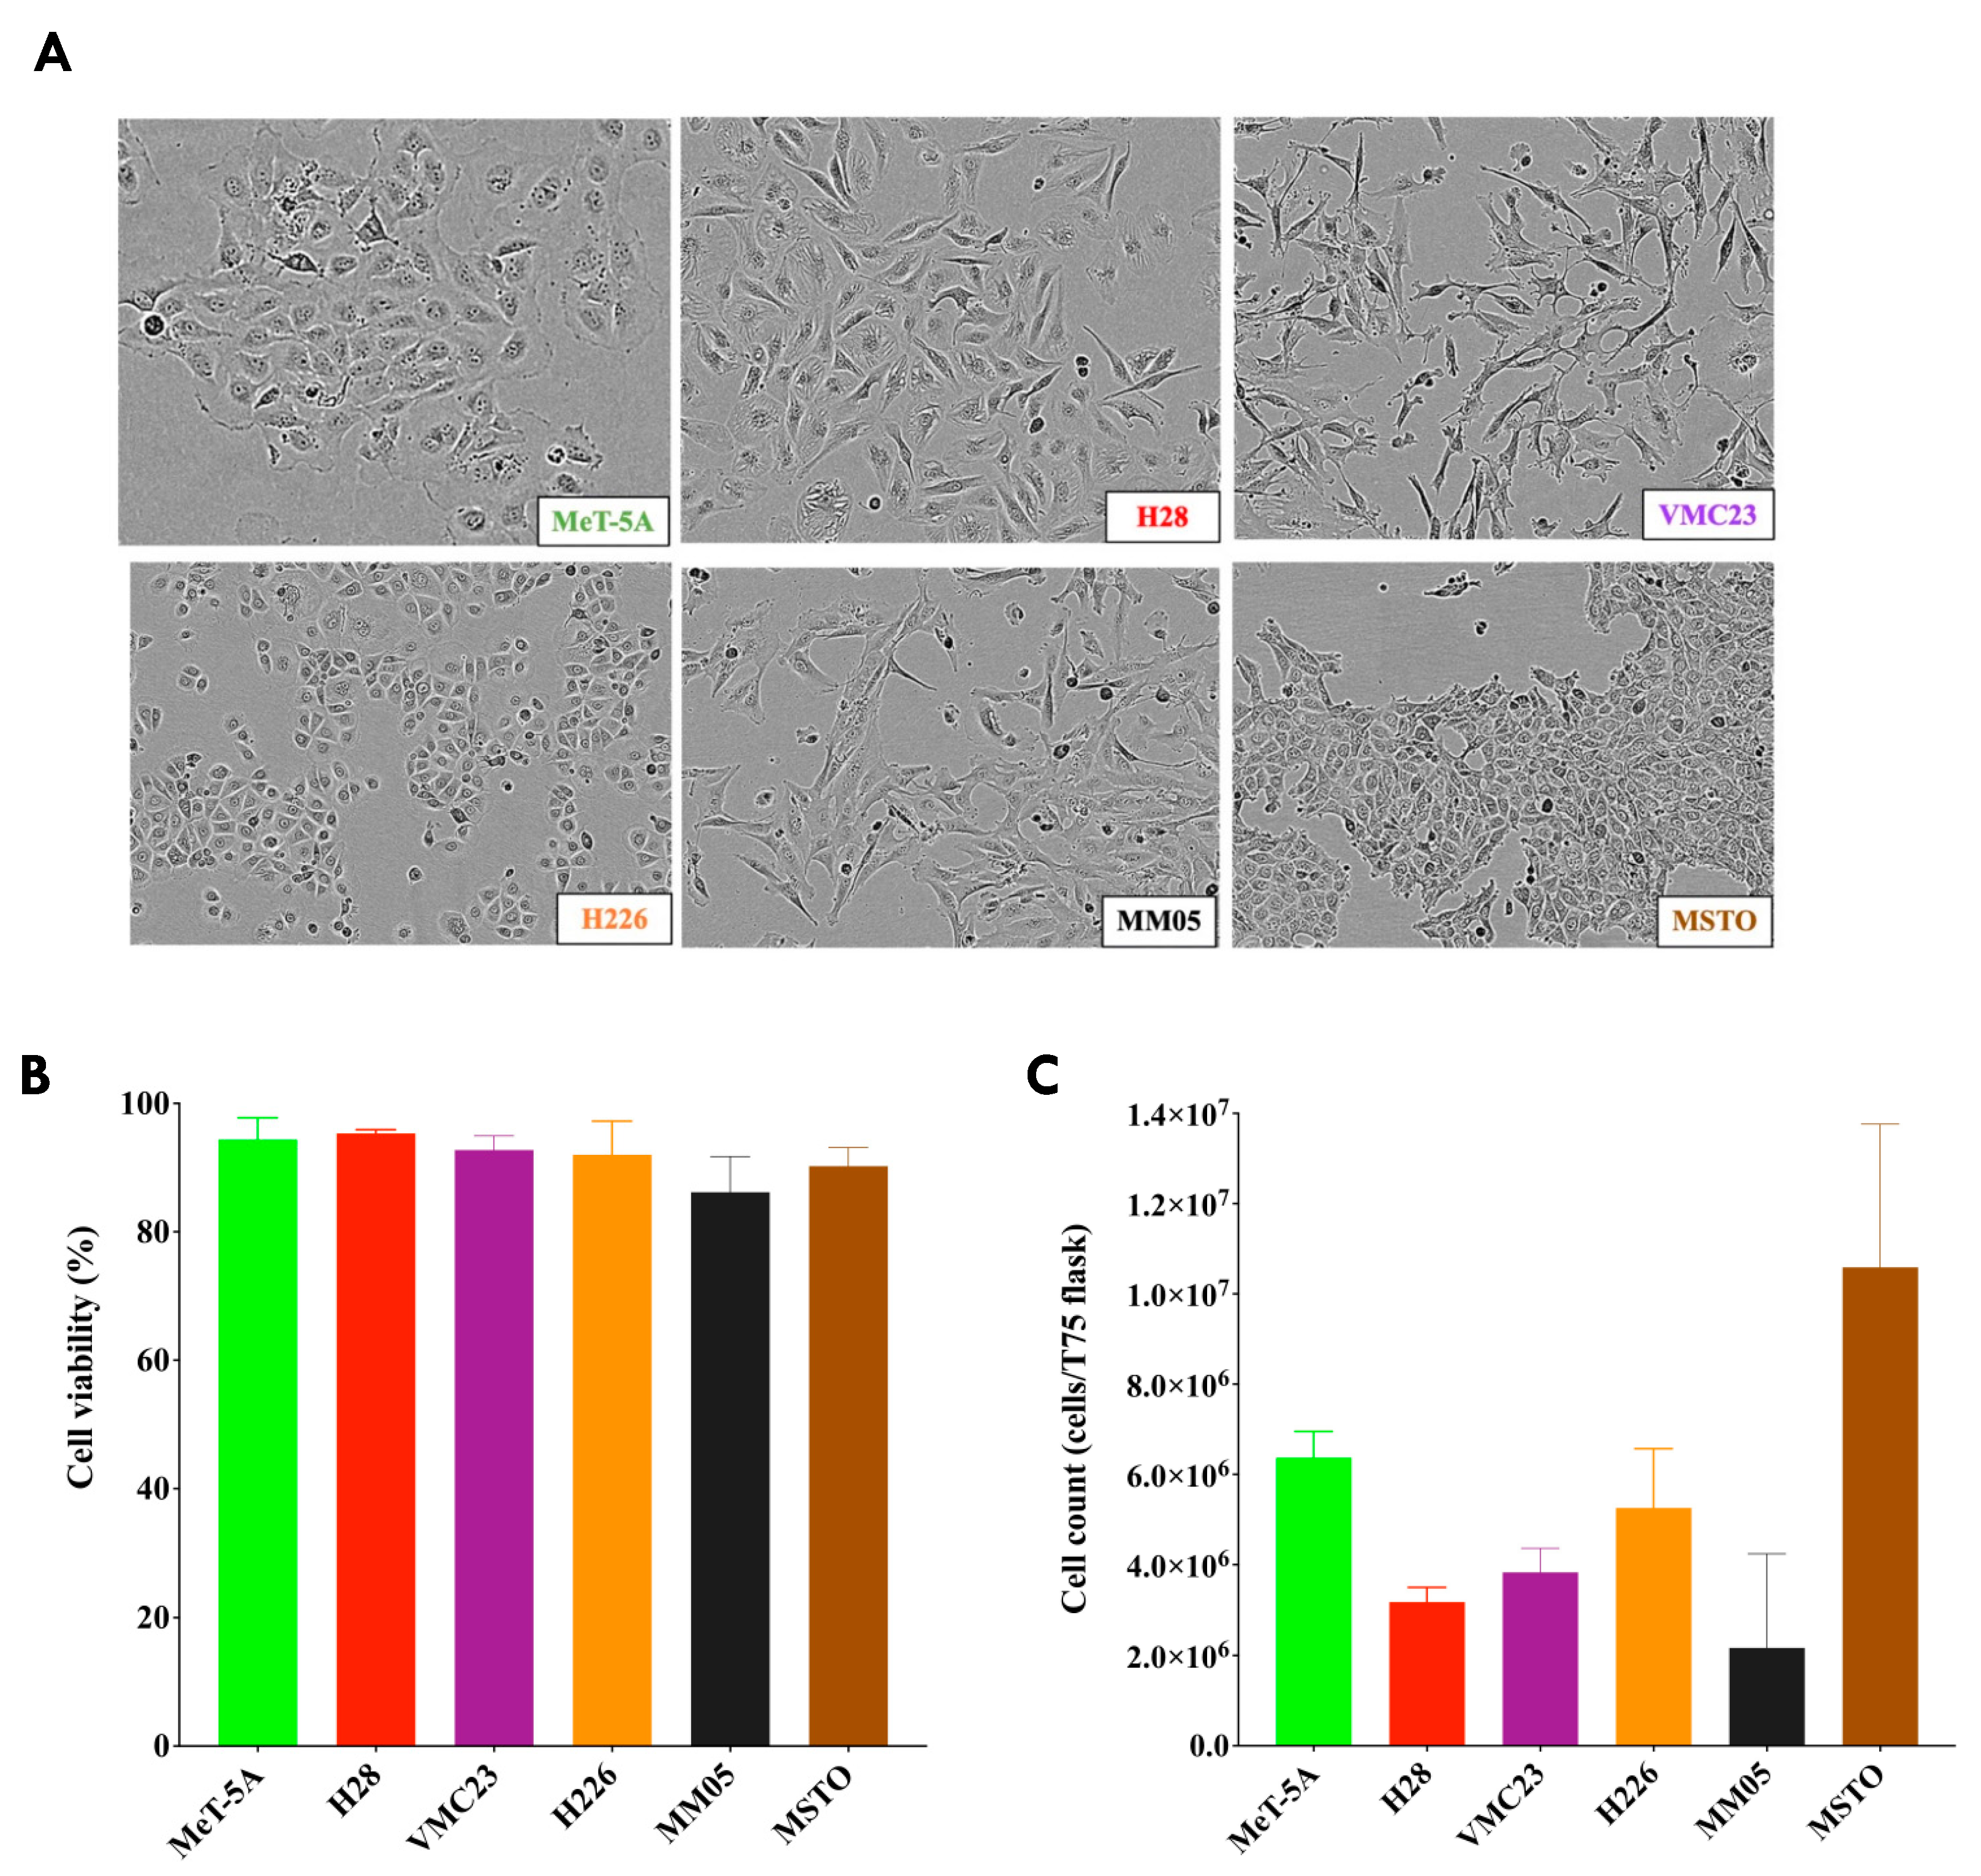
We note that the morphology of our cell lines did not represent the typical characteristics of epithelioid and non-epithelioid subtypes from pleural mesothelioma tumor histology. Epithelioid cells are typically round or polygonal, while sarcomatoid cells are spindle-like, and biphasic cells are a mixture of both. These characteristics have been observed in tissues from patient samples, whereas cells in culture may not be true representations of the histological subtypes of pleural mesothelioma as they are not in their ideal condition of cell growth. Therefore, we were unable to establish clear distinctions between epithelioid and non-epithelioid subtypes in our current study; however, our results encourage further research to investigate biomarkers unique to each subtype, perhaps from patient plasma or pleural effusion samples.

5. Conclusions

In summary, we have provided a comprehensive proteomic database of cancer associated proteins in EVs that can offer new targets for future biomarker studies in pleural mesothelioma. We have also demonstrated that different subtypes of EVs can be isolated, namely 10 K, 18 K, and 100 K, each carrying oncogenic cargo with biomarker potential for pleural mesothelioma. These distinct EV populations can help narrow the molecular targets for diagnostic, prognostic, and predictive biomarker studies. One of our major findings is the oncogenic cargo detected in our 10 K EVs, particularly the presence of established pleural mesothelioma biomarkers such as PD-L1 in our 10 K EVs, which warrants further biomarker validation studies. There is currently a predominant focus on exosomes or small EVs, and our study provides the basis to investigate other EV populations for biomarker studies in pleural mesothelioma.

Supplementary Materials

The following supporting information can be downloaded at: https://www.mdpi.com/article/10.3390/cancers15082364/s1. Figure S1: Western blot results for all markers in the large and small EV fractions across all cell lines used in the study. Table S1. Common proteins from this study and from mEXOS signature from Greening et al. (2016). File S1: Original blot.

Author Contributions

E.H.-B. conceptualized and designed the study with T.A. and supervised this project. T.A. performed the experiments, analyzed the results, and wrote the manuscript. A.V. conducted the statistical analysis and visualization that was performed using R for some of the proteomic data under the supervision of F.V., and composed Figure 4, Figure 5, Figure 6 and Figure 7. A.A. performed the IPA analysis and composed Figure 9. G.R., S.C., S.K. and G.E.G. provided suggestions on the project design and G.E.G. provided suggestions on the data presentation. All authors discussed the results, reviewed, and approved the manuscript for publication. All authors have read and agreed to the published version of the manuscript.

Funding

This research was funded by Turner Freeman Lawyers (to T.A., S.K. and E.H.-B.) and Dust Diseases Board competitive grant (to E.H.-B.). The views expressed herein are those of the authors and are not necessarily those of iCare or the Dust Diseases Board. T.A. received financial support from The University of Sydney while undertaking this study through the Research Training Program (RTP) Scholarship, Merit Award Supplementary Scholarship, Northern Precinct Ramsay Supplementary Scholarship, and the Paulette Isabel Jones PhD Completion Scholarship.

Institutional Review Board Statement

Not applicable.

Informed Consent Statement

Not applicable.

Data Availability Statement

The data presented in this study are available on request from the corresponding author.

Acknowledgments

We would like to thank YY Cheng from the Asbestos Diseases Research Institute for providing access to the cell lines used in this study. We also thank the University of Queensland Thoracic Research Centre (The Prince Charles Hospital, Brisbane, Australia), and Walter Berger (Institute of Cancer Research, Medical University of Vienna, Austria) for kindly providing MM05 and VMC23 cells, respectively. The authors acknowledge the facilities and the scientific and technical assistance of Sydney Analytical and Sydney Mass Spectrometry, which are core research facilities at The University of Sydney. The authors also acknowledge the instruments and expertise of Microscopy Australia at The University of Sydney, enabled by NCRIS, university, and state government support.

Conflicts of Interest

The authors declare no conflict of interest.

References

  1. Asciak, R.; George, V.; Rahman, N.M. Update on biology and management of mesothelioma. Eur. Respir. Rev. 2021, 30, 200226. [Google Scholar] [CrossRef] [PubMed]
  2. Brims, F. Epidemiology and Clinical Aspects of Malignant Pleural Mesothelioma. Cancers 2021, 13, 4194. [Google Scholar] [CrossRef] [PubMed]
  3. Zalcman, G.; Mazieres, J.; Margery, J.; Greillier, L.; Audigier-Valette, C.; Moro-Sibilot, D.; Molinier, O.; Corre, R.; Monnet, I.; Gounant, V.; et al. Bevacizumab for newly diagnosed pleural mesothelioma in the Mesothelioma Avastin Cisplatin Pemetrexed Study (MAPS): A randomised, controlled, open-label, phase 3 trial. Lancet 2016, 387, 1405–1414. [Google Scholar] [CrossRef] [PubMed]
  4. Baas, P.; Scherpereel, A.; Nowak, A.K.; Fujimoto, N.; Peters, S.; Tsao, A.S.; Mansfield, A.S.; Popat, S.; Jahan, T.; Antonia, S.; et al. First-line nivolumab plus ipilimumab in unresectable malignant pleural mesothelioma (CheckMate 743): A multicentre, randomised, open-label, phase 3 trial. Lancet 2021, 397, 375–386. [Google Scholar] [CrossRef] [PubMed]
  5. Cavone, D.; Caputi, A.; De Maria, L.; Cannone, E.; Mansi, F.; Birtolo, F.; Delfino, M.; Vimercati, L. Epidemiology of Mesothelioma. Environments 2019, 6, 76. [Google Scholar] [CrossRef]
  6. Kumar, A.; Prasad, M.N.V.; Maiti, S.K.; Tripti. Chapter 13—Asbestos: Resource Recovery and Its Waste Management. In Environmental Materials and Waste; Prasad, M.N.V., Shih, K., Eds.; Academic Press: Cambridge, MA, USA, 2016; pp. 285–305. [Google Scholar]
  7. Odgerel, C.O.; Takahashi, K.; Sorahan, T.; Driscoll, T.; Fitzmaurice, C.; Yoko, O.M.; Sawanyawisuth, K.; Furuya, S.; Tanaka, F.; Horie, S.; et al. Estimation of the global burden of mesothelioma deaths from incomplete national mortality data. Occup. Environ. Med. 2017, 74, 851–858. [Google Scholar] [CrossRef]
  8. Creaney, J.; Robinson, B.W.S. Malignant Mesothelioma Biomarkers: From Discovery to Use in Clinical Practice for Diagnosis, Monitoring, Screening, and Treatment. Chest 2017, 152, 143–149. [Google Scholar] [CrossRef]
  9. Kim, J.; Bhagwandin, S.; Labow, D.M. Malignant peritoneal mesothelioma: A review. Ann. Transl. Med. 2017, 5, 236. [Google Scholar] [CrossRef]
  10. Kindler, H.L.; Ismaila, N.; Armato, S.G., 3rd; Bueno, R.; Hesdorffer, M.; Jahan, T.; Jones, C.M.; Miettinen, M.; Pass, H.; Rimner, A.; et al. Treatment of Malignant Pleural Mesothelioma: American Society of Clinical Oncology Clinical Practice Guideline. Electronic 2018, 1527–7755. [Google Scholar]
  11. Oehl, K.; Vrugt, B.; Opitz, I.; Meerang, M. Heterogeneity in Malignant Pleural Mesothelioma. Int. J. Mol. Sci. 2018, 19, 1603. [Google Scholar] [CrossRef]
  12. Cantini, L.; Hassan, R.; Sterman, D.H.; Aerts, J. Emerging Treatments for Malignant Pleural Mesothelioma: Where Are We Heading? Front. Oncol. 2020, 10, 343. [Google Scholar] [CrossRef] [PubMed]
  13. Peters, S.; Scherpereel, A.; Cornelissen, R.; Oulkhouir, Y.; Greillier, L.; Kaplan, M.A.; Talbot, T.; Monnet, I.; Hiret, S.; Baas, P.; et al. First-line nivolumab plus ipilimumab versus chemotherapy in patients with unresectable malignant pleural mesothelioma: 3-year outcomes from CheckMate 743. Ann. Oncol. 2022, 33, 488–499. [Google Scholar] [CrossRef]
  14. Goricar, K.; Dolzan, V.; Lenassi, M. Extracellular Vesicles: A Novel Tool Facilitating Personalized Medicine and Pharmacogenomics in Oncology. Front. Pharm. 2021, 12, 671298. [Google Scholar] [CrossRef] [PubMed]
  15. Ciardiello, C.; Migliorino, R.; Leone, A.; Budillon, A. Large extracellular vesicles: Size matters in tumor progression. Cytokine Growth Factor. Rev. 2020, 51, 69–74. [Google Scholar] [CrossRef] [PubMed]
  16. Crescitelli, R.; Lasser, C.; Lotvall, J. Isolation and characterization of extracellular vesicle subpopulations from tissues. Nat. Protoc. 2021, 16, 1548–1580. [Google Scholar] [CrossRef] [PubMed]
  17. Gardiner, C.; Ferreira, Y.J.; Dragovic, R.A.; Redman, C.W.; Sargent, I.L. Extracellular vesicle sizing and enumeration by nanoparticle tracking analysis. J. Extracell. Vesicles 2013, 2, 19671. [Google Scholar] [CrossRef] [PubMed]
  18. Kara-Terki, L.; Treps, L.; Blanquart, C.; Fradin, D. Critical Roles of Tumor Extracellular Vesicles in the Microenvironment of Thoracic Cancers. Int. J. Mol. Sci. 2020, 21, 6024. [Google Scholar] [CrossRef]
  19. Burgos-Ravanal, R.; Campos, A.; Diaz-Vesga, M.C.; Gonzalez, M.F.; Leon, D.; Lobos-Gonzalez, L.; Leyton, L.; Kogan, M.J.; Quest, A.F.G. Extracellular Vesicles as Mediators of Cancer Disease and as Nanosystems in Theranostic Applications. Cancers 2021, 13, 3324. [Google Scholar] [CrossRef]
  20. Brennan, K.; Martin, K.; FitzGerald, S.P.; O’Sullivan, J.; Wu, Y.; Blanco, A.; Richardson, C.; Mc Gee, M.M. A comparison of methods for the isolation and separation of extracellular vesicles from protein and lipid particles in human serum. Sci. Rep. 2020, 10, 1039. [Google Scholar] [CrossRef]
  21. Minciacchi, V.R.; You, S.; Spinelli, C.; Morley, S.; Zandian, M.; Aspuria, P.J.; Cavallini, L.; Ciardiello, C.; Reis Sobreiro, M.; Morello, M.; et al. Large oncosomes contain distinct protein cargo and represent a separate functional class of tumor-derived extracellular vesicles. Oncotarget 2015, 6, 11327. [Google Scholar] [CrossRef]
  22. Chen, I.H.; Xue, L.; Hsu, C.C.; Paez, J.S.; Pan, L.; Andaluz, H.; Wendt, M.K.; Iliuk, A.B.; Zhu, J.K.; Tao, W.A. Phosphoproteins in extracellular vesicles as candidate markers for breast cancer. Proc. Natl. Acad. Sci. USA 2017, 114, 3175–3180. [Google Scholar] [CrossRef] [PubMed]
  23. Pankoui Mfonkeu, J.B.; Gouado, I.; Fotso Kuaté, H.; Zambou, O.; Amvam Zollo, P.H.; Grau, G.E.; Combes, V. Elevated cell-specific microparticles are a biological marker for cerebral dysfunctions in human severe malaria. PLoS ONE 2010, 5, e13415. [Google Scholar] [CrossRef] [PubMed]
  24. Stekhoven, D.J.; Bühlmann, P. MissForest-non-parametric missing value imputation for mixed-type data. Bioinformatics 2012, 28, 112–118. [Google Scholar] [CrossRef] [PubMed]
  25. Costa-Silva, J.; Domingues, D.; Lopes, F.A.-O. RNA-Seq differential expression analysis: An extended review and a software tool. PLoS ONE 2017, 12, e0190152. [Google Scholar] [CrossRef]
  26. Gu, Z.; Eils, R.; Schlesner, M. Complex heatmaps reveal patterns and correlations in multidimensional genomic data. Bioinformatics 2016, 32, 2847–2849. [Google Scholar] [CrossRef]
  27. Wickham, H. ggplot2: Elegant Graphics for Data Analysis; Springer: New York, NY, USA, 2016. [Google Scholar]
  28. Uematsu, K.; Kanazawa, S.; You, L.; He, B.; Xu, Z.; Li, K.; Peterlin, B.M.; McCormick, F.; Jablons, D.M.; Jablons, D.M. Wnt pathway activation in mesothelioma: Evidence of Dishevelled overexpression and transcriptional activity of beta-catenin. Cancer Res. 2003, 63, 4547–4551. [Google Scholar]
  29. Kaneko, N.; Kurata, M.; Yamamoto, T.; Morikawa, S.; Masumoto, J. The role of interleukin-1 in general pathology. Inflamm. Regen. 2019, 39, 12. [Google Scholar] [CrossRef]
  30. Yap, T.A.; Aerts, J.G.; Popat, S.; Fennell, D.A. Novel insights into mesothelioma biology and implications for therapy. Nat. Rev. Cancer 2017, 17, 475–488. [Google Scholar] [CrossRef]
  31. Zhu, C.; Wei, Y.; Wei, X. AXL receptor tyrosine kinase as a promising anti-cancer approach: Functions, molecular mechanisms and clinical applications. Mol. Cancer 2019, 18, 153. [Google Scholar] [CrossRef]
  32. Fucikova, J.; Spisek, R.; Kroemer, G.A.-O.; Galluzzi, L. Calreticulin and cancer. Cell. Res. 2021, 31, 5–16. [Google Scholar] [CrossRef]
  33. Zhou, Z.; Sun, B.; Nie, A.; Yu, D.; Bian, M. Roles of Aminoacyl-tRNA Synthetases in Cancer. Front. Cell. Dev. Biol. 2020, 8, 599765. [Google Scholar] [CrossRef] [PubMed]
  34. Hayano, M.; Yang, W.S.; Corn, C.K.; Pagano, N.C.; Stockwell, B.R. Loss of cysteinyl-tRNA synthetase (CARS) induces the transsulfuration pathway and inhibits ferroptosis induced by cystine deprivation. Cell. Death Differ. 2016, 23, 270–278. [Google Scholar] [CrossRef] [PubMed]
  35. Mang, J.; Korzeniewski, N.; Dietrich, D.; Sailer, V.; Tolstov, Y.; Searcy, S.; von Hardenberg, J.; Perner, S.; Kristiansen, G.; Marx, A.; et al. Prognostic Significance and Functional Role of CEP57 in Prostate Cancer. Transl. Oncol. 2015, 8, 487–496. [Google Scholar] [CrossRef] [PubMed]
  36. Lin, P.; Tian, P.; Pang, J.; Lai, L.; He, G.; Song, Y.; Zheng, Y. Clinical significance of COL1A1 and COL1A2 expression levels in hypopharyngeal squamous cell carcinoma. Oncol. Lett. 2020, 20, 803–809. [Google Scholar] [CrossRef] [PubMed]
  37. Cannarile, M.A.; Weisser, M.; Jacob, W.; Jegg, A.M.; Ries, C.H.; Ruttinger, D. Colony-stimulating factor 1 receptor (CSF1R) inhibitors in cancer therapy. J. Immunother. Cancer 2017, 5, 53. [Google Scholar] [CrossRef] [PubMed]
  38. Gottardi, C.J.; Gumbiner, B.M. Distinct molecular forms of beta-catenin are targeted to adhesive or transcriptional complexes. J. Cell. Biol. 2004, 167, 339–349. [Google Scholar] [CrossRef]
  39. Roy, N.; Bagchi, S.; Raychaudhuri, P. Damaged DNA binding protein 2 in reactive oxygen species (ROS) regulation and premature senescence. Int. J. Mol. Sci. 2012, 13, 11012–11026. [Google Scholar] [CrossRef]
  40. Fuller-Pace, F.V. DEAD box RNA helicase functions in cancer. RNA Biol. 2013, 10, 121–132. [Google Scholar] [CrossRef]
  41. Normanno, N.; De Luca, A.; Bianco, C.; Strizzi, L.; Mancino, M.; Maiello, M.R.; Carotenuto, A.; De Feo, G.; Caponigro, F.; Salomon, D.S. Epidermal growth factor receptor (EGFR) signaling in cancer. Gene 2006, 366, 2–16. [Google Scholar] [CrossRef]
  42. Gomes-Duarte, A.; Lacerda, R.; Menezes, J.; Romao, L. eIF3: A factor for human health and disease. RNA Biol. 2018, 15, 26–34. [Google Scholar] [CrossRef]
  43. Noda, D.; Itoh, S.; Watanabe, Y.; Inamitsu, M.; Dennler, S.; Itoh, F.; Koike, S.; Danielpour, D.; ten Dijke, P.; Kato, M. ELAC2, a putative prostate cancer susceptibility gene product, potentiates TGF-beta/Smad-induced growth arrest of prostate cells. Oncogene 2006, 25, 5591–5600. [Google Scholar] [CrossRef] [PubMed]
  44. Xiao, T.; Xiao, Y.; Wang, W.; Tang, Y.Y.; Xiao, Z.; Su, M. Targeting EphA2 in cancer. J. Hematol. Oncol. 2020, 13, 114. [Google Scholar] [CrossRef] [PubMed]
  45. Kerselidou, D.; Dohai, B.S.; Nelson, D.R.; Daakour, S.; De Cock, N.; Hassoun, Z.A.O.; Kim, D.K.; Olivet, J.; El Assal, D.C.; Jaiswal, A.; et al. Alternative glycosylation controls endoplasmic reticulum dynamics and tubular extension in mammalian cells. Sci. Adv. 2021, 7, eabe8349. [Google Scholar] [CrossRef] [PubMed]
  46. Sethi, S.; Madden, B.J.; Debiec, H.; Charlesworth, M.C.; Gross, L.; Ravindran, A.; Hummel, A.M.; Specks, U.; Fervenza, F.C.; Ronco, P. Exostosin 1/Exostosin 2-Associated Membranous Nephropathy. J. Am. Soc. Nephrol. 2019, 30, 1123–1136. [Google Scholar] [CrossRef]
  47. Argraves, W.S.; Tanaka, A.; Smith, E.P.; Twal, W.O.; Argraves, K.M.; Fan, D.; Haudenschild, C. Fibulin-1 and fibrinogen in human atherosclerotic lesions. Histochem. Cell. Biol. 2009, 132, 559–565. [Google Scholar] [CrossRef]
  48. Yogev, O.; Yogev, O.; Singer, E.; Shaulian, E.; Goldberg, M.; Fox, T.D.; Pines, O. Fumarase: A mitochondrial metabolic enzyme and a cytosolic/nuclear component of the DNA damage response. PLoS Biol. 2010, 8, e1000328. [Google Scholar] [CrossRef]
  49. Han, S.; Cui, C.; Zhao, X.; Zhang, Y.; Zhang, Y.; Zhao, J.; Shen, X.; He, H.; Wang, J.; Ma, M.; et al. Filamin C regulates skeletal muscle atrophy by stabilizing dishevelled-2 to inhibit autophagy and mitophagy. Mol. Ther. Nucleic Acids 2022, 27, 147–164. [Google Scholar] [CrossRef]
  50. Vance, C.; Rogelj, B.; Hortobágyi, T.; De Vos, K.J.; Nishimura, A.L.; Sreedharan, J.; Hu, X.; Smith, B.; Ruddy, D.; Wright, P.; et al. Mutations in FUS, an RNA processing protein, cause familial amyotrophic lateral sclerosis type 6. Science 2009, 323, 1208–1211. [Google Scholar] [CrossRef]
  51. Saade, M.; Araujo de Souza, G.; Scavone, C.; Kinoshita, P.F. The Role of GPNMB in Inflammation. Front. Immunol. 2021, 12, 674739. [Google Scholar] [CrossRef]
  52. Zhang, Z.; Zhang, Y.; Xia, S.; Kong, Q.; Li, S.; Liu, X.; Junqueira, C.; Meza-Sosa, K.F.; Mok, T.M.Y.; Ansara, J.; et al. Gasdermin E suppresses tumour growth by activating anti-tumour immunity. Nature 2020, 579, 415–420. [Google Scholar] [CrossRef]
  53. Kallappagoudar, S.; Yadav, R.K.; Lowe, B.R.; Partridge, J.F. Histone H3 mutations--a special role for H3.3 in tumorigenesis? Chromosoma 2015, 124, 177–189. [Google Scholar] [CrossRef] [PubMed]
  54. Mirzapoiazova, T.; Mambetsariev, N.; Lennon, F.E.; Mambetsariev, B.; Berlind, J.E.; Salgia, R.; Singleton, P.A. HABP2 is a Novel Regulator of Hyaluronan-Mediated Human Lung Cancer Progression. Front. Oncol. 2015, 5, 164. [Google Scholar] [CrossRef]
  55. Fujii, T.; Khawaja, M.R.; DiNardo, C.D.; Atkins, J.T.; Janku, F. Targeting isocitrate dehydrogenase (IDH) in cancer. Discov. Med. 2016, 21, 373–380. [Google Scholar] [PubMed]
  56. Li, X.; Ni, R.; Chen, J.; Liu, Z.; Xiao, M.; Jiang, F.; Lu, C. The presence of IGHG1 in human pancreatic carcinomas is associated with immune evasion mechanisms. Pancreas 2011, 40, 753–761. [Google Scholar] [CrossRef] [PubMed]
  57. Pan, B.; Zheng, S.; Liu, C.; Xu, Y. Suppression of IGHG1 gene expression by siRNA leads to growth inhibition and apoptosis induction in human prostate cancer cell. Mol. Biol. Rep. 2012, 40, 27–33. [Google Scholar] [CrossRef] [PubMed]
  58. Chu, J.; Li, Y.; Deng, Z.; Zhang, Z.; Xie, Q.; Zhang, H.; Zhong, W.; Pan, B. IGHG1 Regulates Prostate Cancer Growth via the MEK/ERK/c-Myc Pathway. BioMed Res. Int. 2019, 2019, 7201562. [Google Scholar] [CrossRef]
  59. Lennartsson, J.; Rönnstrand, L. Stem cell factor receptor/c-Kit: From basic science to clinical implications. Physiol. Rev. 2012, 92, 1619–1649. [Google Scholar] [CrossRef]
  60. Blow, J.J.; Gillespie, P.J. Replication licensing and cancer—A fatal entanglement? Nat. Rev. Cancer 2008, 8, 799–806. [Google Scholar] [CrossRef]
  61. Cecchi, F.; Rabe, D.C.; Bottaro, D.P. The Hepatocyte Growth Factor Receptor: Structure, Function and Pharmacological Targeting in Cancer. Curr. Signal. Transduct. Ther. 2011, 6, 146–151. [Google Scholar] [CrossRef]
  62. Zubair, M.; Hamzah, R.; Griffin, R.; Ali, N. Identification and functional characterization of multiple inositol polyphosphate phosphatase1 (Minpp1) isoform-2 in exosomes with potential to modulate tumor microenvironment. PLoS ONE 2022, 17, e0264451. [Google Scholar] [CrossRef]
  63. Castelletti, L.; Yeo, D.; van Zandwijk, N.; Rasko, J.E.J. Anti-Mesothelin CAR T cell therapy for malignant mesothelioma. Biomark. Res. 2021, 9, 11. [Google Scholar] [CrossRef] [PubMed]
  64. Li, Y.; Wang, Y.; Wu, P. 5′-Methylthioadenosine and Cancer: Old molecules, new understanding. J. Cancer 2019, 10, 927–936. [Google Scholar] [CrossRef] [PubMed]
  65. MacFarlane, A.J.; Perry, C.A.; McEntee, M.F.; Lin, D.M.; Stover, P.J. Mthfd1 is a modifier of chemically induced intestinal carcinogenesis. Carcinogenesis 2011, 32, 427–433. [Google Scholar] [CrossRef] [PubMed]
  66. Farooqi, A.A.; Siddik, Z.H. Platelet-derived growth factor (PDGF) signalling in cancer: Rapidly emerging signalling landscape. Cell. Biochem. Funct. 2015, 33, 257–265. [Google Scholar] [CrossRef]
  67. Bossis, I.; Stratakis, C.A. Minireview: PRKAR1A: Normal and Abnormal Functions. Endocrinology 2004, 145, 5452–5458. [Google Scholar] [CrossRef]
  68. Si, Q.; Sun, S.; Gu, Y. A278C mutation of dihydropteridine reductase decreases autophagy via mTOR signaling. Acta Biochim. Et. Biophys. Sin. 2017, 49, 706–712. [Google Scholar] [CrossRef]
  69. Fernandez-Pisonero, I.; Clavain, L.; Robles-Valero, J.; Lorenzo-Martin, L.F.; Caloto, R.; Nieto, B.; Garcia-Macias, C.; Oeste, C.L.; Sanchez-Martin, M.; Abad, A.; et al. A hotspot mutation targeting the R-RAS2 GTPase acts as a potent oncogenic driver in a wide spectrum of tumors. Cell. Rep. 2022, 38, 110522. [Google Scholar] [CrossRef]
  70. Abouelasrar Salama, S.; De Bondt, M.; De Buck, M.; Berghmans, N.; Proost, P.; Oliveira, V.L.S.; Amaral, F.A.; Gouwy, M.; Van Damme, J.; Struyf, S. Serum Amyloid A1 (SAA1) Revisited: Restricted Leukocyte-Activating Properties of Homogeneous SAA1. Front. Immunol. 2020, 11, 843. [Google Scholar] [CrossRef]
  71. Aspuria, P.-J.P.; Lunt, S.Y.; Väremo, L.; Vergnes, L.; Gozo, M.; Beach, J.A.; Salumbides, B.; Reue, K.; Wiedemeyer, W.R.; Nielsen, J.; et al. Succinate dehydrogenase inhibition leads to epithelial-mesenchymal transition and reprogrammed carbon metabolism. Cancer Metab. 2014, 2, 21. [Google Scholar] [CrossRef]
  72. Rustin, P.; Munnich, A.; Rötig, A. Succinate dehydrogenase and human diseases: New insights into a well-known enzyme. Eur. J. Hum. Genet. 2002, 10, 289–291. [Google Scholar] [CrossRef]
  73. Jing, J.; Wang, B.; Liu, P. The Functional Role of SEC23 in Vesicle Transportation, Autophagy and Cancer. Int. J. Biol. Sci. 2019, 15, 2419–2426. [Google Scholar] [CrossRef] [PubMed]
  74. Leão, R.; Apolónio, J.D.; Lee, D.; Figueiredo, A.; Tabori, U.; Castelo-Branco, P. Mechanisms of human telomerase reverse transcriptase (hTERT) regulation: Clinical impacts in cancer. J. Biomed. Sci. 2018, 25, 22. [Google Scholar] [CrossRef] [PubMed]
  75. Sheng, Y.; Li, F.; Qin, Z. TNF Receptor 2 Makes Tumor Necrosis Factor a Friend of Tumors. Front. Immunol. 2018, 9, 1170. [Google Scholar] [CrossRef]
  76. Snow, C.J.; Paschal, B.M. Roles of the nucleoporin Tpr in cancer and aging. In Cancer Biology and the Nuclear Envelope: Recent Advances May Elucidate Past Paradoxes; Springer: Berlin/Heidelberg, Germany, 2014; Volume 773, pp. 309–322. [Google Scholar]
  77. Hu, H.; Nan, J.; Sun, Y.; Zhu, D.; Xiao, C.; Wang, Y.; Zhu, L.; Wu, Y.; Zhao, J.; Wu, R.; et al. Electron leak from NDUFA13 within mitochondrial complex I attenuates ischemia-reperfusion injury via dimerized STAT3. Proc. Natl. Acad. Sci. USA 2017, 114, 11908–11913. [Google Scholar] [CrossRef] [PubMed]
  78. He, S.; Lu, Y.; Liu, X.; Huang, X.; Keller, E.T.; Qian, C.-N.; Zhang, J. Wnt3a: Functions and implications in cancer. Chin. J. Cancer 2015, 34, 50. [Google Scholar] [CrossRef] [PubMed]
  79. Wenzel, J.; Rose, K.; Haghighi, E.B.; Lamprecht, C.; Rauen, G.; Freihen, V.; Kesselring, R.; Boerries, M.; Hecht, A. Loss of the nuclear Wnt pathway effector TCF7L2 promotes migration and invasion of human colorectal cancer cells. Oncogene 2020, 39, 3893–3909. [Google Scholar] [CrossRef] [PubMed]
  80. Tsukasaki, K.; Miller, C.W.; Greenspun, E.; Eshaghian, S.; Kawabata, H.; Fujimoto, T.; Tomonaga, M.; Sawyers, C.; Said, J.W.; Koeffler, H.P. Mutations in the mitotic check point gene, MAD1L1, in human cancers. Oncogene 2001, 20, 3301–3305. [Google Scholar] [CrossRef]
  81. Yamada, A.; Arakaki, R.; Saito, M.; Kudo, Y.; Ishimaru, N. Dual Role of Fas/FasL-Mediated Signal in Peripheral Immune Tolerance. Front. Immunol. 2017, 8, 403. [Google Scholar] [CrossRef]
  82. Shi, A.; Chen, C.C.; Banerjee, R.; Glodowski, D.; Audhya, A.; Rongo, C.; Grant, B.D. EHBP-1 functions with RAB-10 during endocytic recycling in Caenorhabditis elegans. Mol. Biol. Cell. 2010, 21, 2930–2943. [Google Scholar] [CrossRef]
  83. Ao, X.; Liu, Y.; Bai, X.Y.; Qu, X.; Xu, Z.; Hu, G.; Chen, M.; Wu, H. Association between EHBP1 rs721048(A>G) polymorphism and prostate cancer susceptibility: A meta-analysis of 17 studies involving 150,678 subjects. OncoTargets Ther. 2015, 8, 1671–1680. [Google Scholar]
  84. Christianson, J.; Oxford, J.T.; Jorcyk, C.L. Emerging Perspectives on Leukemia Inhibitory Factor and its Receptor in Cancer. Front. Oncol. 2021, 11, 693724. [Google Scholar] [CrossRef] [PubMed]
  85. Wang, T.; Baron, M.; Trump, D. An overview of Notch3 function in vascular smooth muscle cells. Prog. Biophys. Mol. Biol. 2008, 96, 499–509. [Google Scholar] [CrossRef] [PubMed]
  86. An, E.A.-O.; Brognard, J. Orange is the new black: Kinases are the new master regulators of tumor suppression. IUBMB Life 2018, 71, 738–748. [Google Scholar] [CrossRef] [PubMed]
  87. Morris, R.; Kershaw, N.J.; Babon, J.A.-O. The molecular details of cytokine signaling via the JAK/STAT pathway. Protein Sci. 2018, 27, 1984–2009. [Google Scholar] [CrossRef]
  88. Gong, Z.; Kim, J.E.; Leung, C.C.; Glover, J.N.; Chen, J. BACH1/FANCJ acts with TopBP1 and participates early in DNA replication checkpoint control. Mol. Cell. 2010, 37, 438–446. [Google Scholar] [CrossRef]
  89. Ahmadzada, T.; Lee, K.; Clarke, C.; Cooper, W.A.; Linton, A.; McCaughan, B.; Asher, R.; Clarke, S.; Reid, G.; Kao, S. High BIN1 expression has a favorable prognosis in malignant pleural mesothelioma and is associated with tumor infiltrating lymphocytes. Lung Cancer 2019, 130, 35–41. [Google Scholar] [CrossRef]
  90. Greening, D.W.; Ji, H.; Chen, M.; Robinson, B.W.; Dick, I.M.; Creaney, J.; Simpson, R.J. Secreted primary human malignant mesothelioma exosome signature reflects oncogenic cargo. Sci. Rep. 2016, 6, 32643. [Google Scholar] [CrossRef]
  91. Qi, H.; Liu, S.; Guo, C.; Wang, J.; Greenaway, F.T.; Sun, M.Z. Role of annexin A6 in cancer. Oncol. Lett. 2015, 10, 1947–1952. [Google Scholar] [CrossRef]
  92. Mohamedi, Y.; Fontanil, T.; Cal, S.; Cobo, T.; Obaya, A.J. ADAMTS-12: Functions and Challenges for a Complex Metalloprotease. Front. Mol. Biosci. 2021, 8, 686763. [Google Scholar] [CrossRef]
  93. Chen, D.; Tang, T.-X.; Deng, H.; Yang, X.-P.; Tang, Z.-H. Interleukin-7 Biology and Its Effects on Immune Cells: Mediator of Generation, Differentiation, Survival, and Homeostasis. Front. Immunol. 2021, 12, 5156. [Google Scholar] [CrossRef]
  94. Roy, S.; Bag, A.K.; Singh, R.K.; Talmadge, J.E.; Batra, S.K.; Datta, K. Multifaceted Role of Neuropilins in the Immune System: Potential Targets for Immunotherapy. Front. Immunol. 2017, 8, 1228. [Google Scholar] [CrossRef] [PubMed]
  95. Zhang, Y.; Yu, C. Prognostic characterization of OAS1/OAS2/OAS3/OASL in breast cancer. BMC Cancer 2020, 20, 575. [Google Scholar] [CrossRef]
  96. Ahmadzada, T.; Kao, S.; Reid, G.; Clarke, S.; Grau, G.E.; Hosseini-Beheshti, E. Extracellular vesicles as biomarkers in malignant pleural mesothelioma: A review. Crit. Rev. Oncol. 2020, 150, 102949. [Google Scholar] [CrossRef] [PubMed]
  97. Ahmadzada, T.; Reid, G.; Kao, S. Biomarkers in malignant pleural mesothelioma: Current status and future directions. J. Thorac. Dis. 2018, 10, S1003–S1007. [Google Scholar] [CrossRef] [PubMed]
  98. Le Stang, N.; Burke, L.; Blaizot, G.; Gibbs, A.R.; Lebailly, P.; Clin, B.; Girard, N.; Galateau-Sallé, F.; MESOPATH and EURACAN Networks. Differential Diagnosis of Epithelioid Malignant Mesothelioma With Lung and Breast Pleural Metastasis: A Systematic Review Compared With a Standardized Panel of Antibodies—A New Proposal That May Influence Pathologic Practice. Arch. Pathol. Lab. Med. 2019, 144, 446–456. [Google Scholar] [CrossRef] [PubMed]
  99. Hegmans, J.P.; Bard, M.P.; Hemmes, A.; Luider, T.M.; Kleijmeer, M.J.; Prins, J.B.; Zitvogel, L.; Burgers, S.A.; Hoogsteden, H.C.; Lambrecht, B.N. Proteomic analysis of exosomes secreted by human mesothelioma cells. Am. J. Pathol. 2004, 164, 1807–1815. [Google Scholar] [CrossRef] [PubMed]
  100. Kosari, F.; Disselhorst, M.; Yin, J.; Peikert, T.; Udell, J.; Johnson, S.; Smadbeck, J.; Murphy, S.; McCune, A.; Karagouga, G.; et al. Tumor Junction Burden and Antigen Presentation as Predictors of Survival in Mesothelioma Treated With Immune Checkpoint Inhibitors. J. Thorac. Oncol. 2022, 17, 446–454. [Google Scholar] [CrossRef]
  101. Smolkova, K.; Jezek, P. The Role of Mitochondrial NADPH-Dependent Isocitrate Dehydrogenase in Cancer Cells. Int. J. Cell. Biol. 2012, 2012, 273947. [Google Scholar] [CrossRef] [PubMed]
  102. Todkar, K.; Chikhi, L.; Desjardins, V.; El-Mortada, F.; Pepin, G.; Germain, M. Selective packaging of mitochondrial proteins into extracellular vesicles prevents the release of mitochondrial DAMPs. Nat. Commun. 2021, 12, 1971. [Google Scholar] [CrossRef]
  103. Jin, L.; Gu, W.; Li, X.; Xie, L.; Wang, L.; Chen, Z. PD-L1 and prognosis in patients with malignant pleural mesothelioma: A meta-analysis and bioinformatics study. Adv. Med. Oncol. 2020, 12, 1758835920962362. [Google Scholar] [CrossRef]
  104. Zhang, F.; Gong, W. Prognostic and clinicopathological utility of programmed death-ligand 1 in malignant pleural mesothelioma: A meta-analysis. Int. Immunopharmacol. 2020, 83, 106481. [Google Scholar] [CrossRef] [PubMed]
  105. Kao, S.C.; Cheng, Y.Y.; Williams, M.; Kirschner, M.B.; Madore, J.; Lum, T.; Sarun, K.H.; Linton, A.; McCaughan, B.; Klebe, S.; et al. Tumor Suppressor microRNAs Contribute to the Regulation of PD-L1 Expression in Malignant Pleural Mesothelioma. J. Thorac. Oncol. 2017, 12, 1421–1433. [Google Scholar] [CrossRef] [PubMed]
  106. Ahmadzada, T.; Cooper, W.A.; Holmes, M.; Mahar, A.; Westman, H.; Gill, A.J.; Nordman, I.; Yip, P.Y.; Pal, A.; Zielinski, R.; et al. Retrospective Evaluation of the Use of Pembrolizumab in Malignant Mesothelioma in a Real-World Australian Population. JTO Clin. Res. Rep. 2020, 1, 100075. [Google Scholar] [CrossRef] [PubMed]
  107. Chiarucci, C.; Cannito, S.A.-O.; Daffinà, M.G.; Amato, G.; Giacobini, G.; Cutaia, O.; Lofiego, M.F.; Fazio, C.; Giannarelli, D.; Danielli, R.; et al. Circulating Levels of PD-L1 in Mesothelioma Patients from the NIBIT-MESO-1 Study: Correlation with Survival. Cancers 2020, 12, 361. [Google Scholar] [CrossRef] [PubMed]
  108. Chen, G.; Huang, A.C.; Zhang, W.; Zhang, G.; Wu, M.; Xu, W.; Yu, Z.; Yang, J.; Wang, B.; Sun, H.; et al. Exosomal PD-L1 contributes to immunosuppression and is associated with anti-PD-1 response. Nature 2018, 560, 382–386. [Google Scholar] [CrossRef] [PubMed]
  109. Kim, D.H.; Kim, H.; Choi, Y.J.; Kim, S.Y.; Lee, J.E.; Sung, K.J.; Sung, Y.H.; Pack, C.G.; Jung, M.K.; Han, B.; et al. Exosomal PD-L1 promotes tumor growth through immune escape in non-small cell lung cancer. Exp. Mol. Med. 2019, 51, 1–13. [Google Scholar] [CrossRef]
  110. Fan, Y.; Che, X.; Qu, J.; Hou, K.; Wen, T.; Li, Z.; Li, C.; Wang, S.; Xu, L.; Liu, Y.; et al. Exosomal PD-L1 Retains Immunosuppressive Activity and is Associated with Gastric Cancer Prognosis. Ann. Surg. Oncol. 2019, 26, 3745–3755. [Google Scholar] [CrossRef]
  111. Costa, E.A.-O.; Subramanian, K.A.-O.; Nunnari, J.A.-O.; Weissman, J.A.-O.X. Defining the physiological role of SRP in protein-targeting efficiency and specificity. Science 2018, 359, 689–692. [Google Scholar] [CrossRef]
  112. Chen, X. and J.R. Cubillos-Ruiz, Endoplasmic reticulum stress signals in the tumour and its microenvironment. Nat. Rev. Cancer 2021, 21, 71–88. [Google Scholar] [CrossRef]
  113. Masucci, M.T.; Minopoli, M.; Del Vecchio, S.; Carriero, M.V. The Emerging Role of Neutrophil Extracellular Traps (NETs) in Tumor Progression and Metastasis. Front. Immunol. 2020, 11, 1749. [Google Scholar] [CrossRef]
  114. Solaini, G.; Sgarbi, G.; Baracca, A. Oxidative phosphorylation in cancer cells. Biochim. Et. Biophys. Acta (BBA)-Bioenerg. 2011, 1807, 534–542. [Google Scholar] [CrossRef] [PubMed]
  115. Szatanek, R.; Baran, J.; Siedlar, M.; Baj-Krzyworzeka, M. Isolation of extracellular vesicles: Determining the correct approach (Review). Int. J. Mol. Med. 2015, 36, 11–17. [Google Scholar] [CrossRef] [PubMed]
  116. Miluzio, A.; Oliveto, S.; Pesce, E.; Mutti, L.; Murer, B.; Grosso, S.; Ricciardi, S.; Brina, D.; Biffo, S. Expression and activity of eIF6 trigger malignant pleural mesothelioma growth in vivo. Oncotarget 2015, 6, 37471. [Google Scholar] [CrossRef] [PubMed]
  117. Lee, Y.-J.; Jeong, H.-Y.; Kim, Y.-B.; Lee, Y.-J.; Won, S.Y.; Shim, J.-H.; Cho, M.-K.; Nam, H.-S.; Lee, S.-H. Reactive oxygen species and PI3K/Akt signaling play key roles in the induction of Nrf2-driven heme oxygenase-1 expression in sulforaphane-treated human mesothelioma MSTO-211H cells. Food Chem. Toxicol. 2012, 50, 116–123. [Google Scholar] [CrossRef]
  118. Kay, J.G.; Grinstein, S. Sensing phosphatidylserine in cellular membranes. Sensors 2011, 11, 1744–1755. [Google Scholar] [CrossRef]
  119. Jaiswal, R.; Sedger, L.M. Intercellular Vesicular Transfer by Exosomes, Microparticles and Oncosomes—Implications for Cancer Biology and Treatments. Front. Oncol. 2019, 9, 125. [Google Scholar] [CrossRef]
  120. Dong, L.; Lin, W.; Qi, P.; Xu, M.D.; Wu, X.; Ni, S.; Huang, D.; Weng, W.W.; Tan, C.; Sheng, W.; et al. Circulating Long RNAs in Serum Extracellular Vesicles: Their Characterization and Potential Application as Biomarkers for Diagnosis of Colorectal Cancer. Cancer Epidemiol. Biomark. Prev. 2016, 25, 1158–1166. [Google Scholar] [CrossRef]
  121. Javadi, J.; Gorgens, A.; Vanky, H.; Gupta, D.; Hjerpe, A.; El-Andaloussi, S.; Hagey, D.; Dobra, K. Diagnostic and Prognostic Utility of the Extracellular Vesicles Subpopulations Present in Pleural Effusion. Biomolecules 2021, 11, 1606. [Google Scholar] [CrossRef]
  122. Thery, C.; Witwer, K.W.; Aikawa, E.; Alcaraz, M.J.; Anderson, J.D.; Andriantsitohaina, R.; Antoniou, A.; Arab, T.; Archer, F.; Atkin-Smith, G.K.; et al. Minimal information for studies of extracellular vesicles 2018 (MISEV2018): A position statement of the International Society for Extracellular Vesicles and update of the MISEV2014 guidelines. J. Extracell. Vesicles 2018, 7, 1535750. [Google Scholar] [CrossRef]
  123. Bongiovanni, L.; Andriessen, A.; Wauben, M.H.M.; Nolte-’t Hoen, E.N.M.; de Bruin, A. Extracellular Vesicles: Novel Opportunities to Understand and Detect Neoplastic Diseases. Vet. Pathol. 2021, 58, 453–471. [Google Scholar] [CrossRef]
  124. Carbone, M.; Gazdar, A.; Butel, J.S. SV40 and human mesothelioma. Transl. Lung Cancer Res. 2020, 9, S47–S59. [Google Scholar] [CrossRef] [PubMed]
Figure 1. Mesothelioma cell lines. (A) Cell morphology monitored every 2 h via light microscopy using real time in vitro IncuCyte® zoom imaging system; (B) Percentage of live cells recorded on a Countess live cell counter after the starvation period and just before EVs were isolated. (C) The number of cells in a T75 flask for each cell line after the starvation period and just before EVs were isolated, recorded on a Countess live cell counter. Data for cell viability and cell counts were calculated from an average of three T75 flasks for each cell line just before EV isolation.
Cancers 15 02364 g001
Figure 2. EV isolation, particle size distribution, and particle concentration. (A) Flowchart of the differential centrifugation and ultracentrifugation method used for EV isolation. (B) Size distribution and particle concentration profile of 10 K EV samples as measured using NTA. (C) Size distribution and particle concentration profile of 18 K EV samples as measured using NTA. (D) Size distribution and particle concentration profile of 100 K EV samples as measured using NTA. (E) Comparison of the average size of particles in 10 K, 18 K, and 100 K pellets, as measured using NTA. (F) Particle concentration of 10 K, 18 K, and 100 K according to size clusters, showing the dominant EV type in each size range, as measured using NTA. (G) Transmission electron microscopy showing cup-shaped EV morphology for large and small EVs. * p ≤ 0.05, ** p ≤ 0.01.
Cancers 15 02364 g002
Figure 3. Characterization of EV types. Flow cytometry showing number of gated, phosphatidyl-serine-positive events in (A,C) 18 K pellets and (B,D) 10 K EV pellets. (E) Western blot with indicated antibodies, showing CK18 and HSPA5 in the 10 K pellets, and (F) CD81, CD9, and ALIX in the 100 K pellets. GAPDH was loaded as a control. Original blot see Supplementary File S1.
Cancers 15 02364 g003aCancers 15 02364 g003b
Figure 4. Proteome of EVs. (A) Venn diagram showing the overlap between the number of proteins that are enriched in the EVs from this study, with those in the Exocarta and Vesiclepedia databases (ExoCarta Version 5, Release date: 29 July 2015; Vesiclepedia Version 4.1, Release date: 15 August 2018). (B) Venn diagram showing the overlap between the number of proteins that are enriched in each of the EV subtypes from this study. (C) The number of proteins identified in each of the EV subtypes from each cell line. Data derived from four biological replicates.
Cancers 15 02364 g004
Figure 5. (A) UMAP plots showing a very clear separation between the EV subtypes across all cell lines. For each cell line, at least two biological replicates were included and within each biological replicate, two technical replicates were included. (B) UMAP plots according to the histological subtype of pleural mesothelioma. B: Biological replication; T: Technical replicate.
Cancers 15 02364 g005aCancers 15 02364 g005b
Figure 6. Heatmap representing the differential abundance based on normal spectral count (SpC). (A) Heatmap of differentially expressed proteins across all samples, including their biological and technical replicates, showing similarities and differences between each of the EVs derived from pleural mesothelioma cell lines. (B) Heatmap focusing on the differential expression of common EV markers across each of the EV subtypes derived from pleural mesothelioma cell lines. Data obtained from four biological replicates. Protein abundance values represent the sum of all unique peptides for a specific protein.
Cancers 15 02364 g006
Figure 7. Focused heatmap showing the top overexpressed and underexpressed proteins present in the (A) 10 K EV (B) 18 K EV, and (C) 100 K EV subtypes across all pleural mesothelioma cell lines. Data obtained from four biological replicates.
Cancers 15 02364 g007
Figure 8. Subcellular location and biological processes of the total identified proteins of each EV subtype derived from mesothelioma cell lines. Top 10 biological processes and enriched cellular components associated with EVs derived from mesothelioma cell lines versus control for (A) 10 K EVs, (B) 18 K EVs, and (C) 100 K EVs. (D) Venn diagram showing biological processes and cellular components that are common and unique to each EV pellet from mesothelioma cell lines versus the corresponding control EV pellets. Data obtained from four biological replicates.
Cancers 15 02364 g008aCancers 15 02364 g008b
Figure 9. IPA analysis showing the activation or inhibition levels of cancer-related molecular pathways in (A) 10 K, (B) 18 K, and (C) 100 K pellets, and the biological functions in (D) 10 K, (E) 18 K, and (F) 100 K pellets compared to the corresponding MeT-5A control. Data derived from four biological replicates.
Cancers 15 02364 g009
Figure 10. Venn diagram showing cancer-specific proteins identified in this study for each subtype of EVs derived from pleural mesothelioma cell lines. Data derived from four biological replicates.
Cancers 15 02364 g010
Figure 11. Western blot analysis showing (A) the presence of mesothelin in the 10 K and 100 K EVs of mesothelioma cell lines, (B) presence of mesothelin in the 18 K EVs of mesothelioma cell lines, and (C) presence of PD-L1 in the 10 K EVs of mesothelioma cell lines. Original blot see Supplementary File S1.
Cancers 15 02364 g011
Table 1. List of cell lines used in this study.
Cell LineHistological SubtypeSource
MeT-5AImmortalized human mesothelial cell lineATCC, Rockville
H28EpithelioidATCC, Rockville
VMC23EpithelioidMedical University of Vienna, Austria
H226EpithelioidATCC, Rockville
MM05Biphasic (non-epithelioid)The Prince Charles Hospital, Brisbane
MSTO-211HBiphasic (non-epithelioid)ATCC, Rockville
ATCC: American Type Culture Collection (Manassas, VA, USA).
Table 2. List of primary antibodies used in this study.
Primary AntibodyCloneSourceDilution
Anti-CD9D3H4P Rabbit mAbCell Signaling Technology1:1000
Anti-CD81D3N2D Rabbit mAbCell Signaling Technology1:1000
Anti-TSG1015B7 Mouse mAbMerck 1:1000
Anti-ALIX3A9 Mouse mAbCell Signaling Technology1:1000
Anti-mitofilinEPR8749 Rabbit mAbAbcam1:1000
Anti-alpha-Actinin 4D7U5A) Rabbit mAbCell Signaling Technology1:1000
Anti- Cytokeratin 18DA-7 Mouse mAbBiolegend1:1000
Anti-BiP (HSPA5)C50B12 Rabbit mAbCell Signaling Technology1:1000
Anti-MesothelinD9R5G XP(R) Rabbit mAbCell Signaling Technology1:1000
Anti-PD-L1E1L3N(R) XP(R) Rabbit mAbCell Signaling Technology1:1000
Anti-BIN114647-1-A Rabbit pAbProteintech Group1:1000
Anti-GAPDHD16H11) XP(R) Rabbit mAbCell Signaling Technology1:1000
Table 3. Biological processes and cellular processes common to all EV pellets across all mesothelioma cell lines.
Biological ProcessesCellular Components
Cell-substrate adhesionLysosomal lumen
Neutrophil degranulationAzurophil granule
Antigen processing and presentationCell-substrate junction
Nuclear transportCollagen-containing extracellular matrix
Neutrophil activationEndoplasmic reticulum lumen
Neutrophil activation involved in immune responseFocal adhesion
Neutrophil-mediated immunityLamellipodium
Regulation of translationPrimary lysosome
Regulation of cellular amide metabolic processSpliceosomal complex
Nucleocytoplasmic transportVacuolar lumen
Golgi vesicle transport
Table 4. Biological processes exclusive to each EV pellet.
10 K18 K100 K
Regulation of mRNA metabolic processRegulation of cellular amino acid metabolic processViral gene expression
Regulation of gene silencingWnt signaling pathway, planar cell polarity pathwayProtein targeting to membrane
ATP metabolic processCell growthViral transcription
Regulation of mRNA processingRegulation of transcription from RNA polymerase II promoter in response to hypoxiaEstablishment of protein localization to membrane
Regulation of gene silencing by miRNARegulation of establishment of planar polarityProtein targeting
Regulation of posttranscriptional gene silencingBiological process involved in interaction with hostRibonucleoprotein complex biogenesis
Regulation of gene silencing by RNAAntigen processing and presentation of exogenous peptide antigen via MHC class IPlatelet degranulation
mRNA export from nucleusMorphogenesis of a polarized epitheliumNegative regulation of endopeptidase activity
mRNA-containing ribonucleoprotein complex export from nucleusEstablishment of planar polaritySmall molecule catabolic process
Nuclear exportEstablishment of tissue polarityNucleotide-excision repair, DNA damage recognition
Energy derivation by oxidation of organic compoundsAntigen processing and presentation of exogenous peptide antigen via MHC class I, TAP-dependentHomotypic cell–cell adhesion
Cellular respirationNon-canonical Wnt signaling pathwayTransmembrane receptor protein serine/threonine kinase signaling pathway
RNA 3’-end processingCellular response to oxygen levelsMulti-multicellular organism process
Regulation of mRNA stabilityInterleukin-1-mediated signaling pathwayRegulation of actin filament-based process
Regulation of RNA stabilityRegulation of cellular amine metabolic processLung development
Electron transport chainResponse to oxygen levelsRespiratory tube development
Purine-containing compound metabolic processCellular response to decreased oxygen levelsRespiratory system development
Regulation of mRNA catabolic processCellular response to hypoxiaNegative regulation of hydrolase activity
Purine nucleotide metabolic processResponse to hypoxiaNucleobase biosynthetic process
Ribose phosphate metabolic processMovement in host environmentPositive regulation of cell morphogenesis involved in differentiation
Respiratory electron transport chainResponse to decreased oxygen levelsTRNA metabolic process
Nucleoside monophosphate metabolic processCellular response to interleukin-1Nucleotide-sugar biosynthetic process
Post-Golgi vesicle-mediated transportRegulation of DNA-templated transcription in response to stress
Endomembrane system organizationHematopoietic stem cell differentiation
Exonucleolytic catabolism of deadenylated mRNAT cell receptor signaling pathway
Response to heatActivation of innate immune response
Ribonucleotide metabolic processSCF-dependent proteasomal ubiquitin-dependent protein catabolic process
Transport of virusResponse to interleukin-1
Multi-organism localizationAmine metabolic process
Multi-organism transportPositive regulation of neurogenesis
Nucleoside phosphate biosynthetic processRegulation of transcription from RNA polymerase II promoter in response to stress
Nuclear-transcribed mRNA catabolic process, exonucleolyticPositive regulation of cell growth
Protein-DNA complex subunit organizationNegative regulation of G2/M transition of mitotic cell cycle
Nucleotide biosynthetic processStimulatory C-type lectin receptor signaling pathway
Endosomal transportRegulation of protein-containing complex assembly
Purine ribonucleotide metabolic processRegulation of cell development
Response to temperature stimulusAlpha-amino acid metabolic process
DNA conformation changeGlycoside metabolic process
Chromatin assembly or disassemblyInnate immune response activating cell surface receptor signaling pathway
Mitochondrial electron transport, NADH to ubiquinoneNegative regulation of cell cycle G2/M phase transition
Regulation of cellular response to heatRegulation of animal organ morphogenesis
Megakaryocyte differentiationPositive regulation of nervous system development
Intracellular transport of virusCellular ketone metabolic process
Mitotic nuclear divisionNegative regulation of Wnt signaling pathway
Nucleoside monophosphate biosynthetic processRegulation of G2/M transition of mitotic cell cycle
DNA packagingEntry into host
Regulation of intracellular transportPositive regulation of innate immune response
Ribonucleoside monophosphate metabolic processSulfur compound biosynthetic process
Protein localization to mitochondrionRegulation of cell cycle G2/M phase transition
Nucleotide-excision repairVesicle budding from membrane
Protein localization to cell peripheryPositive regulation of growth
Cellular response to heatG2/M transition of mitotic cell cycle
Cellular metabolic compound salvageProteasome-mediated ubiquitin-dependent protein catabolic process
Carbohydrate catabolic processAlpha-amino acid biosynthetic process
Mitotic spindle organizationCell cycle G2/M phase transition
Exocytic processAdherens junction organization
Purine nucleoside monophosphate metabolic processNegative regulation of supramolecular fiber organization
Protein peptidyl-prolyl isomerizationPositive regulation of defense response
Peptidyl-proline modificationRegulation of neurogenesis
Regulation of nucleocytoplasmic transportRegulation of chemotaxis
Response to peptide hormoneAspartate family amino acid metabolic process
Ribonucleoside diphosphate metabolic processProteasomal protein catabolic process
Purine ribonucleoside monophosphate metabolic processAxonogenesis
Protein localization to plasma membraneCellular amino acid biosynthetic process
Purine nucleoside diphosphate metabolic processNucleic acid transport
Purine ribonucleoside diphosphate metabolic processRNA transport
Carbohydrate derivative catabolic processEstablishment of RNA localization
Nucleoside diphosphate metabolic processPositive regulation of axonogenesis
Nucleotide phosphorylationGland morphogenesis
Modulation by virus of host processRegulation of cell-substrate adhesion
Regulation of biological process involved in symbiotic interactionRNA localization
ADP metabolic processNegative regulation of ubiquitin-dependent protein catabolic process
Organelle fissionL-serine metabolic process
Regulation of viral processRegulation of RNA binding
Regulation of DNA metabolic processPositive regulation of translation
Regulation of nervous system development
COPII-coated vesicle budding
Positive regulation of cellular amide metabolic process
Serine family amino acid biosynthetic process
Serine family amino acid metabolic process
Nucleobase-containing compound transport
Regulation of substrate adhesion-dependent cell spreading
Table 5. Cellular components unique to each EV type derived from mesothelioma cell lines.
10 K18 K100 K
Cytoplasmic exosome (RNase complex)Adherens junctionChromosome, telomeric region
Exoribonuclease complexCoated membraneCytosolic large ribosomal subunit
Exosome (RNase complex)Coated vesicleFicolin-1-rich granule membrane
FilopodiumCoated vesicle membraneLamellipodium membrane
Host cellEndopeptidase complexLarge ribosomal subunit
Host cellular componentEukaryotic 48S preinitiation complexPlatelet alpha granule
Inner mitochondrial membrane protein complexGolgi-associated vesiclePlatelet alpha granule lumen
Microtubule associated complexMembrane coatPrecatalytic spliceosome
MidbodyPeptidase complexRibosome
Mitochondrial inner membranePolysomeSmall nuclear ribonucleoprotein complex
Mitochondrial matrixProteasome accessory complexSpliceosomal snRNP complex
Mitochondrial protein-containing complexProteasome complexU2-type precatalytic spliceosome
Mitochondrial respirasomeProteasome regulatory particleU2-type spliceosomal complex
Mitochondrial respiratory chain complex I
Myosin II complex
NADH dehydrogenase complex
Nuclear chromosome
Nuclear exosome (RNase complex)
Nuclear pore
Oxidoreductase complex
Phagocytic vesicle
Protein-DNA complex
Respirasome
Respiratory chain complex
Respiratory chain complex I
Secretory granule membrane
Spindle
Spindle pole
Vacuolar membrane
Z disc
Table 6. Details of proteins that are present in all the EV pellets from all five mesothelioma cell lines and absent in all of the EV pellets from the control cell line (MeT-5A).
GeneProtein NameFunction
AXLTyrosine-protein kinase receptorAssociated with tumor cell growth, metastasis, invasion, epithelial-mesenchymal transition, angiogenesis, drug resistance, immune regulation, and stem cell maintenance [31].
CALRCalreticulinFound in the endoplasmic reticulum and helps in correct protein folding [32].
CARS1Cysteinyl-tRNA synthetase 1Plays an important role in protein synthesis [33] and inhibits non-apoptotic cell death [34].
CEP57Centrosomal protein of 57Involved in intracellular transport processes and found to be overexpressed in prostate cancer [35].
COL1A2Collagen alpha-2(I) chainFound to be downregulated in melanoma and bladder cancer. May have prognostic biomarker value in hypopharyngeal squamous cell carcinoma [36].
CSF1Macrophage colony-stimulating factor 1A critical growth factor for macrophage development. Associated with poor survival in various tumor types [37].
CTNNA1Catenin alpha-1Involved in cell–cell adhesion and nuclear signaling [38].
CTNNB1Catenin beta-1
DDB2DNA damage-binding protein 2Plays a key role in mediating apoptosis following DNA damage [39].
DDX6Probable ATP-dependent RNA helicase DDX6Involved in most cellular processes that require manipulation of RNA structure. Implicated in cellular proliferation and neoplastic transformation [40].
EGFREpidermal growth factor receptorInvolved in cell signaling pathways that control cell division and survival. Often over-expressed in human carcinomas [41].
EIF3DEukaryotic translation initiation factor 3 subunit DKnown to regulate the growth of several types of human cancer cells. Associated with different pathological conditions, including cancer [42].
ELAC2Zinc phosphodiesterase ELAC protein 2Prostate cancer susceptibility gene [43].
EPHA2Ephrin type-A receptor 2A class of receptor tyrosine kinases that is highly produced in tumor tissues, while found at relatively low levels in most normal adult tissues [44].
EXT1Exostosin-1EXT1 is a key regulator of endoplasmic reticulum morphology and dynamics [45].
EXT1 and EXT2 reported as target antigens in secondary (autoimmune) membranous nephropathy [46].
EXT2Exostosin-2
FBLN1Fibulin-1A fibrinogen-binding blood protein and a component of many extracellular matrices including those of blood vessels [47].
FHFumarate hydratase, mitochondrialAn enzyme found in both the cytoplasm and mitochondria can function as a tumor suppressor [48].
FLNCFilamin-CA member of the actin binding protein family, which is expressed in the cardiac and skeletal muscles [49].
FUSRNA-binding protein FUSA nucleoprotein that functions in DNA and RNA metabolism, including DNA repair, and the regulation of transcription, RNA splicing, and export to the cytoplasm [50].
GPNMBTransmembrane glycoprotein NMBAssociated with cancer progression and metastasis [51].
GSDMEGasdermin-EActs as a tumor suppressor in melanoma, breast cancer, and colorectal cancer [52].
H3-3AHistone H3.3Expressed throughout the cell cycle, as well as in quiescent cells. Recently found to be mutated at high frequency in several specific cancer types including pediatric high-grade glioblastoma, chondroblastoma, and giant cell tumors of the bone [53].
HABP2Hyaluronan-binding protein 2Upregulated in non-small cell lung cancer [54].
IDH1Isocitrate dehydrogenaseAn essential enzyme for cellular respiration. Mutations in IDH1 are prevalent in several cancers including glioma, acute myeloid leukemia, cholangiocarcinoma, and chondrosarcoma [55].
IGHG1Immunoglobulin heavy constant gamma 1Associated with immune evasion mechanisms in pancreatic cancer [56] and prostate cancer [57,58].
KITMast/stem cell growth factor receptorA member of the tyrosine kinase family of growth factor receptors that is deregulated in diseases including cancer [59].
MCM4DNA replication licensing factor Licensing proteins are inappropriately expressed at an early stage of tumorigenesis [60].
METHepatocyte growth factor receptorHGF/Met signaling contributes to oncogenesis and tumor progression in several cancers and promotes aggressive cellular invasiveness [61].
MINPP1Multiple inositol polyphosphate phosphatase 1Play key signaling roles in diverse cellular functions, including calcium homeostasis, cell survival, and death [62].
MSLNMesothelin (CAK1 antigen)An established biomarker that is overexpressed in pleural mesothelioma [63].
MTAPS-methyl-5’-thioadenosine phosphorylaseDeficiency supports melanoma development and progression. Many tumors lack expression of MTAP [64].
MTHFD1C-1-tetrahydrofolate synthase, cytoplasmicAn enzyme in the cytoplasm that has been associated with increased risk for a number of folate-related pathologies, including cancer, although a clear link has not been established [65].
NRASGTPase NRasDetected in various cancer cell line EVs and in urine EVs. Associated with cetuximab- and panitumumab-targeted cancer therapies [14].
NRG1Pro-neuregulin-1, membrane-bound isoformA member of the epidermal growth factor family of receptor tyrosine kinase protein ligands and involved in the activation of proliferation, survival, and differentiation of cells in many tissue types [14].
PDGFRBPlatelet-derived growth factor receptor betaBelongs to the receptor tyrosine kinase family of proteins. Platelet-derived growth factor signaling has associated with cancer [66].
PRKAR1AcAMP-dependent protein kinase type I-alpha regulatory subunitFound to be up-regulated in a series of cell lines and human neoplasms, suggesting involvement in tumorigenesis [67].
QDPRDihydropteridine reductaseRelated to oxidative stress and associated with activation of mTOR signaling pathway [68].
RRAS2Ras-related protein R-Ras2Part of the R-Ras GTPase subfamily that is involved in cell signaling and in which mutations have been found to be oncogenic drivers in many cancers [69].
SAA1Serum amyloid A-1 proteinA multifunctional protein that has been reported to upregulate the expression of various inflammatory mediators such as cell adhesion molecules, cytokines, chemokines, matrix-degrading proteases, reactive oxygen species and pro-angiogenic molecules in several cell types including leukocytes, fibroblasts, and endothelial cells [70].
SDHASuccinate dehydrogenaseAn enzyme complex found to be a predisposing factor in hereditary cancers [71]. It is the only enzyme that participates in both the citric acid cycle and the electron transport chain [72].
SEC23BProtein transport proteinPromotes the survival of cancer cells [73].
SEC31AProtein transport protein
TERTTelomerase reverse transcriptase Plays a major role in the replication and self-renewal of cancer [74].
TNFRSF10BTumor necrosis factor receptorWidely accepted as a tumor-suppressive cytokine via its ubiquitous receptor TNF receptor 1. Expressed on some tumor cells but also on suppressive immune cells, including regulatory T cells and myeloid-derived suppressor cells [75].
TPRNucleoprotein TPRImplicated in a variety of nuclear functions, including nuclear transport, chromatin organization, regulation of transcription, and mitosis. More recently, Tpr function has been linked to events including p53 signaling [76].
Note: Proteins filtered based on mascot score >10, unique peptides, high abundance or peak found in all biological and technical replicates, and high FDR protein confidence (99%).
Table 7. Details of proteins that have been reported in other cancers and that were exclusively found in the 10 K pellets of all five mesothelioma cell lines while being absent in the control cell line.
GeneProtein NameDescription and Reports in Cancer
AURKBAurora kinase BDominant-negative effect on cytokinesis. Overexpression found in lung cancer, leukemia, and prostate cancer.
EPHB2Ephrin type-B receptor 2May be involved in disease pathogenesis. EPHB2 mutations have been found in a prostate cancer cell line derived from a brain metastasis. Also found in bleeding disorders, platelet-type, characterized by increased bleeding tendency due to platelet dysfunction.
ERCC4DNA repair endonuclease XPFAssociated with hypersensitivity to DNA-damaging agents, chromosomal instability (increased chromosome breakage), and defective DNA repair.
FASFas cell surface death receptorA death receptor and a member of the tumor necrosis factor-receptor superfamily (CD antigen CD95). Fas ligand plays a key role in apoptotic signaling pathways. Mutations can prevent the immune system from attacking tumor cells.
HRASGTPase HRasInvolved in regulating cell division. Mutations in HRAS are implicated in a variety of human tumors such as thyroid cancer and bladder cancer.
KCTD7Potassium channel tetramerization domain containing 7Protein coding gene with features of a tumor suppressor. Found in brain cancer.
MAD1L1Mitotic spindle assembly checkpoint protein MAD1A checkpoint gene, where its dysfunction is associated with chromosomal instability. Mutations in MAD1L1 reported in colon and lung cancers.
MSH2DNA mismatch repair protein Msh2Tumor suppressing gene involved in DNA repair. Found in hereditary non-polyposis colorectal cancer 1, Muir-Torre syndrome, Endometrial cancer, Mismatch repair cancer syndrome 2, Colorectal cancer.
MT-ATP8ATP synthase protein 8Protein coding gene. Mutations found in breast, ovarian, cervical, and thyroid cancers.
NDUFA13NADH:ubiquinone oxidoreductase subunit A13Protein coding gene. Can function as a tumor suppressor. Found in hurthle cell thyroid carcinoma.
PALLDPalladin (Sarcoma antigen NY-SAR-77)A component of actin-containing microfilaments that control cell shape, adhesion, and contraction. Found in pancreatic cancer 1.
PTK2Focal adhesion kinase 1 (FADK 1)Aberrant PTK2/FAK1 expression may play a role in cancer cell proliferation, migration, and invasion, in tumor formation and metastasis. PTK2/FAK1 overexpression is seen in breast, ovarian, colorectal, and lung cancers.
RHBDF2Inactive rhomboid protein 2A protein coding gene. Found in esophageal cancer.
RYR1Ryanodine receptor 1A major gatekeeper of the calcium channel in skeletal muscle. Found in malignant hyperthermia 1.
SRGAP1SLIT-ROBO Rho GTPase-activating protein 1A protein coding gene. Found in thyroid cancer.
TCF7L2Transcription factor 7-like 2A transcription factor in the Wnt-signaling pathway. Found in colorectal cancer.
WNT10AProtein Wnt-10aPart of a large family of WNT genes, which are protein coding genes involved in Wnt signaling that regulate the interactions between cells during embryonic development. Found in colorectal cancer.
Table 8. Details of proteins that have been reported in other cancers and that were exclusively found in the 18 K pellets of all five mesothelioma cell lines while being absent in the control cell line.
GeneProtein NameDescription and Reports in Cancer
EHBP1EH domain-binding protein 1A protein coding gene associated with endocytic trafficking. Found in prostate cancer.
LIFRLeukemia inhibitory factor receptorMediates the action of the leukemia inhibitory factor that is involved in cellular differentiation, proliferation, and survival in the adult and the embryo. Found in epithelial tumors of the salivary gland.
Table 9. Details of proteins that have been reported in other cancers and that were exclusively found in the 100 K pellets of all five mesothelioma cell lines while being absent in the control cell line.
GeneProtein NameDescription and Reports in Cancer
DPOD1DNA polymerase delta catalytic subunitFound in colorectal cancer.
UHRF2E3 ubiquitin-protein ligase UHRF2DNA copy number loss is found in multiple kinds of malignancies including brain, breast, stomach, kidney, hematopoietic tissue, and lung cancers.
FANCJFanconi anemia group J proteinAssociated with hypersensitivity to DNA-damaging agents, chromosomal instability (increased chromosome breakage), and defective DNA repair. Found in breast cancer.
NSD1Nuclear receptor binding SET domain protein 1The NSD1 enzyme controls the activity of genes involved in normal growth and development. Found in childhood acute myeloid leukemia, neuroblastoma, and glioma.
NOTCH3Notch receptor 3Plays a key role in the function and survival of vascular smooth muscle cells, and for the maintenance of blood vessels, including those that supply blood to the brain. Found to have oncogenic and tumor suppressive roles in various cancers, including breast, colorectal, lung, prostate, and ovarian cancers. Also found in myofibromatosis, infantile 2.
STK10Serine/threonine-protein kinase 10Functions as a tumor suppressor. Dysfunction of STK10 activity can promote anti-apoptotic effects, contributing to carcinogenesis. Found in peripheral T-cell lymphoma and testicular germ cell tumor.
SAMD9Sterile alpha motif domain-containing protein 9Play a role in regulating cell proliferation and apoptosis. Mutations can suppress cell cycle. Reported in tumoral calcinosis and acute myelogenous leukemia.
JAK2Janus kinase 2Plays a central role in cytokine and growth factor signaling. Growth factors like TGF-beta 1 induce phosphorylation and activation of this kinase to the nucleus, where they influence gene transcription. This gene is a downstream target of the pleiotropic cytokine IL6 that is produced by B cells, T cells, dendritic cells, and macrophages to produce an immune response or inflammation. Dysregulation of the IL6/JAK2/STAT3 signaling pathways produces increased cellular proliferation and neoplasms of hematopoietic stem cells. Reported in leukemia.
Table 10. Expression of biomarkers known to have biomarker potential in pleural mesothelioma.
Protein NameGeneH28VMC23H226MM05MSTO
10 K18 K100 K10 K18 K100 K10 K18 K100 K10 K18 K100 K10 K18 K100 K
Mesothelin *MSLN +++++++++
Programmed cell death 1 ligand 2 (PD-L2)PDCD1LG2 + +
Bridging Integrator 1BIN1 - -+ - - -
OsteopontinSPP1+++ + + +
Fibulin-3EFEMP1-----
High mobility group protein B1HMGB1 - ---- -
Calretinin *CALB2 +++
Calreticulin *CALR
Vascular endothelial growth factor AVEGFA+++ +
Cyclin-dependent kinase inhibitor 2ACDKN2A- - - - -
Lysyl oxidase homologs 1LOXL1 ++++++++++++
Thrombospondin-2THBS2-- + + + +
Cadherin-11CDH11+ ++++++ +
Desmin DESM +
GLUT-1SLC2A1 + - ++ +
Cellular tumor antigen p53TP53- - - - -
E3 ubiquitin-protein ligase XIAPXIAP
Neural cell adhesion molecule 1NCAM -
Tumor necrosis factor alpha-induced protein 2 *TNFAIP2 +
Tumor necrosis factor receptor superfamily member 11B *TNFRSF11B +++
Tumor necrosis factor receptor superfamily member 6 *FAS + +
Vesicle transport protein GOT1B *GOLT1B +
Galectin-1 *LGALS1
Superoxide dismutase 1 *SOD1 -
Superoxide dismutase 2 *SOD2--
Signal transducer and activator of transcription 1-alpha/beta *STAT1 + + + -
Signal transducer and activator of transcription *STAT3 ++++++
Translationally controlled tumor protein *TPT1
Vimentin *VIM
* Mesothelioma-associated protein cargo also found in exosomes by Greening et al. 2016 [90]. Note: ‘+’ indicates overexpression of protein relative to the corresponding EV type of the control cell line, MeT-5A; ‘-‘ indicates downregulation of protein relative to the corresponding EV type of the control cell line, MeT-5A. Data are based on the log-fold change. • denotes high abundance found in samples without differential expression analysis.
Disclaimer/Publisher’s Note: The statements, opinions and data contained in all publications are solely those of the individual author(s) and contributor(s) and not of MDPI and/or the editor(s). MDPI and/or the editor(s) disclaim responsibility for any injury to people or property resulting from any ideas, methods, instructions or products referred to in the content.

